Consensus is a tightening cycle that climaxes on May3 with one final 25 basis point hike. Most traders price three cuts after—one in July, November, and December.
Note: After the release of strong bank earnings today, this analysis remains intact.
Graphic: Retrieved from CME Group Inc (NASDAQ: CME).
Though policymakers are successful in walking up traders’ interest rate expectations, the long end of the yield curve hasn’t budged much; despite the response to banking turmoil helping “calm conditions, … and lessen the near-term risks,” many believe the Fed will have to pivot, soon.
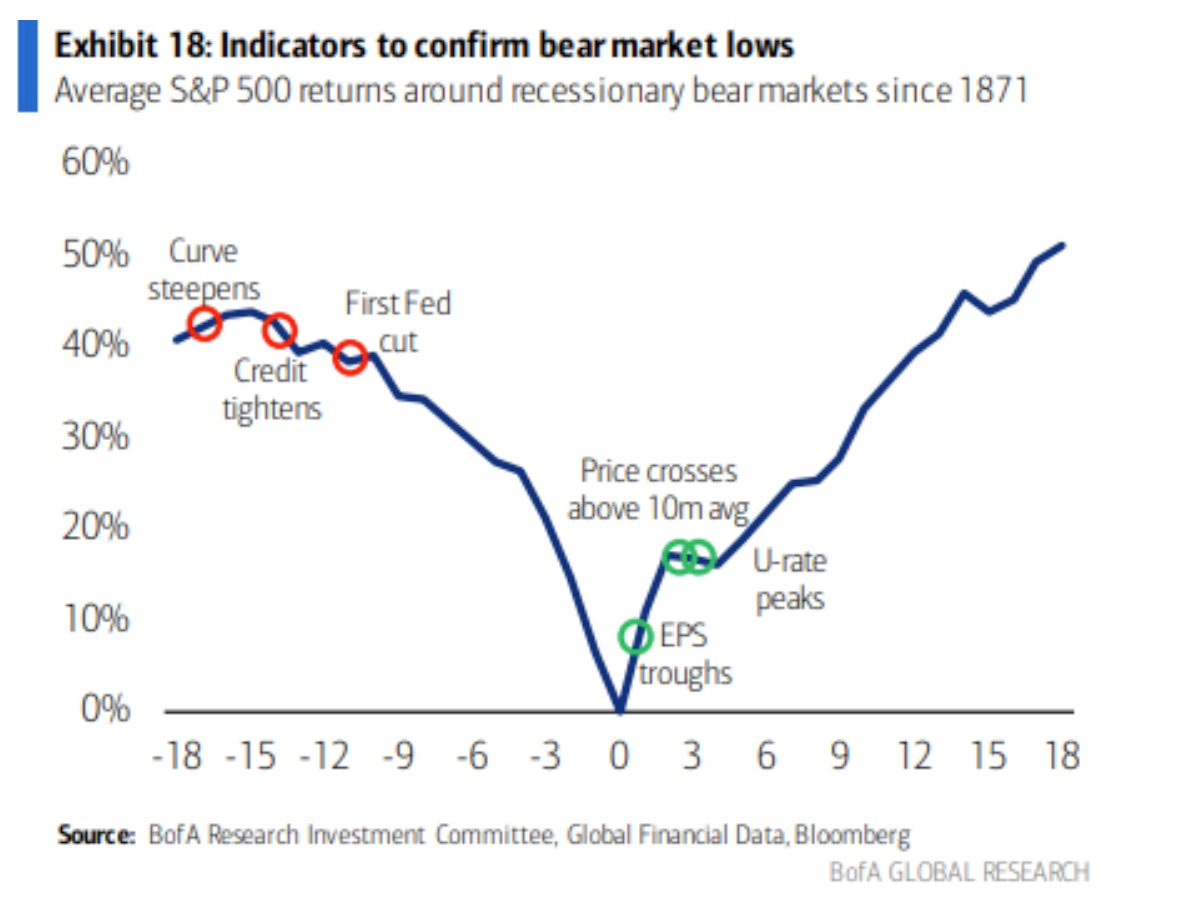
The Federal Reserve’s ranks expect a “mild recession,” too, validating people such as Bank of America Corporation’s (NYSE: BAC) Michael Hartnett, who said investors should steer clear of stocks. Hartnett added the expectations of a recession would solidify following the upcoming earnings season, a test of how companies have managed headwinds like the bank crisis and slowing demand.
Graphic: Retrieved from Bank of America Corporation (NYSE: BAC).
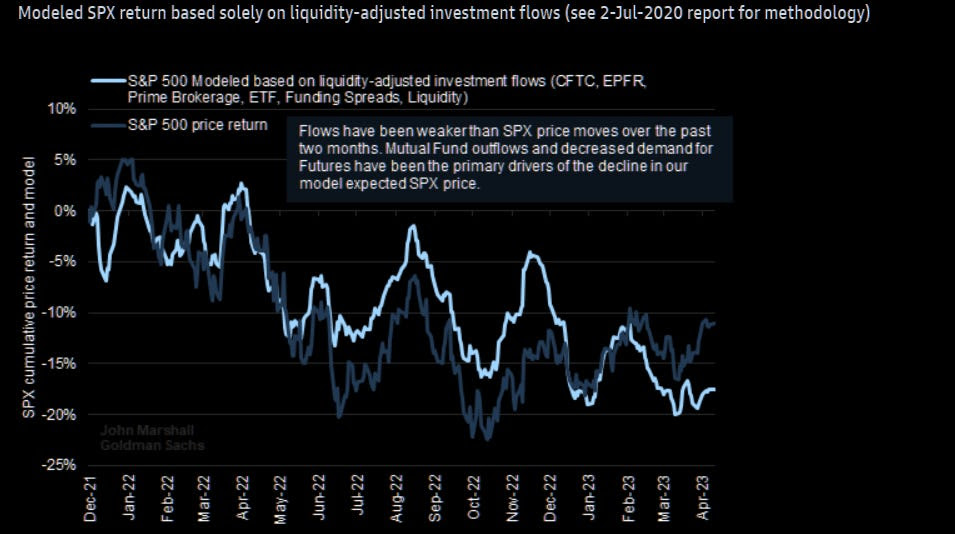
Despite billions in redemptions over the past week or so, the market’sstrengthcan continue for longer, though. Here’s why.
Graphic: Retrieved from Goldman Sachs Group Inc (NYSE: GS) via The Market Ear.
Contextually, positioning overwhelmingly supports the market at this juncture. That’s per the likes of Cem Karsan of Kai Volatility have explained.
Falling volatility has led to billions more in buying flows from volatility-controlled funds rebalancing their risk exposures, Tier1Alpha adds, noting “there is a chance realized volatility [or RVOL] will continue to decrease until the end of next week as long as the SPX returns stay muted. If volatility rises beyond the +/- 2% threshold, net equity sales could exceed $5 billion.”
“This is not expected due to favorable CPI data and dealer positioning,” however.
With markets likely to be contained in the short to medium term, and fundamental weaknesses, such as the Fed hiking long-end yields, likely to cause them to fail in the long run—play near- or medium-term strength via call spread structures, and use the profits to lower the cost of longer-dated bets on markets or rates falling.
In support of this view, per The Market Ear’s summary of some Goldman Sachs Group Inc (NYSE: GS) analyses, “the disconnect between Nasdaq 100 (INDEX: NDX) and bond yields has grown to statistically significant levels.” Thus, “owning downside asymmetry” is starting to look “more attractive.”
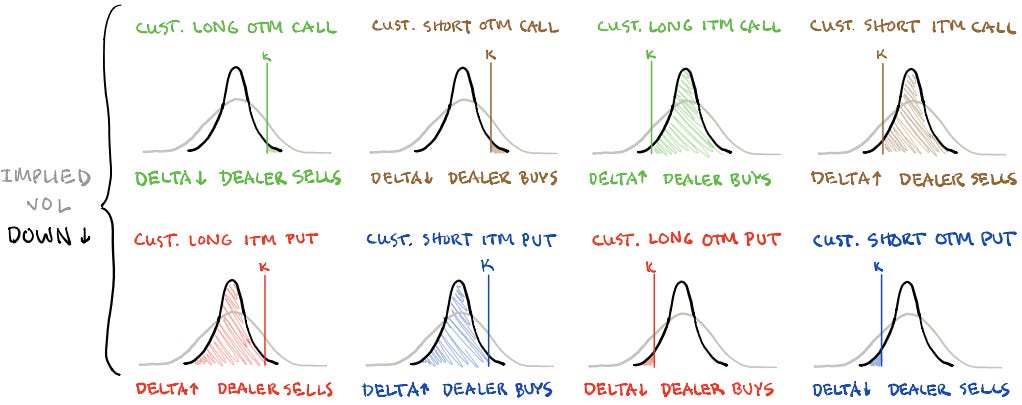
Graphic: Retrieved from VIX Central. The compression of implied volatility, or IVOL, is a booster for equities. Investors are mostly bullish with a +1 Put, +100 Stock, -1 Call position, while dealers hold the opposite with a -1 Put, -100 Stock, +1 Call position. As the volatility trends lower (e.g., S&P 500 realized volatility or RVOL is ~10), options lose value, and dealers must buy back their short stock to re-hedge. This supports the market.
About
Welcome to the Daily Brief by Physik Invest, a soon-to-launch research, consulting, trading, and asset management solutions provider. Learn about our origin story here, and consider subscribing for daily updates on the critical contexts that could lend to future market movement.
Separately, please don’t use this free letter as advice; all content is for informational purposes, and derivatives carry a substantial risk of loss. At this time, Capelj and Physik Invest, non-professional advisors, will never solicit others for capital or collect fees and disbursements. Separately, you may view this letter’s content calendar at this link.
Physik Invest’s Daily Brief is read free by thousands of subscribers. Join this community to learn about the fundamental and technical drivers of markets.
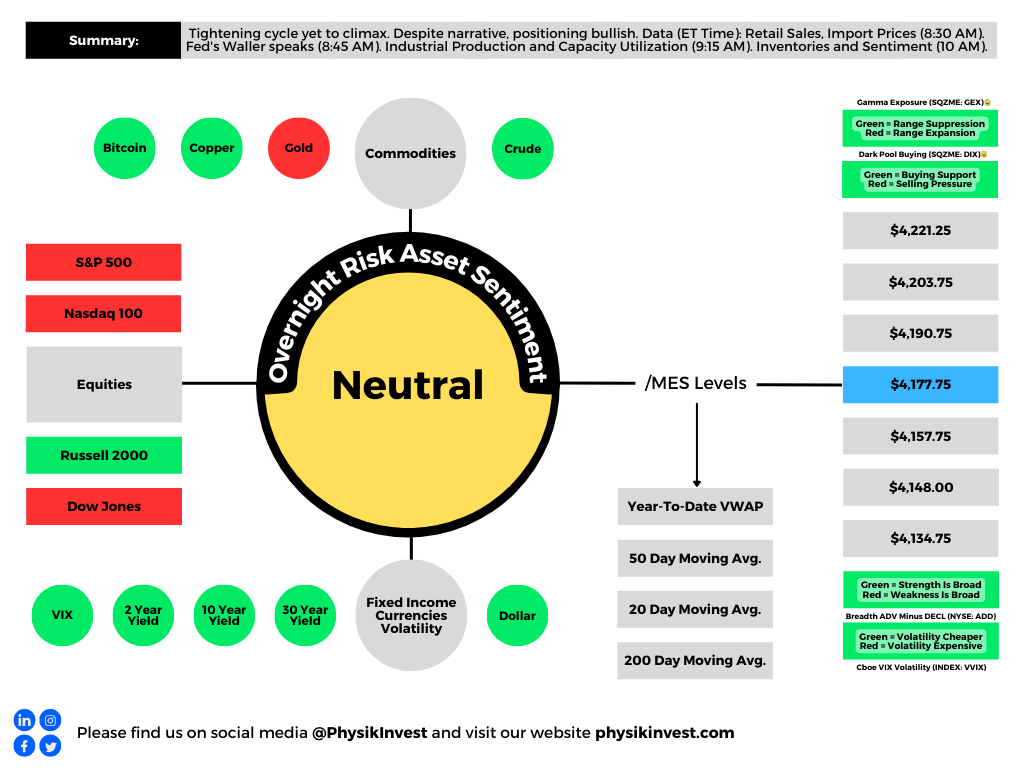
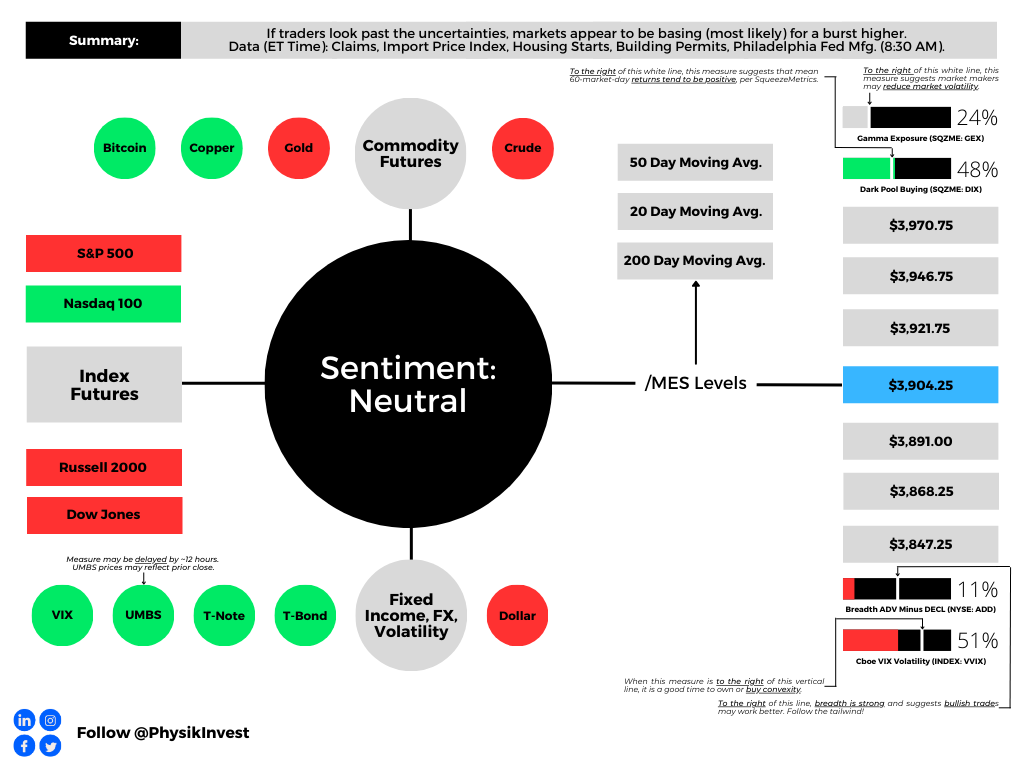
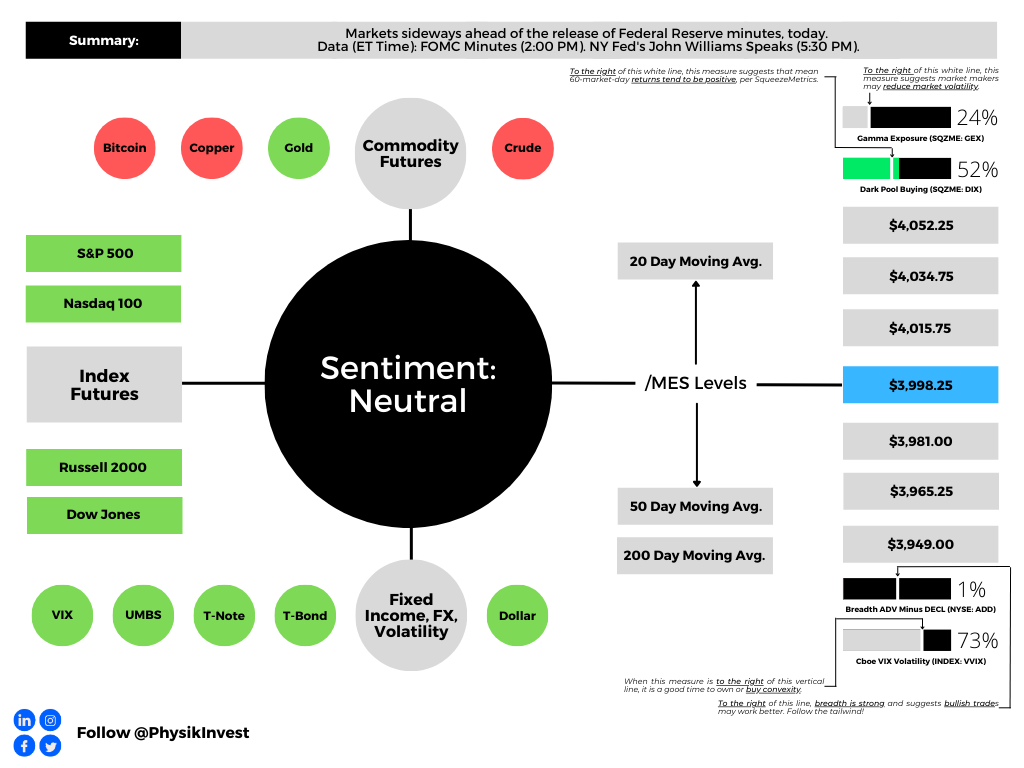
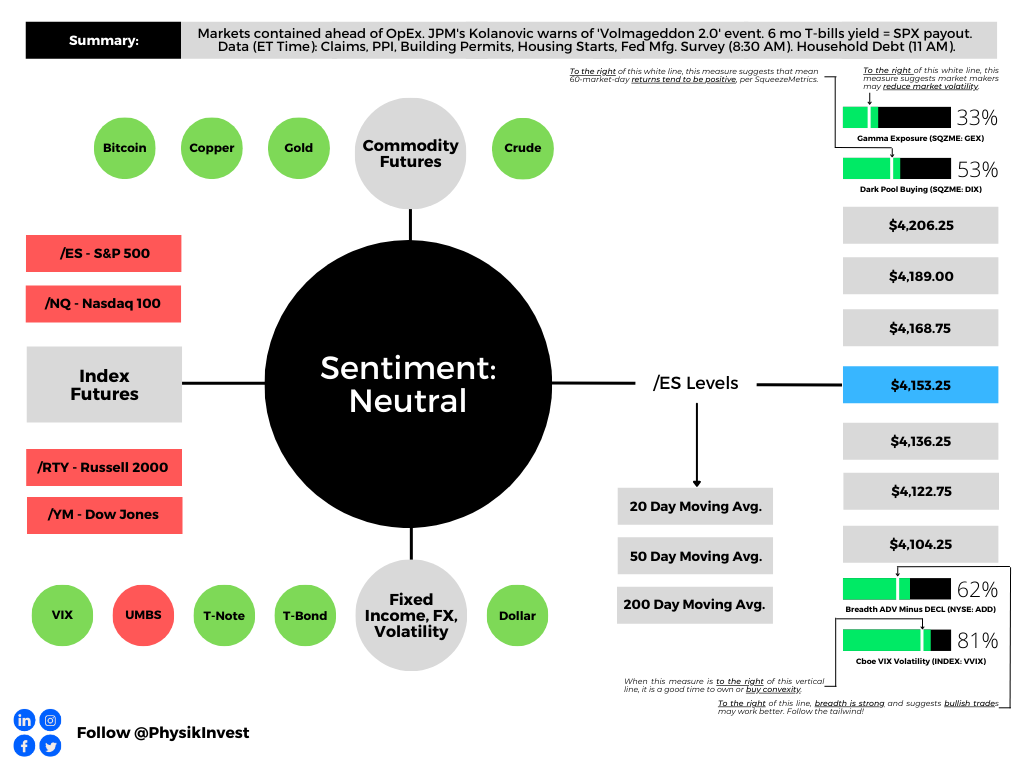
Graphic updated 7:15 AM ET. Sentiment Neutral if expected /MES open is inside of the prior day’s range. /MES levels are derived from the profile graphic at the bottom of this letter. Click here for the latest levels. SqueezeMetrics Dark Pool Index (DIX) and Gamma (GEX) with the latter calculated based on where the prior day’s reading falls with respect to the MAX and MIN of all occurrences available. A higher DIX is bullish. The lower the GEX, the more (expected) volatility. Click to learn the implications of volatility, direction, and moneyness. Breadth reflects a reading of the prior day’s NYSE Advance/Decline indicator. The CBOE VIX Volatility Index (INDEX: VVIX) reflects the attractiveness of owning volatility. UMBS prices via MND. Click here for the economic calendar.
Administrative
As previously indicated, through the end-of-this week, newsletters may be shorter due to the letter writer’s commitments. Take care!
Fundamental
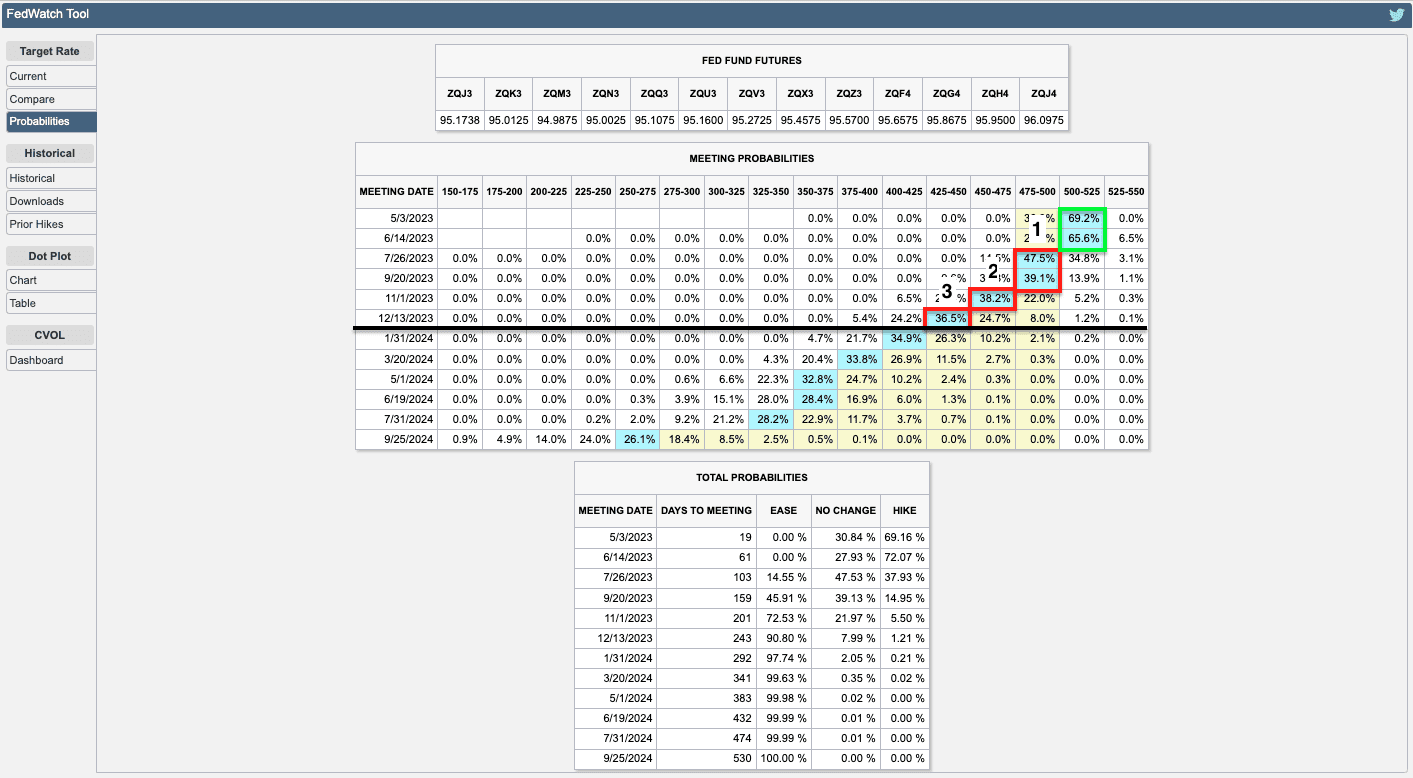
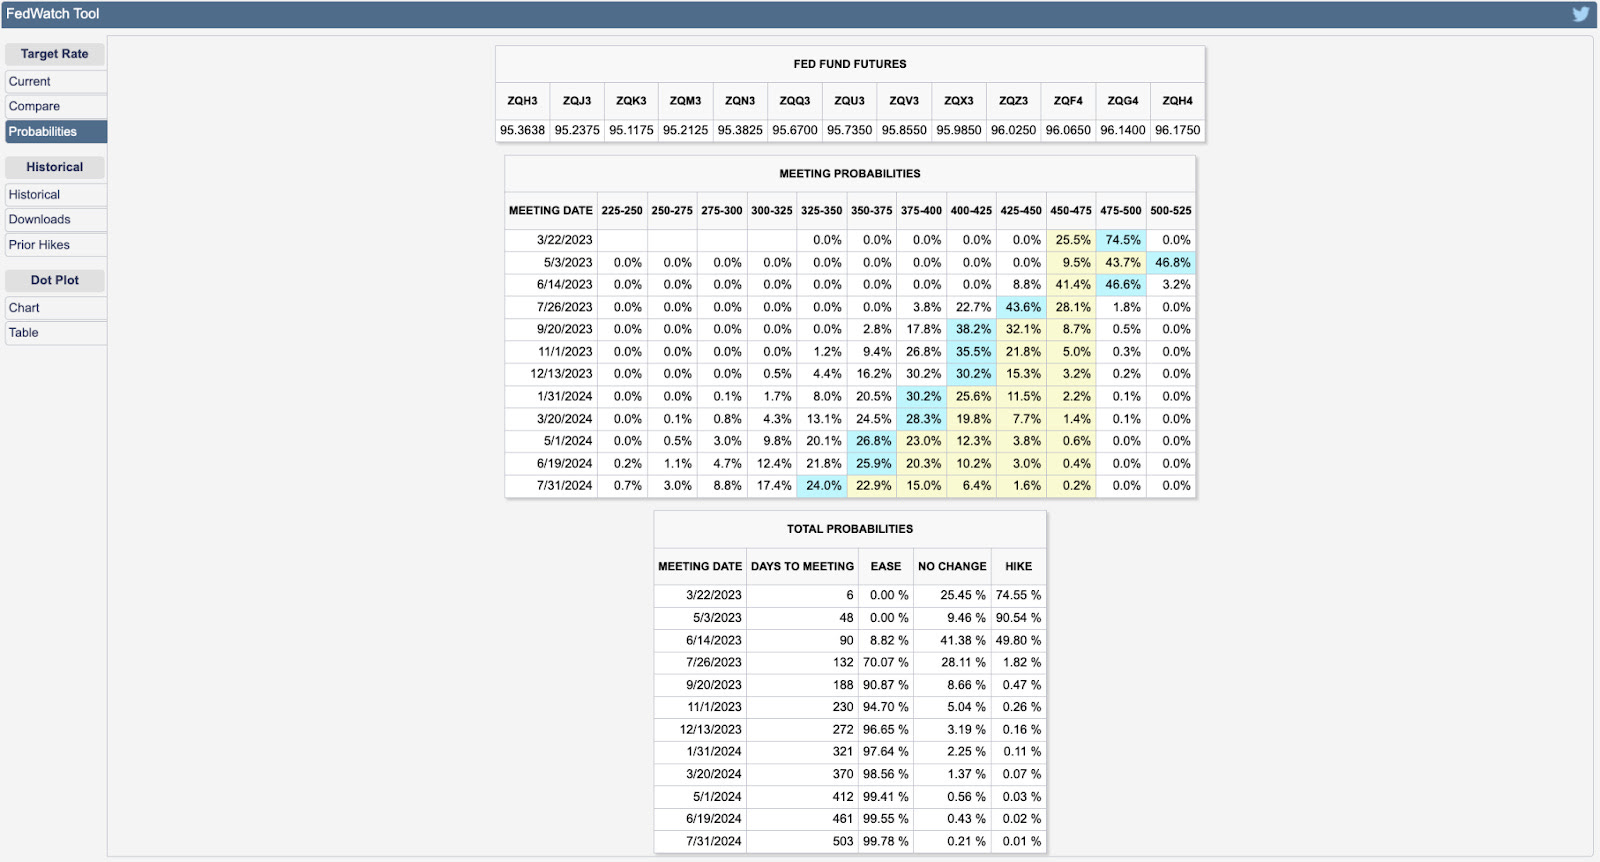
Based on the 30-Day Fed Funds (FUTURE: /ZQ), traders expect the Federal Reserve (Fed) to continue its tightening campaign with a 25 basis point rate hike at the next Federal Open Market Committee (FOMC) meeting. Following this, traders expect one more 25 basis point hike that brings the terminal or peak rate to 5.00-5.25%.
Graphic: Retrieved from CME Group Inc’s (NASDAQ: CME) FedWatch Tool.
Earlier this week, traders were pricing out hikes on financial institutions’ liquidity issues (e.g., SVB Financial Group) and data, including producer prices and retail sales, “moving in the right direction,” said Vital Knowledge’s Adam Crisafulli.
Graphic: Retrieved from Bloomberg via Gavekal Research/Macrobond. Recall that the Fed believes in needs a certain level of reserves for the proper functioning of the financial system (~$2 trillion). In 2019, banks dumped a lot of their reserves into repo to earn some extra return. When QT was about to end, there was less money in their reserves which preceded a spike in rates and a blow-up among those who needed the money the most, as explained here. Read the Daily Brief for September 20, 2022, for more.
Now, with fear of contagion ebbing on authorities’ commitment to preventing an “all-out systemic crisis,” explains Bloomberg’s John Authers, traders are again expecting a 5.00-5.25% terminal or peak rate.
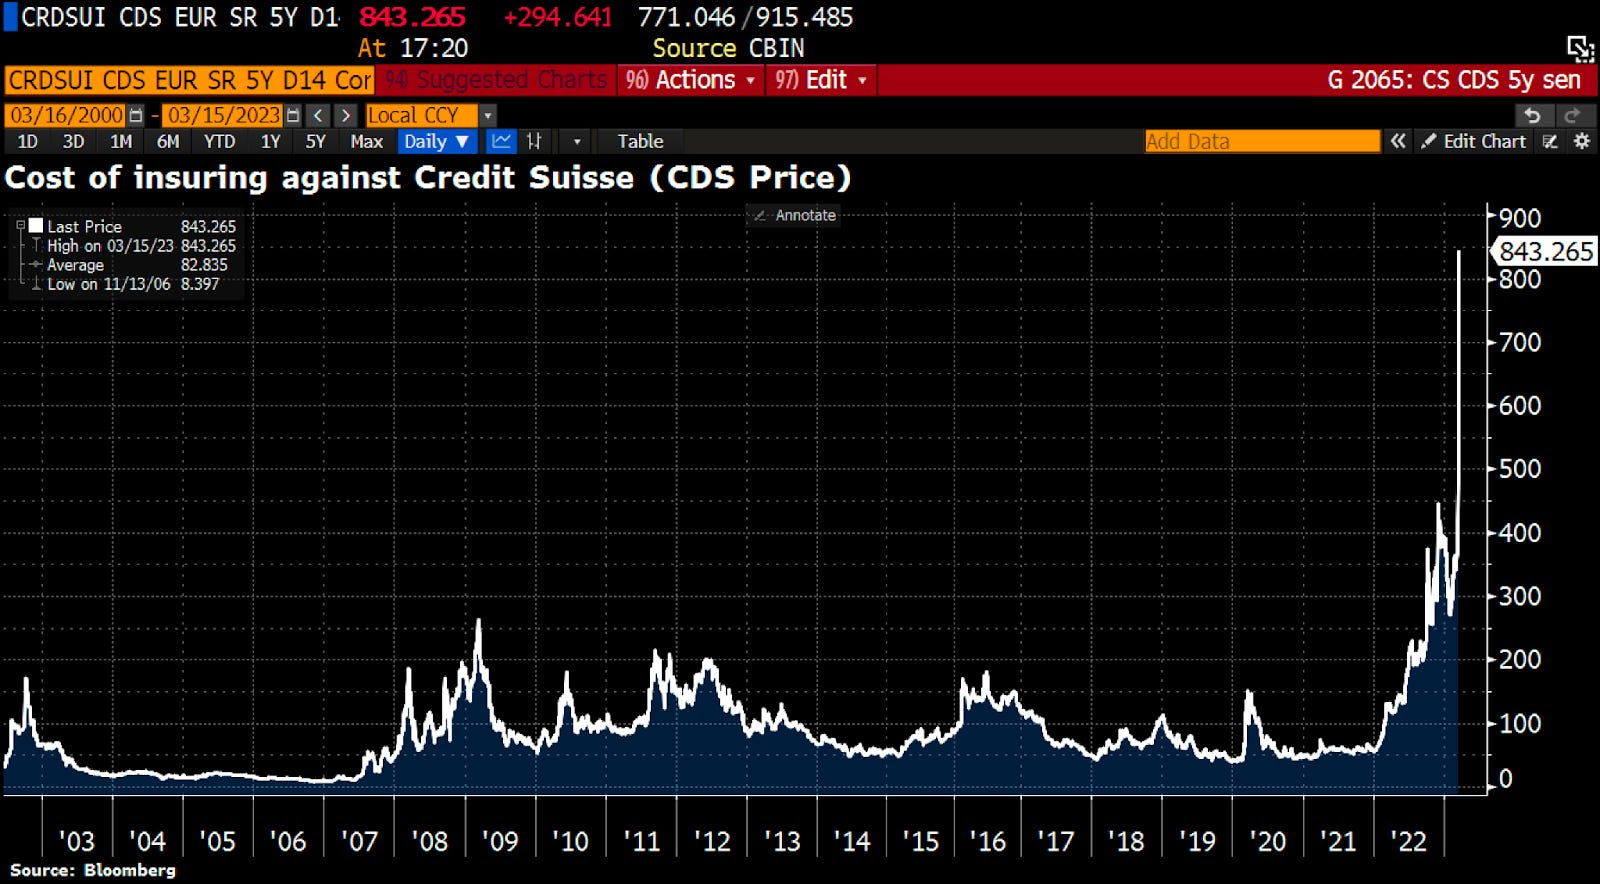
Read: Credit Suisse Group AG (NYSE: CS) protection reaches prohibitively expensive levels as banks rush into CDS after big shareholders hesitate to boost their stake. Switzerland was forced to step in with a $54 billion lifeline to stabilize the crisis.
Graphic: Retrieved from Bloomberg via Holger Zschaepitz.
Adding, as Unlimited’s Bob Elliott puts it, “in the [Global Financial Crisis], credit risk spread rapidly. Today, there is very little [credit default swap] impact” or carryover.
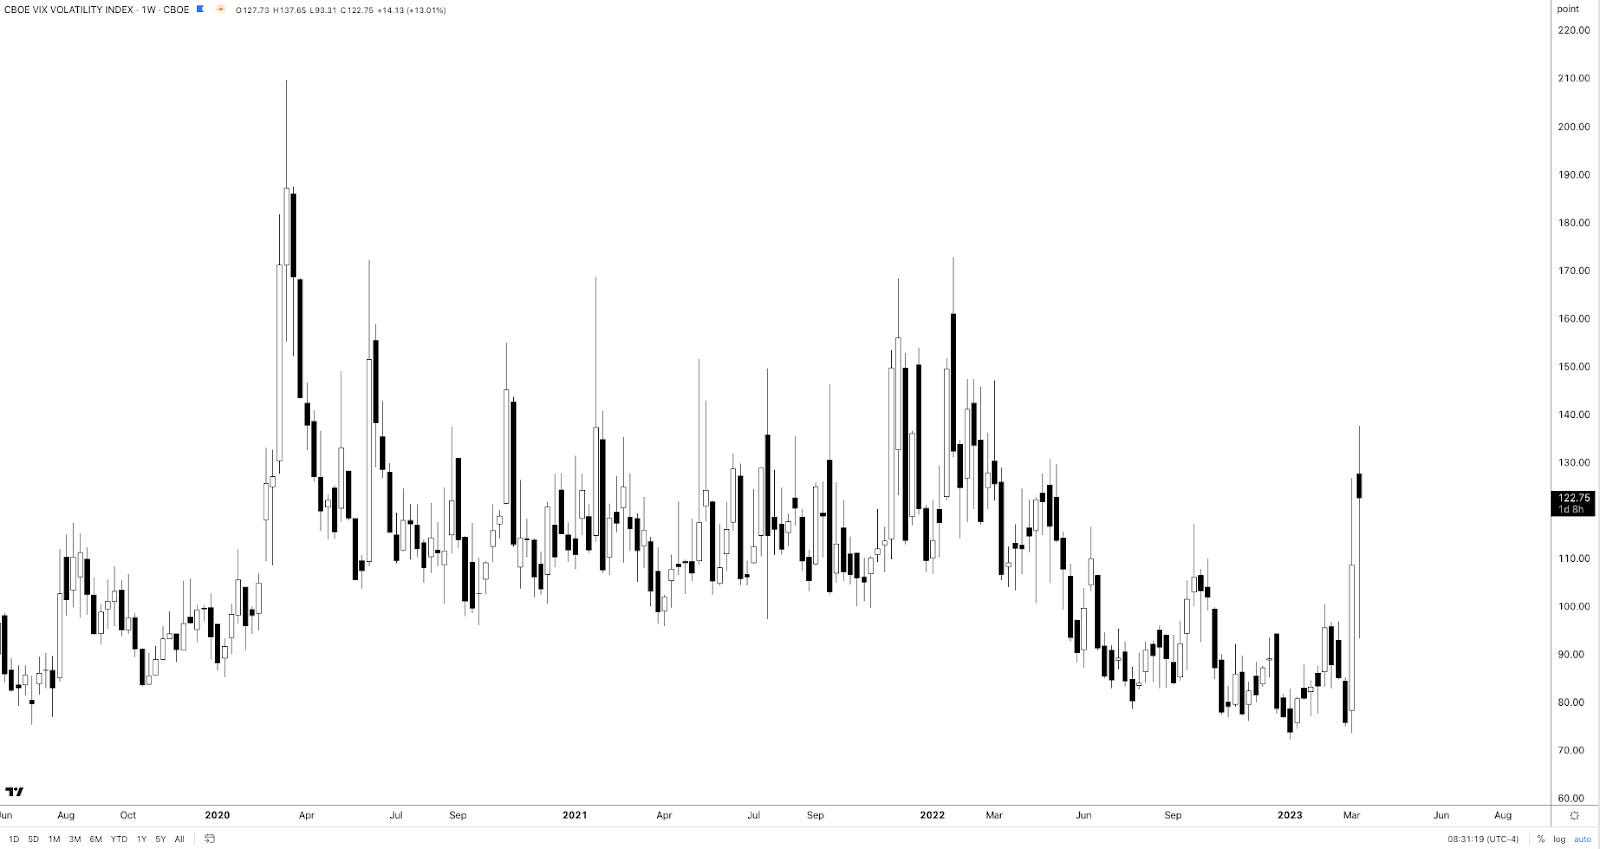
Following measures of US Treasury yield volatility implied by options (i.e., bets or hedges on or against market movement) adjusting higher, equity market volatility strengthened as observed by measures of convexity (e.g., Cboe VIX Volatility Index or VVIX). The Daily Brief for March 14 talked about this in detail.
Graphic: VVIX chart retrieved from TradingView.
For this protection to keep its value and continue to perform well, realized volatility or RVOL must shift higher substantially and stay elevated. That’s not really happening to some big extent, at least in the equity market. Consequently, put structures such as bear put spreads in the S&P 500 (INDEX: SPX), for example, are not performing.
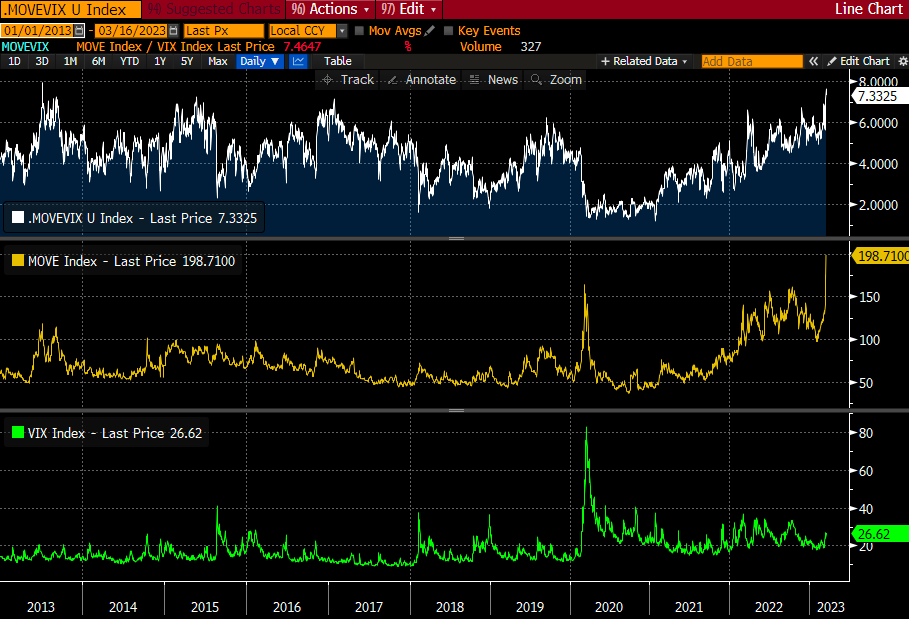
Graphic: Retrieved from Alpha_Ex_LLC. “Easy to argue that rate vol is leading and in this context, one could suggest VIX has room to rise from here.” However, it would “take a lot for the MOVE to sustain itself at this level.”
This information, coupled with falling implied volatility or IVOL, the passage of nearing derivatives expiries, and the strength of products like the Nasdaq 100 (INDEX: NDX) relative to others like the Russell 2000 (INDEX: RUT), has your letter writer leaning optimistic. Though it may be too early to position for strength, one may consider it the way it was explained in the Daily Brief on March 14.
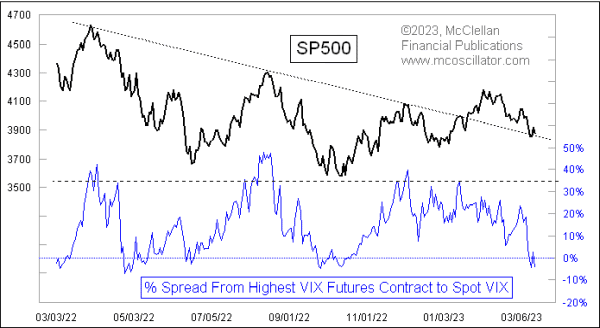
Graphic: Retrieved from Tom McClellan. “The direct message is that the SP500 options traders who drive the VIX Index are feeling more fearful than the VIX futures traders believe is merited.”
Technical
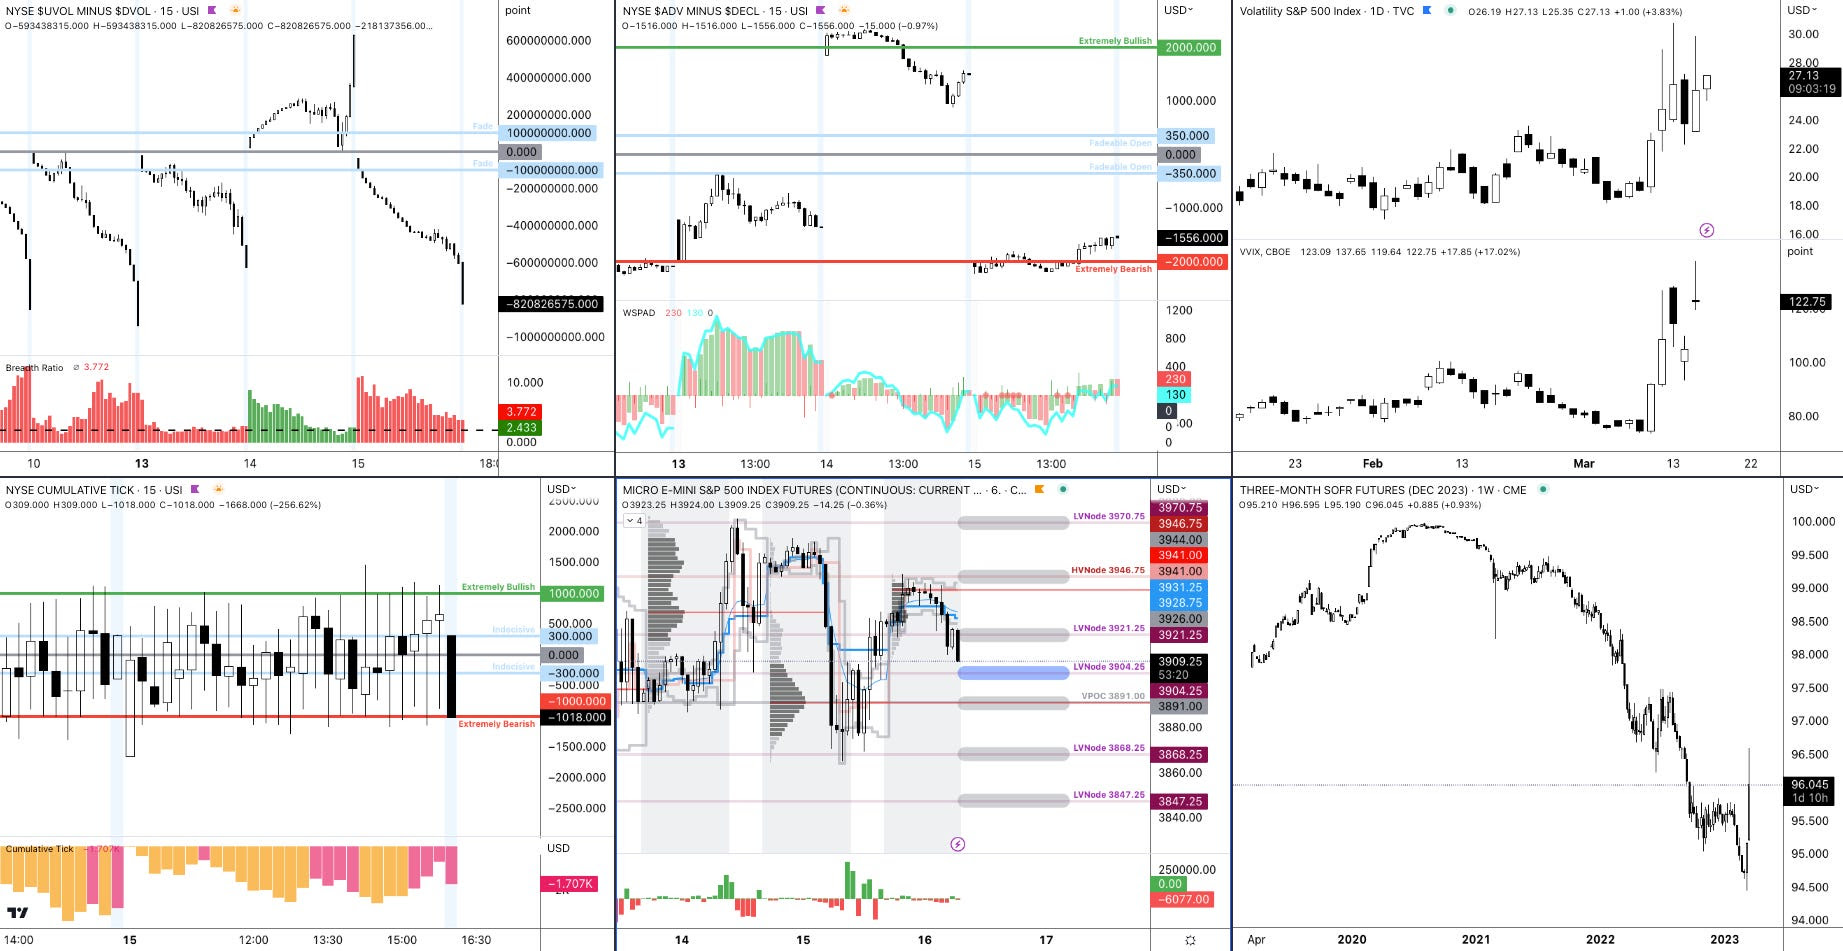
As of 7:15 AM ET, Thursday’s regular session (9:30 AM – 4:00 PM ET), in the S&P 500, is likely to open in the lower part of a balanced overnight inventory, inside of the prior day’s range, suggesting a limited potential for immediate directional opportunity.
The S&P 500 pivot for today is $3,904.25.
Key levels to the upside include $3,921.25, $3,946.75, and $3,970.75.
Key levels to the downside include $3,891.00, $3,868.25, and $3,847.25.
Disclaimer: Click here to load the updated key levels via the web-based TradingView platform. New links are produced daily. Quoted levels likely hold barring an exogenous development.
Graphic: 65-minute profile chart of the Micro E-mini S&P 500 Futures (bottom middle).
Definitions
Volume Areas: Markets will build on areas of high-volume (HVNodes). Should the market trend for a period of time, this will be identified by a low-volume area (LVNodes). The LVNodes denote directional conviction and ought to offer support on any test.
If participants auction and find acceptance in an area of a prior LVNode, then future discovery ought to be volatile and quick as participants look to the nearest HVNodes for more favorable entry or exit.
POCs: Areas where two-sided trade was most prevalent in a prior day session. Participants will respond to future tests of value as they offer favorable entry and exit.
Volume-Weighted Average Prices (VWAPs): A metric highly regarded by chief investment officers, among other participants, for quality of trade. Additionally, liquidity algorithms are benchmarked and programmed to buy and sell around VWAPs.
About
The author, Renato Leonard Capelj, spends the bulk of his time at Physik Invest, an entity through which he invests and publishes free daily analyses to thousands of subscribers. The analyses offer him and his subscribers a way to stay on the right side of the market.
You may view this letter’s content calendar at this link.
Disclaimer
Do not construe this newsletter as advice. All content is for informational purposes. Capelj and Physik Invest manage their own capital and will not solicit others for it.
Physik Invest’s Daily Brief is read free by thousands of subscribers. Join this community to learn about the fundamental and technical drivers of markets.
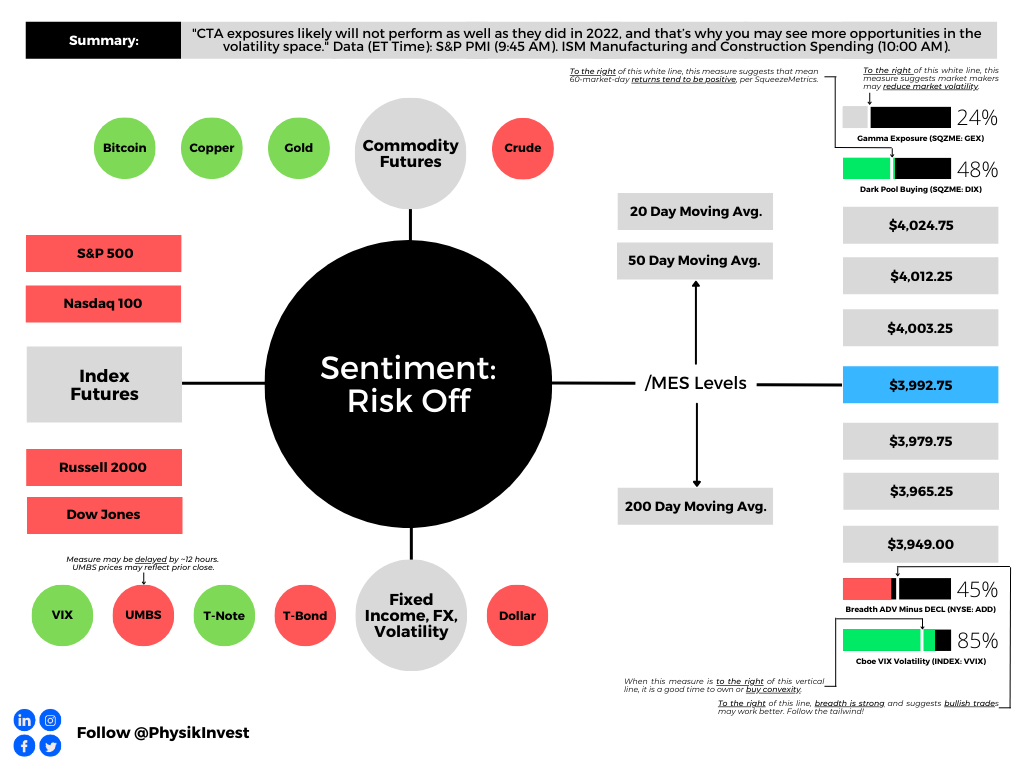
Graphic updated 9:25 AM ET. Sentiment Risk-Off if expected /MES open is below the prior day’s range. /MES levels are derived from the profile graphic at the bottom of this letter. Click here for the latest levels. SqueezeMetrics Dark Pool Index (DIX) and Gamma (GEX) with the latter calculated based on where the prior day’s reading falls with respect to the MAX and MIN of all occurrences available. A higher DIX is bullish. The lower the GEX, the more (expected) volatility. Click to learn the implications of volatility, direction, and moneyness. Breadth reflects a reading of the prior day’s NYSE Advance/Decline indicator. The CBOE VIX Volatility Index (INDEX: VVIX) reflects the attractiveness of owning volatility. UMBS prices via MND. Click here for the economic calendar.
Administrative
Pardon, the delay. Also, the levels in this letter are a little messy to the downside. Too many confluences. Will clear them up over the coming days. Have a great day!
Fundamental
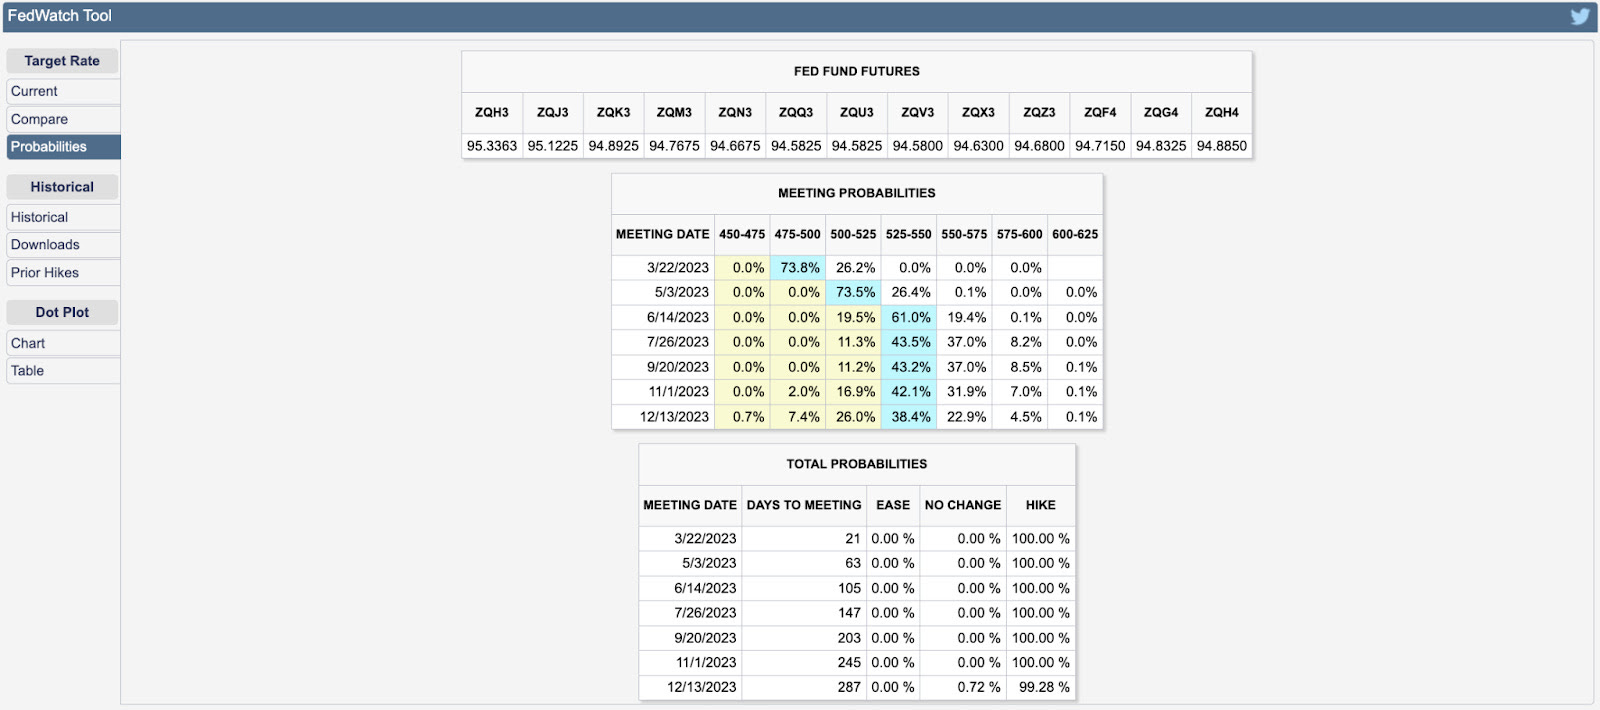
In the face of contrarian economic indications, based on CME Group Inc’s (NASDAQ: CME) FedWatch Tool, traders’ activity in the Fed Fund Futures shows the terminal rate peaking at 5.25-5.50%. Expectations for easing are pushed out to 2024, though at a less steep rate. This context, coupled with the prospects of slower economic growth, presents uninspiring realities for investors.
Graphic: Retrieved from CME Group Inc’s (NASDAQ: CME) FedWatch Tool.
Consequently, the equity-bond correlation break is set to persist.
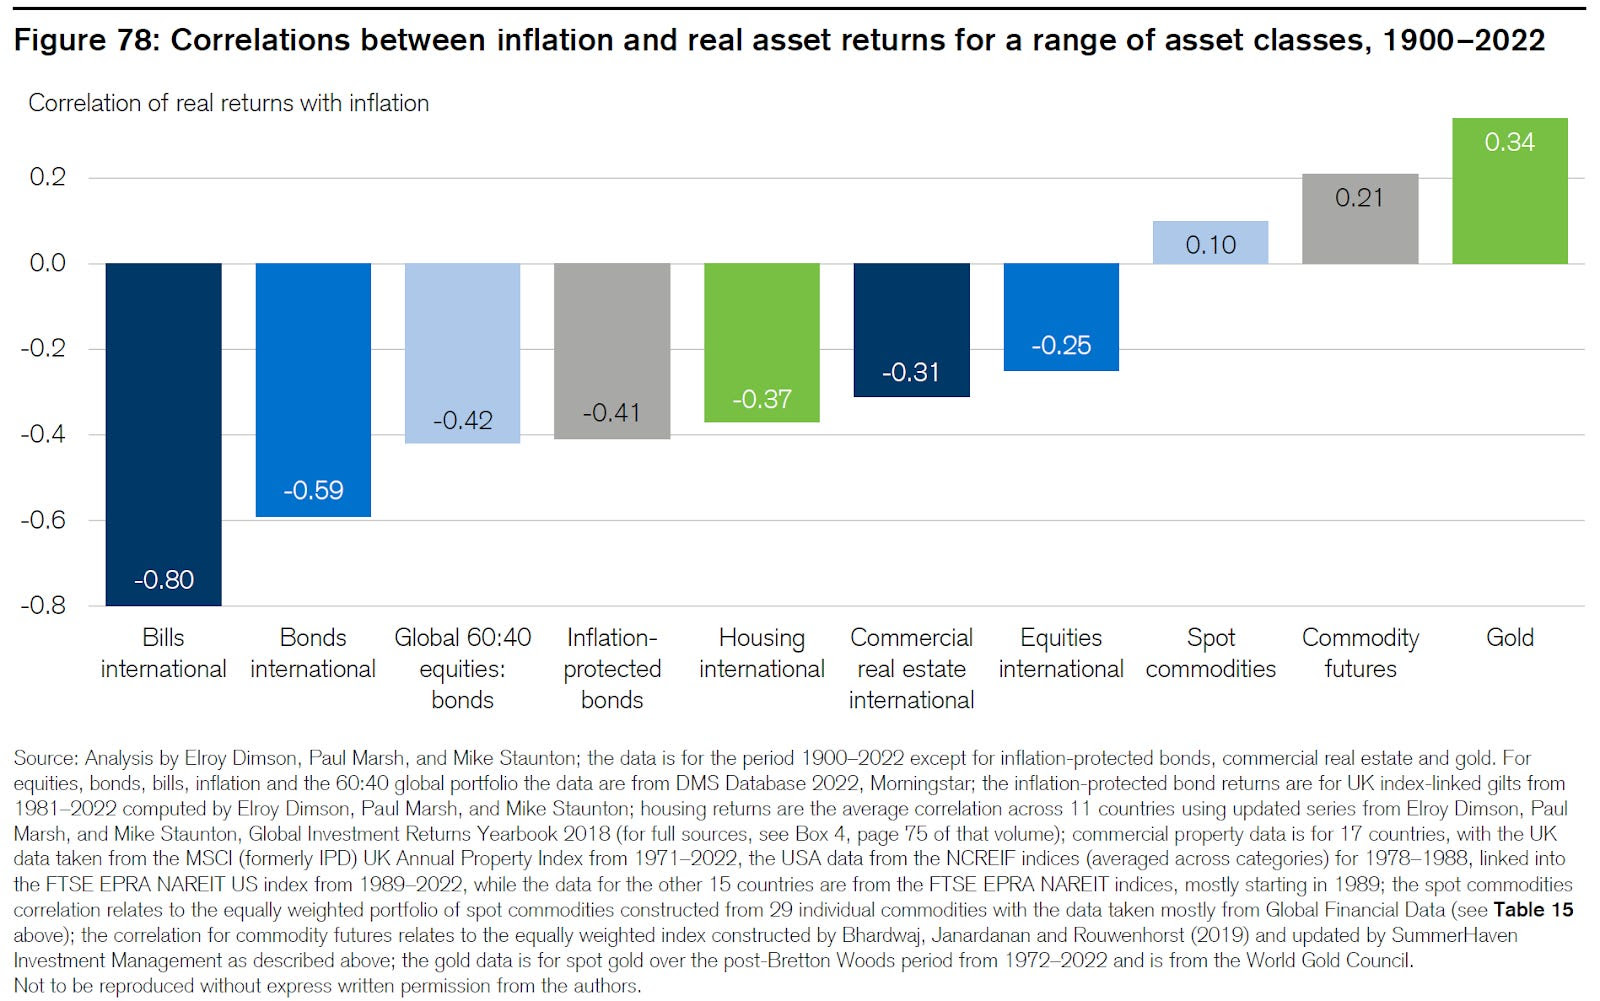
Graphic: Retrieved from Credit Suisse Group AG (NYSE: CS).
Quoting a Bloomberg analysis of Credit Suisse’s Global Investment Returns Yearbook, “[b]onds, equities and real estate tend to be negatively correlated with inflation,” while “only commodities had a positive correlation, making them the only true hedge.”
However, commodities are “often susceptible to deep and lengthy drawdowns … in periods of disinflation” and falling growth expectations. Though commodities are a hedge against inflation, they aren’t a hedge against (rising odds of) recession.
Graphic: Retrieved from Credit Suisse Group AG (NYSE: CS).
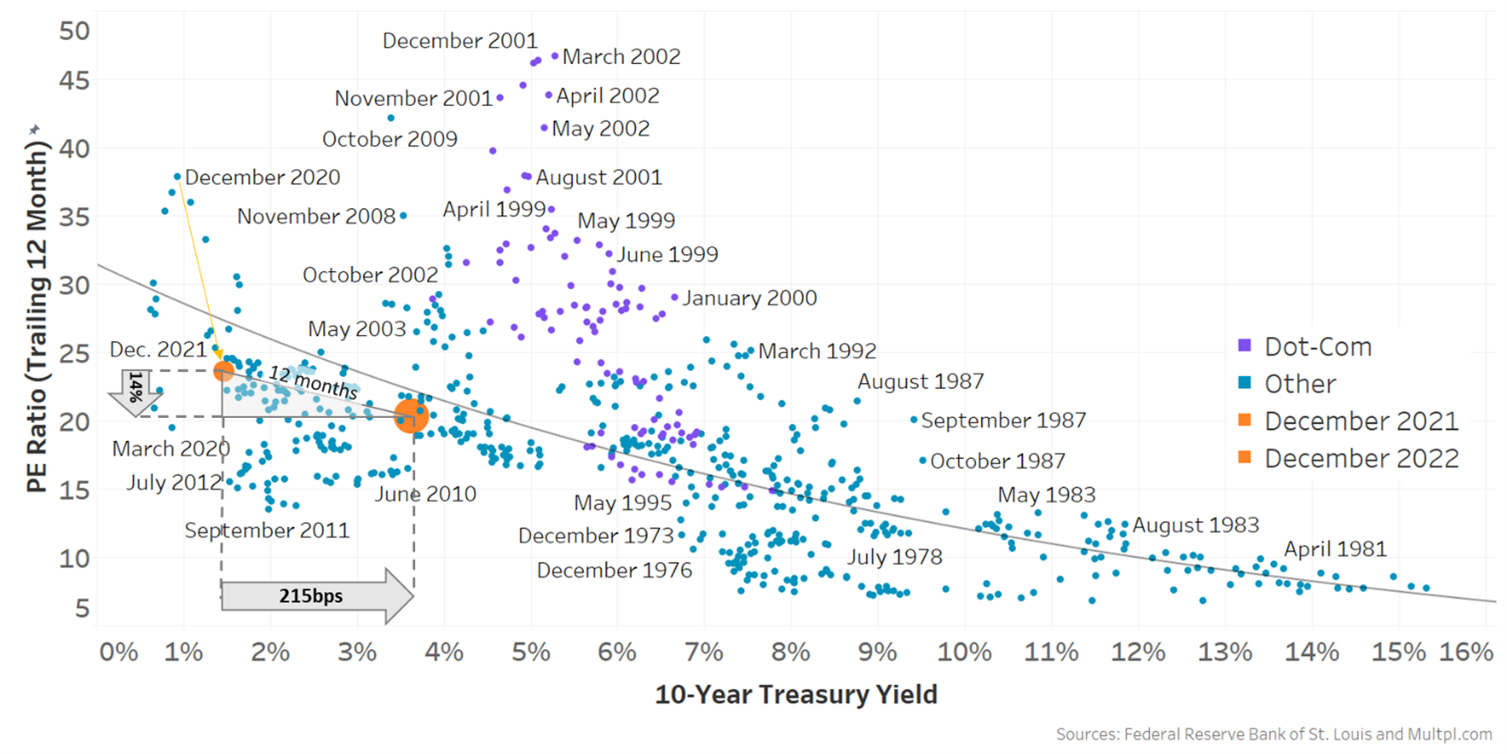
So, interest rates are likely to rise and stay higher for longer.
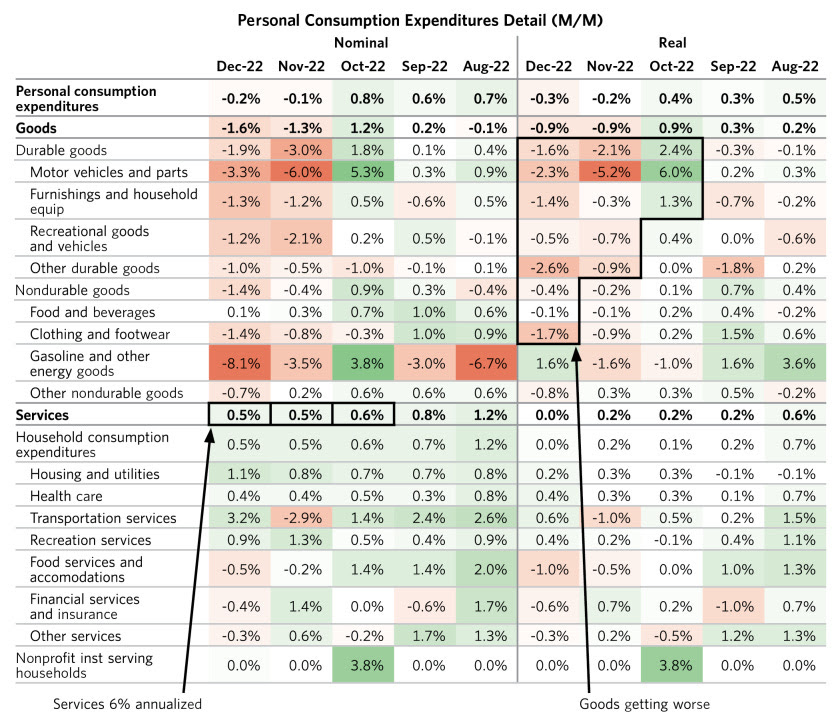
Graphic: Retrieved from Bridgewater Associates LP. “Nominal spending on services has continued to grow at a rapid clip of about 6% annualized. Real and nominal demand for goods has been gradually weakening. This shift in the mix of demand has implications. Services spending is an upward pressure on employment and wages, while weak goods demand has a more pronounced impact on listed company sales.”
Equities, which are particularly sensitive to interest rates, are likely to weaken despite economic and earnings growth which is set to fall (i.e., close to zero earnings growth).
Graphic: Retrieved January 5, 2023, from Nasdaq Inc’s (NASDAQ: NDAQ) Phil Mackintosh.
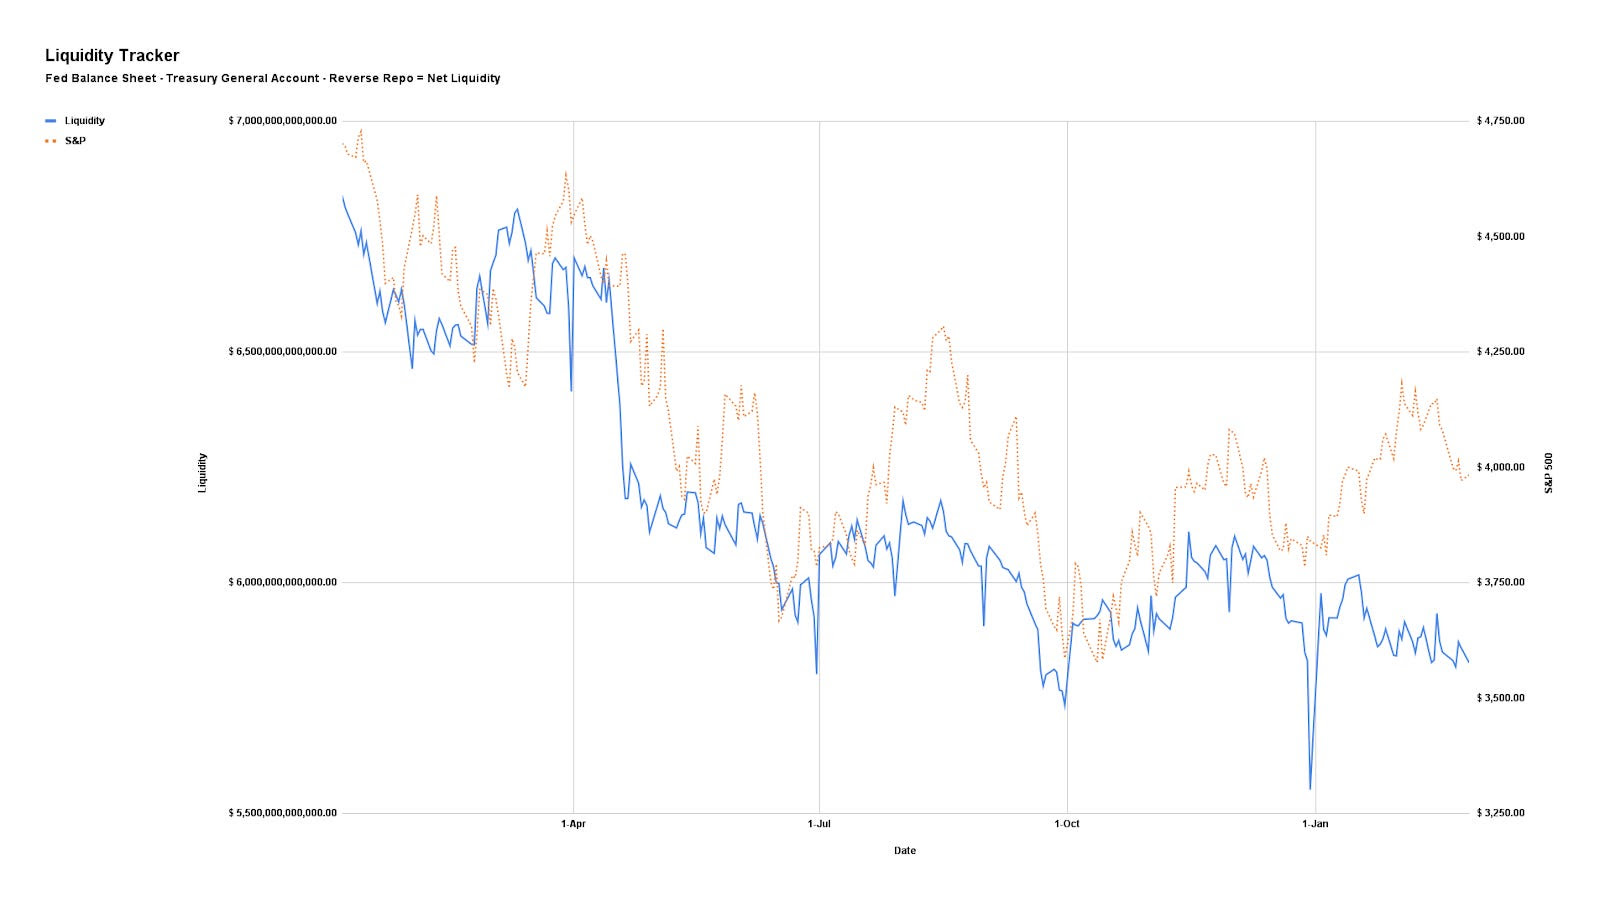
Quantitative tightening or QT (i.e., the flow of capital out of capital markets and an asset headwind), which has been offset by the running off of the Treasury General Account and injecting liquidity into markets (i.e., TGA runoff increases the room banks have to lend and finance trading activities) in the face of the debt ceiling issue, is set to accelerate and compound the rising rate impact.
Graphic: Via Physik Invest. Data compiled by @jkonopas623. Fed Balance Sheet data, here. Treasury General Account Data, here. Reverse Repo data, here. NL = BS – TGA – RRP.
In light of rates and QT risk asset headwind, as well as slowing growth and inflation headwind to bonds and commodities, how does one protect their portfolio? As The Ambrus Group’s Kris Sidial explains, “[e]ven if inflation continues, the rate at which it rises won’t be the same. Due to this, CTA exposures likely will not perform as well as they did in 2022, and that’s why you may see more opportunities in the volatility space … [where] we can get cheap exposure to convexity.”
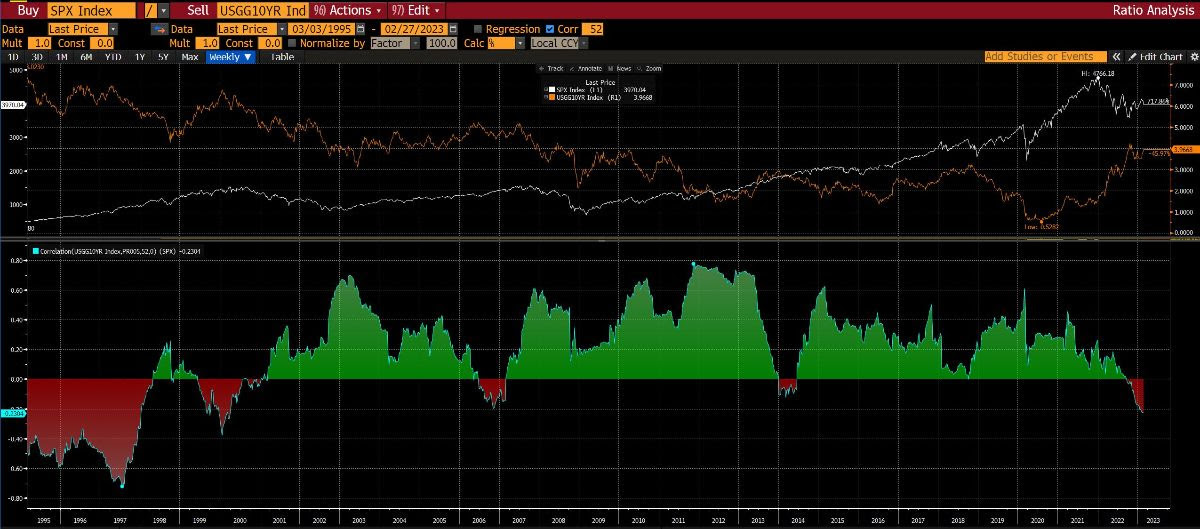
Graphic: Retrieved from Bloomberg via Tier1Alpha. “[T]he correlation between bond yields and equities, has begun to turn higher from a negative level. Remember that a negative correlation between bond yields and equity prices means equities go lower as bond prices go lower, defeating the historical diversification benefits of a 60/40-type portfolio. Historically, this rotation has been associated with a period of LOWER returns, but it’s important to emphasize that this is because these periods are associated with Fed-induced slowdowns. Whether 2023 follows the same pattern remains to be seen.”
Please refer to past letters for trade examples. Though such trades may not be as attractive to enter now, they are attractive to keep on for longer.
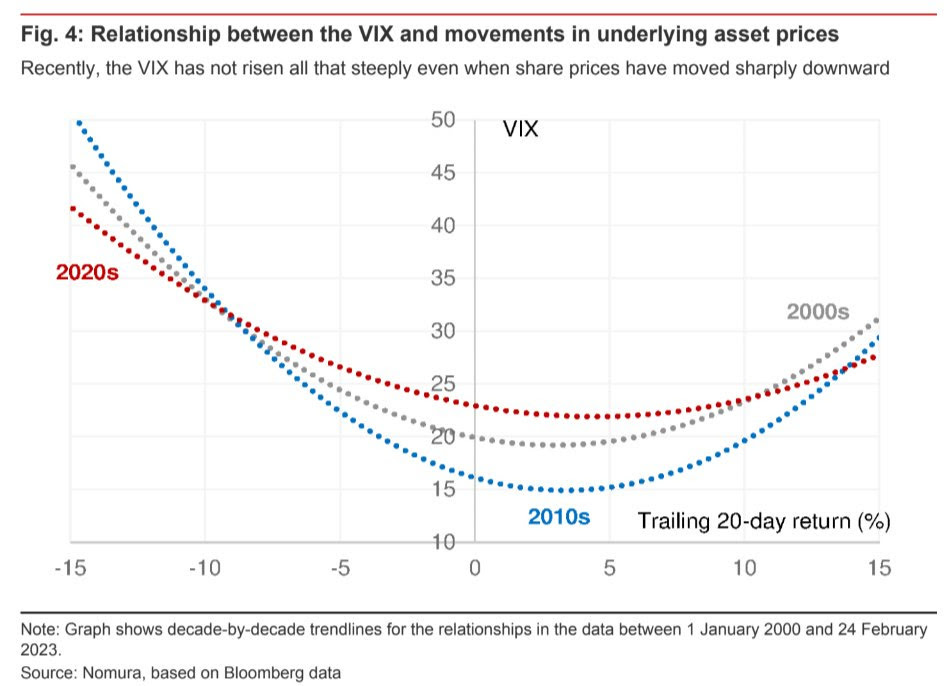
Graphic: Retrieved from Nomura Holdings Inc (NYSE: NMR). Downside trades are rather attractive now in the absence of hedging demands in longer-dated protection convex in price and volatility. Naive measures like the Cboe VIX Volatility (INDEX: VVIX), as well as the graphic above, allude to the little demands for convexity and a declining sensitivity of the VIX with respect to changes in share prices.
If, as Bridgewater Associates put it, there is another stage to tightening “marked either by an economic downturn or failure to meet the inflation target, prompting more tightening,” risk assets will perform poorly and this letter’s trade examples are likely to protect portfolios well until assets appear attractive enough to buy again.
SpotGamma explains that more of the same (i.e., back-and-forth consolidation and a grind higher or lower) can be expected until some macroeconomic catalysts solicit demand for upside or downside protection and, accordingly, counterparty hedging pressures catalyze a far-reaching movement.
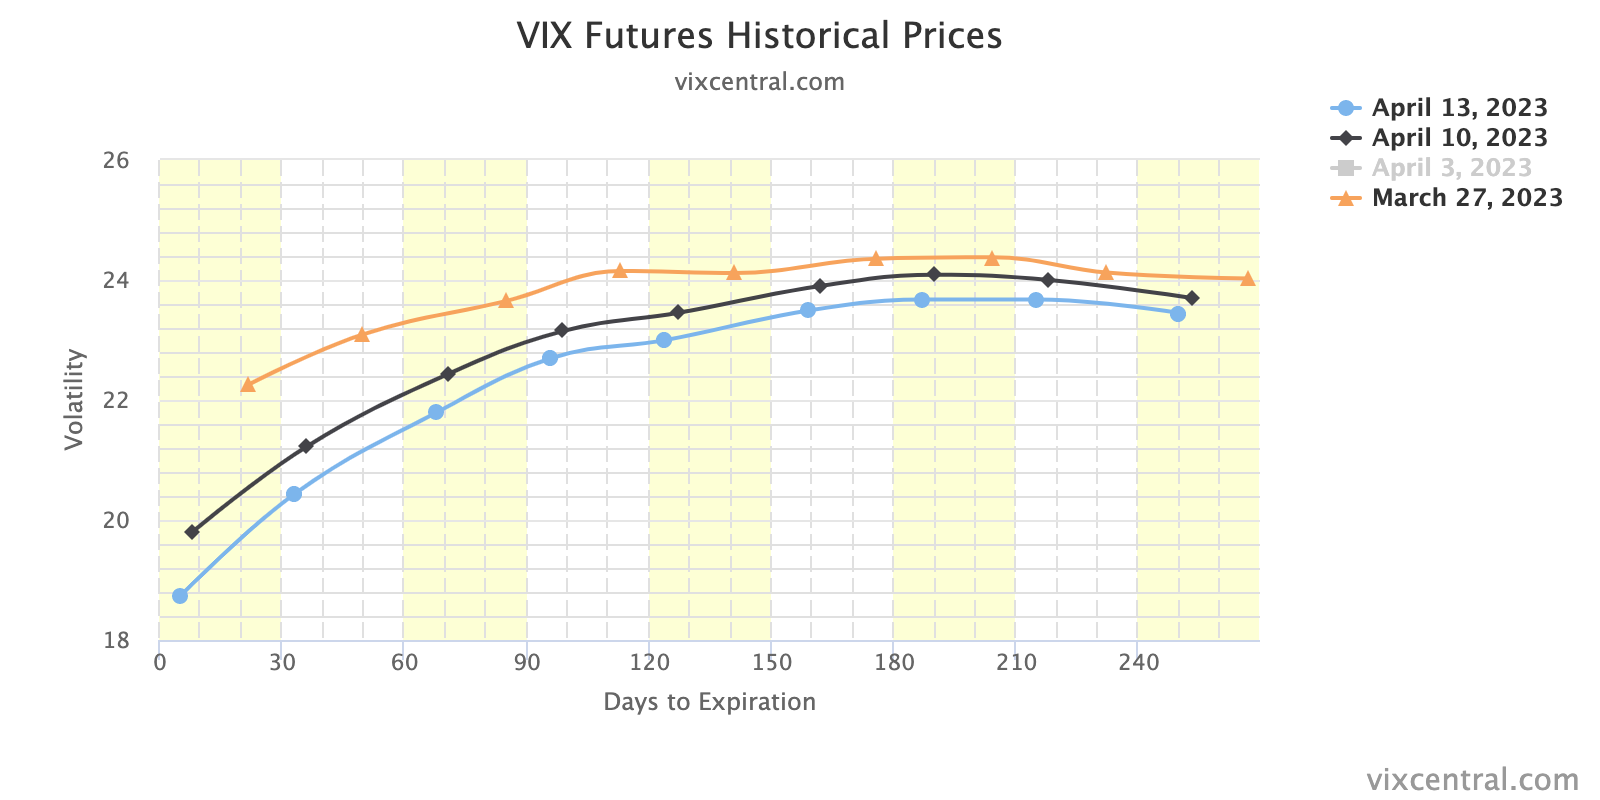
As an aside, “With IV at already low levels, the bullish impact of it falling further is weak, hence the SPX trending lower all the while IV measures (e.g., VIX term structure) have shifted markedly lower since last week. If IV was at a higher starting point, its falling would work to keep the market in a far more positive/bullish stance.”
Graphic: VIX Term Structure retrieved from VIX Central via The Market Ear.
Consequently, “if traders enter the market and demand protection, particularly that which is farther-dated, the bearish effect of rising IV will far outweigh the bullish effect of it falling. This will add to the underlying/fundamental pressure we see building via weak price action.”
Technical
As of 9:20 AM ET, Wednesday’s regular session (9:30 AM – 4:00 PM ET), in the S&P 500, is likely to open in the lower part of a positively skewed overnight inventory, outside of the prior day’s range, suggesting a potential for immediate directional opportunity.
The S&P 500 pivot for today is $3,965.25.
Key levels to the upside include $3,979.75, $3,992.75, and $4,003.25.
Key levels to the downside include $3,949.00, $3,927.50, and $3,908.25.
Disclaimer: Click here to load the updated key levels via the web-based TradingView platform. New links are produced daily. Quoted levels likely hold barring an exogenous development.
Graphic: 65-minute profile chart of the Micro E-mini S&P 500 Futures.
Definitions
Volume Areas: Markets will build on areas of high-volume (HVNodes). Should the market trend for a period of time, this will be identified by a low-volume area (LVNodes). The LVNodes denote directional conviction and ought to offer support on any test.
If participants auction and find acceptance in an area of a prior LVNode, then future discovery ought to be volatile and quick as participants look to the nearest HVNodes for more favorable entry or exit.
POCs: Areas where two-sided trade was most prevalent in a prior day session. Participants will respond to future tests of value as they offer favorable entry and exit.
MCPOCs: Denote areas where two-sided trade was most prevalent over numerous sessions. Participants will respond to future tests of value as they offer favorable entry and exit.
About
The author, Renato Leonard Capelj, works in finance and journalism.
Capelj spends the bulk of his time at Physik Invest, an entity through which he invests and publishes free daily analyses to thousands of subscribers. The analyses offer him and his subscribers a way to stay on the right side of the market. Separately, Capelj is an options analyst at SpotGamma and an accredited journalist.
You may view this letter’s content calendar at this link.
Disclaimer
Do not construe this newsletter as advice. All content is for informational purposes. Capelj and Physik Invest manage their own capital and will not solicit others for it.
Physik Invest’s Daily Brief is read free by thousands of subscribers. Join this community to learn about the fundamental and technical drivers of markets.
Graphic updated 7:15 AM ET. Sentiment Neutral if expected /MES open is inside of the prior day’s range. /MES levels are derived from the profile graphic at the bottom of this letter. Click here for the latest levels. SqueezeMetrics Dark Pool Index (DIX) and Gamma (GEX) with the latter calculated based on where the prior day’s reading falls with respect to the MAX and MIN of all occurrences available. A higher DIX is bullish. The lower the GEX, the more (expected) volatility. Click to learn the implications of volatility, direction, and moneyness. Breadth reflects a reading of the prior day’s NYSE Advance/Decline indicator. The CBOE VIX Volatility Index (INDEX: VVIX) reflects the attractiveness of owning volatility. UMBS prices via MND. Click here for the economic calendar.
Fundamental
We look beyond all the doom-and-gloom narrative to the bond-equity divergence which JPMorgan Chase & Co’s (NYSE: JPM) Marko Kolanovic wrote about recently.
Essentially, regressions suggest the move in interest rates since the Federal Reserve’s (Fed) meeting earlier this month should have resulted in a 5-10% sell-off in the rate-sensitive Nasdaq. It didn’t. Per Kolanovic, “this divergence cannot go much further.”
Recall interest rates matter to discounted future cash flows. The higher rates are the, worse that is for equities, says Damped Spring’s Andy Constan well in an interview.
Interest rates matter elsewhere as well. When interest rates increase, “a mortgage goes down in price by a greater amount than the bond because the expected maturity of the mortgage becomes longer. The magnitude of this unbalanced price volatility characteristic is measured by a financial statistic called ‘convexity.’” Managing this convexity can be problematic and force feedback loops, just as we talk about with options per the below. See here for more.
Graphic: The “Biggest tail risk to SPX isn’t any macro data/virus/war but its own options market.”
Kolanvoic ends: The “risk-reward of holding bonds at this level of short-term yields looks better than equity (earnings yield) than any time since the great financial crisis (i.e., the spread between 2y and equity earnings yield is at the lowest point since 2007).”
Graphic: Retrieved from JPMorgan Chase & Co (NYSE: JPM).
Positioning
This letter said there would be movement after last week’s options expirations (OpEx).
To quote the February 15 letter, ignoring the “excellent” liquidity and traders buying S&P 500 (INDEX: SPX) “hand over fist,” OpEx would result in a decline in counterparty exposure to positive gamma (i.e., positive exposure to movement). Support from an options positioning perspective would decline, and counterparties would “do less to disrupt and more to bolster movement.”
That’s along the lines of what’s happening, though the movement appears orderly.
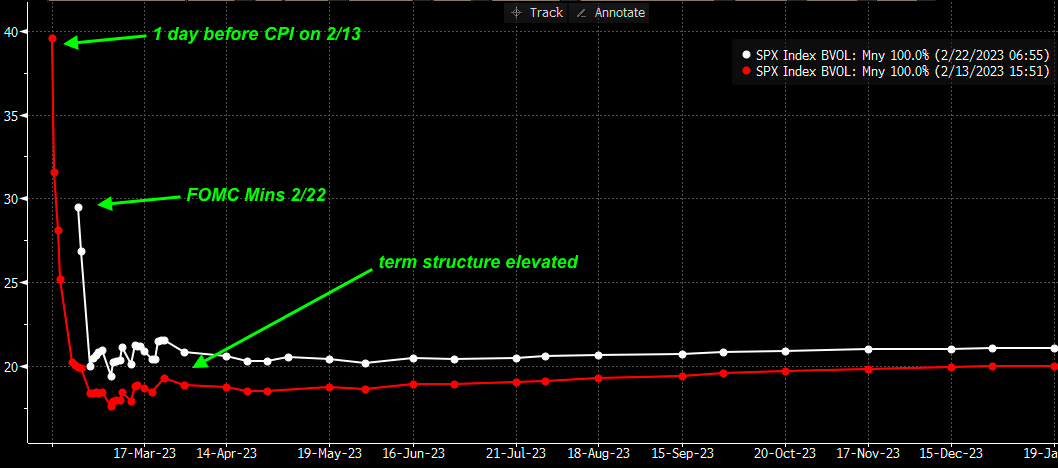
Per SpotGamma, “The selling appears contained, as evidenced by an upward trending [implied volatility or IVOL] term structure and light bid in topline measures of [IVOL] like the [Cboe Volatility Index (INDEX: VIX)].” Notwithstanding this light bid at the front of the term structure, there is no rush to protect, as would be evidenced by longer-dated IVOL shifting “materially higher as traders reset to lower equity valuations.”
Graphic: Retrieved from SpotGamma. “SPX term structure today vs 2/13 (day prior to CPI). Traders had higher vol expectations for CPI vs today’s FOMC minutes, but [the] term structure is now more elevated. Makes sense as SPX [is] -3% lower. However, the loss of stabilizing OPEX positioning, elevated IV, & flat gamma may lead to higher relative vol today.”
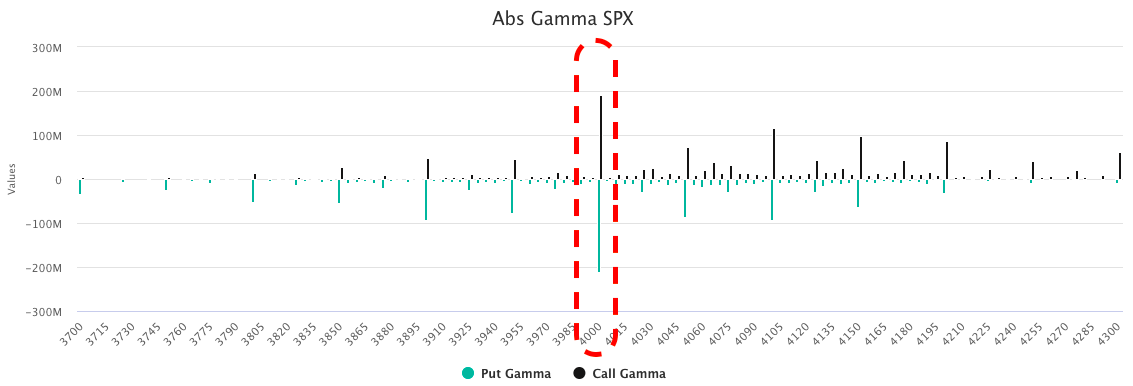
With there being many options positions concentrated near the $4,000.00 SPX area, markets may be at risk of accelerated selling. Below $4,000.00 traders desire to own predominantly puts, and this leaves counterparties “short puts and [] positive delta, as well as negative gamma and vega, meaning they lose money in an increasing way as the market trades lower and volatility increases.” To hedge, counterparties could sell futures or stocks into the decline. This accelerates selling.
So, with a break of that big $4,000.00 level increasing risk that selling accelerates, the desire to protect will bid IVOL and the marginal impact of its expansion can do more damage than good that any marginal compression can do.
Graphic: Retrieved from SpotGamma. “IV has now compressed to levels associated with recent market tops. If realized vol (RV) declined, then IV could go lower. But, realized isn’t declining.”
In light of this, your letter writer leans negative delta, as well as positive gamma and vega. If the market trades lower, such a setup would make money in short.
Technical
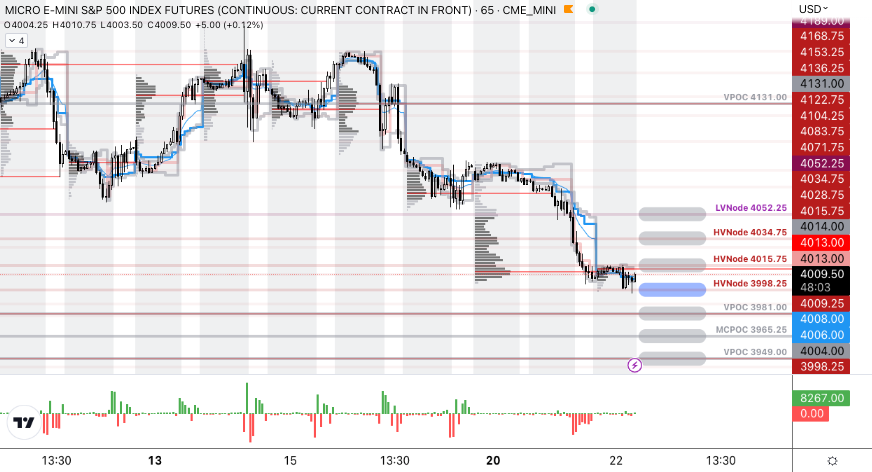
As of 7:15 AM ET, Wednesday’s regular session (9:30 AM – 4:00 PM ET), in the S&P 500, is likely to open in the middle part of a negatively skewed overnight inventory, inside of the prior day’s range, suggesting a limited potential for immediate directional opportunity.
The S&P 500 pivot for today is $3,998.25.
Key levels to the upside include $4,015.75, $4,034.75, and $4,052.25.
Key levels to the downside include $3,981.00, $3,965.25, and $3,949.00.
Disclaimer: Click here to load the updated key levels via the web-based TradingView platform. New links are produced daily. Quoted levels likely hold barring an exogenous development.
Graphic: 65-minute profile chart of the Micro E-mini S&P 500 Futures.
Definitions
Volume Areas: Markets will build on areas of high-volume (HVNodes). Should the market trend for a period of time, this will be identified by a low-volume area (LVNodes). The LVNodes denote directional conviction and ought to offer support on any test.
If participants auction and find acceptance in an area of a prior LVNode, then future discovery ought to be volatile and quick as participants look to the nearest HVNodes for more favorable entry or exit.
Gamma: The sensitivity of an option’s Delta to changes in the underlying asset’s price.
CPOCs: Denote areas where two-sided trade was most prevalent over all sessions. Participants will respond to future tests of value as they offer favorable entry and exit.
POCs: Areas where two-sided trade was most prevalent in a prior day session. Participants will respond to future tests of value as they offer favorable entry and exit.
MCPOCs: Denote areas where two-sided trade was most prevalent over numerous sessions. Participants will respond to future tests of value as they offer favorable entry and exit.
Inversion Of VIX Futures Term Structure: Longer-dated VIX expiries are less expensive; is a warning of elevated near-term risks for equity market stability.
About
The author, Renato Leonard Capelj, works in finance and journalism.
Capelj spends the bulk of his time at Physik Invest, an entity through which he invests and publishes free daily analyses to thousands of subscribers. The analyses offer him and his subscribers a way to stay on the right side of the market. Separately, Capelj is an options analyst at SpotGamma and an accredited journalist.
You may view this letter’s content calendar at this link.
Disclaimer
Do not construe this newsletter as advice. All content is for informational purposes. Capelj and Physik Invest manage their own capital and will not solicit others for it.
Physik Invest’s Daily Brief is read by thousands of subscribers. You, too, can join this community to learn about the fundamental and technical drivers of markets.
Graphic updated 6:15 AM ET. Sentiment Neutral if expected /ES open is inside of the prior day’s range. /ES levels are derived from the profile graphic at the bottom of this letter. Click here for the latest levels. SqueezeMetrics Dark Pool Index (DIX) and Gamma (GEX) with the latter calculated based on where the prior day’s reading falls with respect to the MAX and MIN of all occurrences available. A higher DIX is bullish. At the same time, the lower the GEX, the more (expected) volatility. Click to learn the implications of volatility, direction, and moneyness. Breadth reflects a reading of the prior day’s NYSE Advance/Decline indicator. The CBOE VIX Volatility Index (INDEX: VVIX) reflects the attractiveness of owning volatility. UMBS price via MND. Click here for the calendar.
Positioning
In the news is quite a bit of noise surrounding ultra-short-dated options with little time to expiry. To quote Nomura Holdings Inc’s (NYSE: NMR) Charlie McElligott, the trading of these options is adding noise; “US equities are such an untradable mess right now.”
However, your letter writer, who mainly trades complex spreads on the cash-settled indexes, thinks there has never been a better time to trade. Ultra-short-dated options enable you to express your opinion in more efficient ways. Additionally, the trade of these options, in the aggregate, can influence market movements, and this is added opportunity if you understand it.
Graphic: Retrieved from Goldman Sachs Group Inc (NYSE: GS) via Bloomberg.
Darrin Johnson, a volatility trader, recently discussed sharp ways to use these options.
Heading into some big events this week, John noted S&P 500 (INDEX: SPX) implied volatility (IVOL) was trading at ~25% on a five-day straddle. Traders could buy this structure while, in the interim, selling other structures like it “against CPI, Retail Sales, and PPI” where IVOL was higher. This would enable you to lower the cost of having positive exposure to movement or positive gamma via the five-day straddle, though this is operating on the premise “that Friday’s volatility will hold mostly steady, while the other 3 deflate.”
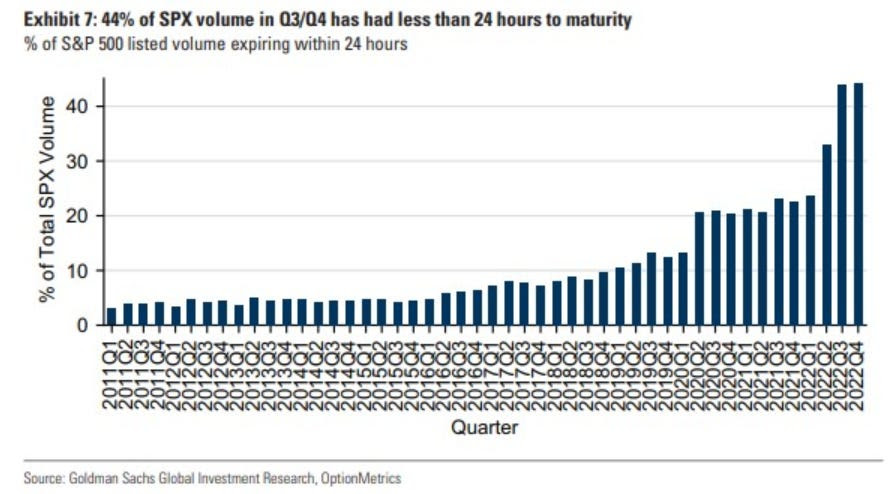
Moreover, the ultra-short-dated options are palatable if we will, and other traders, potentially much bigger in size, are observant of this too. The growing interest in these products (e.g., in the second half of last year, ultra-short-dated options made up more than 40% of the S&P 500’s trading volume) is growing in impact on underlying products like the SPX.
In fact, JPMorgan Chase & Co’s (NYSE: JPM) Peng Cheng found these options have an impact that “can vary from a drag of as much as 0.6% to a boost of up to 1.1%.”
To explain, though as of late options counterparties may be playing a smaller role as “customers have taken equal and opposite sides” of positions, per SqueezeMetrics, we can naively look at there being a pool of liquidity to absorb the demand for these ultra-short-dated options which are very sensitive to time, price, and volatility. These increased sensitivities are hedged in a way that impacts this available pool of liquidity. If the trade or impact is large enough, it is transmitted onto underlying market prices.
For instance, consider so-called meme mania and stocks like GameStop Corporation (NYSE: GME) that rocketed as traders’ interest in short-dated options demands rose. To hedge increased demand in call options, for instance, counterparties must buy the underlying stock. This demand boosts the stock.
Likewise, if traders’ consensus is that markets won’t move much until some large macroeconomic events, then their bets against market movement (i.e., sell ultra-short-dated options) will result in counterparties having more exposure to bets on market movement (i.e., positive gamma) which they will hedge in a way that reduces market movement (i.e., buy weakness or sell strength in the underlying stock). So, if traders bet against the movement, resulting in more counterparty positive gamma, then market movement is reduced due to the reaction to this positioning.
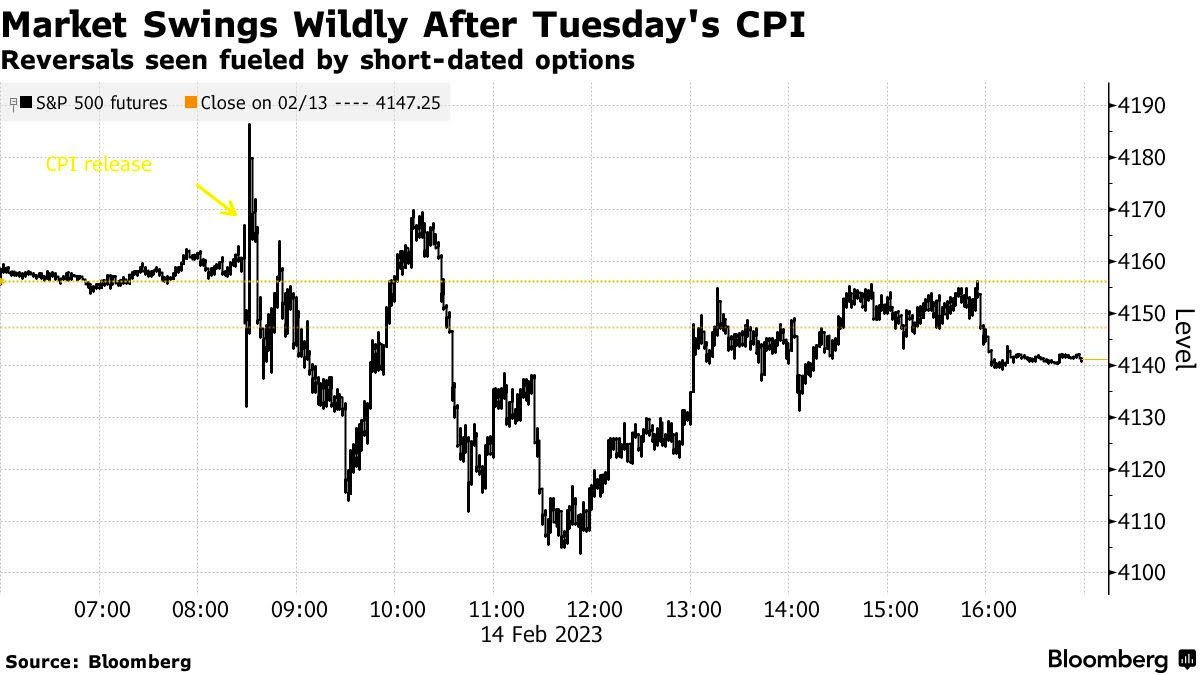
On the other hand, if traders’ consensus is that markets may move a lot, particularly to the downside, their bets on market movement (e.g., buy ultra-short-dated put) will result in counterparties having more exposure to bets against market movement (i.e., negative gamma). This demand for protection will bid options prices, particularly at the front-end of the IVOL term structure as counterparties price this demand in, and the counterparty will sell underlying to hedge. If fears are assuaged and traders no longer demand these bets on market movements, the counterparty can unwind their hedge which, in the put buying example provided, may provide a market boost, such as that which we saw immediately following the release of consumer price updates (CPI) this week; to quote Bloomberg, “[w]hen the worst didn’t happen, these hedges were unwound, helping propel a recovery in futures. It’s partly why the Cboe Volatility Index, or VIX, dropped 7% in a seemingly outsize reaction in a market when the S&P 500 ended the session basically flat.”
Additionally, the re-hedging-inspired recovery was short-lived as well; the impact of ultra-short-dated options, as this letter has stated before, is short-dated. It, too, does much less to influence measures like the Cboe Volatility Index (INDEX: VIX), a floating measure of ~30 day-to-expiry SPX options trading at a fixed-strike IVOL, though it does have an impact. Thus, the dis-interest to hedge stocks traders do not own (or hedge further stocks that may be hedged) out in time, does less to boost the VIX.
Anyways, in January, your letter writer interviewed The Ambrus Group’s co-CIO Kris Sidial about major risks to markets in 2023, as well as reasons why volatility could outperform in 2023 and beyond. Some of the information in that Benzinga interview made it into this newsletter in the days following its release.
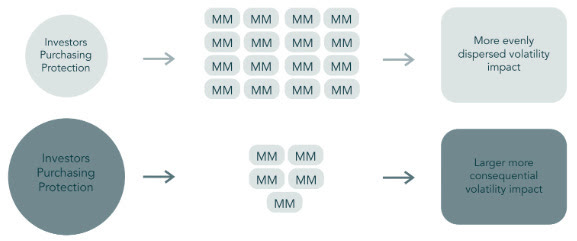
Basically, the SPX and VIX complexes are growing and, on the other side, are a small concentrated group of market makers taking on far more exposure to risk.
Graphic: Retrieved from Ambrus’ publicly available research.
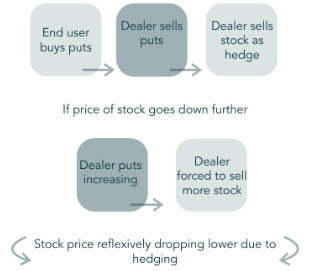
During moments of stress, as we’ve seen in the past with GME for example, options counterparties may be unable to keep up with the demands of investors, so you get a reflexive dynamic that helps push the stock higher. “That same dynamic can happen on the way down”; counterparties will mark up options prices during intense selling. As the options prices rise, options deltas (i.e., their exposure to direction) rise and this prompts so-called bearish vanna counterparty hedging flows in the underlying.
“Imagine a scenario where [some disaster happens] and everybody starts buying 0 DTE puts. That’s going to reflexively drive the S&P lower,” Sidial said. “Take, for example, the JPMorgan collar position that clearly has an effect on the market, and people are starting to understand that effect. That’s just one fund. Imagine the whole derivative ecosystem” leaning one way.
Graphic: Retrieved from Ambrus’ publicly available research.
Well, that’s what JPM’s Marko Kolanovic just said is a major risk and could exacerbate market volatility. “While history doesn’t repeat, it often rhymes,” he explained, noting that the trade of ultra-short-dated options portends a Volmageddon 2.0. If you recall, in 2018, Volmageddon 1.0 turned successful long-running short-volatility trades on their head when traders who were betting against big movements in the market saw their profits erode in days.
Further, to conclude this section since your letter writer is running short on time, as Sidial said, “if you’re trading volatility, let there be an underlying catalyst for doing so.” From a “risk-to-reward perspective, … it’s a better bet to be on the long volatility side,” given “that there are so many things that … keep popping up” from a macro perspective. Check out our letters from the past weeks where we talked about protecting profits (e.g., sell call vertical to finance and buy a put vertical with a lot of time to expiry).
For Ambrus’ publicly available research, click here. Also, follow Sidial on Twitter, here. Consider reading your letter writer’s past two conversations with Sidial, as well. Here is an article on 2021 and the meme stock debacle. Here is another article talking more about Ambrus’ processes.
Technical
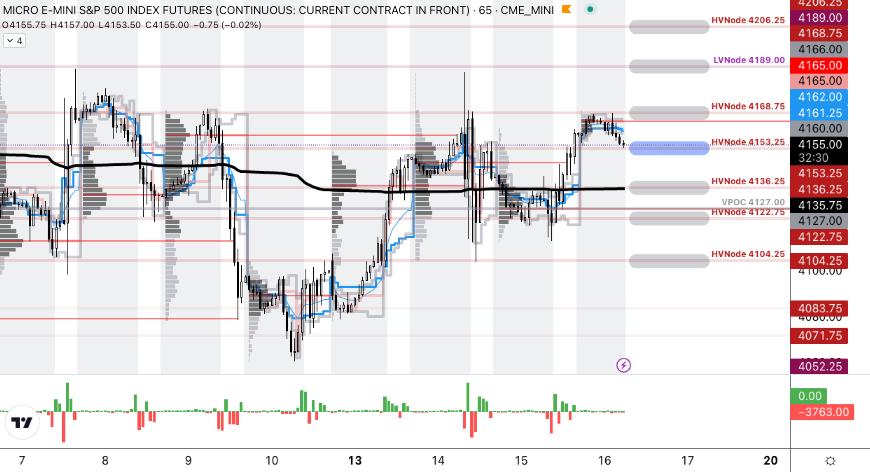
As of 6:15 AM ET, Thursday’s regular session (9:30 AM – 4:00 PM ET), in the S&P 500, is likely to open in the lower part of a balanced overnight inventory, inside of the prior day’s range, suggesting a limited potential for immediate directional opportunity.
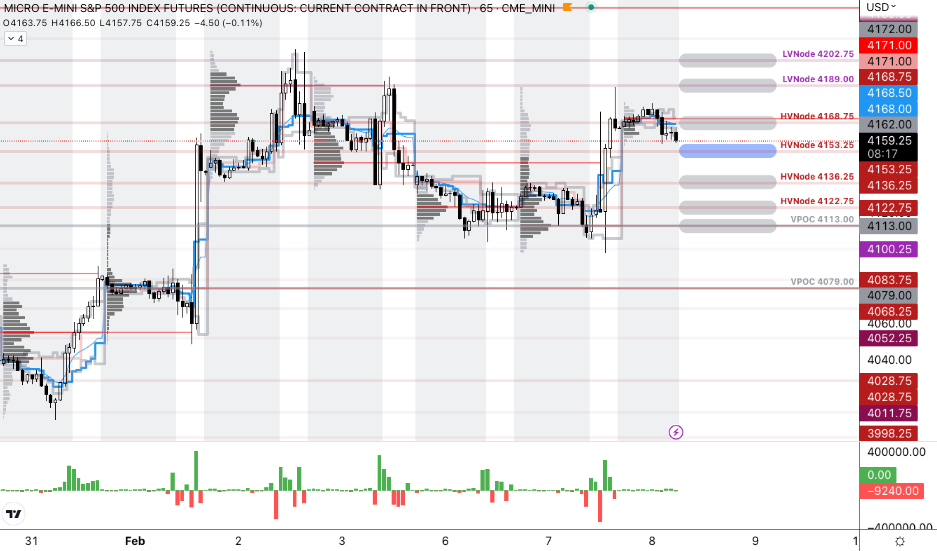
The S&P 500 pivot for today is $4,153.25.
Key levels to the upside include $4,168.75, $4,189.00, and $4,206.25.
Key levels to the downside include $4,136.25, $4,122.75, and $4,104.25.
Disclaimer: Click here to load the updated key levels via the web-based TradingView platform. New links are produced daily. Quoted levels likely hold barring an exogenous development.
Graphic: 65-minute profile chart of the Micro E-mini S&P 500 Futures.
Definitions
Volume Areas: Markets will build on areas of high-volume (HVNodes). Should the market trend for a period of time, this will be identified by a low-volume area (LVNodes). The LVNodes denote directional conviction and ought to offer support on any test.
If participants auction and find acceptance in an area of a prior LVNode, then future discovery ought to be volatile and quick as participants look to the nearest HVNodes for more favorable entry or exit.
POCs: Areas where two-sided trade was most prevalent in a prior day session. Participants will respond to future tests of value as they offer favorable entry and exit.
About
The author, Renato Leonard Capelj, works in finance and journalism.
Capelj spends the bulk of his time at Physik Invest, an entity through which he invests and publishes free daily analyses to thousands of subscribers. The analyses offer him and his subscribers a way to stay on the right side of the market. Separately, Capelj is an options analyst at SpotGamma and an accredited journalist.
Physik Invest’s Daily Brief is read by thousands of subscribers. You, too, can join this community to learn about the fundamental and technical drivers of markets.
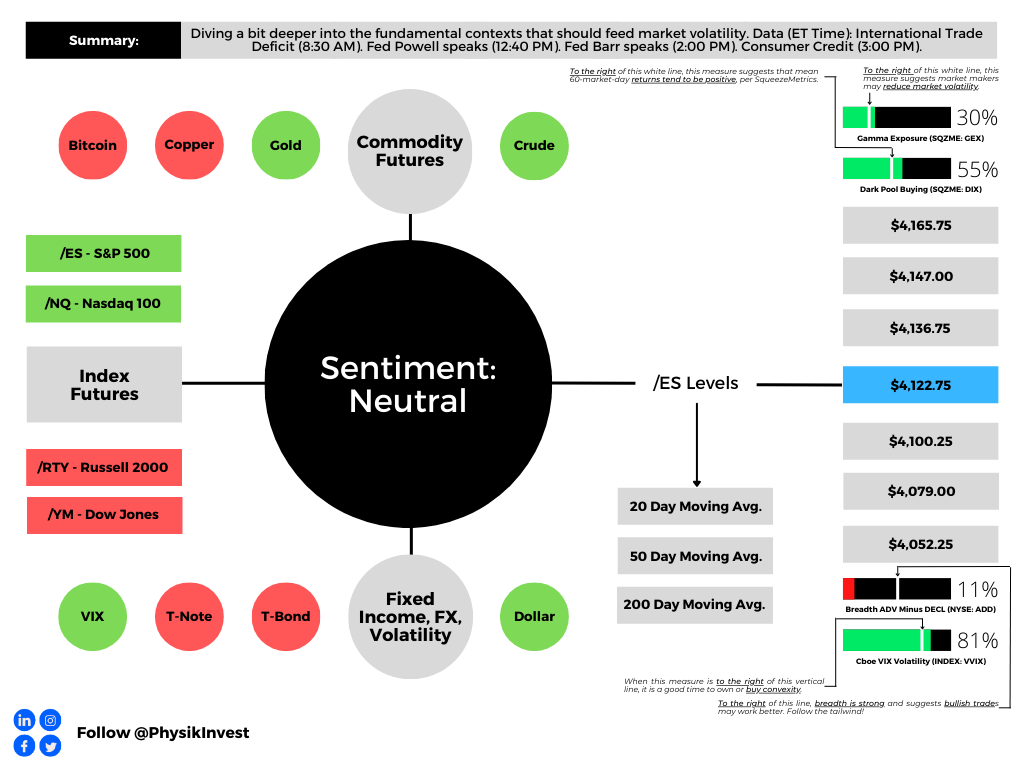
Graphic updated 6:50 AM ET. Sentiment Neutral if expected /ES open is inside of the prior day’s range. /ES levels are derived from the profile graphic at the bottom of this letter. Click here for the latest levels. SqueezeMetrics Dark Pool Index (DIX) and Gamma (GEX) with the latter calculated based on where the prior day’s reading falls with respect to the MAX and MIN of all occurrences available. A higher DIX is bullish. At the same time, the lower the GEX, the more (expected) volatility. Click to learn the implications of volatility, direction, and moneyness. Breadth reflects a reading of the prior day’s NYSE Advance/Decline indicator. The CBOE VIX Volatility Index (INDEX: VVIX) reflects the attractiveness of owning volatility. Backed by popular demand, mortgage rates are rising; 30 Yr. Fixed ~6.45%.
Positioning
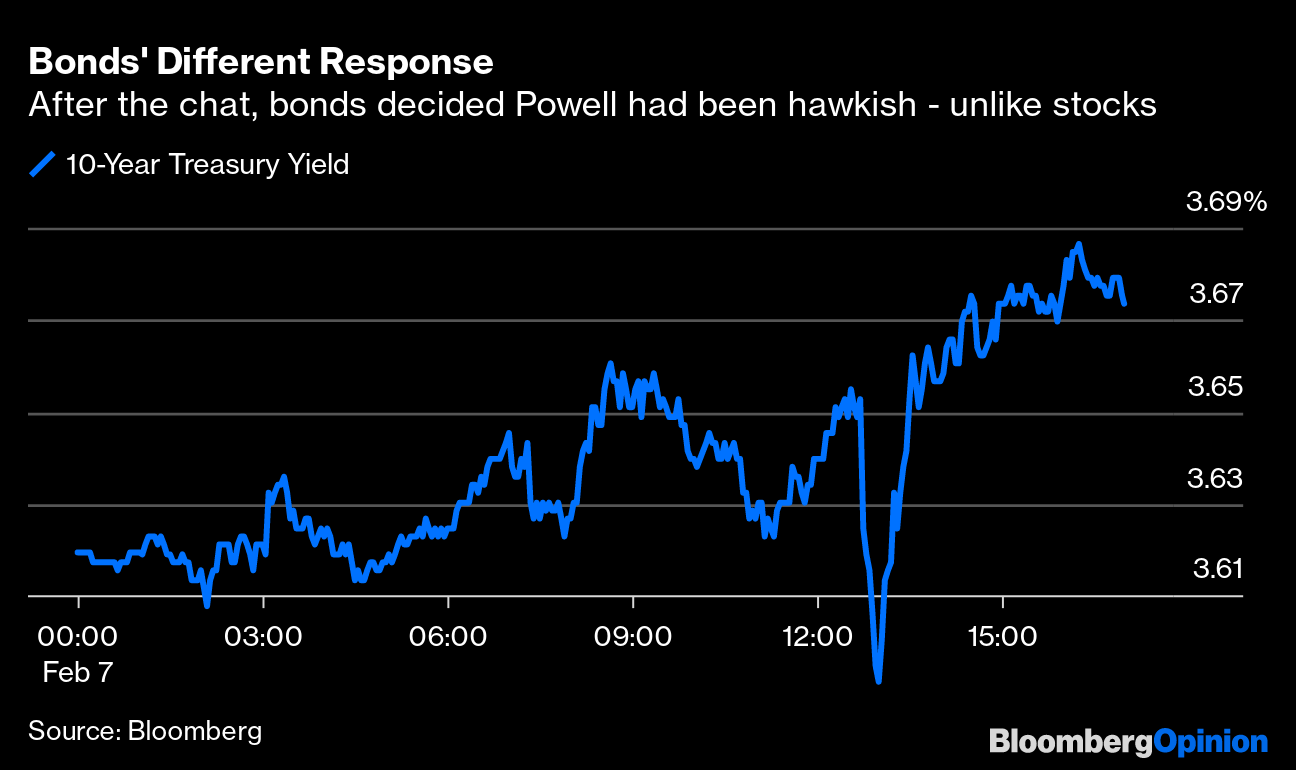
The S&P 500 (INDEX: SPX) closed higher yesterday despite the Federal Reserve’s (Fed) Jerome Powell warning rates would stay higher for longer.
According to an analysis by Interactive Brokers Group Inc’s (NASDAQ: IBKR), “it was clear that there were algos programmed to buy if [Powell] mentioned ‘disinflation.’ When [Powell] said the secret word, off we went.”
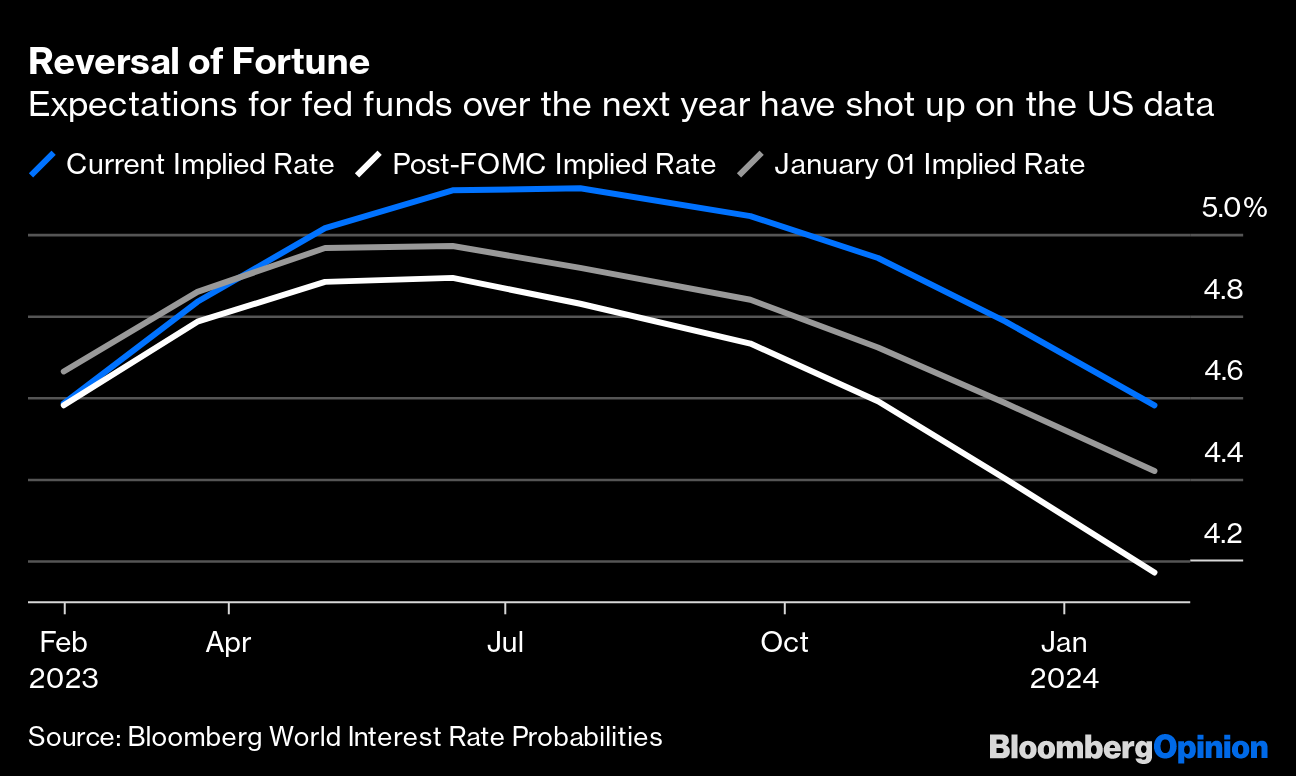
Graphic: Retrieved from Bloomberg. According to Bloomberg Economics’ Anna Wong, “The jobs surprise confirmed his message from the post-FOMC presser message that disinflation has barely begun and there’s still a long way to go. It seems clear he hasn’t shifted his views based on that gangbuster report alone.”
Implied volatility (IVOL) compression, as evidenced by shifts lower in the IVOL term structure and measures like the Cboe Volatility Index (INDEX: VIX) declining, was a booster, as was the trade of ultra-short-dated call options.
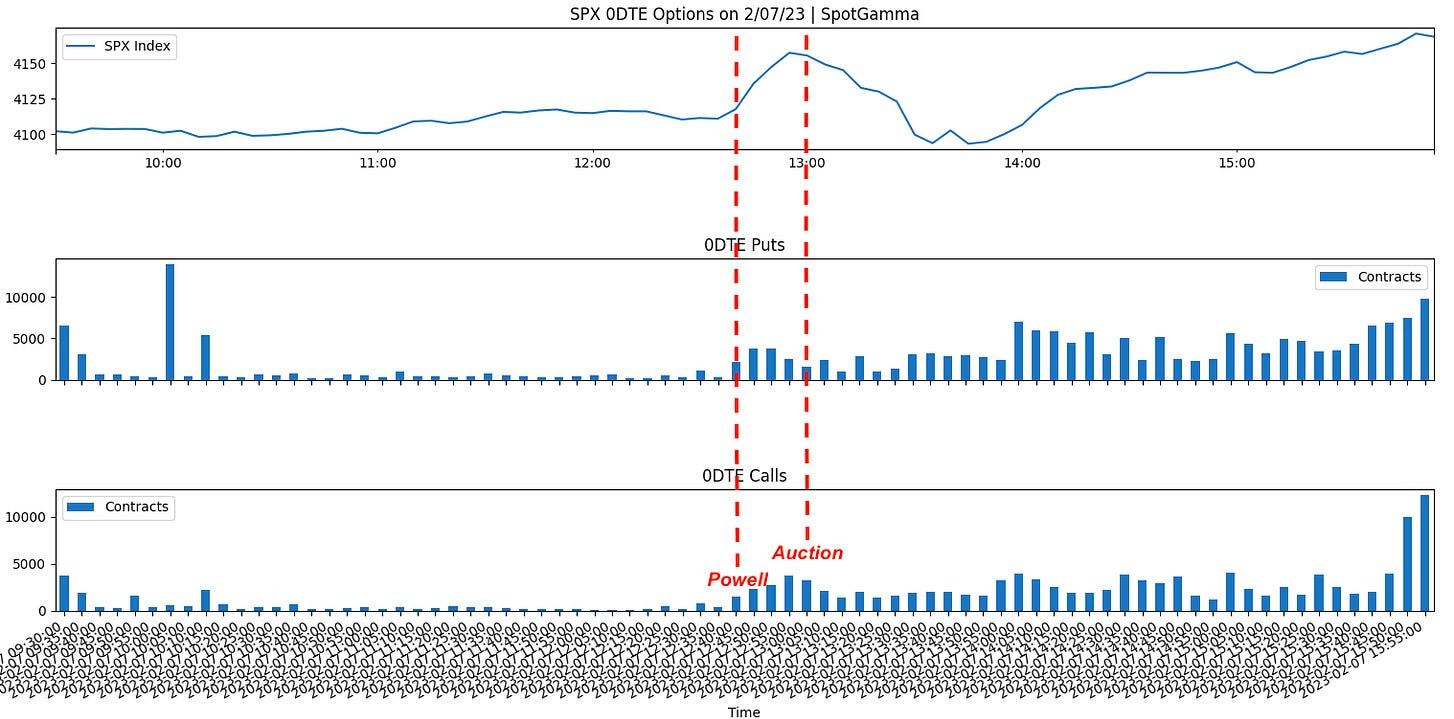
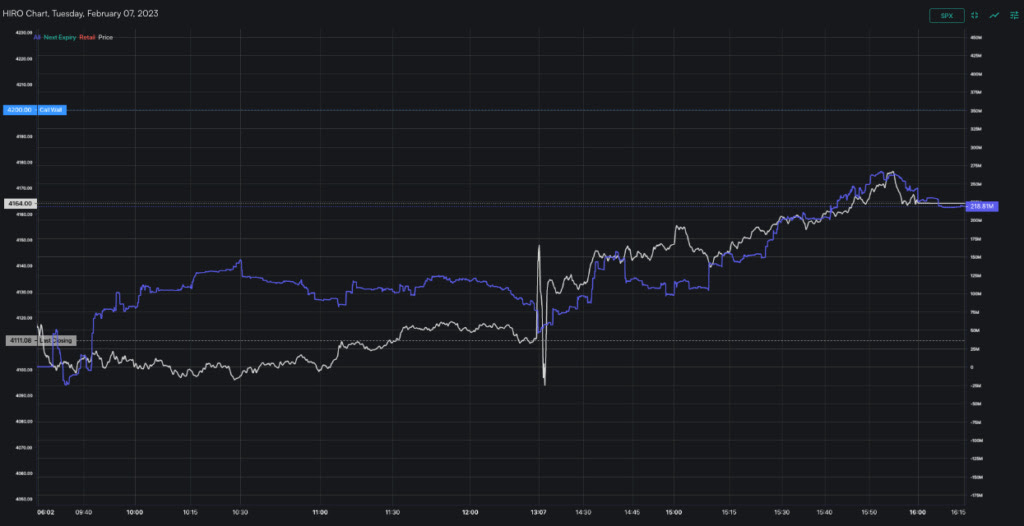
Graphic: Retrieved from SpotGamma on 2/7/2023. “[T]raders hit the bid after Powells “punt”. Stocks then violently flipped at 4165 (SPY 415) with heavy selling after a bad 1pm ET treasury action, only to go aggressively bid off of 4100 into end of day.”
SpotGamma’s HIRO indicator showed positive delta call buying and put selling. This indicator validates the belief that IVOL compression catalyzed a rally and that follow-on strength came from traders’ demand for call options. In instances of put selling and call buying, counterparties hedge by buying underlying stocks and futures.
One way to think about what’s going on is to recall that for options to keep their value, something unexpected has to happen. When nothing unexpected happens, from a trader’s perspective, what’s the value-add of continuing to own put options, for instance? So, you sell and pressure IVOL. Consequently, dealers, who are short puts declining in value, buy back some of their short stock and/or futures hedges, and this is supportive for the market.
Graphic: Retrieved from SpotGamma’s HIRO for the S&P 500 (INDEX: SPX) on 2/7/2023.
The bullish impact of this options activity, taken alone, is not long-lasting.
In the Daily Brief for February 3, 2023, we discussed the impact of this activity, all else equal; as time passes and/or volatility falls, the counterparties’ reaction to long call options, for example, declining in value is to sell some of the stock and futures they own as hedges. This can resist traders’ attempts to explore higher prices.
To close, it continues to make sense to position in structures that take advantage of still low longer-dated S&P 500 (INDEX: SPX) IVOL. For instance, traders can consider selling rich call verticals to finance put verticals expiring months from now.
In our recent commentaries, we reasoned why such structures are priced the way they are. Should market pressures surface, that’s a simple way to protect profits.
Technical
As of 6:50 AM ET, Wednesday’s regular session (9:30 AM – 4:00 PM ET), in the S&P 500, is likely to open in the lower part of a balanced overnight inventory, inside of the prior day’s range, suggesting a limited potential for immediate directional opportunity.
The S&P 500 pivot for today is $4,153.25.
Key levels to the upside include $4,168.75, $4,189.00, and $4,202.75.
Key levels to the downside include $4,136.25, $4,122.75, and $4,113.00.
Disclaimer: Click here to load the updated key levels via the web-based TradingView platform. New links are produced daily. Quoted levels likely hold barring an exogenous development.
Graphic: 65-minute profile chart of the Micro E-mini S&P 500 Futures.
Definitions
Volume Areas: Markets will build on areas of high-volume (HVNodes). Should the market trend for a period of time, this will be identified by a low-volume area (LVNodes). The LVNodes denote directional conviction and ought to offer support on any test.
If participants auction and find acceptance in an area of a prior LVNode, then future discovery ought to be volatile and quick as participants look to the nearest HVNodes for more favorable entry or exit.
POCs: Areas where two-sided trade was most prevalent in a prior day session. Participants will respond to future tests of value as they offer favorable entry and exit.
About
The author, Renato Leonard Capelj, works in finance and journalism.
Capelj spends the bulk of his time at Physik Invest, an entity through which he invests and publishes free daily analyses to thousands of subscribers. The analyses offer him and his subscribers a way to stay on the right side of the market. Separately, Capelj is an options analyst at SpotGamma and an accredited journalist.
Physik Invest’s Daily Brief is read by thousands of subscribers. You, too, can join this community to learn about the fundamental and technical drivers of markets.
Graphic updated 7:00 AM ET. Sentiment Neutral if expected /ES open is inside of the prior day’s range. /ES levels are derived from the profile graphic at the bottom of this letter. Click here for the latest levels. SqueezeMetrics Dark Pool Index (DIX) and Gamma (GEX) with the latter calculated based on where the prior day’s reading falls with respect to the MAX and MIN of all occurrences available. A higher DIX is bullish. At the same time, the lower the GEX, the more (expected) volatility. Click to learn the implications of volatility, direction, and moneyness. Breadth reflects a reading of the prior day’s NYSE Advance/Decline indicator. The CBOE VIX Volatility Index (INDEX: VVIX) reflects the attractiveness of owning volatility.
Fundamental
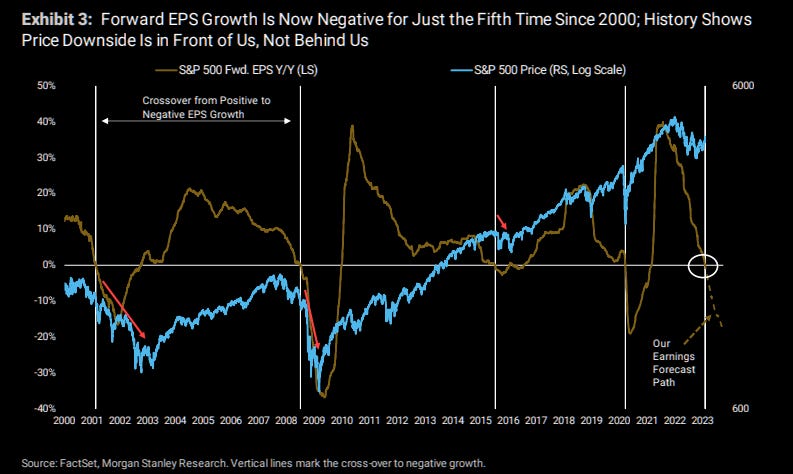
In late December 2022, this letter unpacked the likelihood that concerns over inflation were overblown. Strength in markets would re-appear despite earnings deterioration.
Graphic: Retrieved from Morgan Stanley (NYSE: MS) via The Market Ear.
“If the market sniffs out an inflation-driven pause or a pivot from the Fed, even before a drawdown in risk assets is seen, we may get a disinflation rally,” this letter quoted Andreas Steno Larsen explaining. Accordingly, when the Fed upped its benchmark rate by 25 basis points last week and chairman Jerome Powell appeared “not ‘overly combative,” traders turned ultra-optimistic and levered up.
Notwithstanding, the Damped Spring’s Andy Constan believes that pressures are set to remain strong. Traders are pricing higher rates for longer after some new data last week, and the flow of capital, out of capital markets (via quantitative tightening or QT), will be a strong headwind.
Fabian Wintersberger added that if central banks, indeed, are “more restrictive for longer to dampen the pressure of rising consumer prices, … [this] supports the thesis that stocks and bonds will have to fall … [leading] to a demand shift, back from financial markets into the real economy, … [and] the current consumer price disinflation is probably just an injury break before we see the real slowdown between inflation and central banks next year.” Consequently, the double-top inflation playbook appears intact, and volatility in financial markets is likely to persist.
Positioning
Late last week, this letter talked about data that pointed to weaker returns over a 5- to 10-day window. This was, in part, the result of short-dated options activity. After implied volatility (IVOL) compression helped catalyze a rally, SpotGamma, noted that traders’ open interest at slightly higher S&P 500 (INDEX: SPX) prices, and associated counterparty hedging, would likely result “in range suppression or pressure” as time passes and volatility falls. Why? Well, if a long call option’s probability of having value at expiration falls, the counterparty’s risk falls as well and, so, they can sell some of their hedges. This is market pressure.
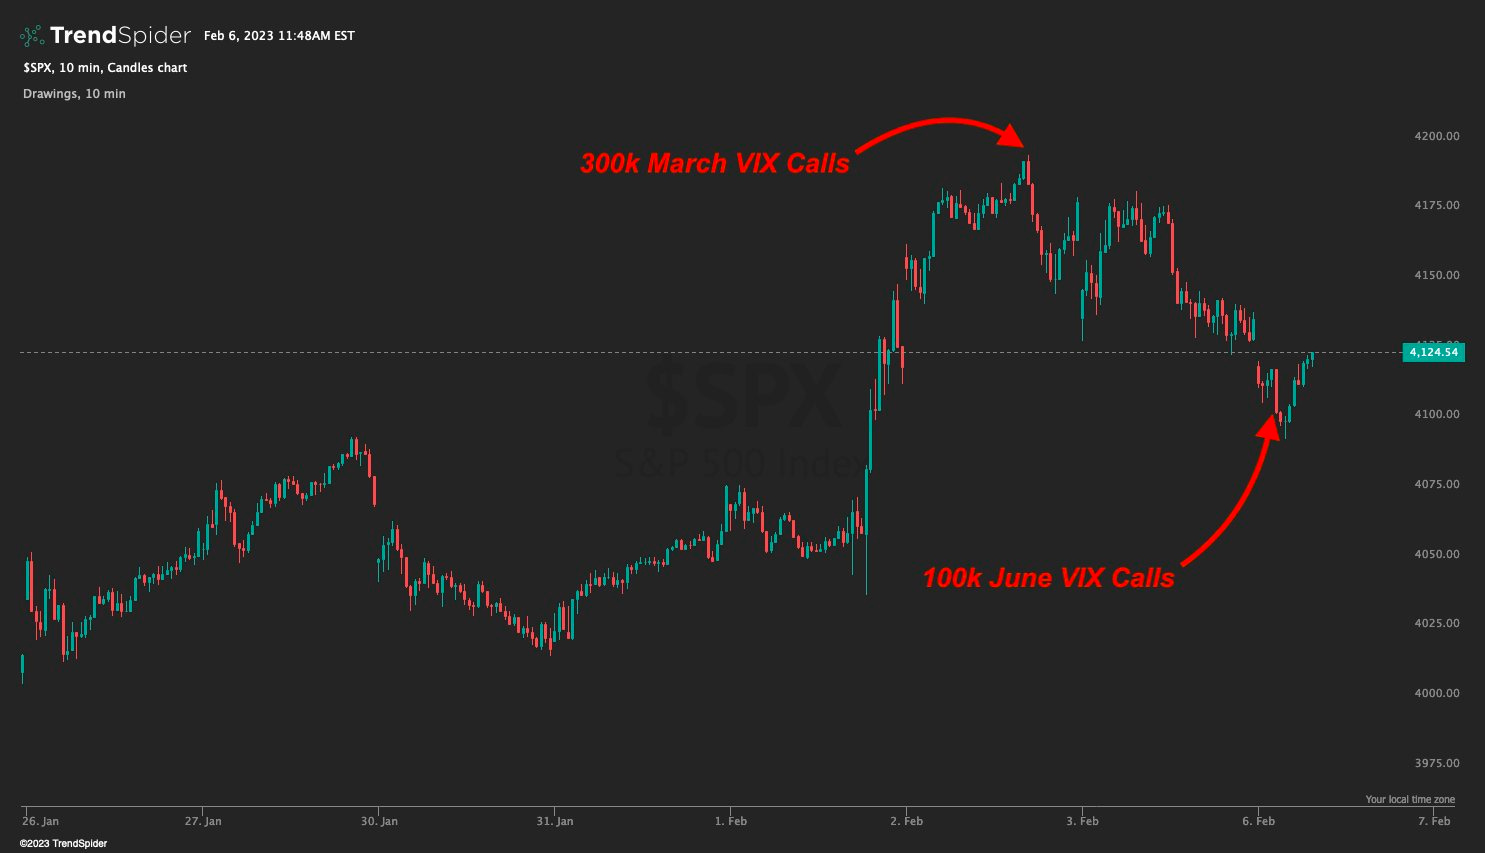
Anyways, SpotGamma added, yesterday, that “pressure surfaced just when the … data said it was most likely to surface. This appears coincidental, however … [as] the SPX drops began during the first round of [some] VIX [trades]. Some traders entered into 300,000 VIX March 24 and 26 strike calls. The selling accelerated into Monday when nearly 122,000 VIX June 30/40 call spreads fired off. Dealers who may be short VIX calls are likely hedged with VIX futures (or other long volatility hedges). This hedging is market pressure.”
Graphic: Retrieved from SpotGamma’s PM Note on 2/6/2023.
If you’re playing for expansive moves, an attractive way to protect portfolios includes selling rich call verticals to finance put verticals with months left before expiration.
Technical
As of 7:00 AM ET, Tuesday’s regular session (9:30 AM – 4:00 PM ET), in the S&P 500, is likely to open in the middle part of a balanced overnight inventory, inside of the prior day’s range, suggesting a limited potential for immediate directional opportunity.
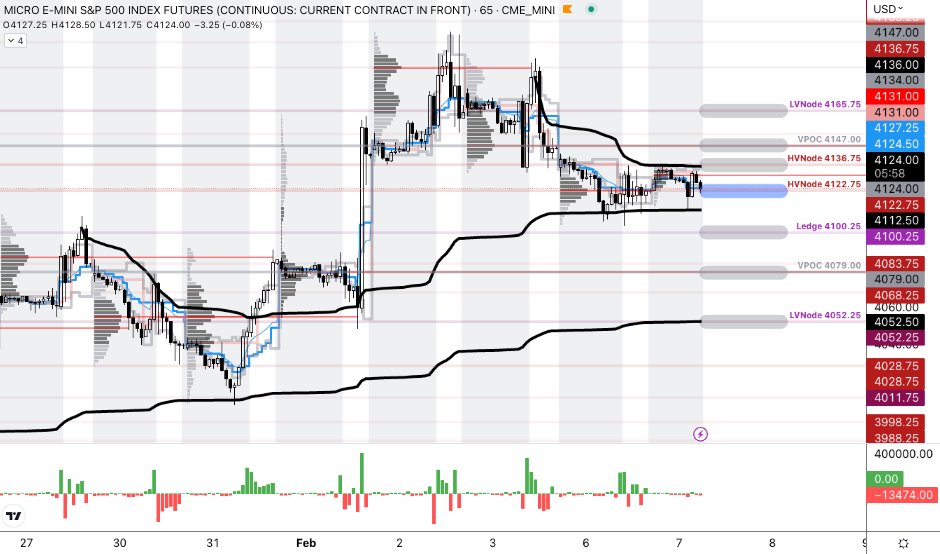
The S&P 500 pivot for today is $4,122.75.
Key levels to the upside include $4,136.75, $4,147.00, and $4,165.75.
Key levels to the downside include $4,100.25, $4,079.00, and $4,052.25.
Disclaimer: Click here to load the updated key levels via the web-based TradingView platform. New links are produced daily. Quoted levels likely hold barring an exogenous development.
Graphic: 65-minute profile chart of the Micro E-mini S&P 500 Futures.
Definitions
Volume Areas: Markets will build on areas of high-volume (HVNodes). Should the market trend for a period of time, this will be identified by a low-volume area (LVNodes). The LVNodes denote directional conviction and ought to offer support on any test.
If participants auction and find acceptance in an area of a prior LVNode, then future discovery ought to be volatile and quick as participants look to the nearest HVNodes for more favorable entry or exit.
POCs: Areas where two-sided trade was most prevalent in a prior day session. Participants will respond to future tests of value as they offer favorable entry and exit.
About
The author, Renato Leonard Capelj, works in finance and journalism.
Capelj spends the bulk of his time at Physik Invest, an entity through which he invests and publishes free daily analyses to thousands of subscribers. The analyses offer him and his subscribers a way to stay on the right side of the market. Separately, Capelj is an options analyst at SpotGamma and an accredited journalist.
Physik Invest’s Daily Brief is read by thousands of subscribers. You, too, can join this community to learn about the fundamental and technical drivers of markets.
Graphic updated 8:00 AM ET. Sentiment Neutral if expected /ES open is inside of the prior day’s range. /ES levels are derived from the profile graphic at the bottom of this letter. Click here for the latest levels. SqueezeMetrics Dark Pool Index (DIX) and Gamma (GEX) with the latter calculated based on where the prior day’s reading falls with respect to the MAX and MIN of all occurrences available. A higher DIX is bullish. At the same time, the lower the GEX, the more (expected) volatility. Click to learn the implications of volatility, direction, and moneyness. Breadth reflects a reading of the prior day’s NYSE Advance/Decline indicator. The CBOE VIX Volatility Index (INDEX: VVIX) reflects the attractiveness of owning volatility.
Positioning
Markets think the Federal Reserve (Fed) raises its benchmark rate by 25 basis points. Notwithstanding the less aggressive hike, strategists believe the Fed will stay tougher on inflation for far longer and, accordingly, crush traders’ optimism.
“I suspect the Fed messaging tomorrow will push back against the pivot narrative and thereby current bond market pricing,” DoubleLine Capital CIO Jeffrey Gundlach said. Former investment banker and trader, as well as the president of the Minneapolis Fed, Neel Kashkari warned the Fed is set on finishing the job and cutting inflation, even if it costs millions of Americans their jobs. “I’ve spent enough time around Wall Street to know that they are culturally, institutionally, optimistic,” he said.
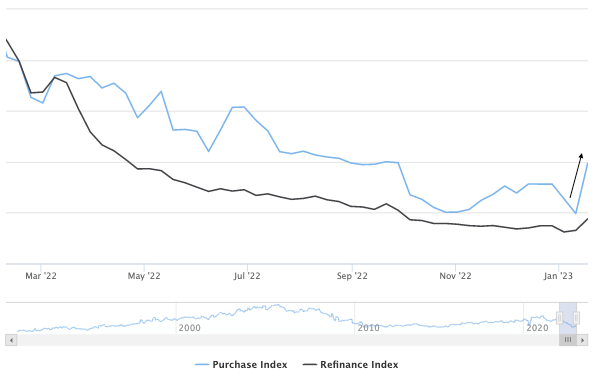
Further, relief in markets (e.g., stocks, housing) is a boon for asset owners and may enable companies to raise cash, bid up equipment prices, and demand new hires.
Graphic: Retrieved from Mortgage News Daily. “A trend of [increasing] purchase applications implies home buyer demand is [increasing].” The prevailing narrative is that the Fed wants less inflation and less demand. This narrative’s been disrupted, in part. Recall our Monday letter talking about investors’ desire to put their cash to work and the demand for treasuries (i.e., bond bid and yield pressured) which forced investors into previously depressed assets.
With inflation still a problem, regardless of whether there are better solutions as we put forth in the January 31 letter, the Fed is looking to keep rates above 5% for the rest of 2023, though markets are pricing a pivot far earlier and at a lower rate.
Despite the expectation of toughness from the Fed, markets have not broken down. Rather, if we zoom out, they are trending sideways to higher and may continue to do so. That’s according to Kai Volatility’s Cem Karsan who says that implied volatility (IVOL) is heightened across options with very little time to expiry (1- to 3-days).
“Event vol, which is the pricing of one-, two-, and three-day options, is significantly higher than everything else behind it right now,” he said, noting that customers’ or traders’ demands for downside put protection is the culprit. That said, despite the committee’s recent hawkishness, “the market responded relatively well at those levels, and you’re seeing vol come back down.”
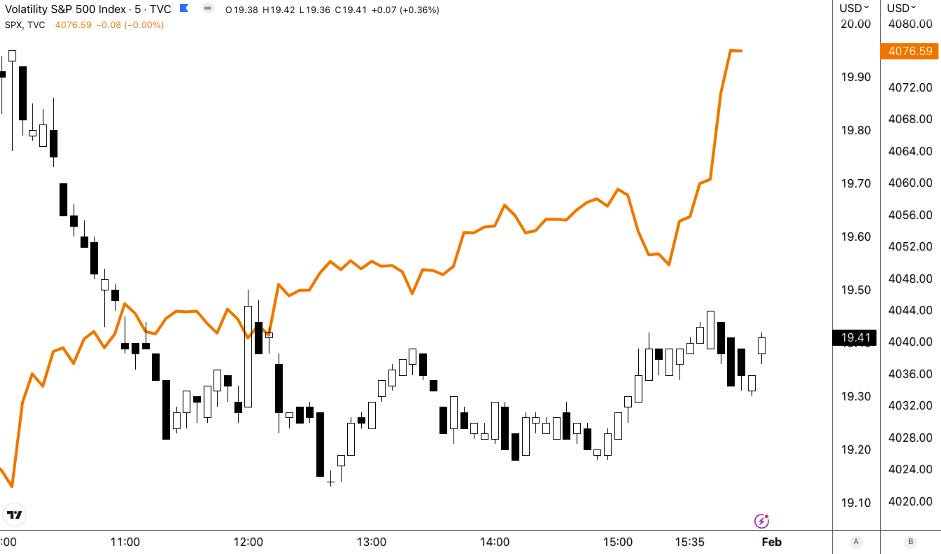
Graphic: Retrieved from TradingView. First included in SpotGamma’s PM Note for 1/31/2023. During Tuesday’s strength, measures of IVOL, such as the Cboe Volatility Index (INDEX: VIX) fell, though the VIX did not move lower in as sharp of a fashion that the S&P 500 (INDEX: SPX) traded higher. In fact, the VIX trended up into the close, after a mid-day bottom, suggesting some left-over hedging demands ahead of some important macroeconomic drivers this week.
“I think that’s kind of likely what you’re going to see, regardless of what the Fed does,” Karsan added. That’s because, barring some unexpected development, traders will not be able to justify the pricing of ultra-short-dated options post-Fed; the supply and expiry of short-dated options will coincide with the dealers or market makers who are short-stock against the puts they supplied buying back their hedges.
“Vol structurally affects how markets move. Puts are the way people hedge in the market and dealers are short the puts. If you have an event vol that comes down, those vanna and charm effects will naturally lead to a buyback,” post-Fed.
For context, vanna is the change in an options delta with respect to changes in IVOL. Charm is the change in an options delta with respect to changes in time. These are second-order derivatives of an option’s value, once to time or IVOL, and once to delta.
You might have heard the old #trading adage "never short a dull market", Cem Karsan @jam_croissant explains how some second order Greeks, vanna & charm, play a role in proving out that phrase. #Vol411pic.twitter.com/AMnd7kQQdA
As your letter writer explained in a SpotGamma analysis yesterday, we saw an interest to hedge heading into this week’s Fed announcement. This coincided with a slight rebound in measures like the Cboe VIX Volatility (INDEX: VVIX) (which, in general, reads low and suggests convexity is a good place to be), and put a damper on the rally, hence its climax on Friday.
Moreover, if “macroeconomic events do not disappoint, IVOL compression may provide markets a boost,” SpotGamma explained. “Notwithstanding, the marginal compression of heightened IVOL, because of its lower starting point, probably does less to encourage a longer-lasting rally,” hence the thought that, if there was to be relief post-Fed, it would likely last up until the mid-February monthly options expiration (OpEx). OpEx’s removal of traders’ options protection (as well as dealers’ supportive buyback to those options that were demanded), may leave the market at risk of bearish macro-type flows.
Compounding the risk is traders’ expected reaction in case of weakness. The desire to hedge during a drop would coincide with a re-pricing in IVOL dangerous to anyone who is short volatility, hence this letter’s recent focus on owning the S&P 500 (INDEX: SPX) via call butterflies and call ratio spreads, the sorts of trades that would benefit from an SPX and VIX up environment (the result of traders bidding up call options due to their fear of missing out, in the context of less liquidity to absorb those demands).
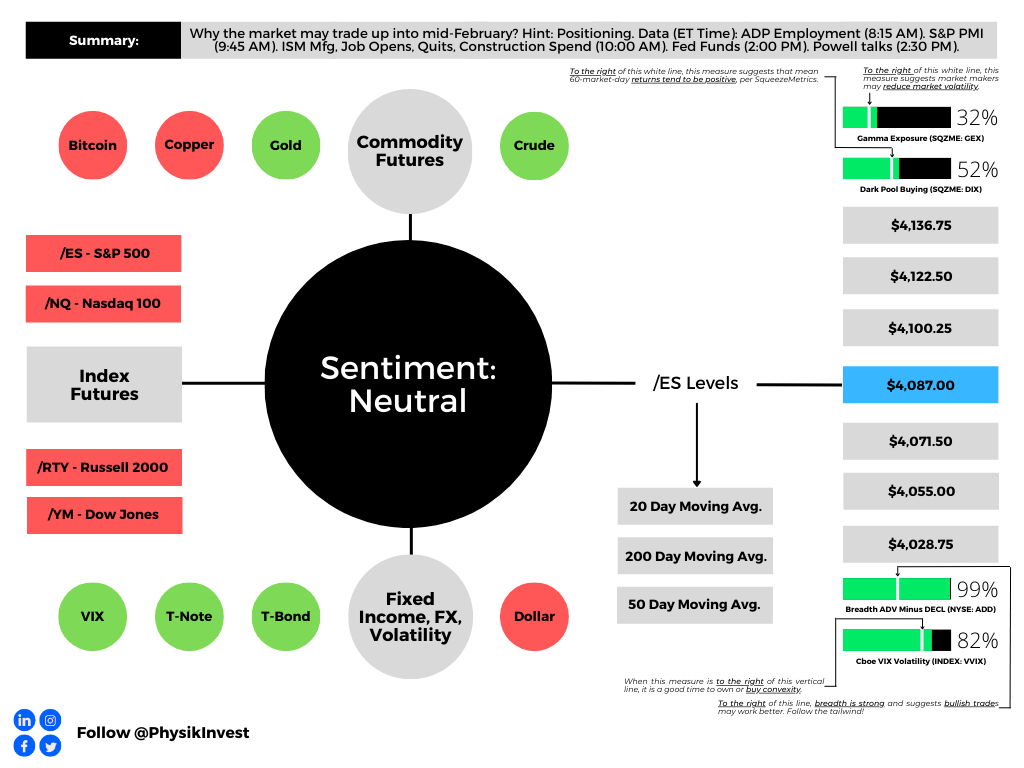
To summarize everything, we have the Fed rate decision coming up. After, markets will be volatile but more likely to trend higher into mid-February, bolstered by traders’ fears of missing out in the context of a lower liquidity environment, as well as stimulus (e.g., falling Treasury General Account played into an easing of financial conditions by making it easier for banks to lend and finance trading activities). After mid-February, the window for markets to weaken and accelerate to the downside may open, based on the information we have today.
As an aside, the last time the Nasdaq 100 (INDEX: NDX) was up more than 10% in January was in 2001, The Market Ear informed subscribers yesterday.
Graphic: Retrieved from BNP Paribas ADR (OTC: BNPQY) via The Market Ear.
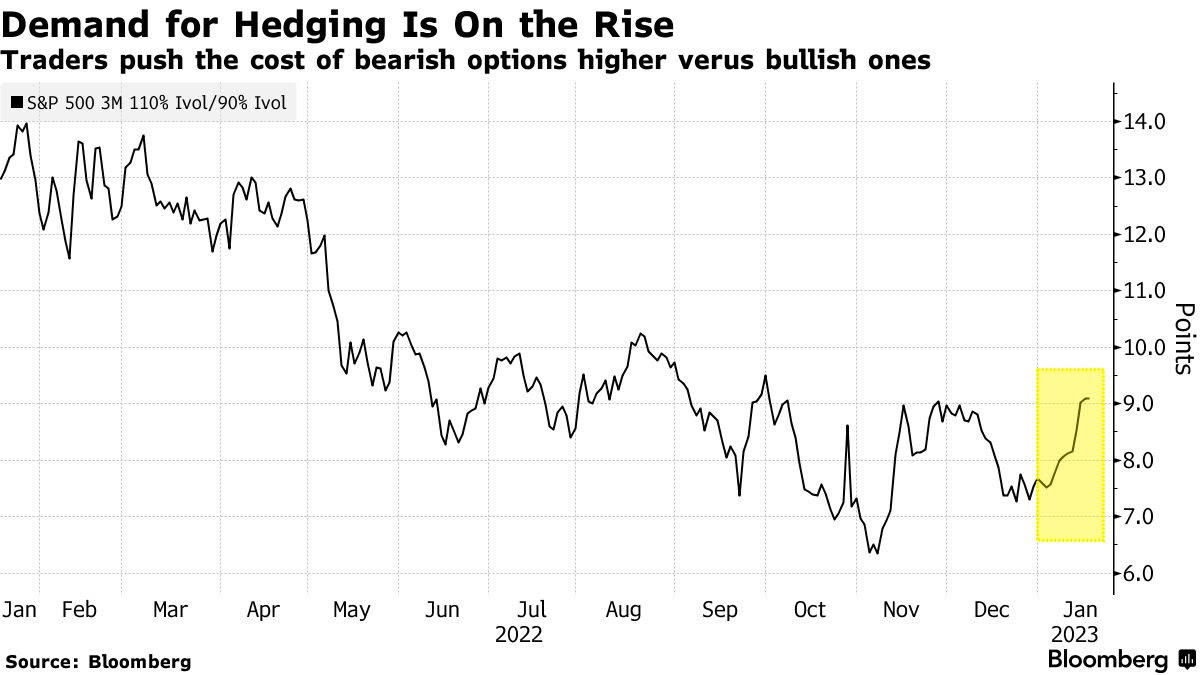
Should you wish to hedge, longer-dated SPX IVOL is cheap, relative to recent history.
Graphic: Retrieved from Bank of America Corporation (NYSE: BAC) via The Market Ear.
Finally, if you’re interested in following further along the fundamental conversation in Tuesday’s letter, check out Dr. Pippa Malmgren’s post on “ancient empires springing back to life.”
Technical
As of 8:00 AM ET, Wednesday’s regular session (9:30 AM – 4:00 PM ET), in the S&P 500, is likely to open in the middle part of a negatively skewed overnight inventory, inside of the prior range, suggesting a limited potential for immediate directional opportunity.
The S&P 500 pivot for today is $4,087.00.
Key levels to the upside include $4,100.25, $4,122.50, and $4,136.75.
Key levels to the downside include $4,071.50, $4,055.00, and $4,028.75.
Disclaimer: Click here to load the updated key levels via the web-based TradingView platform. New links are produced daily. Quoted levels hold weight barring an exogenous development.
Graphic: 65-minute profile chart of the Micro E-mini S&P 500 Futures.
Definitions
Volume Areas: Markets will build on areas of high-volume (HVNodes). Should the market trend for a period of time, this will be identified by a low-volume area (LVNodes). The LVNodes denote directional conviction and ought to offer support on any test.
If participants auction and find acceptance in an area of a prior LVNode, then future discovery ought to be volatile and quick as participants look to the nearest HVNodes for more favorable entry or exit.
POCs: Areas where two-sided trade was most prevalent in a prior day session. Participants will respond to future tests of value as they offer favorable entry and exit.
About
In short, Renato Leonard Capelj is an economics graduate working in finance and journalism.
Capelj spends most of his time as the founder of Physik Invest through which he invests and publishes daily analyses to subscribers, some of whom represent well-known institutions.
Separately, Capelj is an equity options analyst at SpotGamma and an accredited journalist interviewing global leaders in business, government, and finance.
Physik Invest’s Daily Brief is read by thousands of subscribers. You, too, can join this community to learn about the fundamental and technical drivers of markets.
Graphic updated 8:30 AM ET. Sentiment Neutral if expected /ES open is inside of the prior day’s range. /ES levels are derived from the profile graphic at the bottom of this letter. Levels may have changed since initially quoted; click here for the latest levels. SqueezeMetrics Dark Pool Index (DIX) and Gamma (GEX) with the latter calculated based on where the prior day’s reading falls with respect to the MAX and MIN of all occurrences available. A higher DIX is bullish. At the same time, the lower the GEX, the more (expected) volatility. Click to learn the implications of volatility, direction, and moneyness. Breadth reflects a reading of the prior day’s NYSE Advance/Decline indicator. VIX reflects a current reading of the CBOE Volatility Index (INDEX: VIX) from 0-100.
Positioning
Friends, please read the entire post.
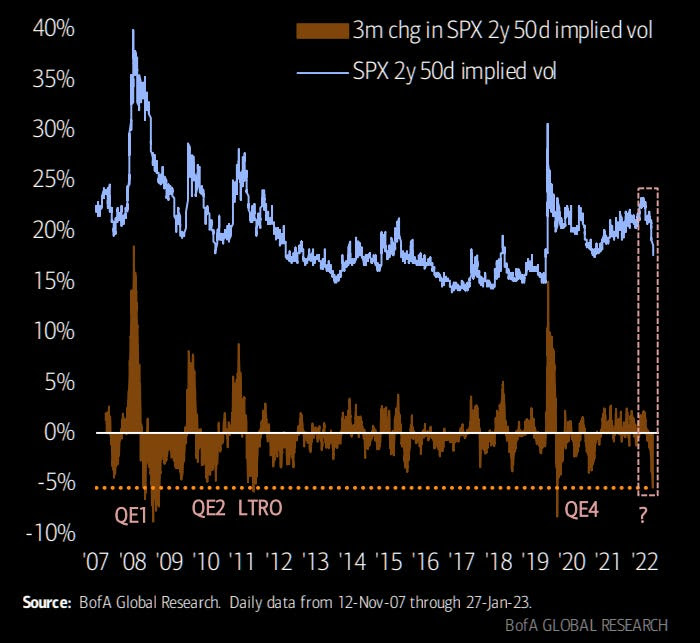
In the Daily Brief for December 21, 2022, this letter dissected some of the positioning contexts responsible for fixed-strike and top-line implied volatility (IVOL) measures’ downward trajectory with the S&P 500. Since this detailed letter was published, IVOL has increased, albeit not by a massive amount so to speak. The moves lower, coupled with the volatility skew not blowing out, have enabled your letter writer to monetize structures entered into while on travel for a nice return. Let’s talk about it, further.
Heading into consumer price (i.e., inflation) updates, as well as updates from the Federal Reserve on their commitment to stemming inflation, traders sought to protect against (or bet on) movement thereby bidding measures of IVOL.
To quote The Ambrus Group’s Kris Sidial, the “entire term structure was jacked going into CPI and FOMC.” Additionally, “granted nothing out of left field,” Sidial added, it would be tough “for December and January vol[atility] to remain bid.”
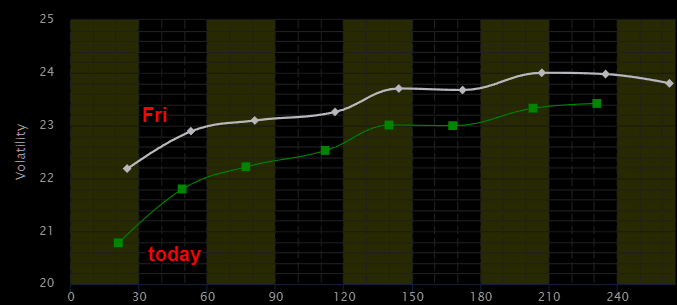
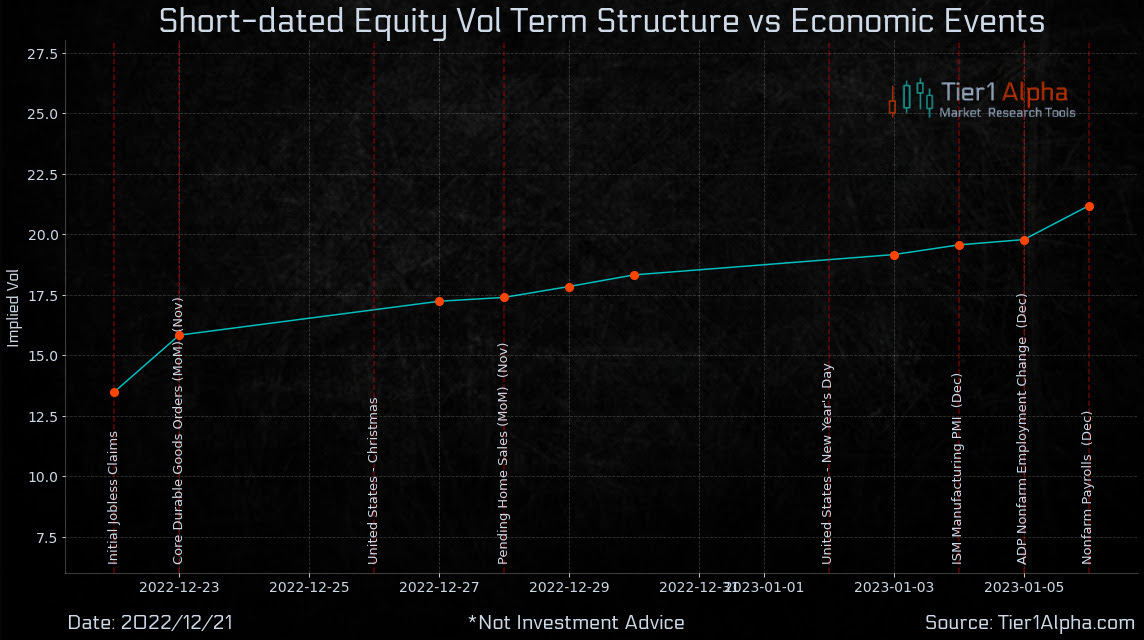
Graphic: IVOL term structure retrieved from Tier1Alpha.com.
Accordingly, after the CPI and FOMC, market concerns ebbed and traders’ supply of the options they demanded, particularly at the front-end of the curve, pushed the term structure back to an upward-sloping so-called contango.
Graphic: IVOL term structure retrieved from Tier1Alpha.com.
As was detailed in the December 21 letter, this dynamic following the release of CPI and FOMC would do a lot to keep IVOL and equity movement contained. Knowing this, your letter writer’s trading partner alerted him while on a trip of skew presenting some nice, zero-cost trades that would expand should the market trade lower and IVOL remain contained (i.e., volatility skew not blowing out).
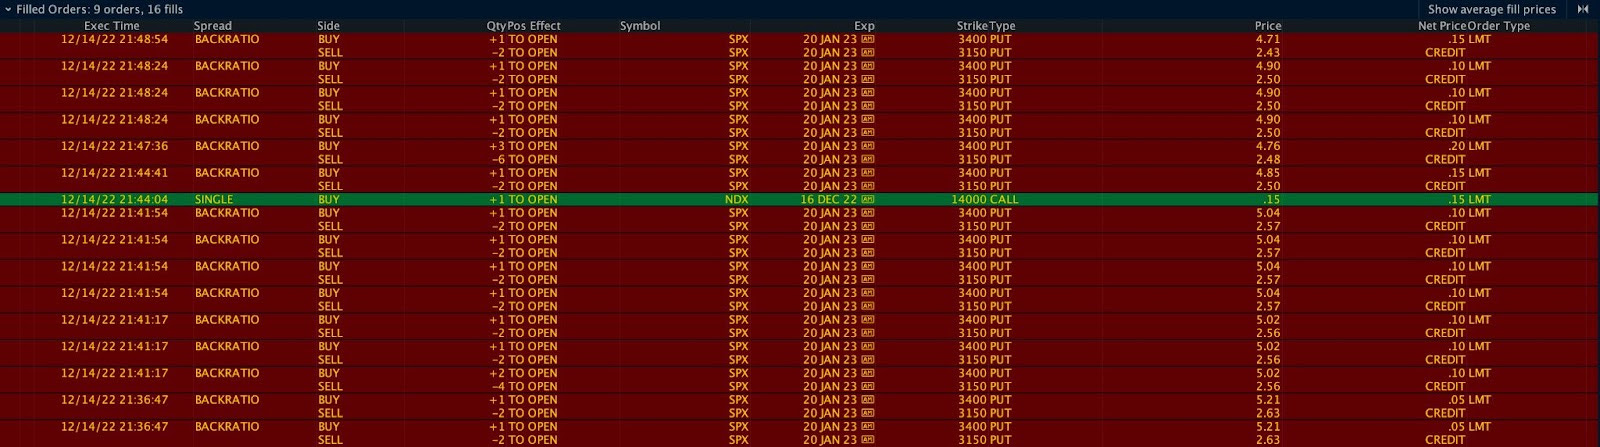
Upon analysis, entered was a simple +1 x -2 Put Ratio Spread (Trade Ticket: SOLD -1 1/2 BACKRATIO SPX 100 20 JAN 23 [AM] 3400/3150 PUT @.10) for a ~$10.00 credit before fees and commissions, a favorite of your letter writer’s.
Graphic: Filled orders on December 14, 2022.
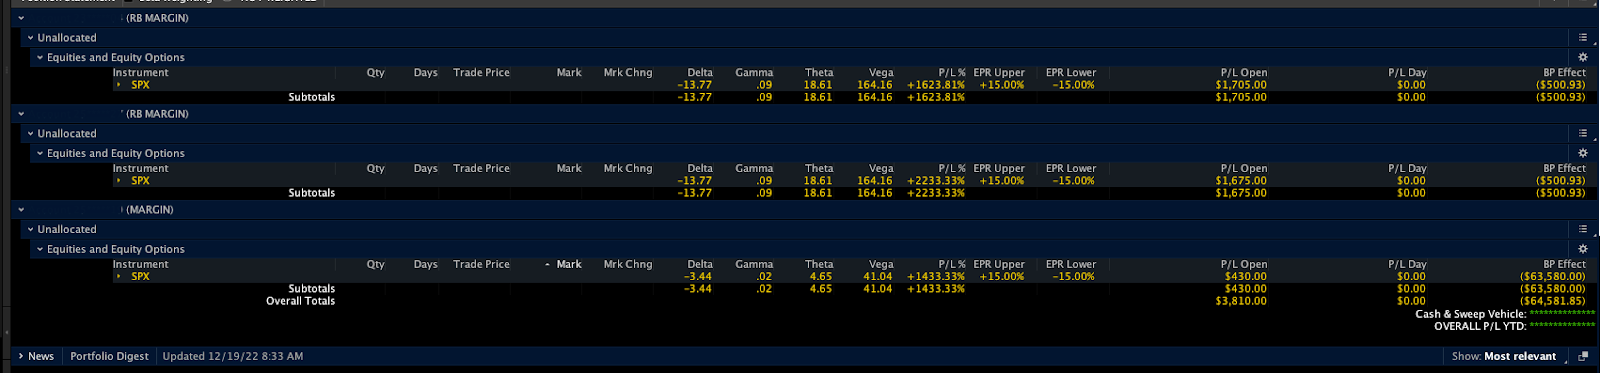
The trades provided exposure to -Delta (direction) and +Gamma (movement).
Graphic: Position statement on December 14, 2022. Using portfolio margin to lower BP Effect.
As an aside, from the start the Vega (sensitivity to changes in IVOL) was negative but, this has a lot to do with how far out the spread is on the chain and, should there be movement as you’re about to see, enabling the put leg you own to start kicking in, so to speak, Vega ends up turning positive very quickly, all else equal.
The below graphic, taken on December 19, prior to much of the spread being monetized, shows a large -Delta, +Gamma, and +Vega (i.e., if the market moves lower or IVOL rises, the spread is to rise in value), much like it did when the market traded down into the beginning of this week and IVOL rose into the end of this week.
Graphic: Position statement on December 19, 2022. Using portfolio margin to lower BP Effect.
For one account, 50% of the initial trade was closed for $205-220.00 in credit per spread. After this closure, the remaining structure, in this one account, was turned into a +2 x -5 Ratio. Why? In short, the market was strengthening and the odds of a large move lower were, in short, low. To have downside exposure but be paid for the initial effort, the conversion from a +4 x -8 to a +2 x -5 resulted in an additional $8.10 credit, leaving your letter writer with a -Delta, +Gamma, and +Vega, still.
Graphic: Trade history on December 23, 2022.
In the days after, the market turned and traded lower, far more than expected. Notwithstanding, the remaining structures (both +1 x -2 and +2 x -5) performed well, though the 2×5’s Vegas briefly turned negative on the sharp selling yesterday, which, if it had remained like that, would have solicited action (i.e., repositioning, closure, or hedging via correlated instrument).
Graphic: Working orders on December 23, 2022.
At the end of the day, what’s important to your letter writer, here, is how the spread prices if the market moves to it today, all else (e.g., time, IVOL, etc) remains equal. If the spread prices at a better price to close at the money, that’s a quick check that says: “Hey, your bet on the market moving lower actually makes money if the market moves lower, all else equal.”
To explain further, look at the working orders above. At current S&P 500 levels, the +1 x -2 prices for $215.00 credit to close. The Delta is negative, as desired, and both the Gamma and Vega are positive. If the spread was at the money, it prices for nearly a $4,500.00 credit to close as shown below.
Graphic: Pricing an order on December 23, 2022.
So, what now? Well, the exposure is really light and much of the structure was monetized. From here, if the market moves lower that would likely be good for the remaining structures. Any costs to enter have been covered and, at this point, the trade is a free bet on the downside.
Obviously, there are pieces not included in this trade dissection, today, including how to properly manage your greek risk, as well as size the position at entry. These are the secret sauces, so to speak, that will either make or break you in the long run.
Should you want more write-ups like this, comment below. Your letter writer attempts to make these updates as informative and engaging as possible. It’s tough, at times, given the dullness of the material. Separately, trading is not as hard as it’s all made out to be. Sure, you need to have a good read on markets (e.g., skew), but, as your letter writer has learned over the many years he’s been engaging with markets, the theory is nothing like practice. No formula will help you price and enter the correct trade structure in a fast-moving meme stock with IVOL blowing out.
If all could be automated, there would be no market. Markets are the product of human emotion. Avoid acting on theory, blindly. Price different structures, like the ones this letter has detailed, and observe how the different parts of the trade interact with each other as the market moves, IVOL moves, time passes, interest rates change, and so on.
For instance, you could have owned puts early in the week and still lost money as the market moved lower. If you would have leveraged a short leg against your long leg, then you could have offset the decay, as your letter writer did above.
There’s no substitute for time in the seat (e.g., you could have observed the -Vega at the entry on the trade structure above and not entered, missing out on the trade’s expansion. Time in the seat taught your letter writer better).
Don’t construe this letter’s simplicity as naivety, also. In the end, what’s your exposure to movement? If your bet is on movement, will you make money if the market moves? If not, find another trade structure or sit out.
Anyways, happy holidays to you and your closest. It’s been quite the year and I have a lot to be thankful for and reflect on. See you next week, most likely (though your letter writer’s burn-out may result in new publications being delayed until the new year).
Technical
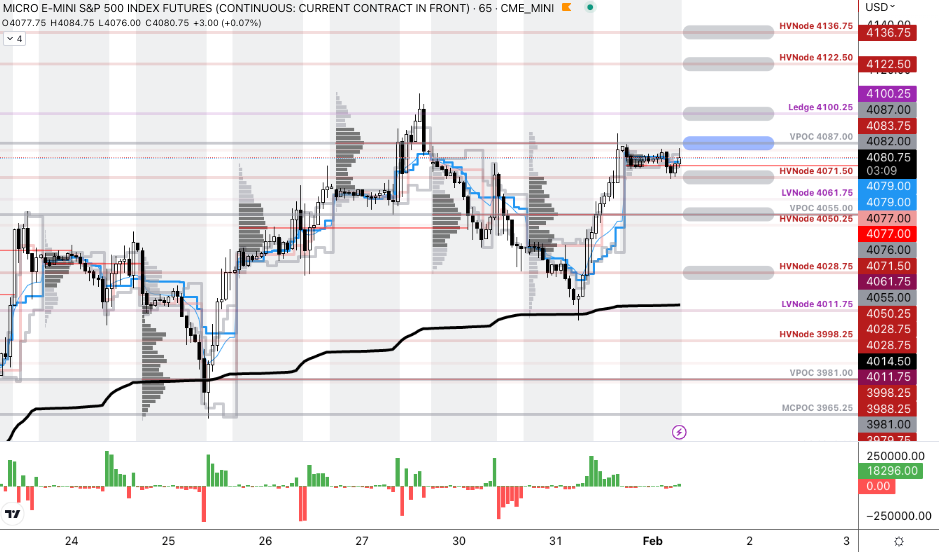
As of 8:20 AM ET, Friday’s regular session (9:30 AM – 4:00 PM ET), in the S&P 500, is likely to open in the upper part of a positively skewed overnight inventory, inside of prior-range and -value, suggesting a limited potential for immediate directional opportunity.
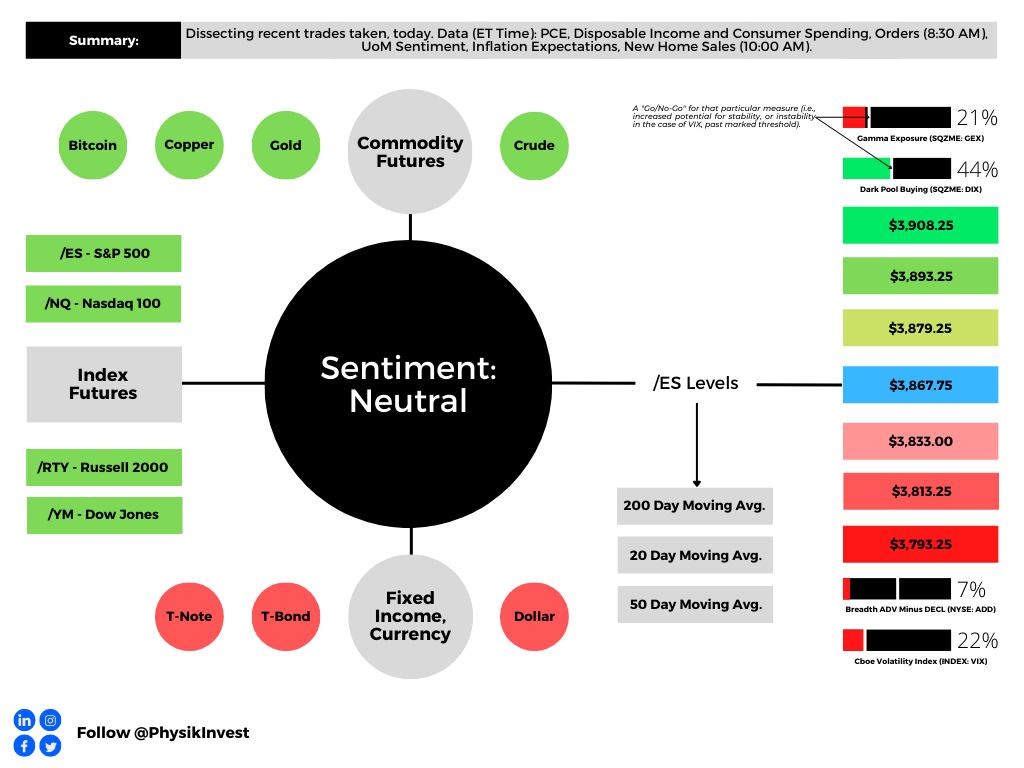
Our S&P 500 pivot for today is $3,867.75.
Key levels to the upside include $3,879.25, $3,893.75, and $3,908.25.
Key levels to the downside include $3,833.00, $3,813.25, and $3,793.25.
Click here to load today’s key levels into the web-based TradingView platform. All levels are derived using the 65-minute timeframe. New links are produced, daily.
Graphic: 65-minute profile chart of the Micro E-mini S&P 500 Futures.
Definitions
Volume Areas: Markets will build on areas of high-volume (HVNodes). Should the market trend for long periods of time, it will be identified by low-volume areas (LVNodes). LVNodes denote directional conviction and ought to offer support on any test.
If participants auction and find acceptance in an area of a prior LVNode, then future discovery ought to be volatile and quick as participants look to HVNodes for favorable entry or exit.
POCs: Denote areas where two-sided trade was most prevalent in a prior day session. Participants will respond to future tests of value as they offer favorable entry and exit.
MCPOCs: Denote areas where two-sided trade was most prevalent over numerous sessions. Participants will respond to future tests of value as they offer favorable entry and exit.
About
In short, an economics graduate working in finance and journalism.
Capelj spends most of his time as the founder of Physik Invest through which he invests and publishes daily analyses to subscribers, some of whom represent well-known institutions.
Separately, Capelj is an equity options analyst at SpotGamma and an accredited journalist interviewing global leaders in business, government, and finance.
Graphic updated 7:45 AM ET. Sentiment Neutral if expected /ES open is inside of the prior day’s range. /ES levels are derived from the profile graphic at the bottom of the following section. Levels may have changed since initially quoted; click here for the latest levels. SqueezeMetrics Dark Pool Index (DIX) and Gamma (GEX) calculations are based on where the prior day’s reading falls with respect to the MAX and MIN of all occurrences available. A higher DIX is bullish. At the same time, the lower the GEX, the more (expected) volatility. Learn the implications of volatility, direction, and moneyness. Breadth reflects a reading of the prior day’s NYSE Advance/Decline indicator. VIX reflects a current reading of the CBOE Volatility Index (INDEX: VIX) from 0-100.
Administrative
Setting the stage for what we will unpack further later this week. Mainly key talking points, today, coupled with a few aesthetic changes, if you have not noticed already (e.g., graphic above).
Fundamental
A less eventful couple of days, albeit uncertainty remains. On the geopolitical front, an easing of conflict appeared with Biden and Xi stressing their need to get ties back on track. That is adding to Russia’s withdrawal from Kherson, Ukraine.
Regarding crypto, a focus for some of last week’s letters, the happenings are awing. Allegedly FTX “transferred billions of dollars in customer assets to their trading firm Alameda,” Substack newsletter Market Sentiment had written.
“Of the $16 billion that customers had deposited into FTX, close to $10 billion was transferred over to Alameda … using its own coin FTT as collateral for borrowing the real coins deposited by customers, … [and this meant that the scheme] heavily depended on the value of FTT.”
As a an aside, we will soon feature a conversation with a former emerging FX and yields trader at Goldman Sachs Group Inc (NYSE: GS) who now works in DeFi. We will unpack the recent volatility, its driver, and follow-on implications.
Here’s one quote:
“For example, look at what happened in the UK with the pension funds and margin calls. That is a classic DeFi strategy. You take your bonds and borrow cash against them. Then, you put it back into bonds and loop it a couple of times. That way, you have a leveraged interest rate exposure. That’s the same principle of lending staked ETH, borrowing ETH, and doing it a couple of times.”
It was allegations about the firms’ relationship, as well as allegations by competitors, that ultimately incited an implosion and bankruptcy. In short, per his posts on betting and Kelly criterion, founder Sam Bankman-Fried (SBF) showed a risk tolerance “far outside” the normal.
For more on the debacle, check out the Daily Brief published on November 10, 2022, as well as the letter published on November 9, 2022.
The aforementioned is in light of liquidity being “sucked out of the market,” said Fabian Wintersberger; a continued “withdrawal of liquidity might lead to a real, systemic crisis in conventional financial markets,” which we’ve pondered before.”
Positioning
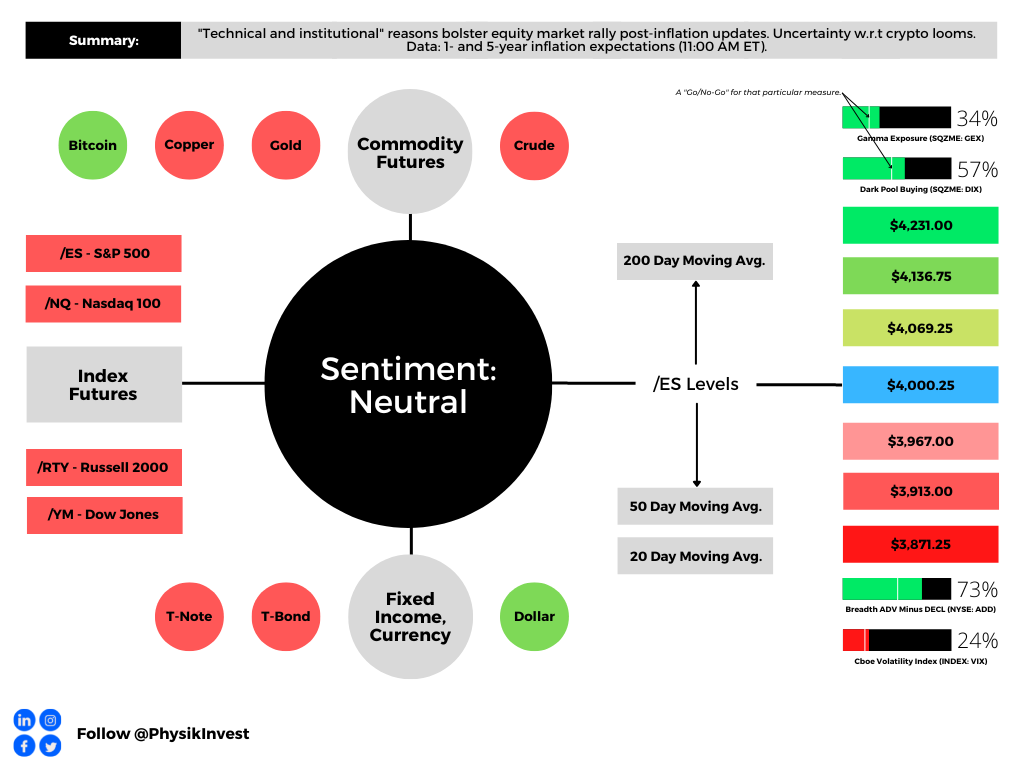
Markets have rallied, recently. In short, as we talked about before and, now, fellow letter writers, including Alfonso Peccatiello of The Macro Compass, confirm, the pace of the market’s rally is, in part, the result of “technical and institutional reasons.”
In our letters last week, we said the compression of implied volatility, evidenced by a shift lower in the volatility term structure, particularly at the front end where options are most sensitive, was to add to any macro-type repositioning, with follow-on buying support coming from the reach for “Deltas and leverage” to the upside (call options).
Peccatiello offers an interesting explanation: “[A]t this point of the year incentive schemes drive people to be much more willing to pay and chase upside.” Preferred are the “convex structures” that would benefit from “outsized” rallies. In traders’ monetization of put protection they owned, as well as reach for upside calls (to not miss out on a potential reversal), skew is at lows and, if the assumption is that “further tightening monetary policy and draining liquidity off the market might cause some problems down the road,” per Wintersberger, bets that pay when markets trade lower are attractive.
Adding, a big takeaway, though not discussed explicitly above (but in past letters), we’ll see a loss of structural support from hedging flows; ultimately, the very poor hedging that’s going on, heading into the next rally, is going to set the stage for a large tail. Traders, who aren’t as well hedged, will seek protection and this will pressure markets, adding to any macro-type selling.
In the coming letters, we’ll go into more detail and discuss how to structure a new trade on this information, such as the one unpacked in a recent case study of ours.
Technical
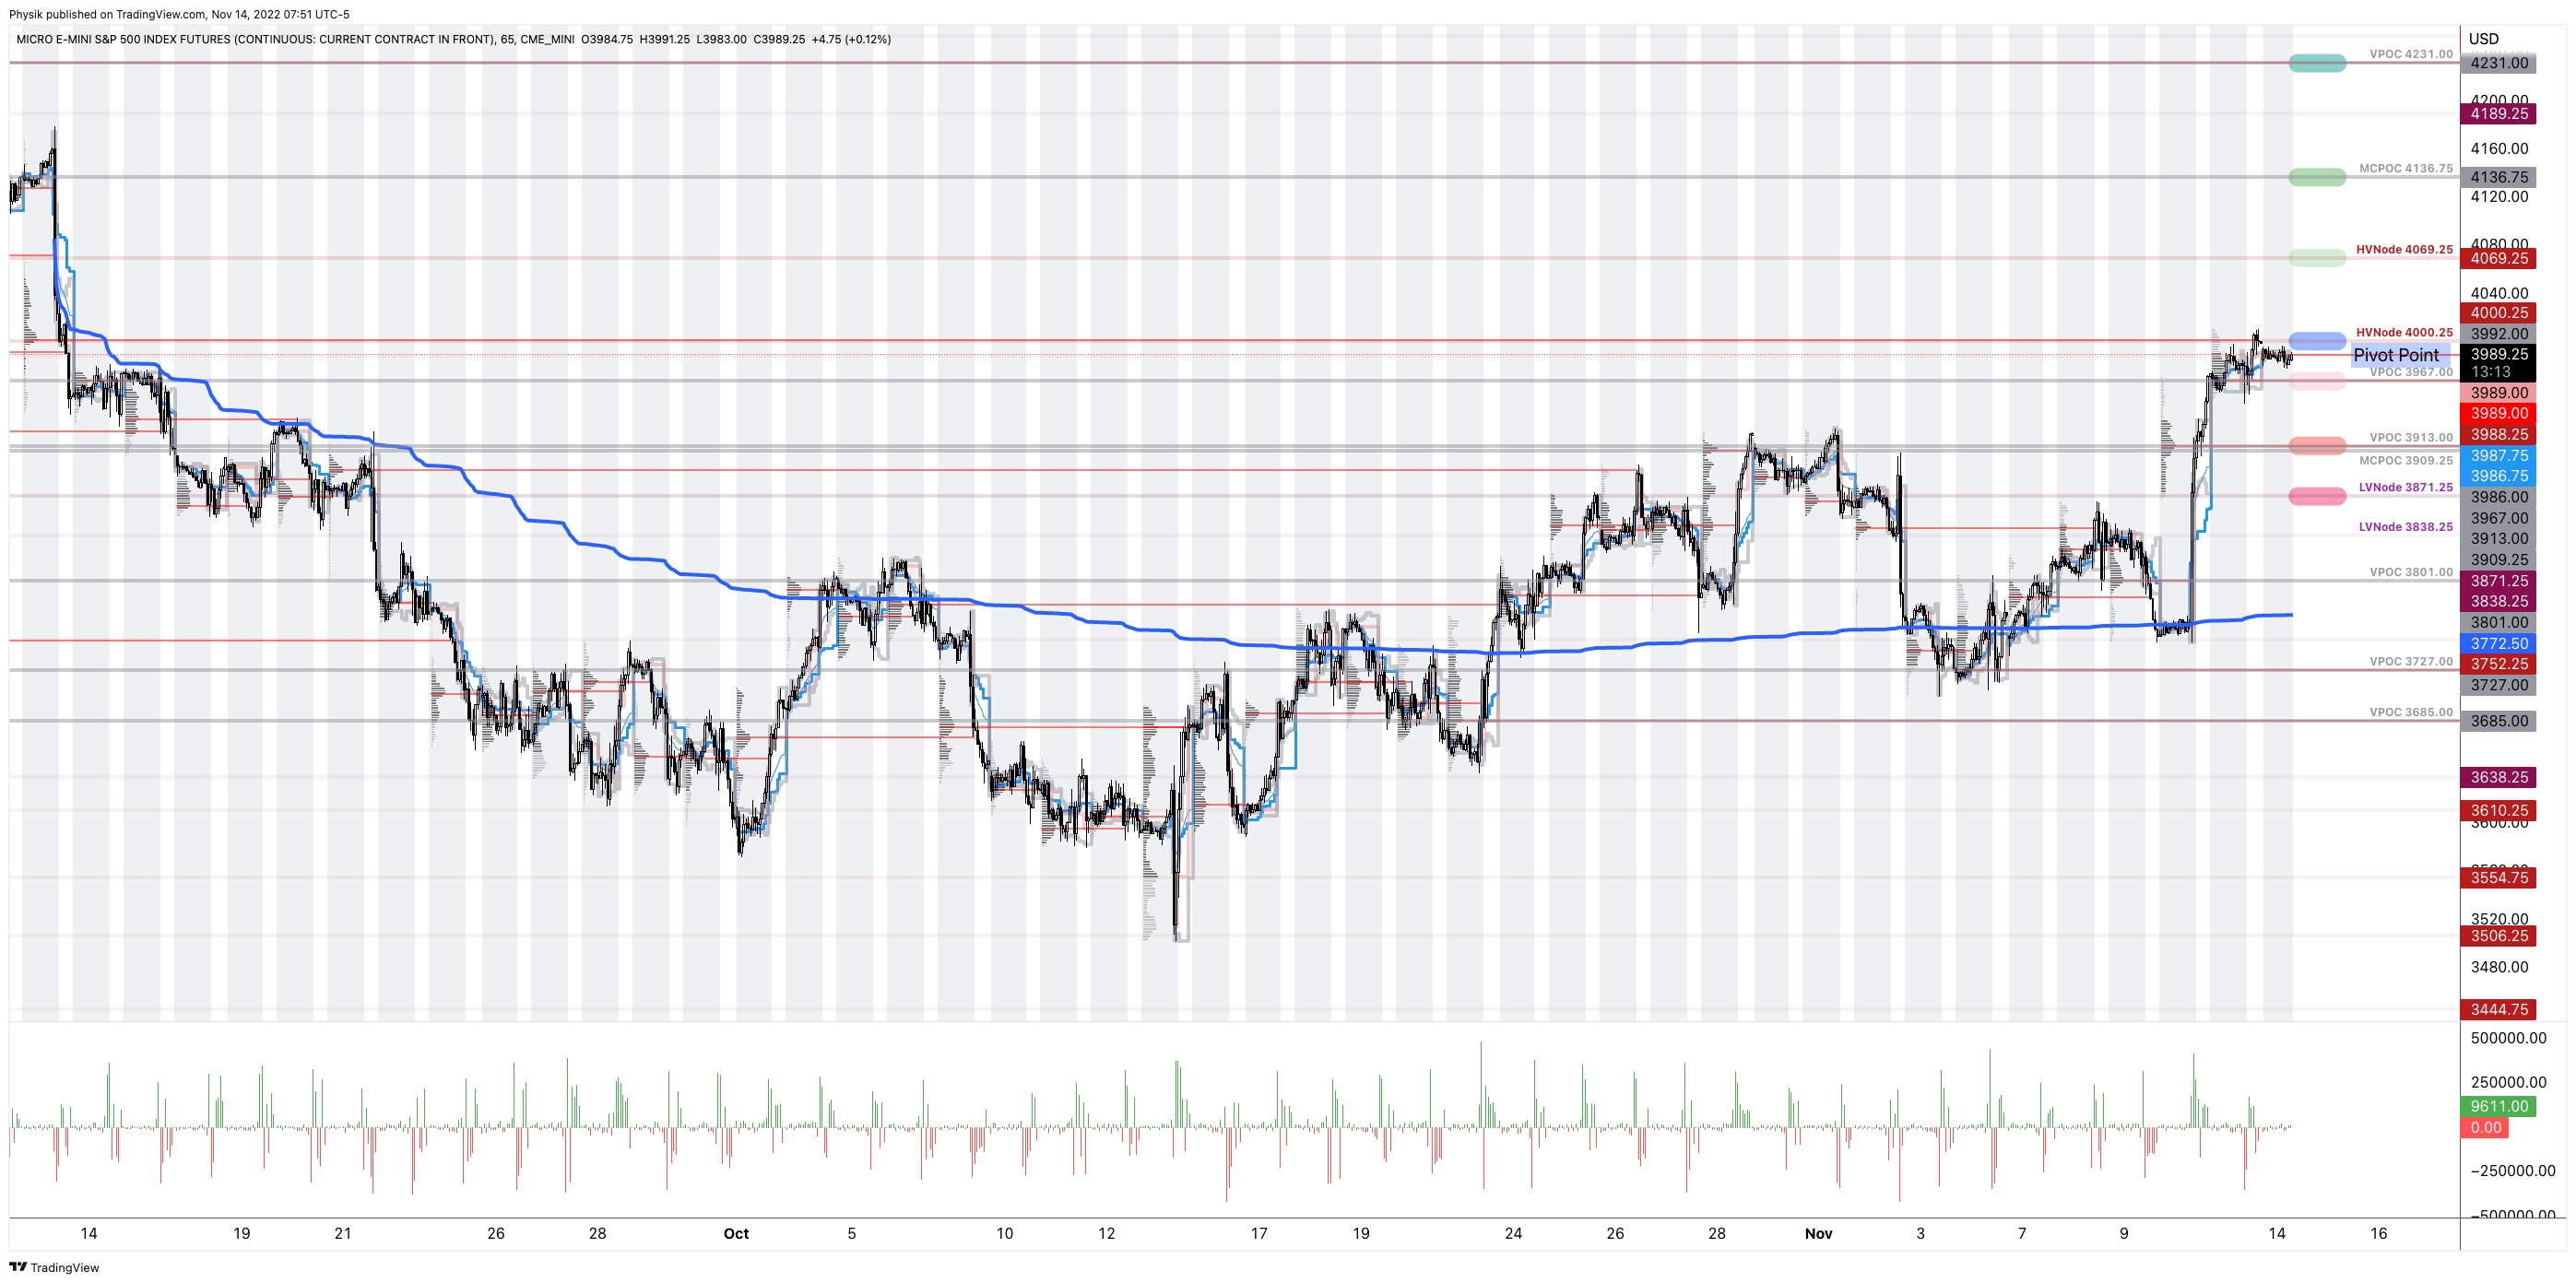
As of 7:45 AM ET, Monday’s regular session (9:30 AM – 4:00 PM ET), in the S&P 500, is likely to open in the middle part of a balanced overnight inventory, inside of prior-range and -value, suggesting a limited potential for immediate directional opportunity.
Our S&P 500 pivot for today is $4,000.25.
Key levels to the upside include $4,069.25, $4,136.75, and $4,231.00.
Key levels to the downside include $3,967.00, $3,913.00, and $3,871.25.
Click here to load today’s key levels into the web-based TradingView platform. All levels are derived using the 65-minute timeframe. New links are produced, daily.
Graphic: 65-minute profile chart of the Micro E-mini S&P 500 Futures. Check out this refresher on the shape of volume profiles.
About
After years of self-education, strategy development, mentorship, and trial-and-error, Renato Leonard Capelj began trading full-time and founded Physik Invest to detail his methods, research, and performance in the markets.
Capelj also develops insights around impactful options market dynamics at SpotGamma and is a Benzinga journalist.