The daily brief is a free glimpse into the prevailing fundamental and technical drivers of U.S. equity market products. Join the 300+ that read this report daily, below!
What Happened
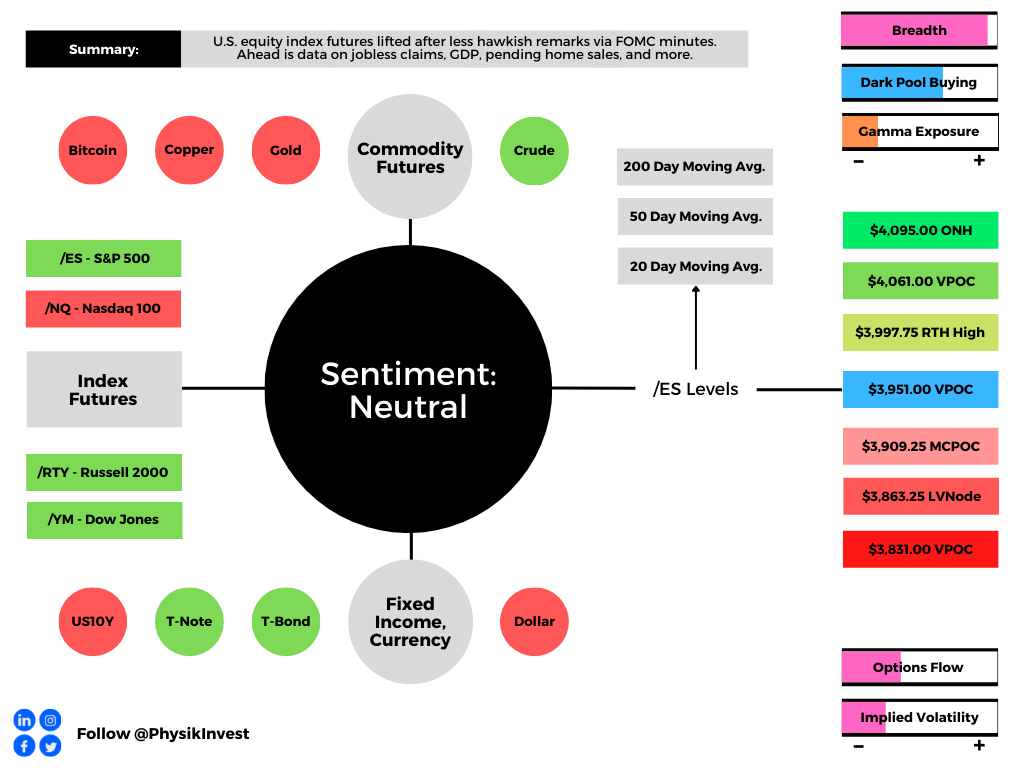
Overnight, the equity index and commodity futures were bid, all the while bonds and the dollar edged lower. This is after a week-long or so de-rate on tougher monetary policies.
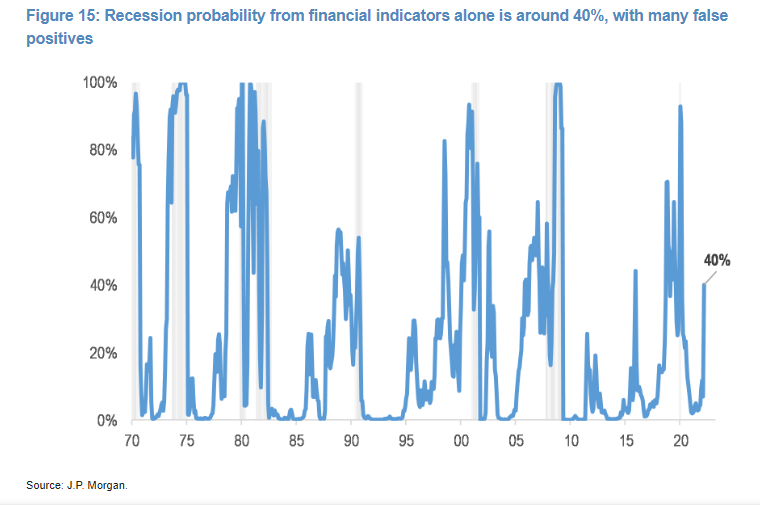
Big headlines include the White House’s mulling of a U.S. gas tax suspension, Russia’s status as a top exporter of crude to China, Goldman Sachs Group Inc’s (NYSE: GS) recession warning, Elon Musk’s intent to cut Tesla Inc’s (NASDAQ: TSLA) workforce, and falling Iron ore prices on China’s building downturn.
Interesting reads from over the weekend include Dr. Pippa Malmgren’s letter on the market’s “nosedive” which is likely to be “followed by a newfound understanding of what is possible,” and how that plays into economic strength and military superiority.
Adding, timely was a Sohn 2022 conversation with Stanley Druckenmiller on his experiences and the current market environment.
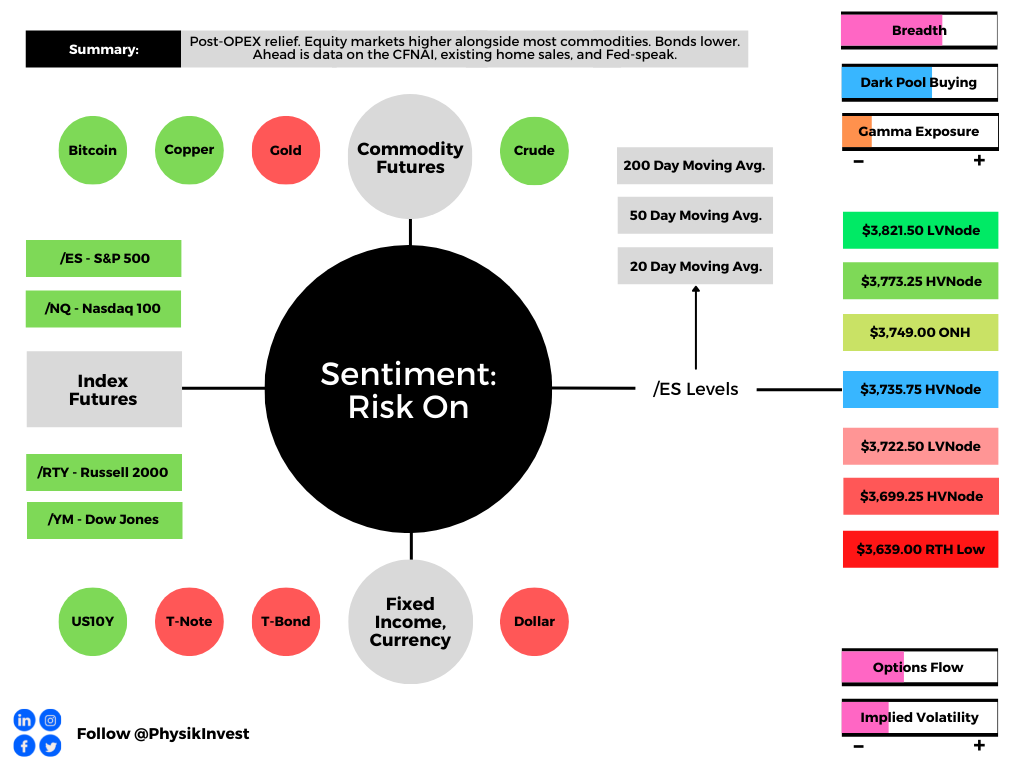
Ahead is data on the Chicago Fed National Activity Index (8:30 AM ET), existing-home sales (10:00 AM ET), as well as Fed-speak by Loretta Mester (12:00 PM ET) and Tom Barkin (3:30 PM ET).
What To Expect
Fundamental: Keeping this letter brief, today.
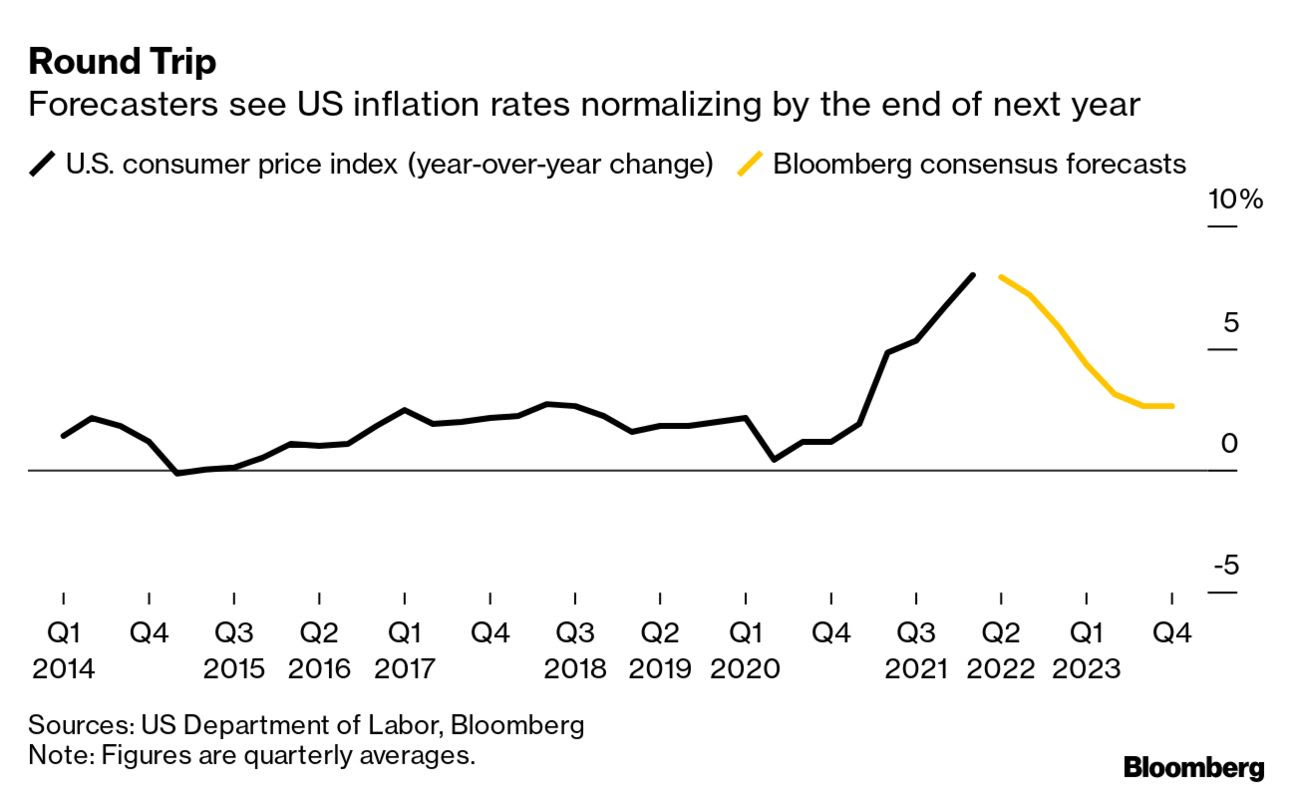
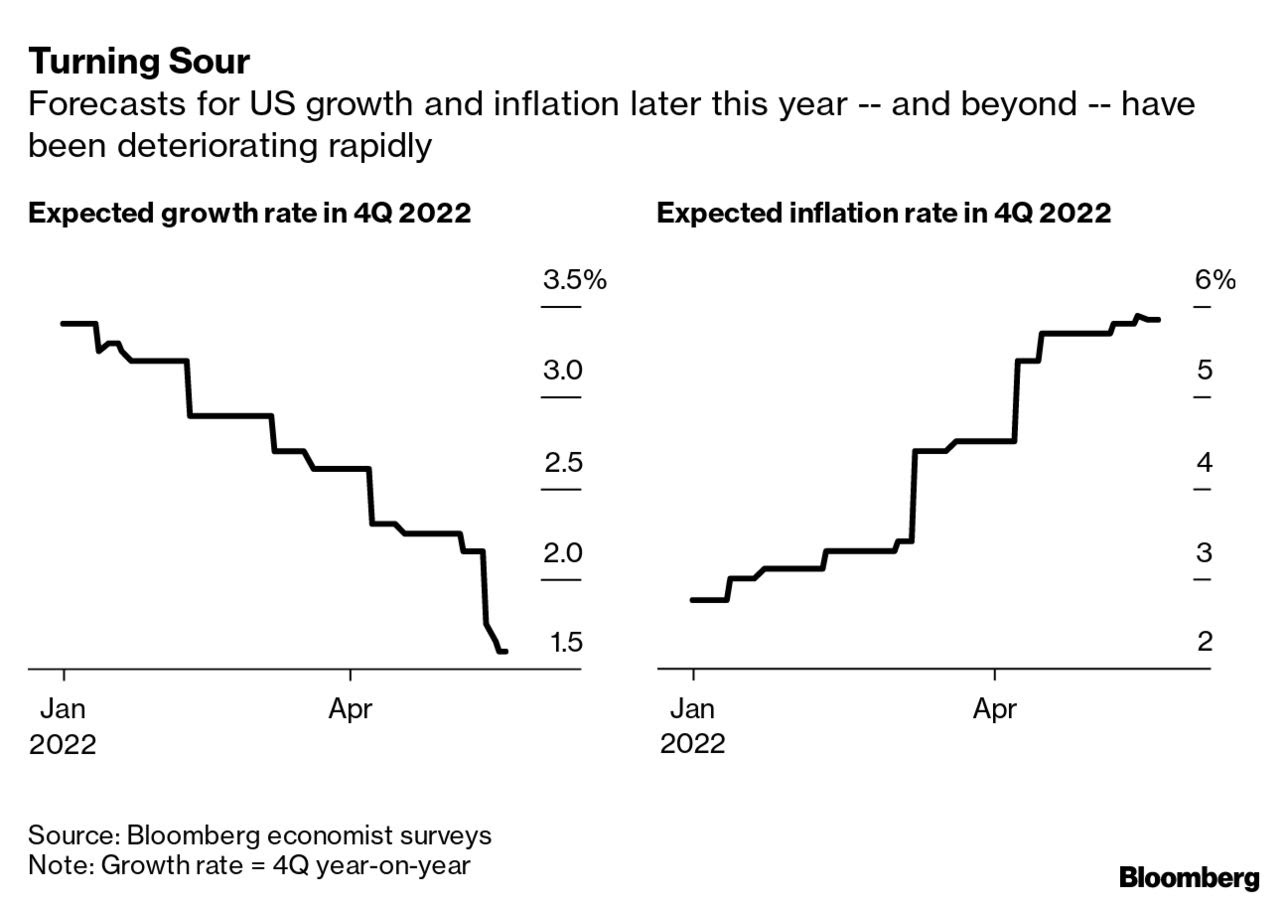
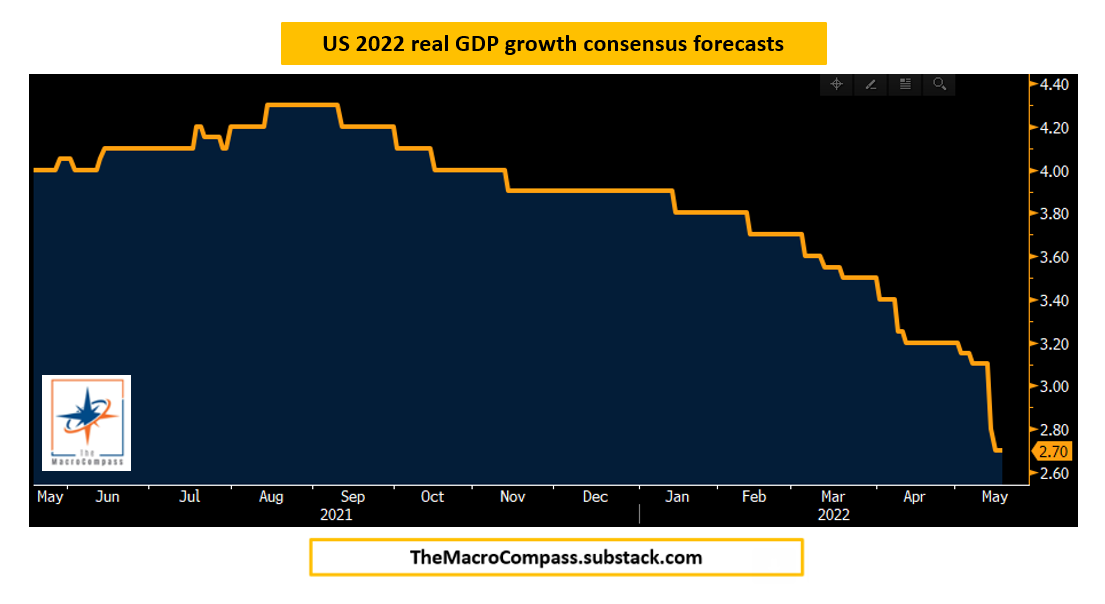
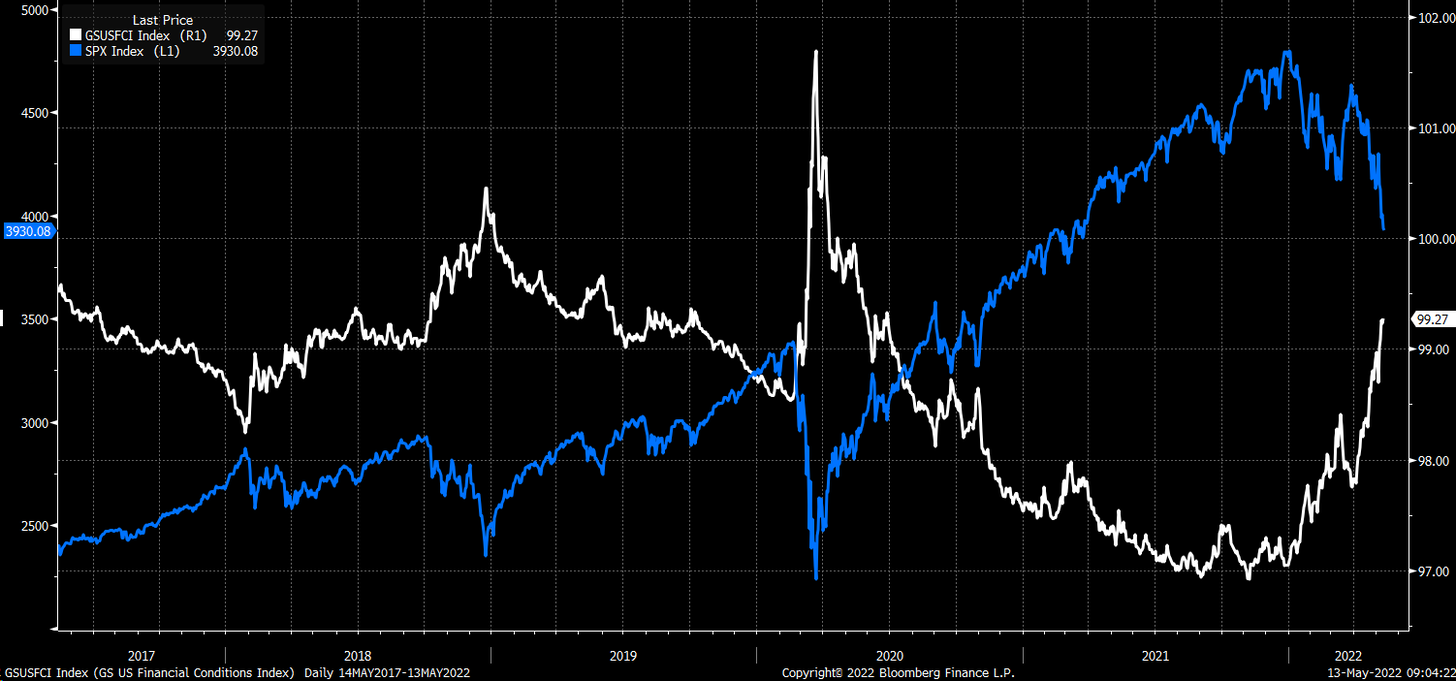
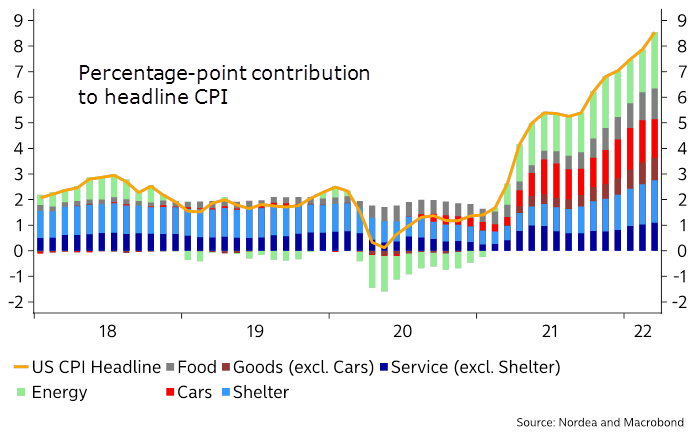
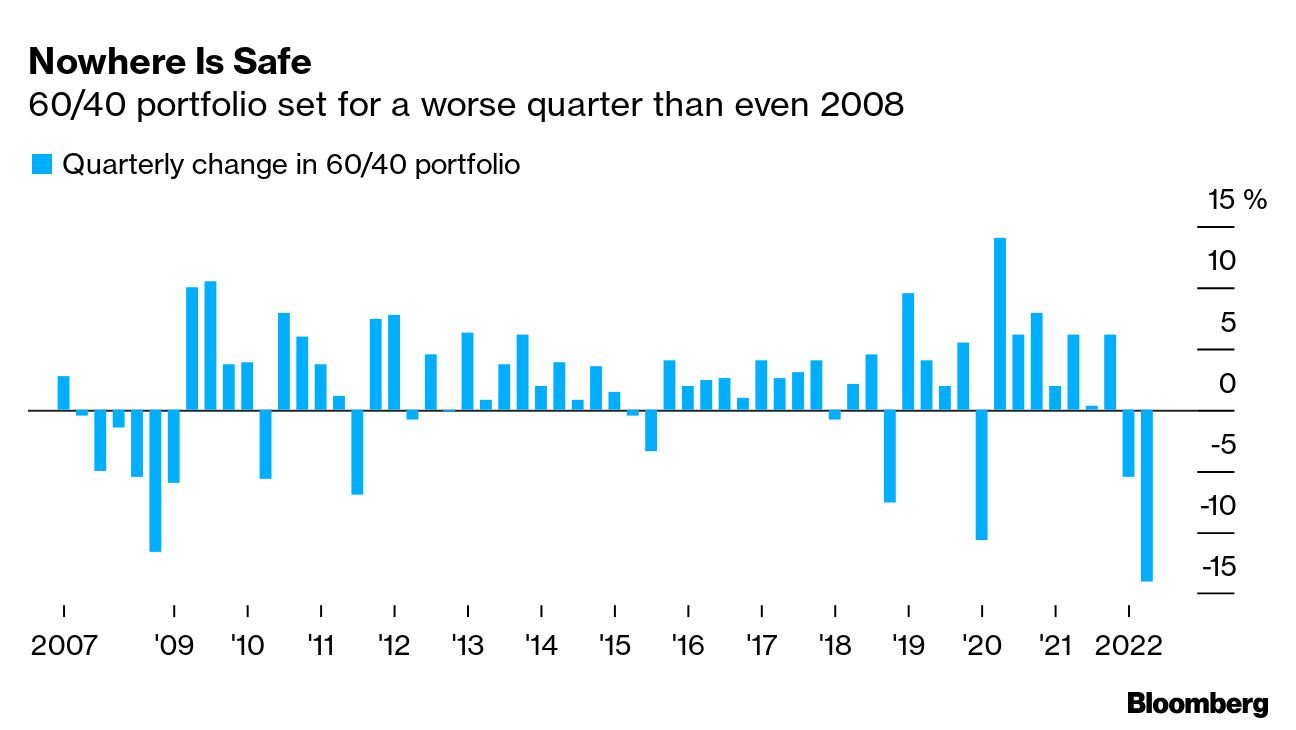
The sale of both bonds and equities worsened in part due to the implications of inflation and the Federal Reserve’s (Fed) response to that inflation.
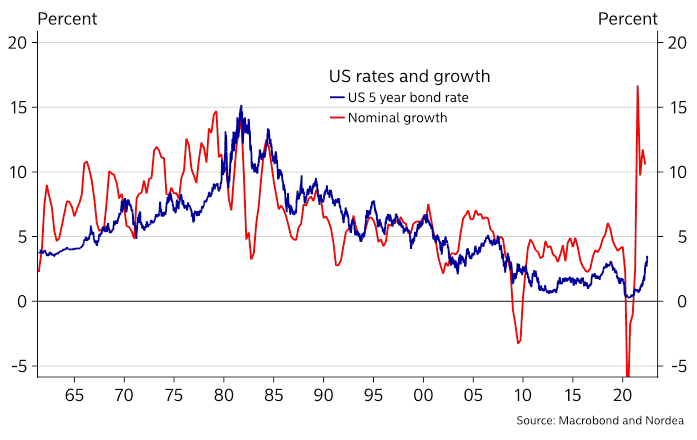
We talked about this in the weeks prior.
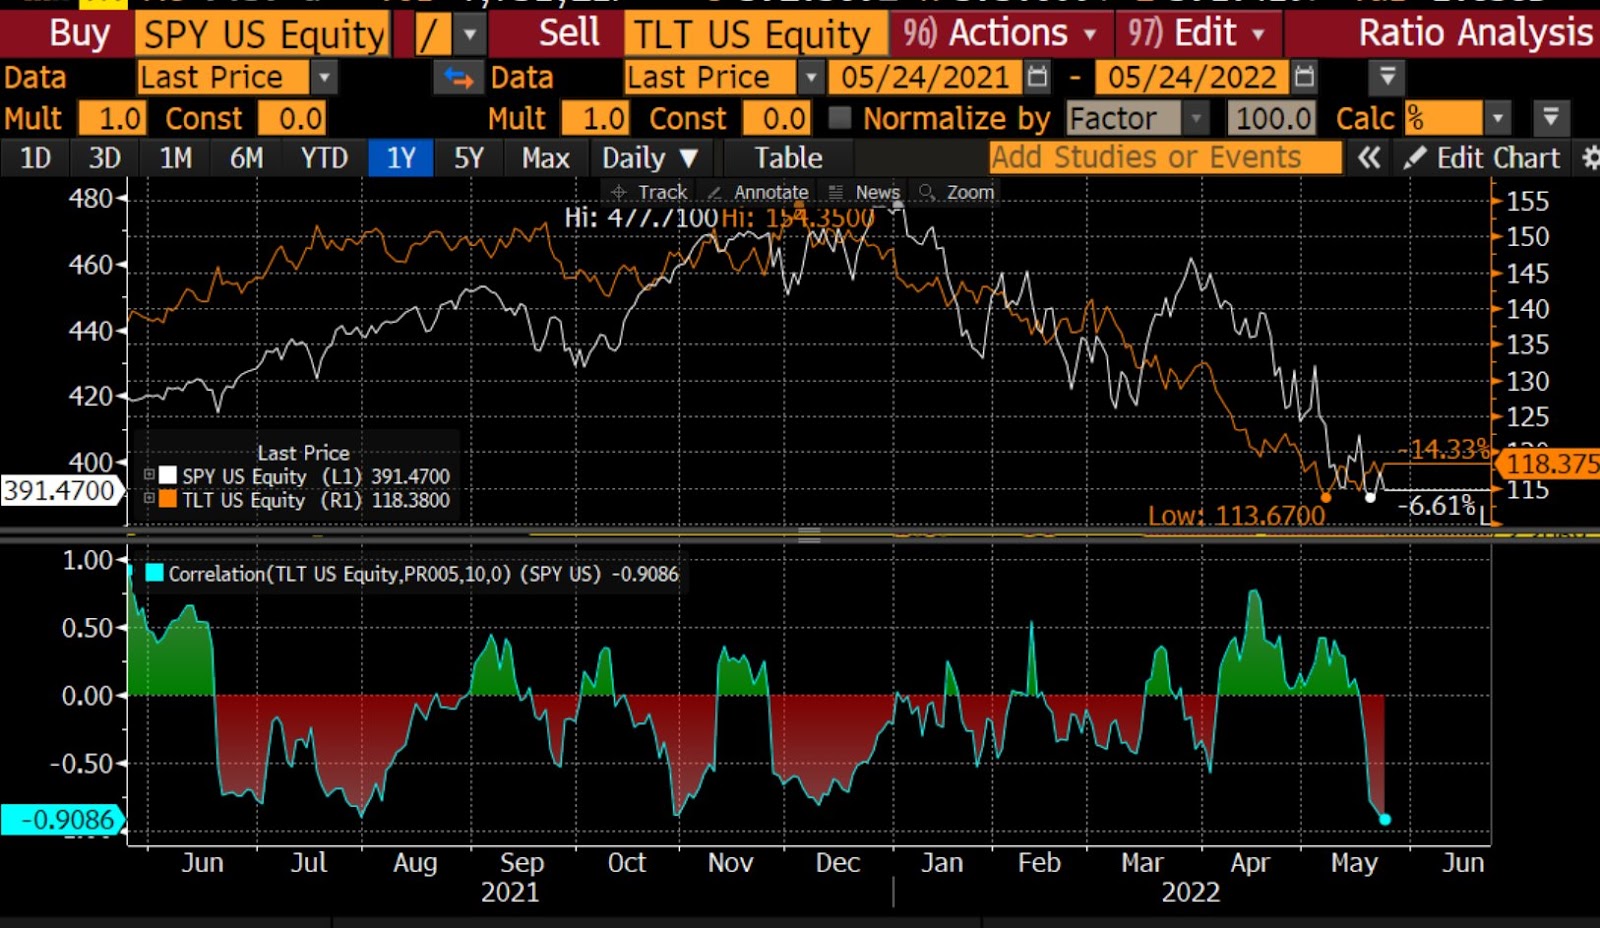
Essentially, as Joseph Wang, who was a trader at the Fed, puts it, “[b]onds are not acting as a hedge and appear to be becoming less ‘money’ like due persistent declines in price and elevated rate vol.”
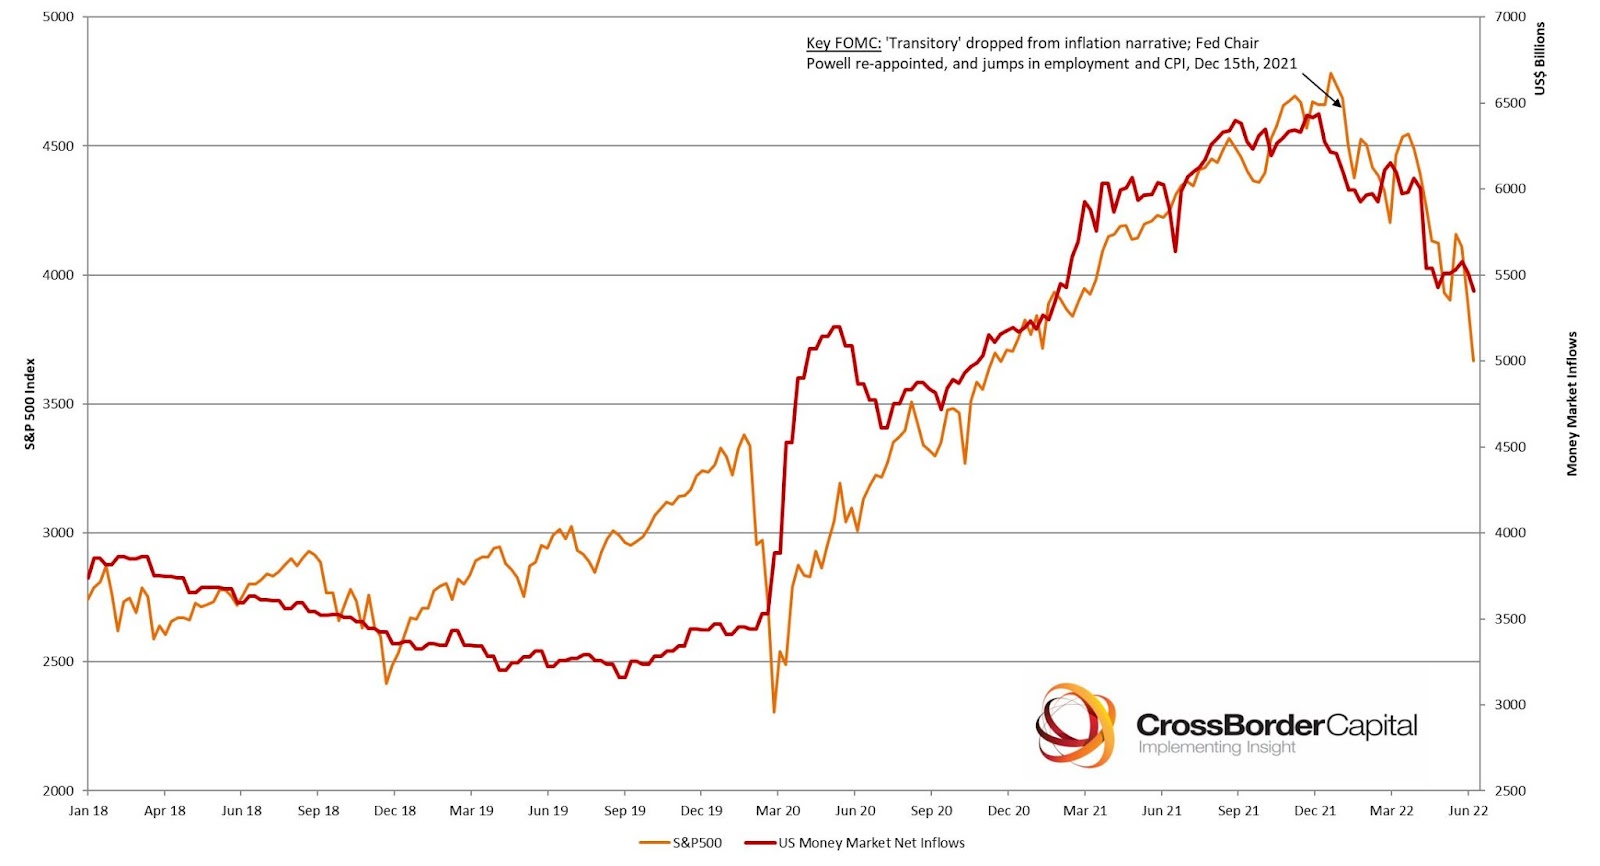
“Investors in both bonds and stocks are reaching for cash by selling their assets, driving further asset price declines. For non-bank investors, ‘cash’ means bank deposits.”
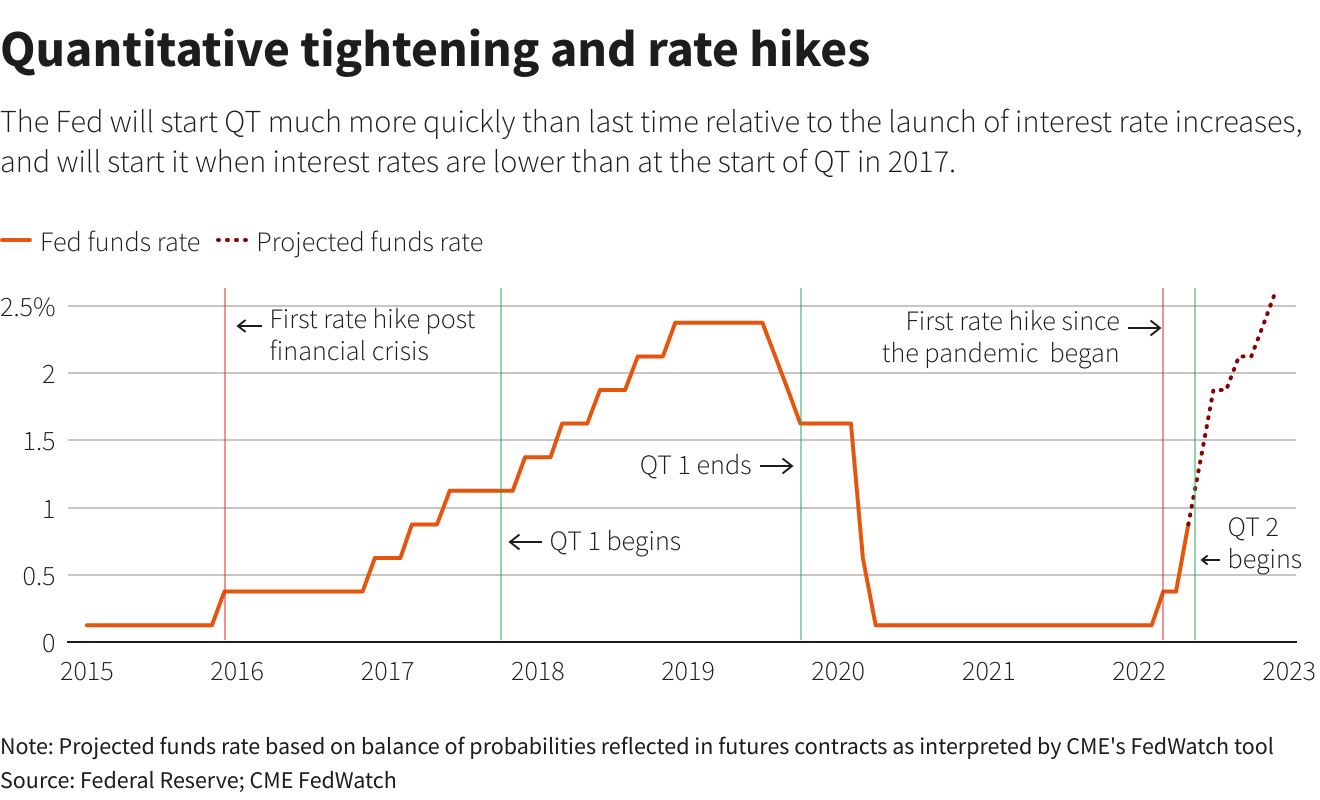
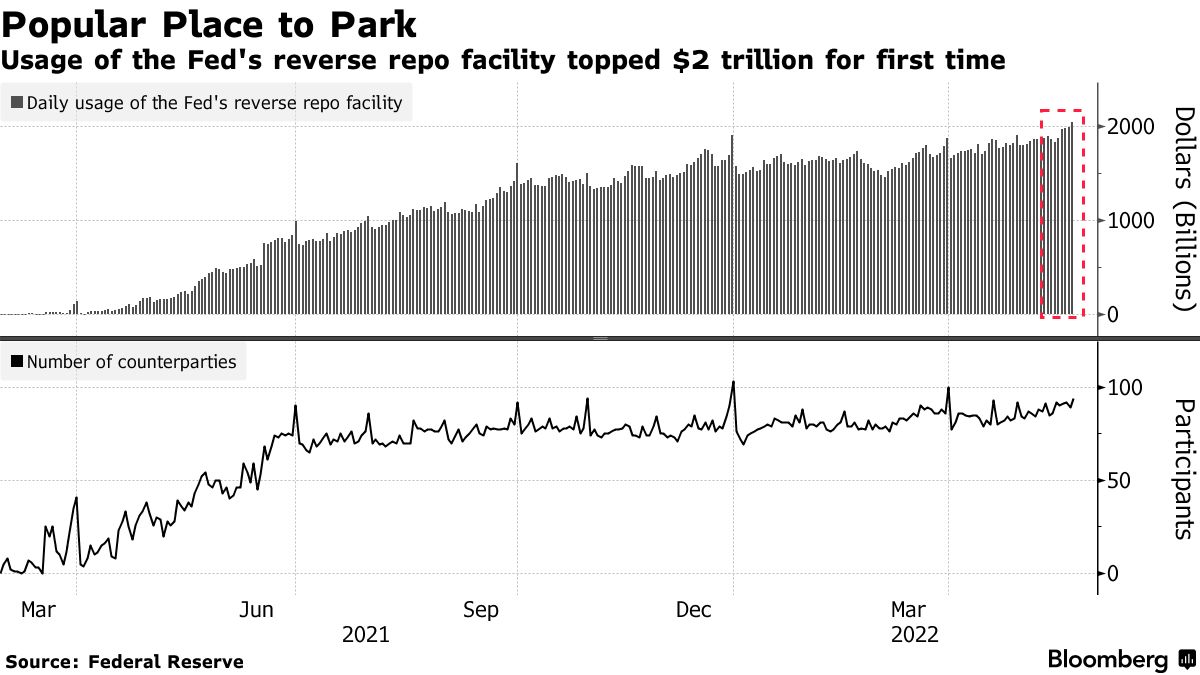
Ultimately, an increase in the RRP (reverse repo) and QT (which is a direct flow of capital to capital markets) “would drain the pool of bank deposits by ~$1t by year-end,” and this may prompt investors to “continue to lower their selling prices to compete for the cash they want.”
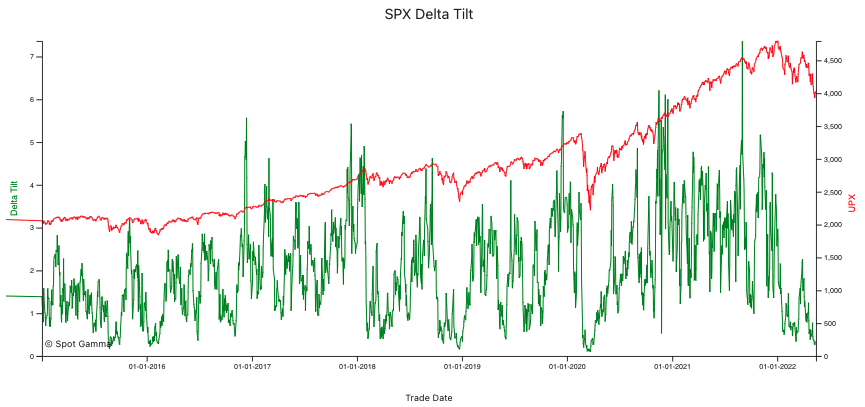
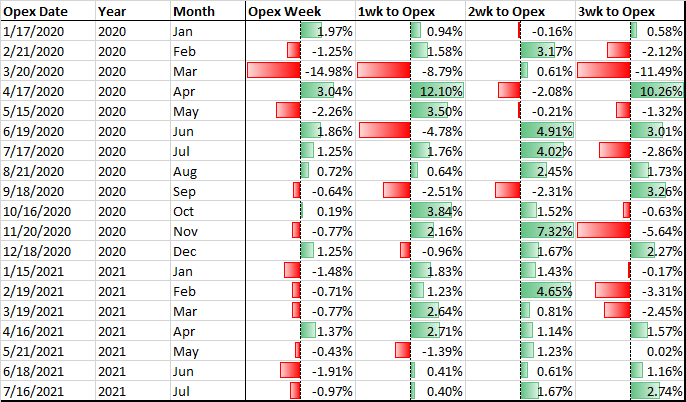
Positioning: Detailed was Friday, June 17’s commentary that honed in on some of the implications of pre- and post-Federal Reserve meeting positioning.
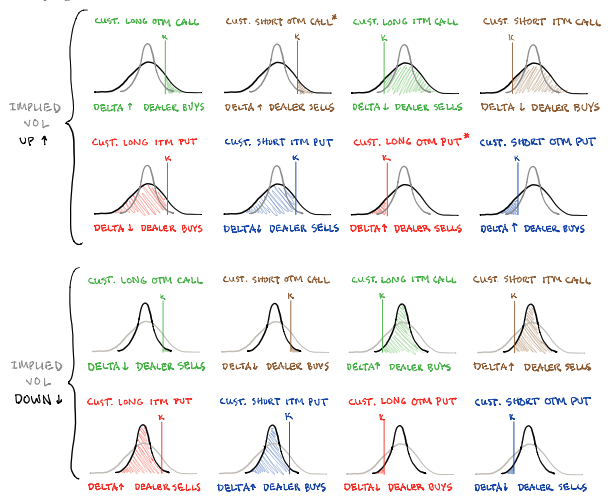
Essentially, with the June monthly options expiration (OPEX), there was a roll-off of a large amount of customer negative delta exposure (via put options they owned).
With expiration, liquidity providers (who were short these put options, as well as underlying to hedge) re-hedged (bought back some of their static short-delta), and this removes pressure.
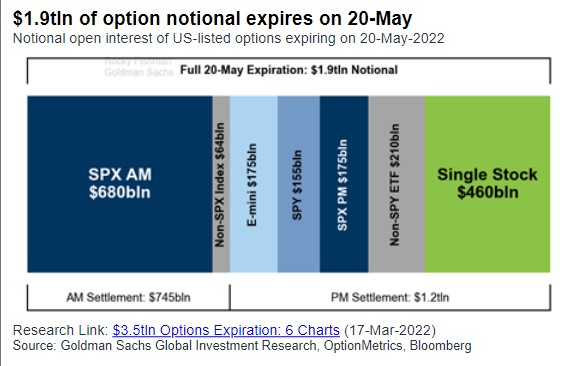
“The SPX index quarterly option notional is higher than usual, but the market is below the concentration of risk given the recent selloff,” said Tanvir Sandhu, chief global derivatives strategist at Bloomberg Intelligence, who we quoted last week.
“Price action will reflect the economic context, but flows from expiring in-the-money hedges may support the market.”
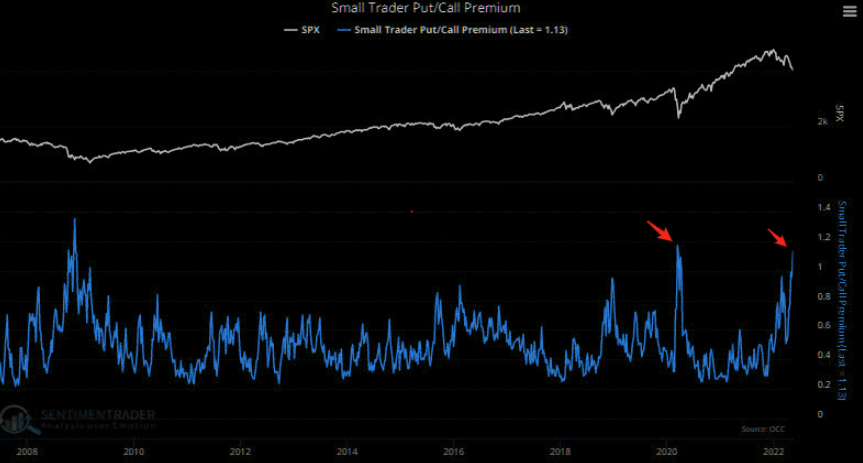
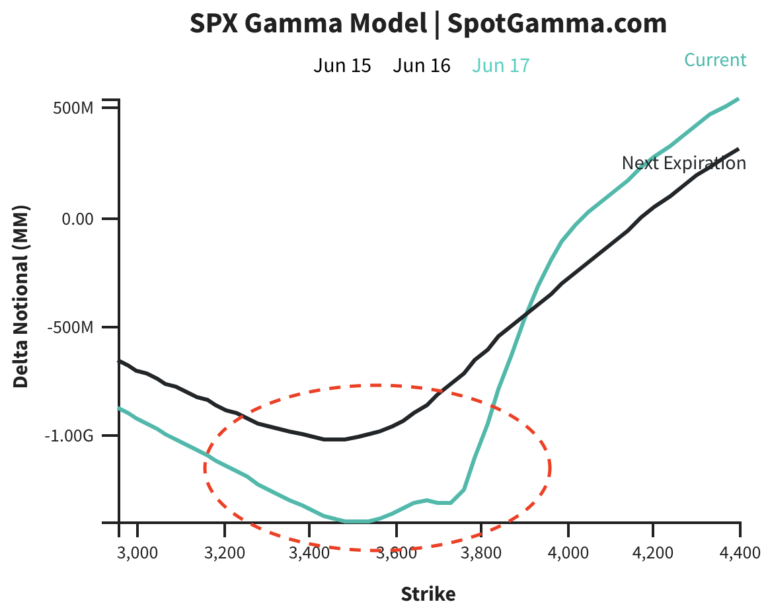
Accordingly, markets are off their lows. However, in the above text, we made little mention of participants’ rolling forward of their options bets to lower strikes, further out in time, as well as the impact of customers still maintaining a “sizable short put position,” a dynamic we’ve talked about before.
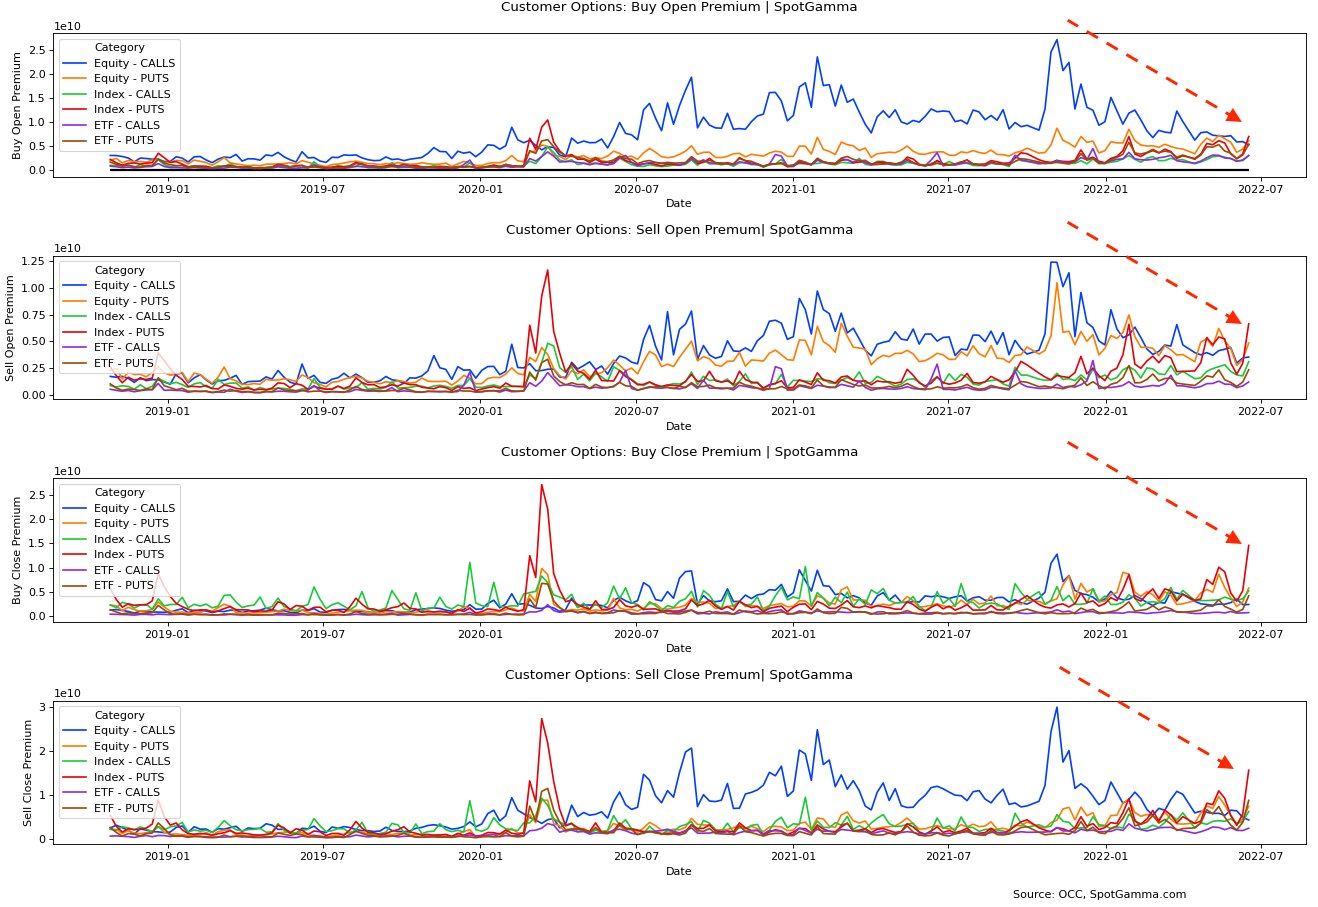
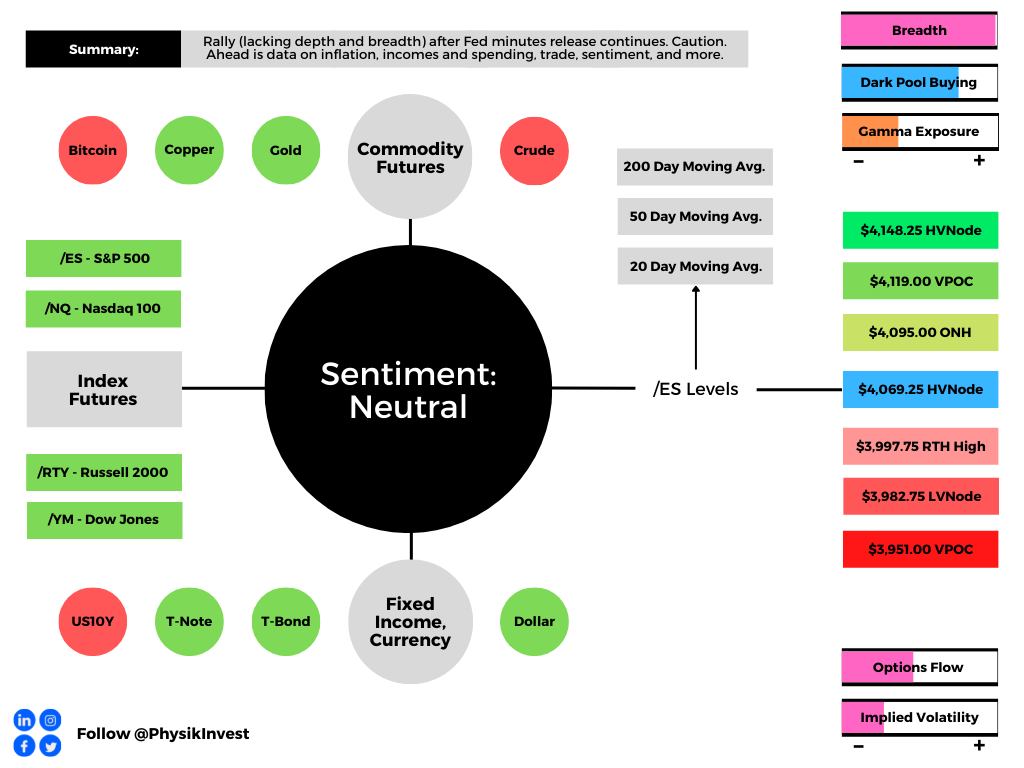
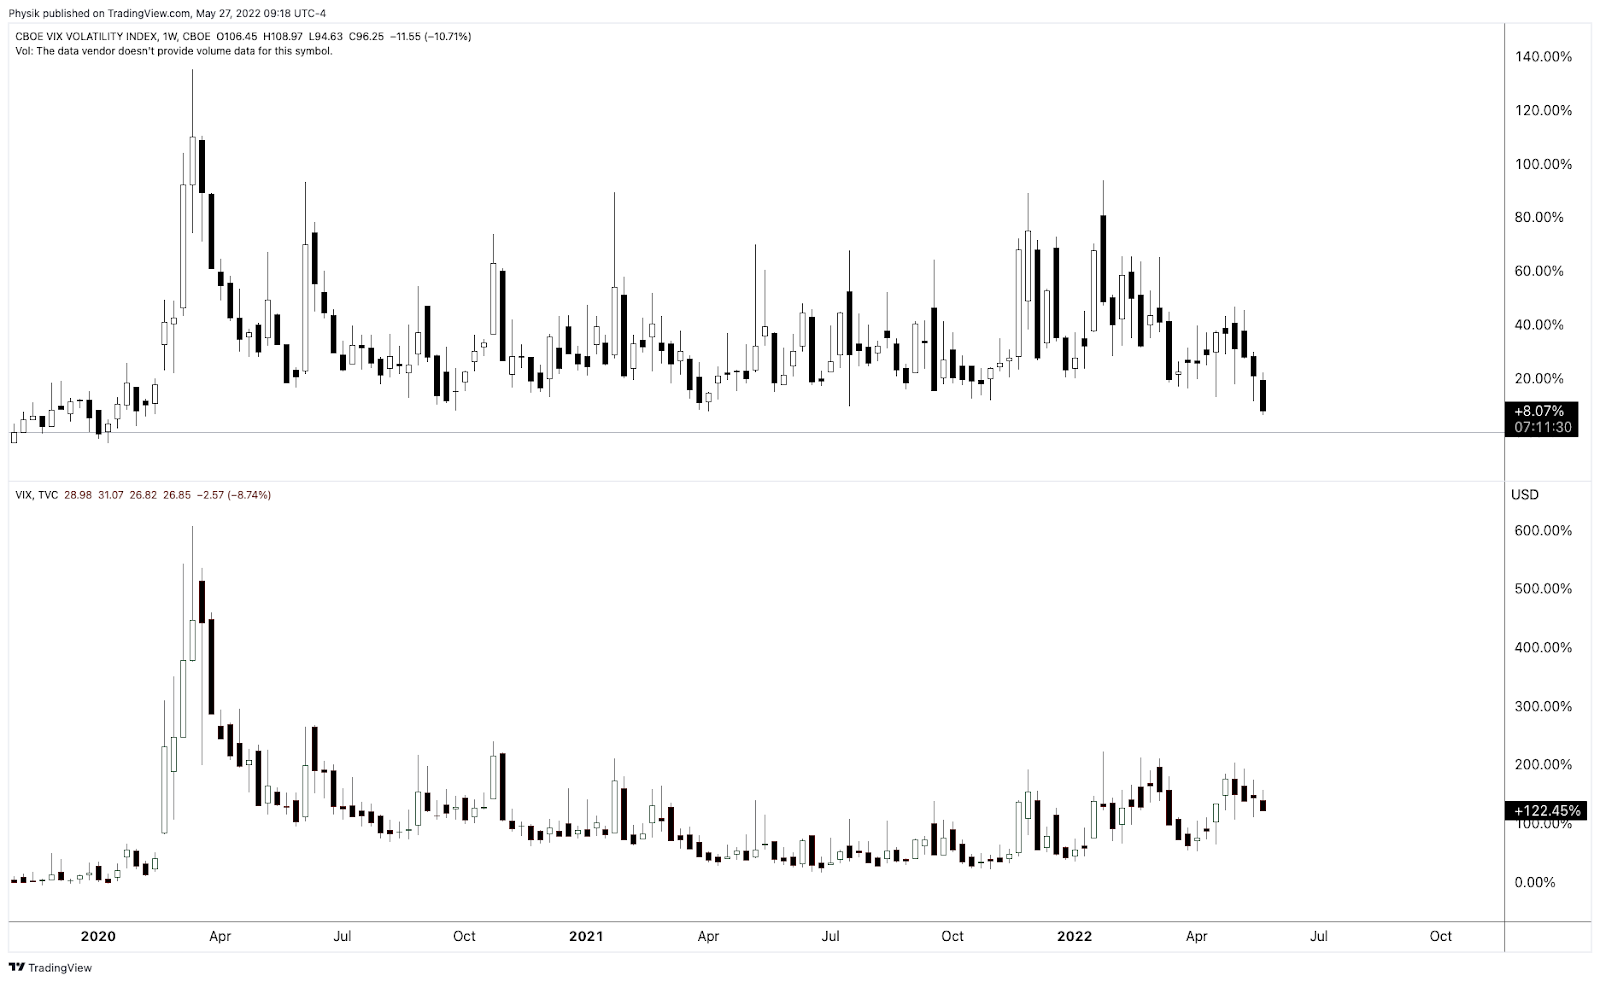
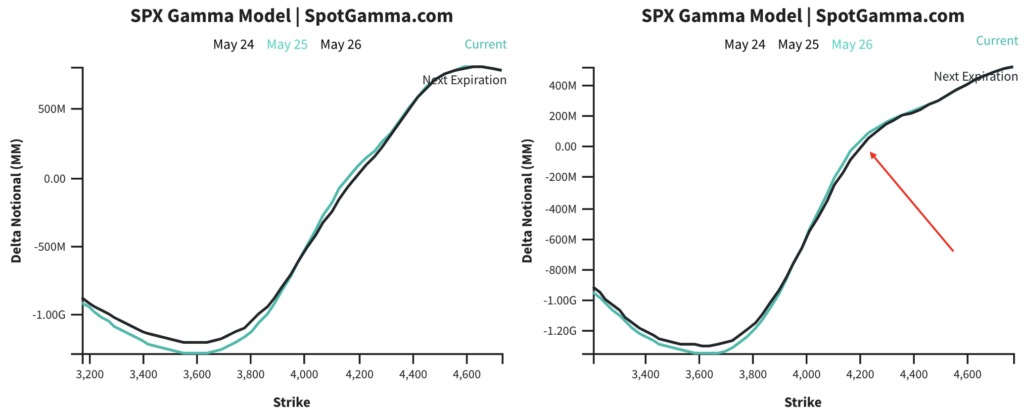
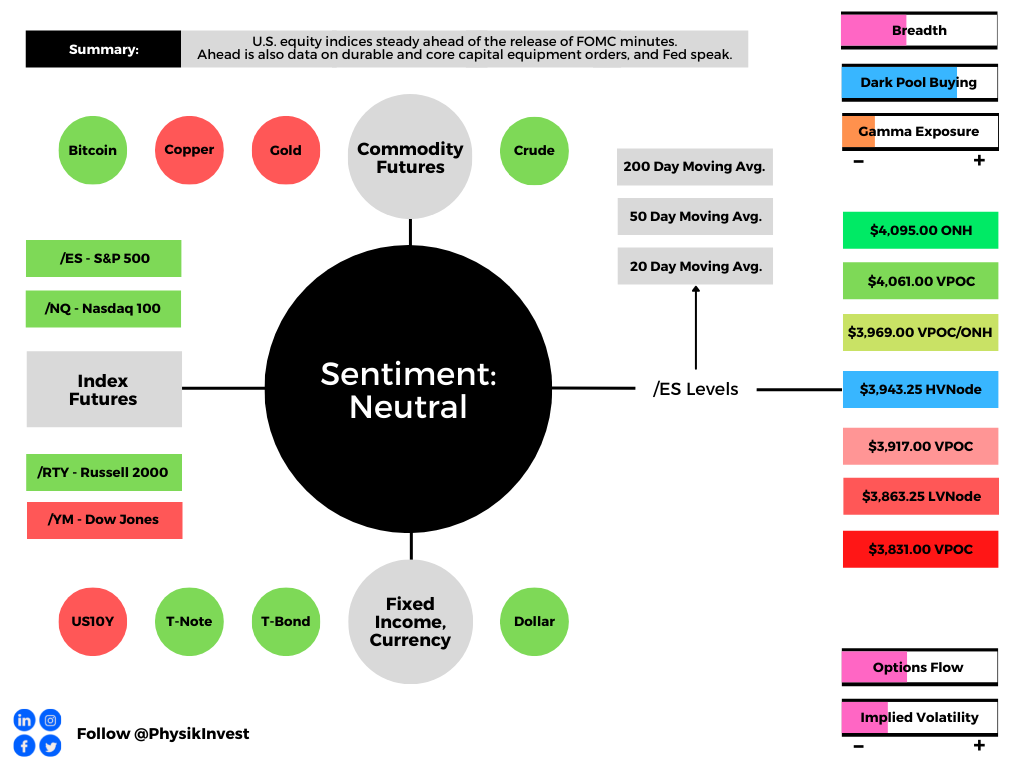
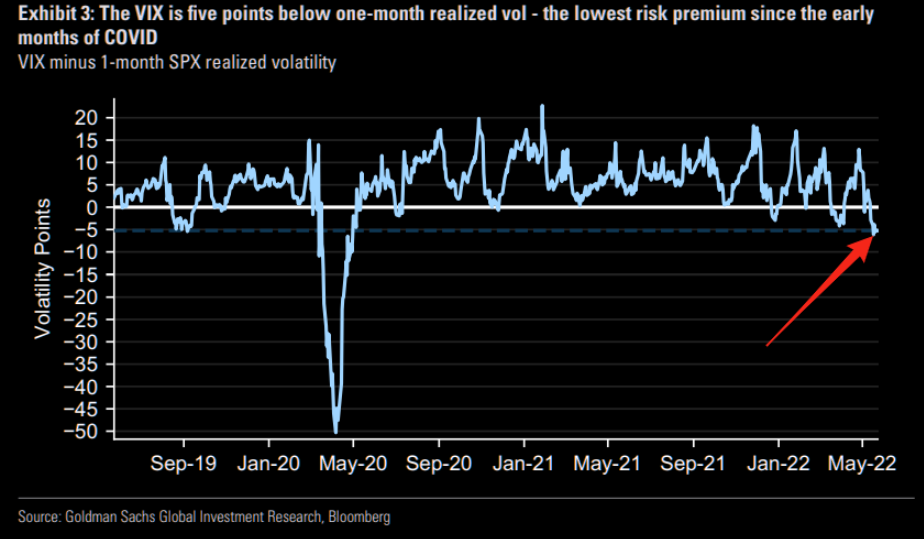
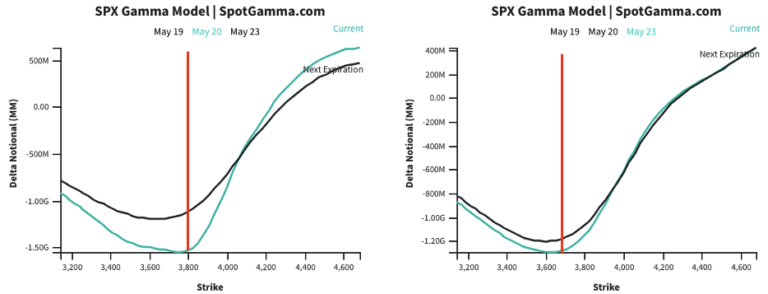
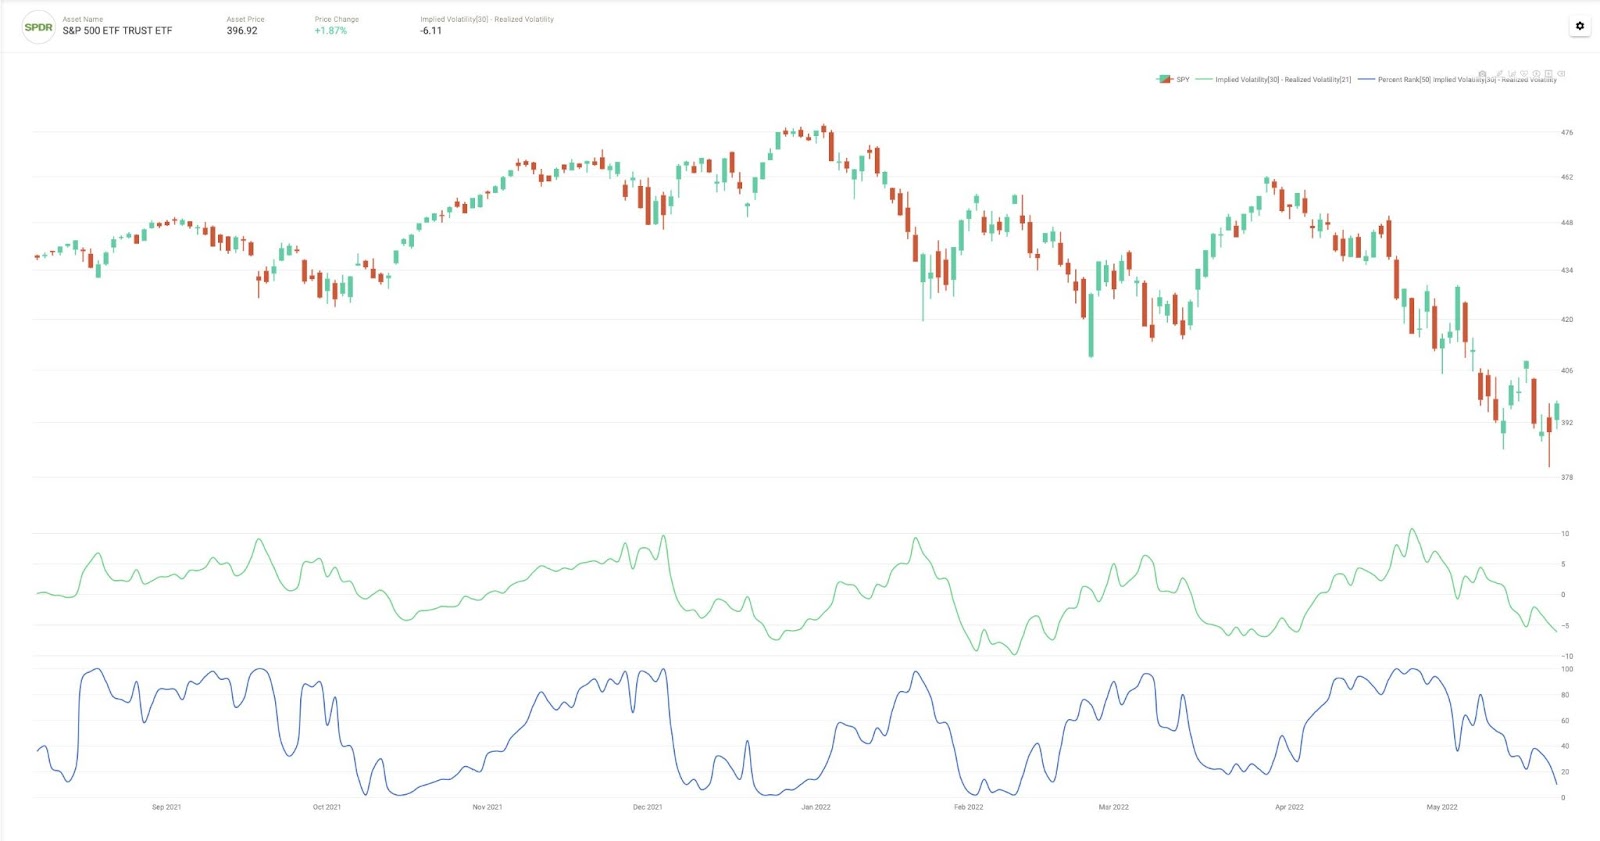
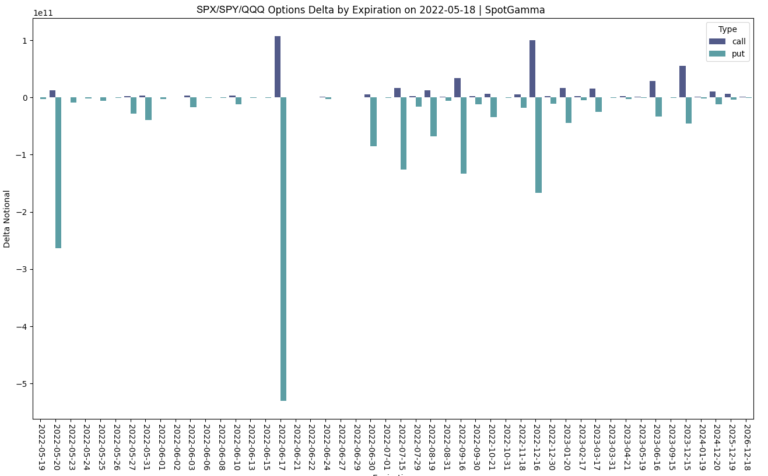
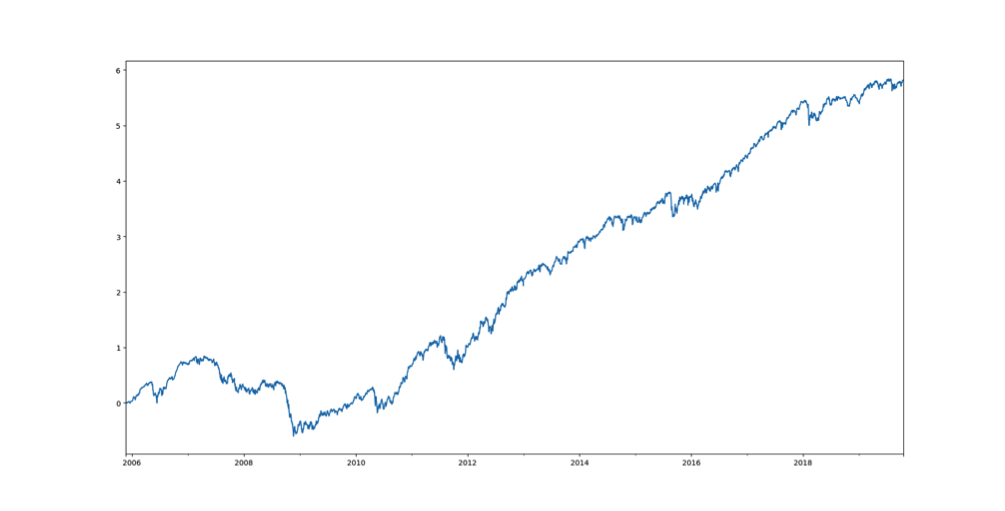
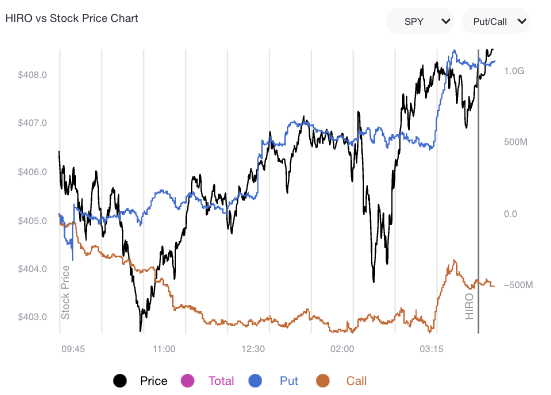
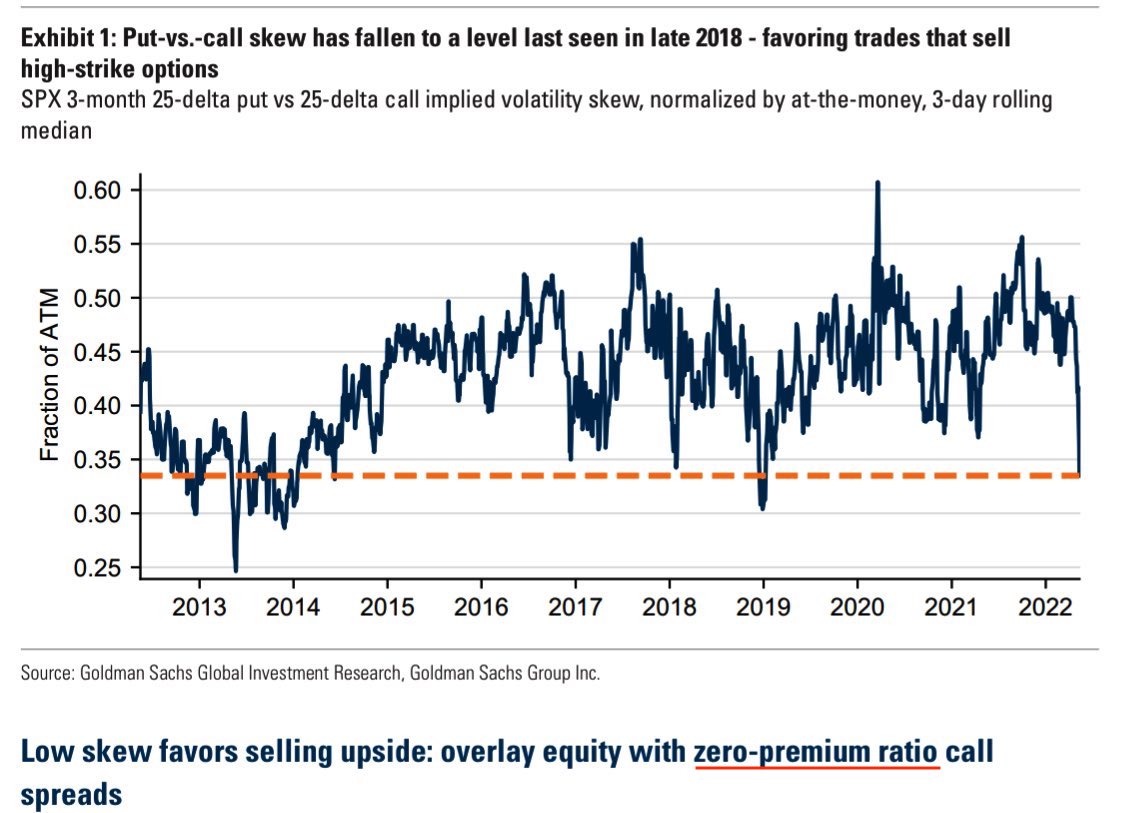
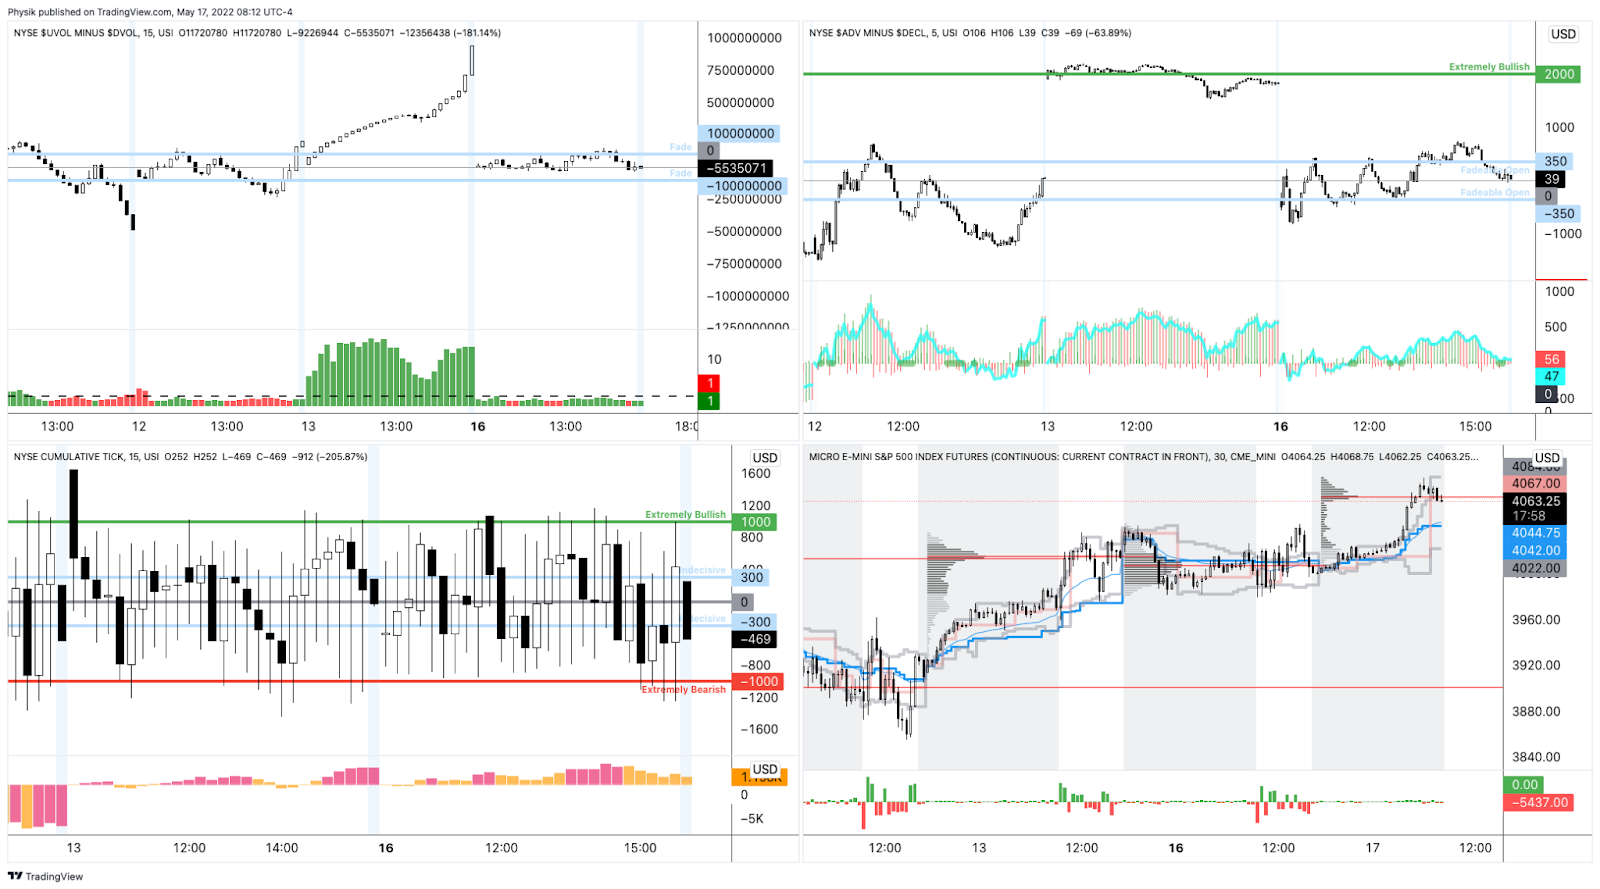
Taken together, coupled with what SpotGamma observes is “anemic” call buying (viewed as the blue line in the top chart above), participants are hedged and volatility remains well-supplied.
Despite being stretched from a technical perspective, positioning-wise, lower prices are sticky and the context for a far-reaching bounce, all else equal, is not there.
We shall provide updates to this, later in the week. Read the Daily Brief for June 17, 2022, for more on how to position in light of the above information.
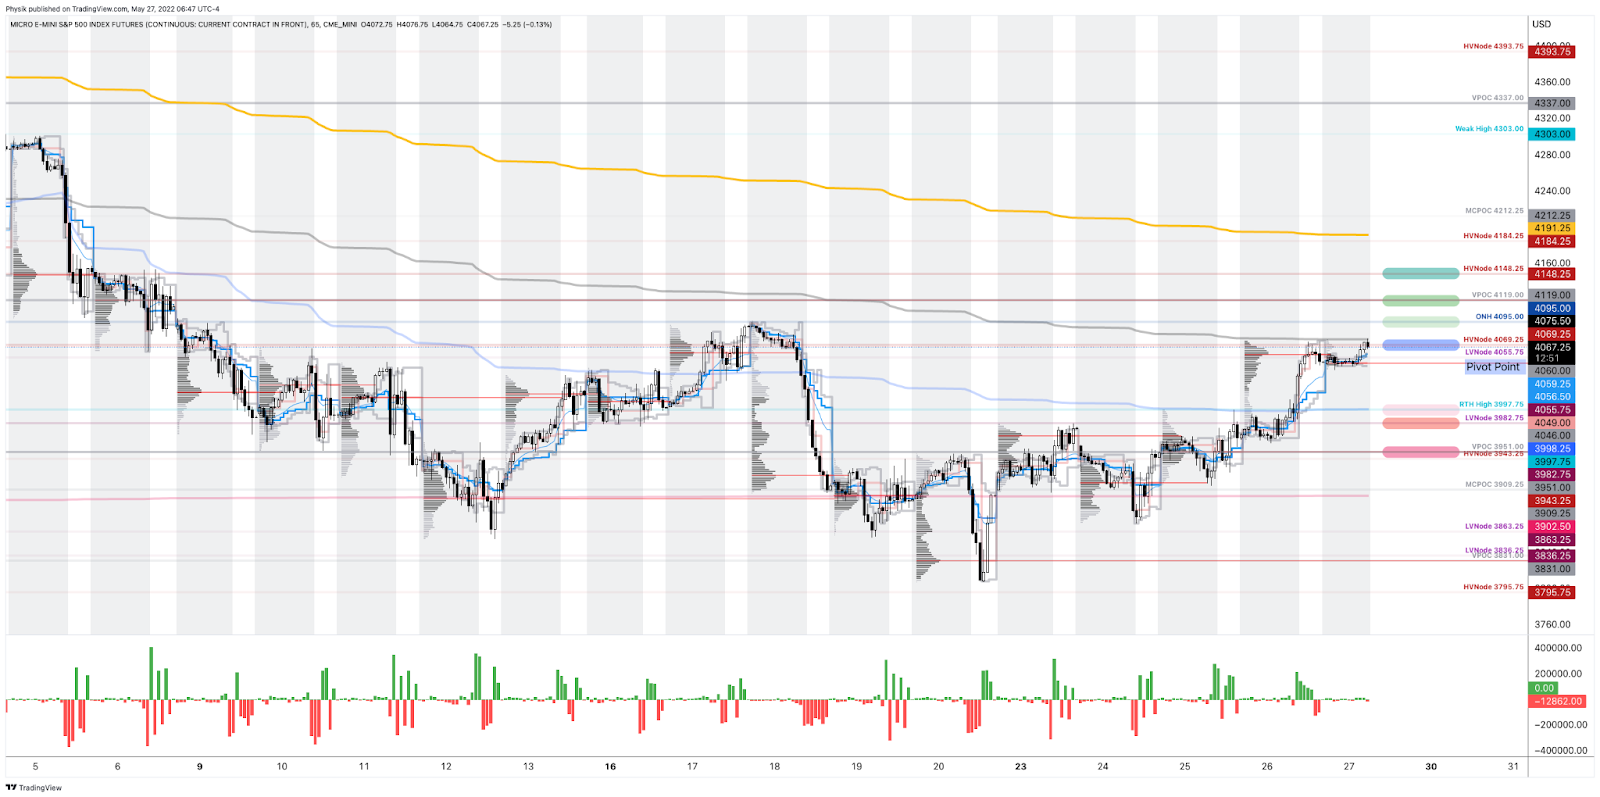
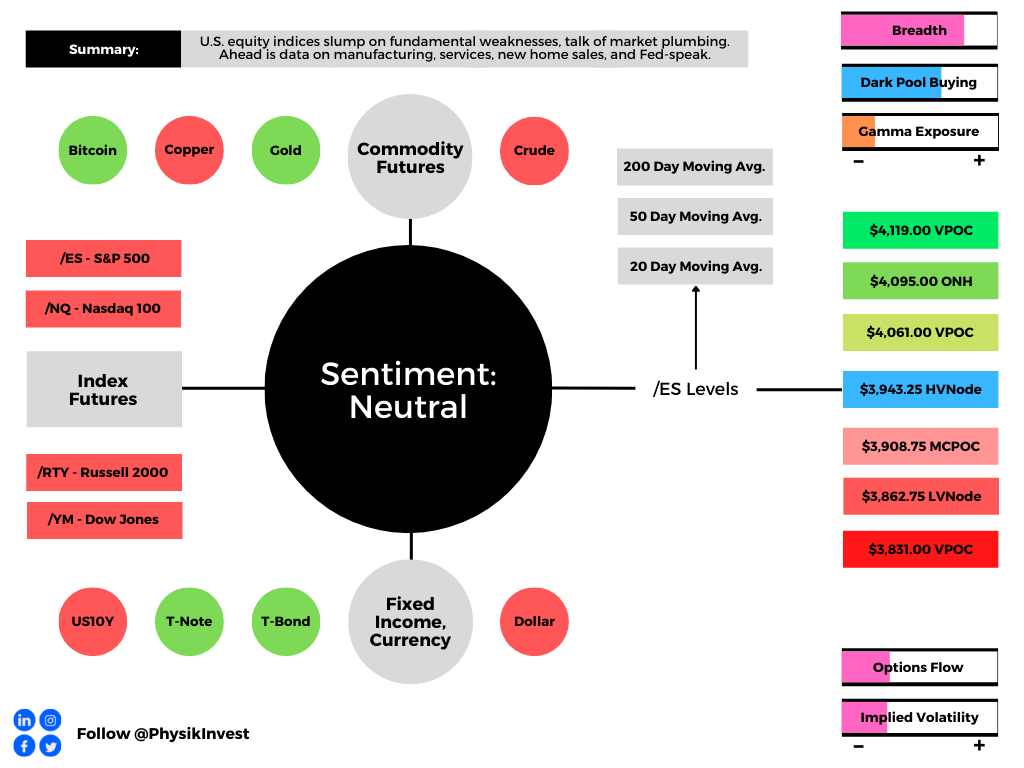
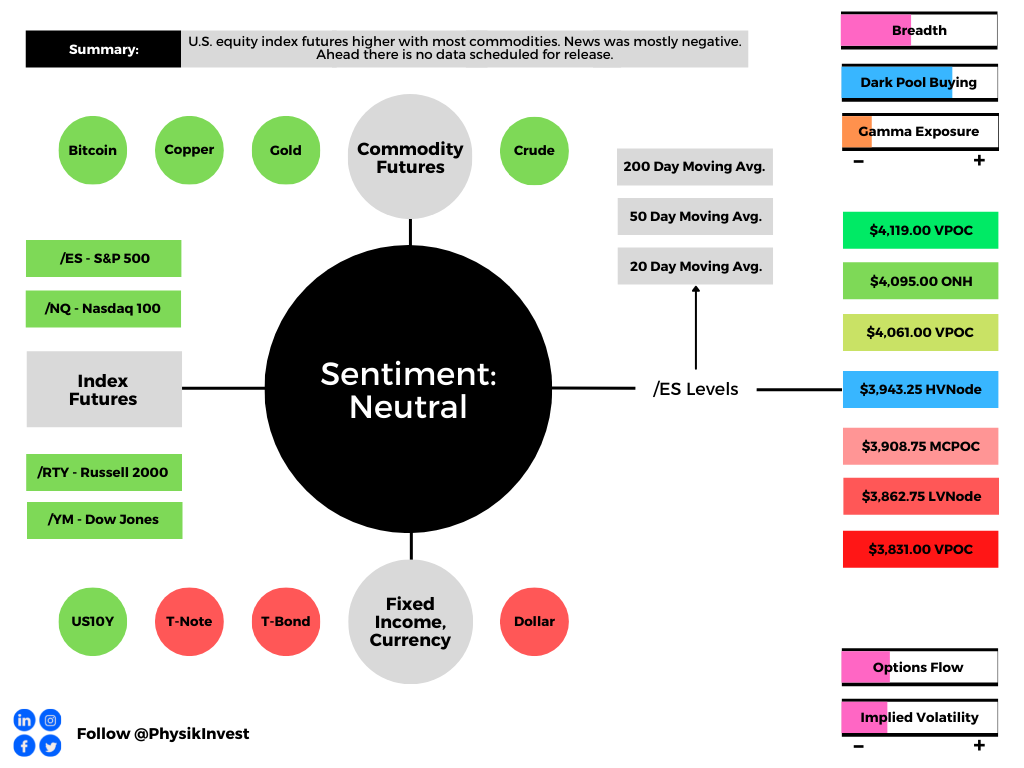
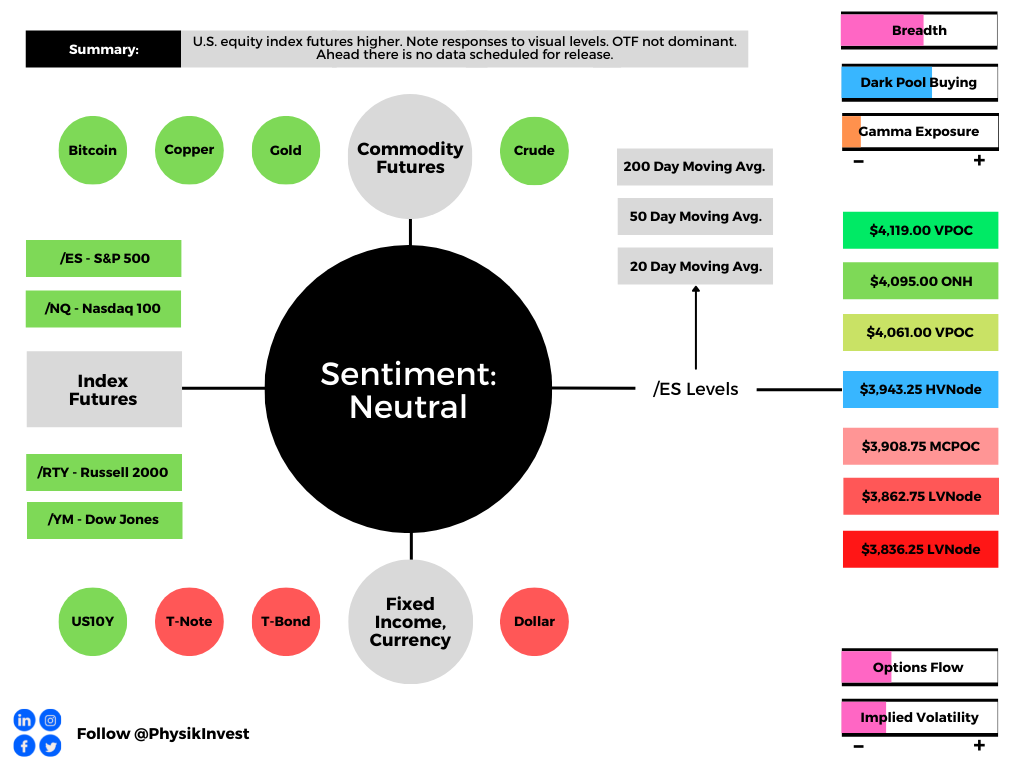
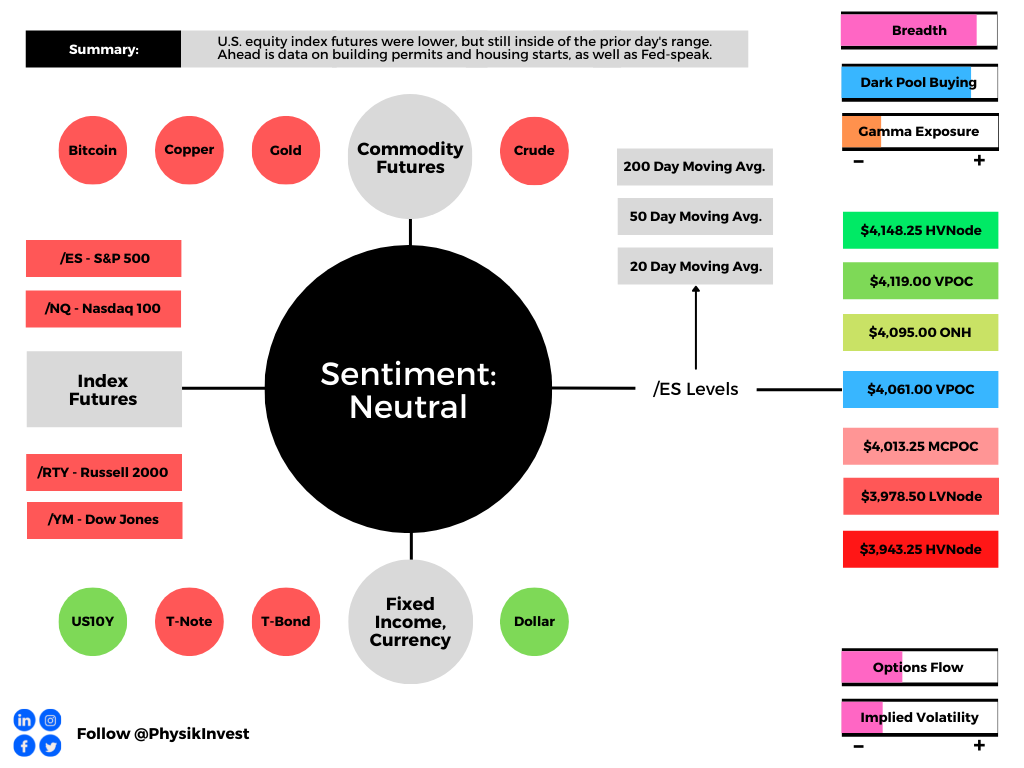
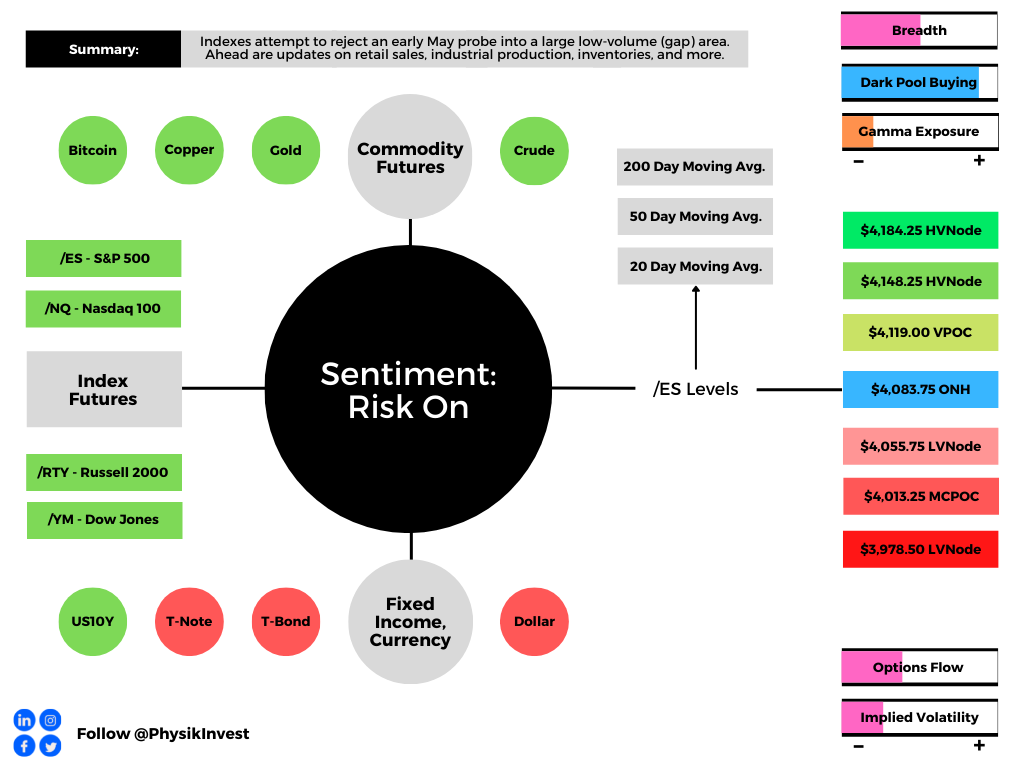
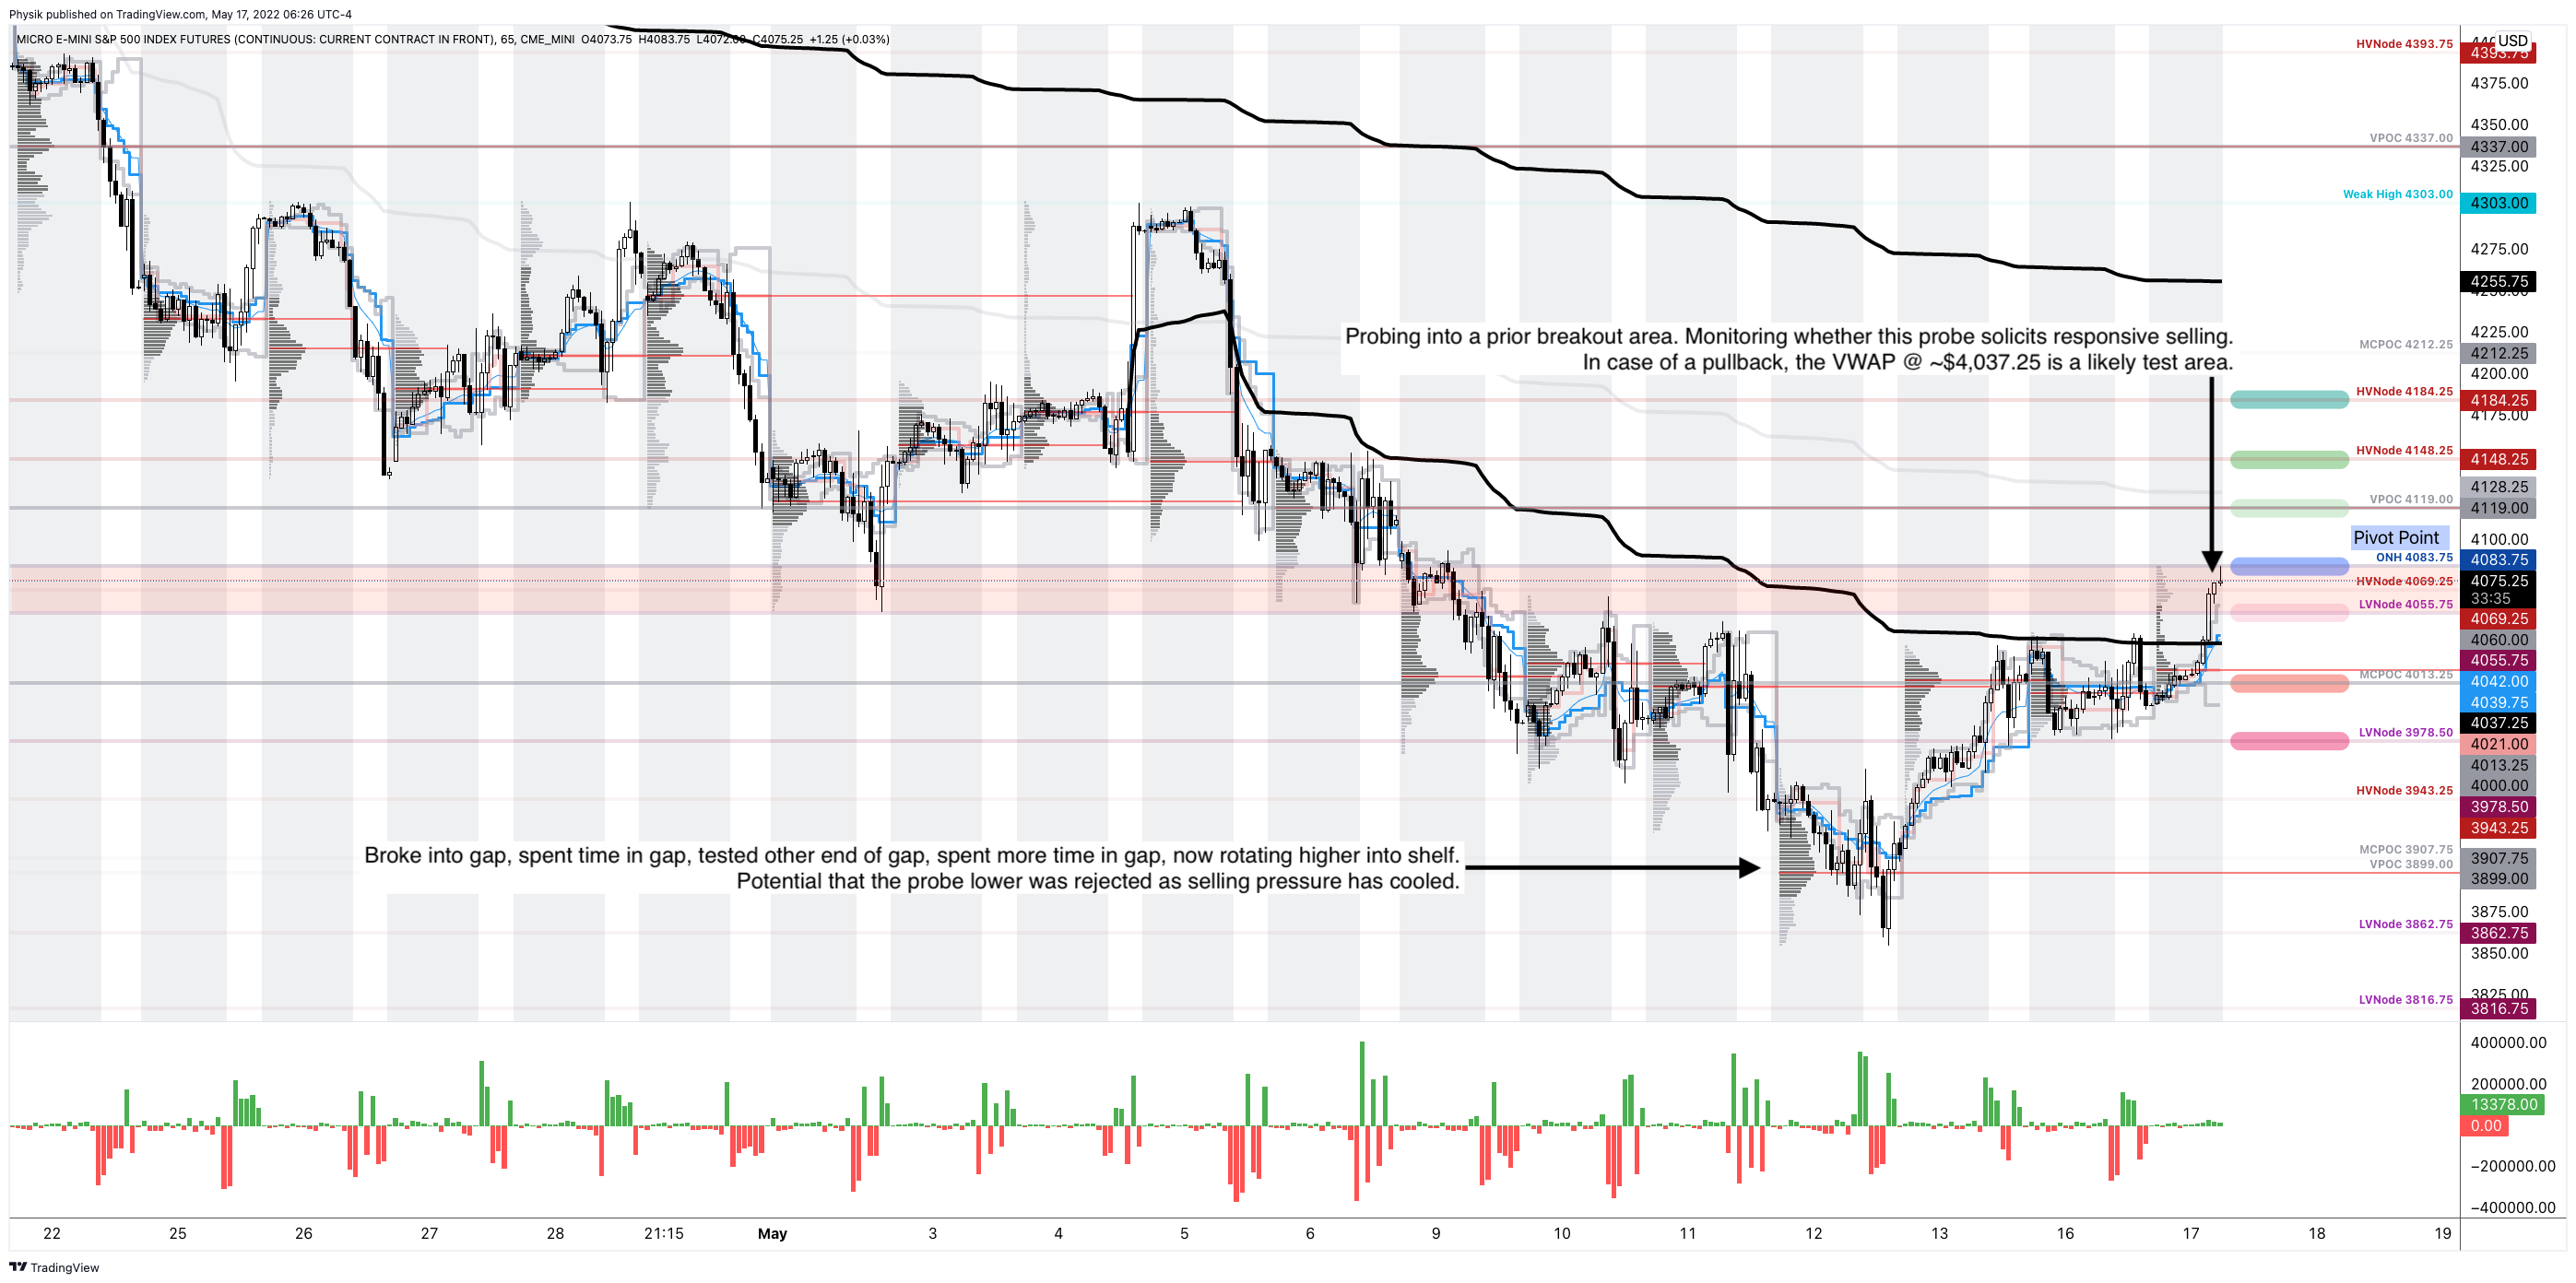
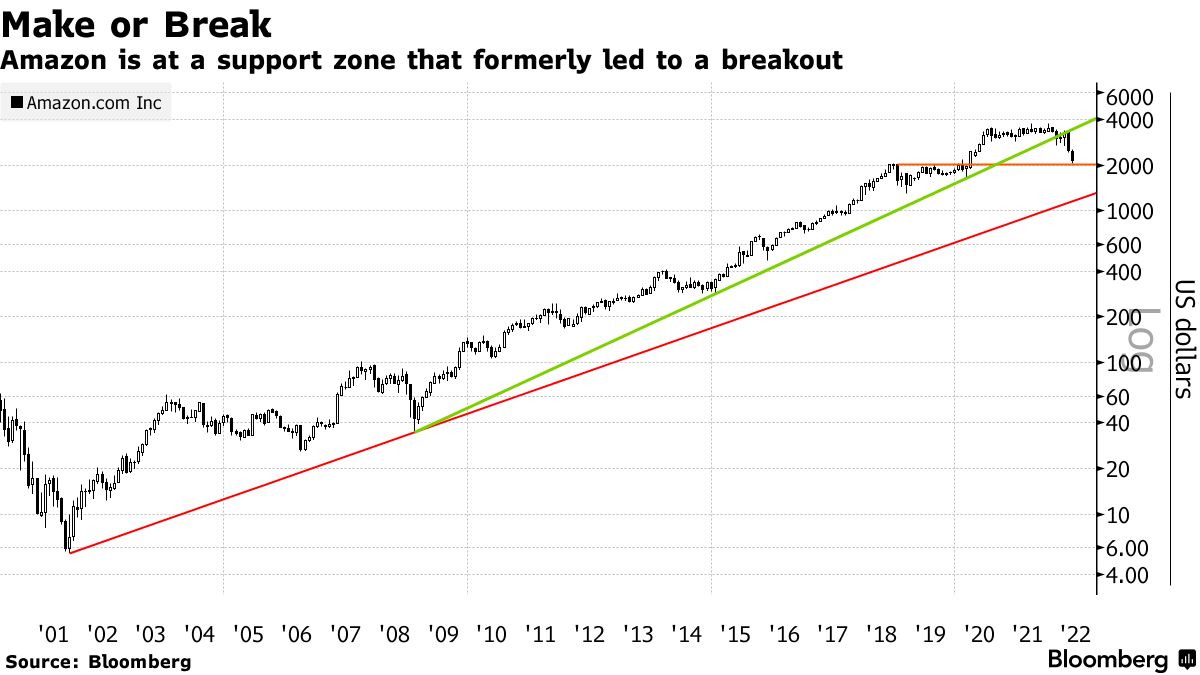
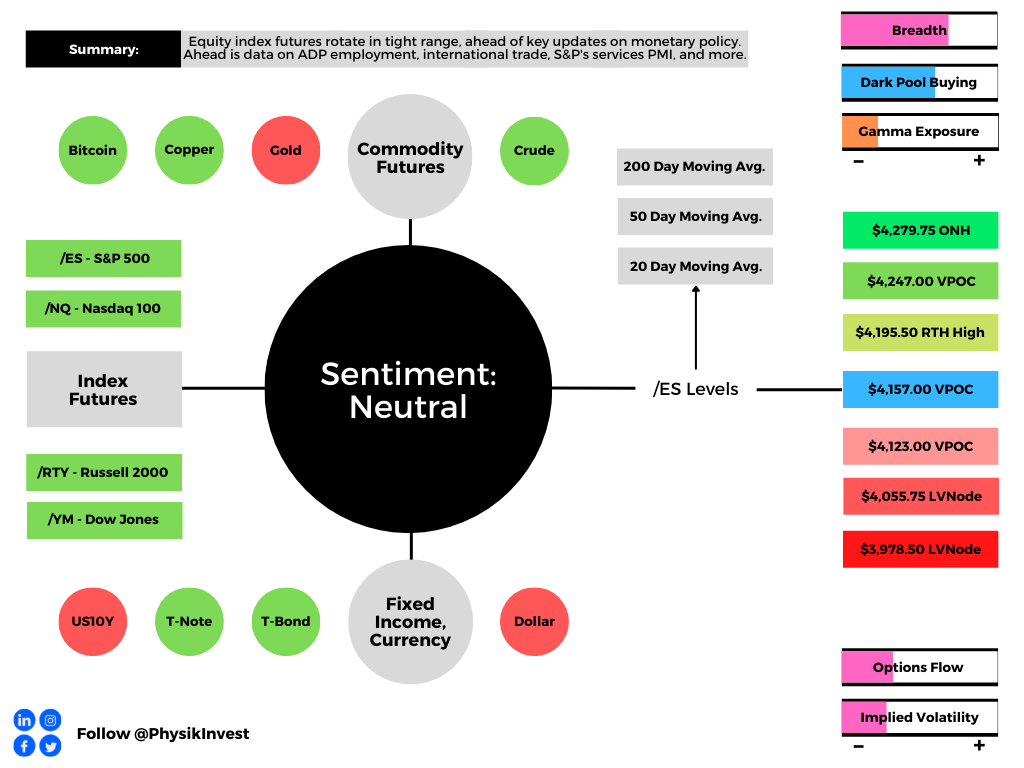
Technical: As of 6:30 AM ET, Tuesday’s regular session (9:30 AM – 4:00 PM ET), in the S&P 500, will likely open in the upper part of a positively skewed overnight inventory, outside of prior-range and -value, suggesting a potential for immediate directional opportunity.
In the best case, the S&P 500 trades higher; activity above the $3,735.75 HVNode puts in play the $3,749.00 ONH. Initiative trade beyond the ONH could reach as high as the $3,773.25 HVNode and $3,821.50 LVNode, or higher.
In the worst case, the S&P 500 trades lower; activity below the $3,735.75 HVNode puts in play the $3,722.50 LVNode. Initiative trade beyond the $3,722.50 LVNode could reach as low as the $3,690.25 HVNode and $3,639.00 RTH Low, or lower.
Click here to load today’s key levels into the web-based TradingView charting platform. Note that all levels are derived using the 65-minute timeframe. New links are produced, daily.

Definitions
Volume Areas: Should the market trend for long periods of time, it will lack sound structure, identified as low volume areas (LVNodes). LVNodes denote directional conviction and ought to offer support on any test.
If participants were to auction and find acceptance into areas of prior low volume (LVNodes), then future discovery ought to be volatile and quick as participants look to HVNodes for favorable entry or exit.
Overnight Rally Highs (Lows): Typically, there is a low historical probability associated with overnight rally-highs (lows) ending the upside (downside) discovery process.
About
After years of self-education, strategy development, mentorship, and trial-and-error, Renato Leonard Capelj began trading full-time and founded Physik Invest to detail his methods, research, and performance in the markets.
Capelj also develops insights around impactful options market dynamics at SpotGamma and is a Benzinga reporter.
Some of his works include conversations with ARK Invest’s Catherine Wood, investors Kevin O’Leary and John Chambers, FTX’s Sam Bankman-Fried, Kai Volatility’s Cem Karsan, The Ambrus Group’s Kris Sidial, among many others.
Disclaimer
In no way should the materials herein be construed as advice. Derivatives carry a substantial risk of loss. All content is for informational purposes only.