Categories
Commentary

Daily Brief For July 15, 2022

The daily brief is a free glimpse into the prevailing fundamental and technical drivers of U.S. equity market products. Join the 300+ that read this report daily, below!

Graphic updated 6:35 AM ET. Sentiment Neutral if expected /ES open is inside of the prior day’s range. /ES levels are derived from the profile graphic at the bottom of the following section. Levels may have changed since initially quoted; click here for the latest levels. SqueezeMetrics Dark Pool Index (DIX) and Gamma (GEX) calculations are based on where the prior day’s reading falls with respect to the MAX and MIN of all occurrences available. A higher DIX is bullish. At the same time, the lower the GEX, the more (expected) volatility. Learn the implications of volatility, direction, and moneyness. Breadth reflects a reading of the prior day’s NYSE Advance/Decline indicator. VIX reflects a current reading of the CBOE Volatility Index (INDEX: VIX) from 0-100.

Fundamental

Note: A really interesting discussion in the below positioning section which tidies up some of the past analyses we’ve made. Read on for more!

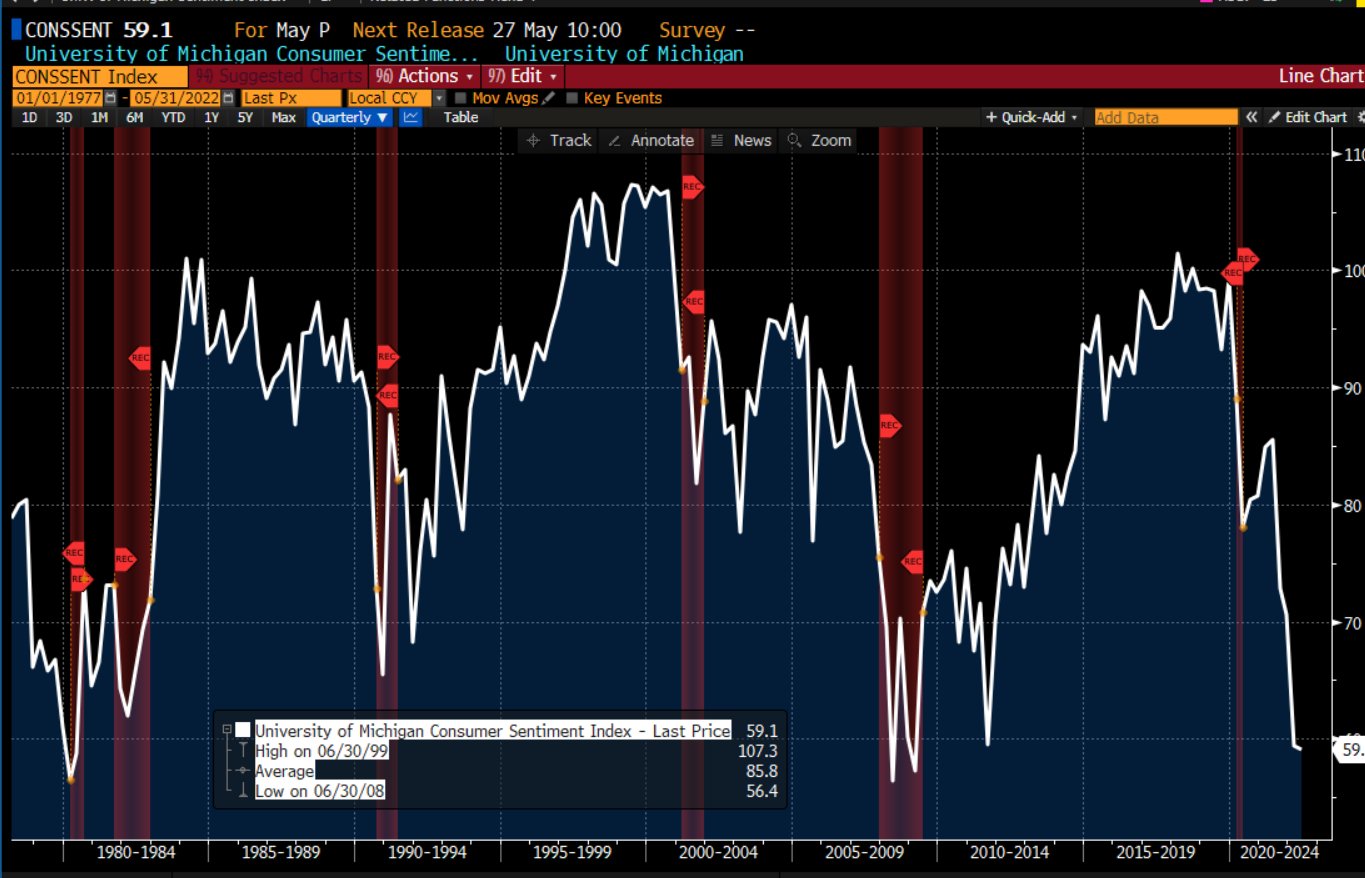
Ahead are updates on retail sales, import prices, Empire State Manufacturing (8:30 AM ET), industrial production and capacity utilization (9:15 AM ET), as well as University of Michigan consumer sentiment and inflation expectations, and business inventories (10:00 AM ET).

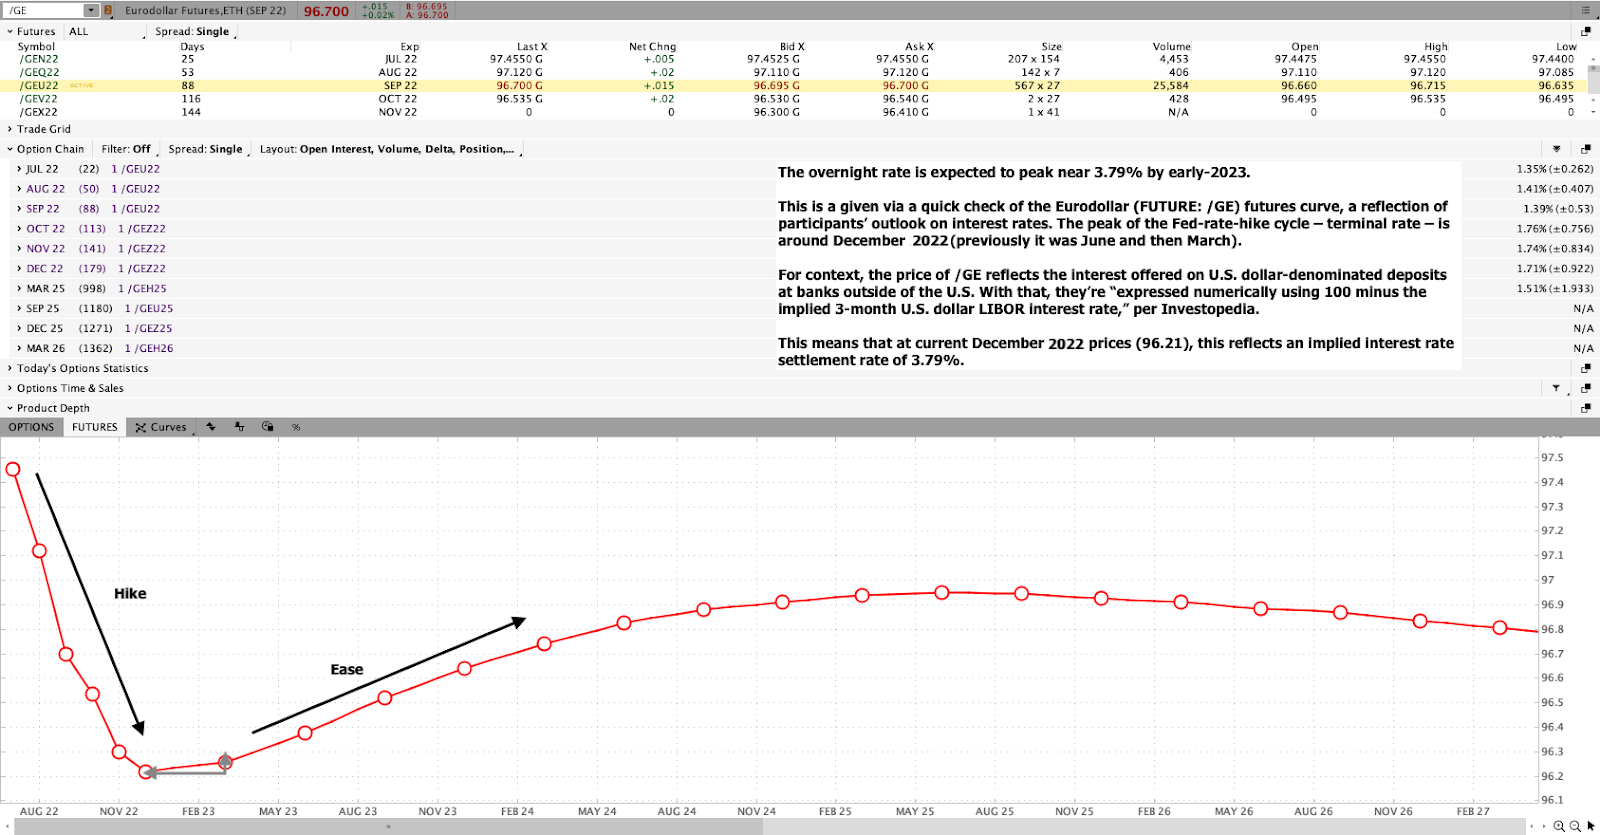
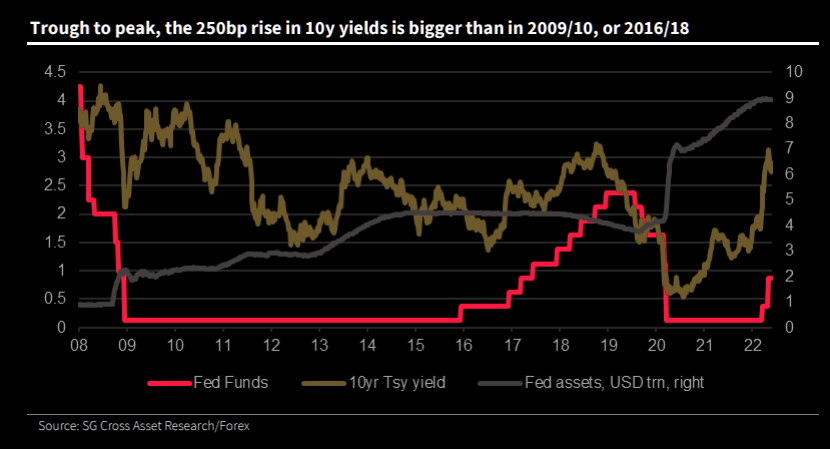
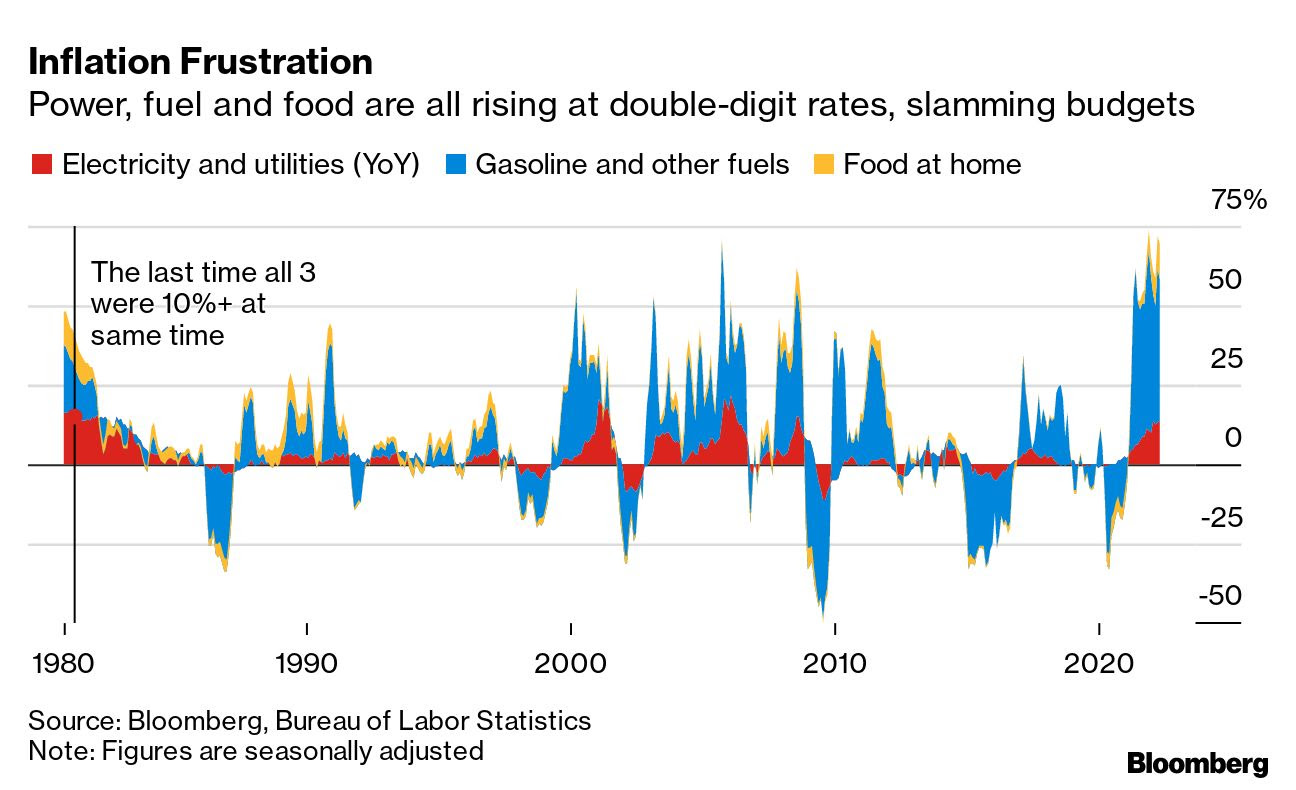
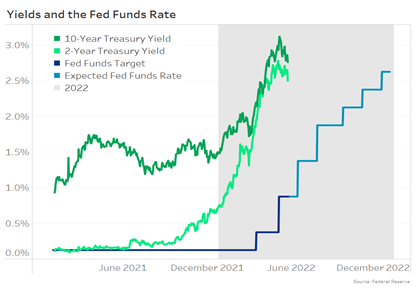
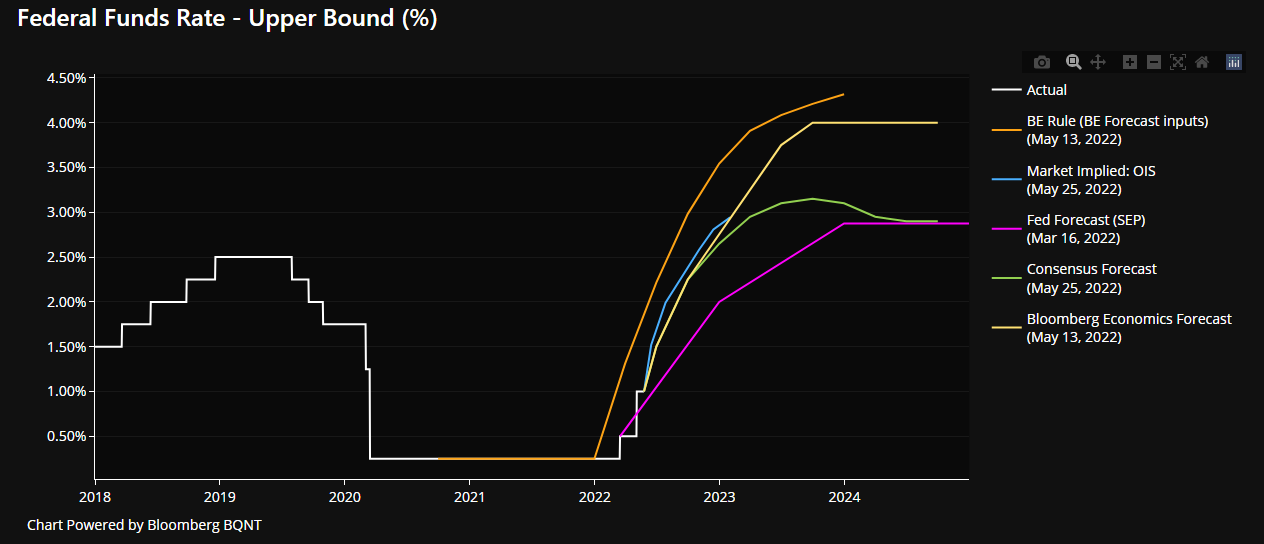
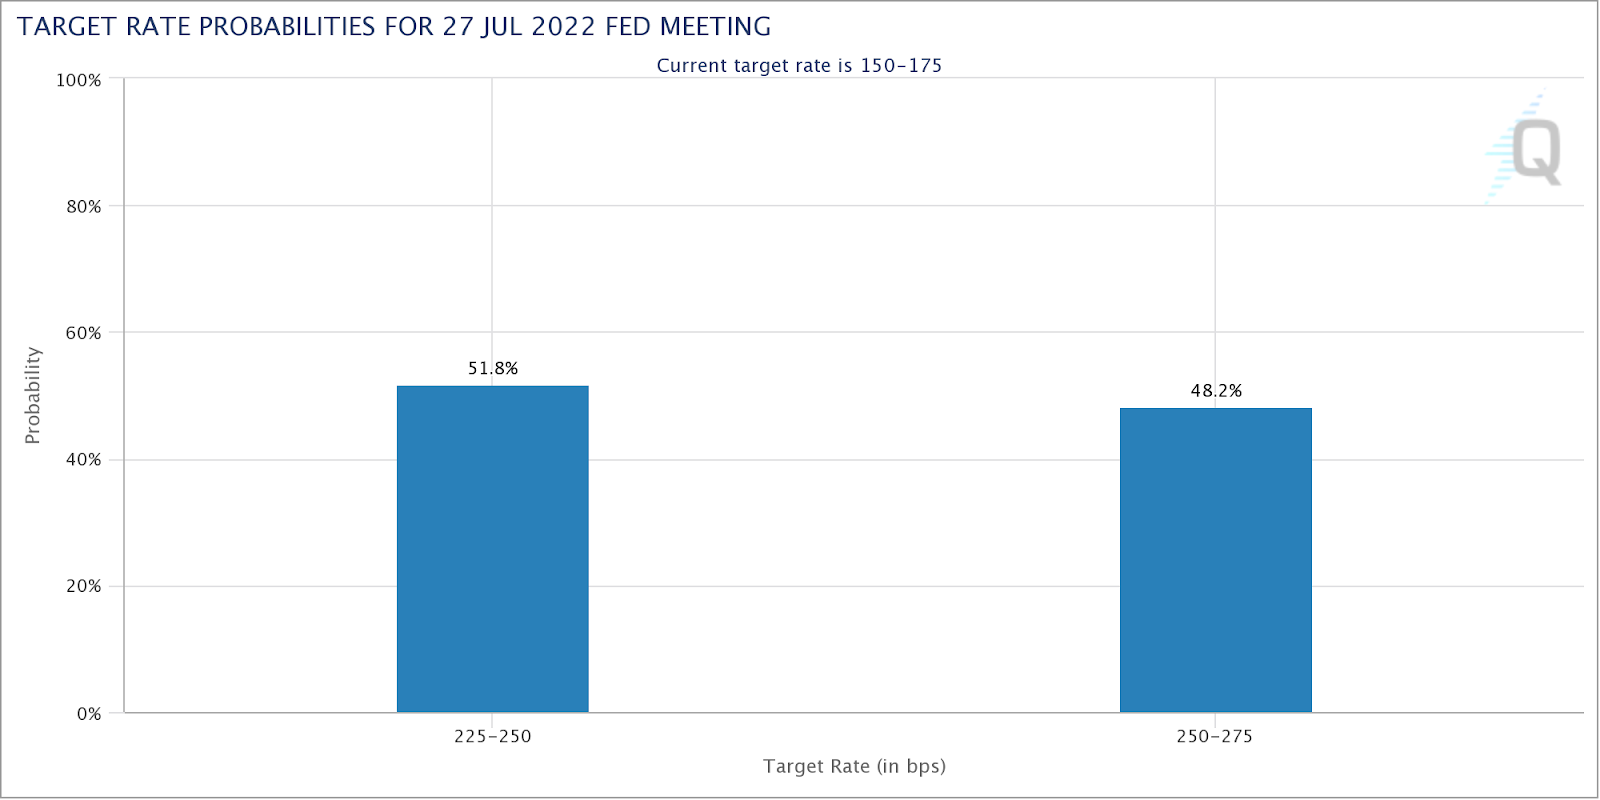
This week, markets repriced after data on inflation came in hot. Participants have bet on tough action from the Federal Reserve (Fed). Now, there is a near-50% chance of a 100 basis point hike later in July.

Graphic: Via CME Group Inc’s (NASDAQ: CME) FedWatch Tool.

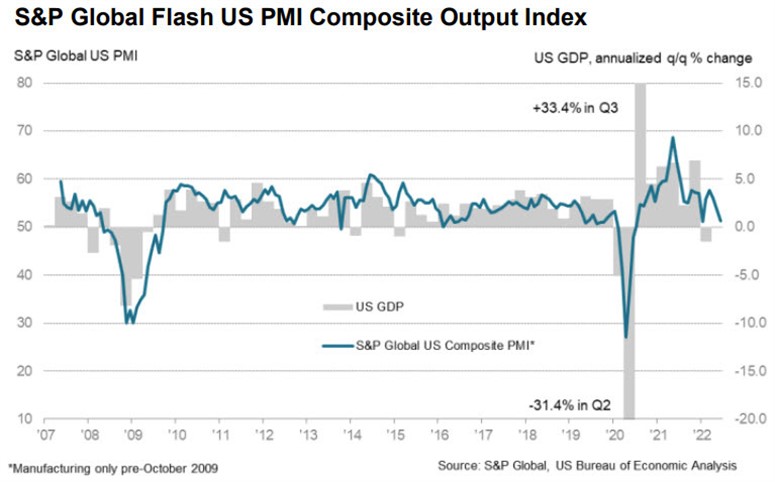
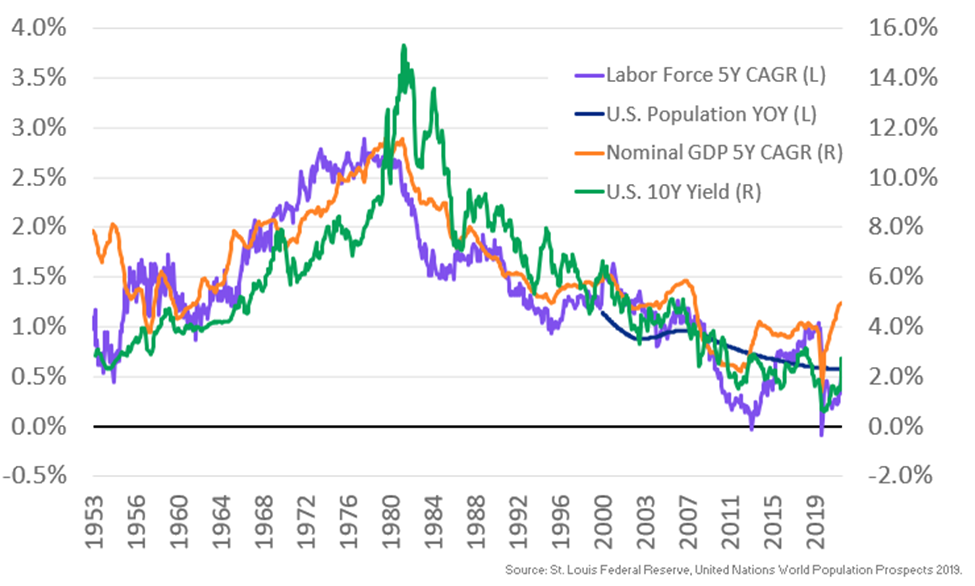
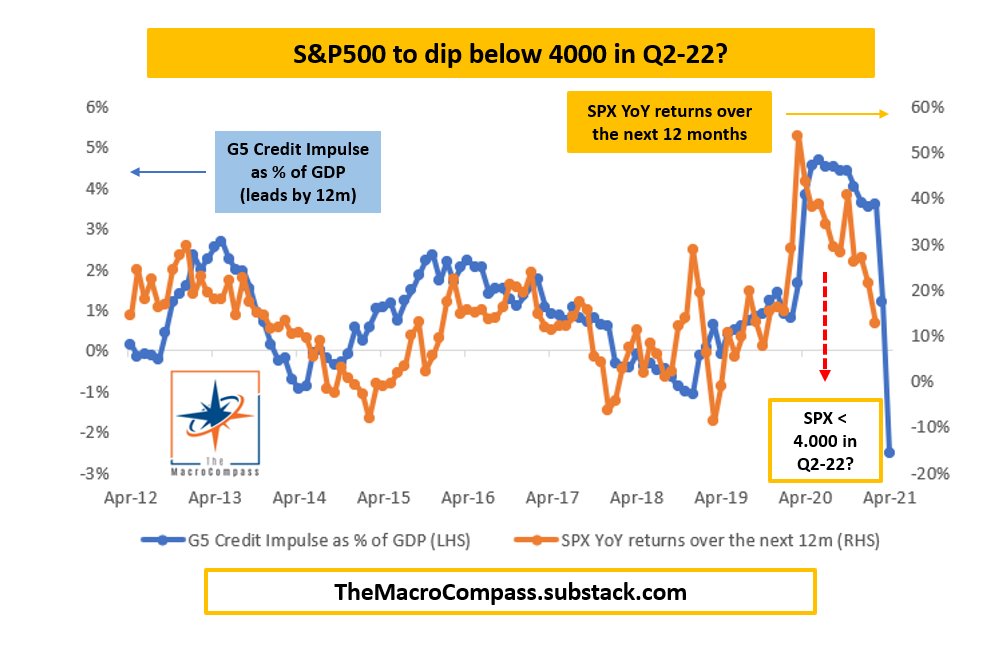
Per The Macro Compass, published by Alfonso Peccatiello, companies have downgraded their outlooks and job creation “is much less impressive” amid labor force shrinkage.

“[T]he number of total employed people in the US divided by its total population in the 25-54y age bracket dropped below 80%,” he explains. “Over the last 30 years, at the peak of each economic cycle, this ratio was over 80%.”

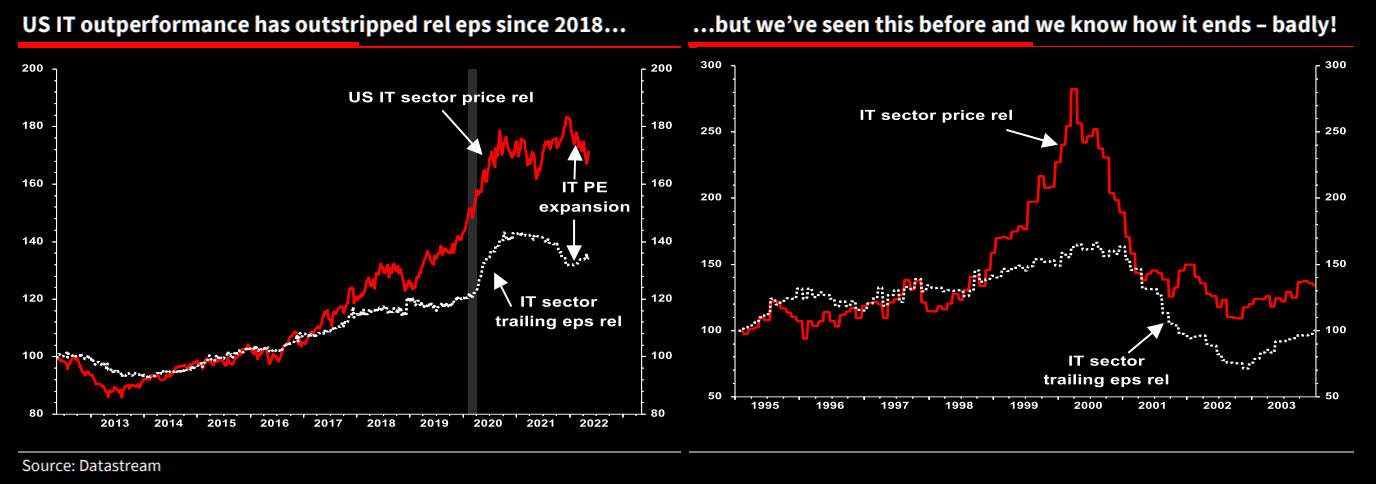
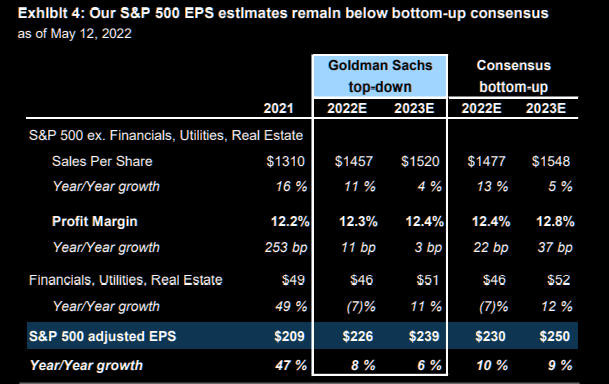
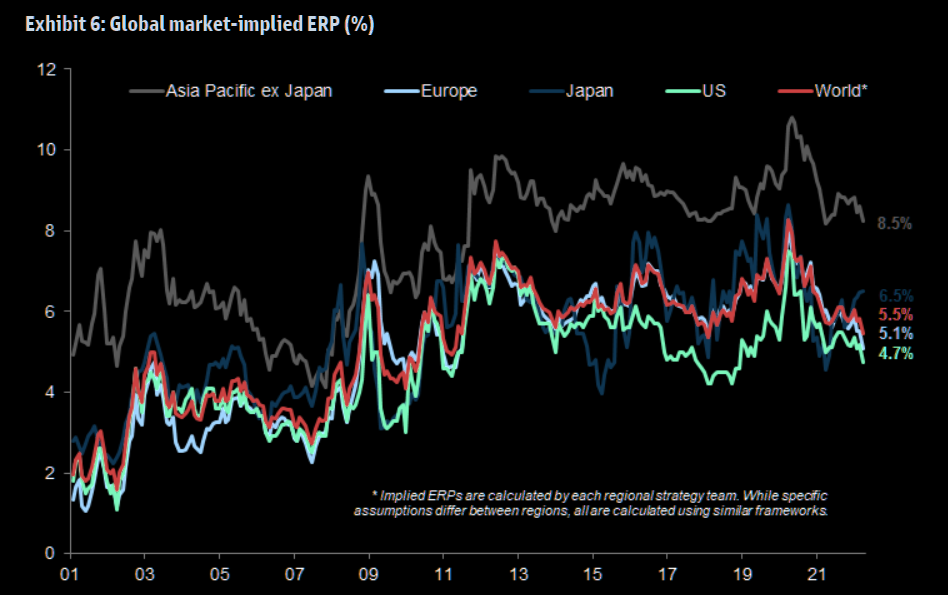
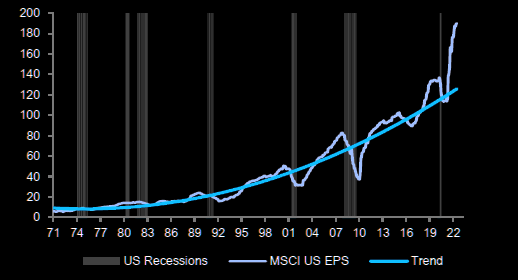
Accordingly, earnings “are nowhere near pricing the economic slowdown, … [and there still remains] way too much optimism.”

Graphic: Retrieved from The Market Ear. Via Barclays Plc (NYCE: BCS).

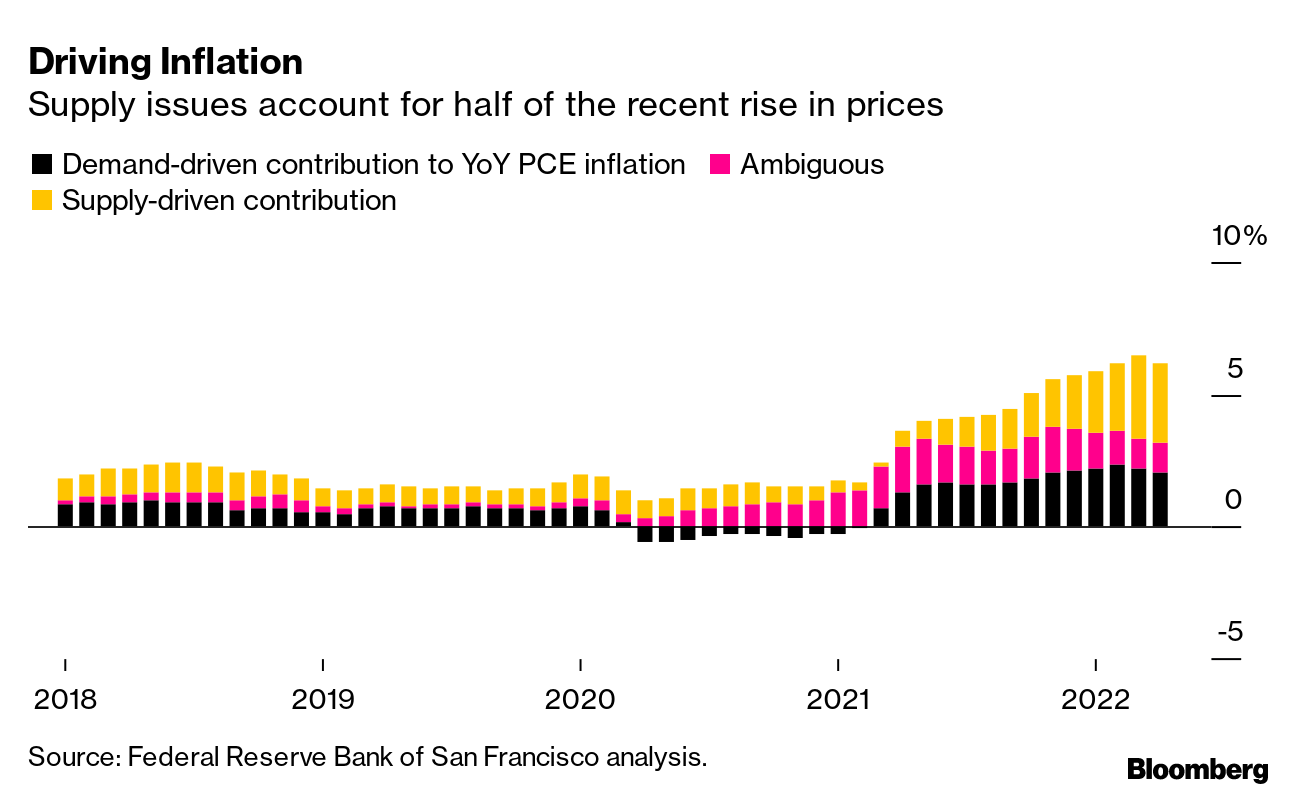
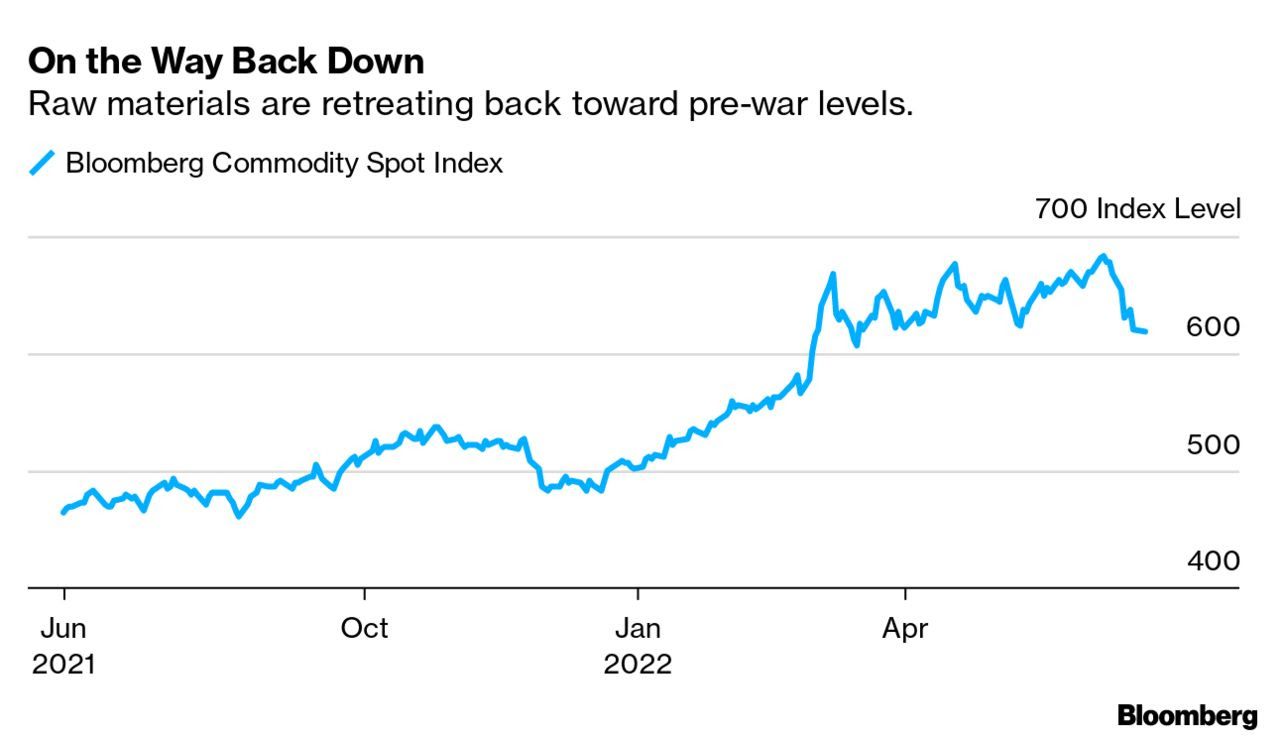
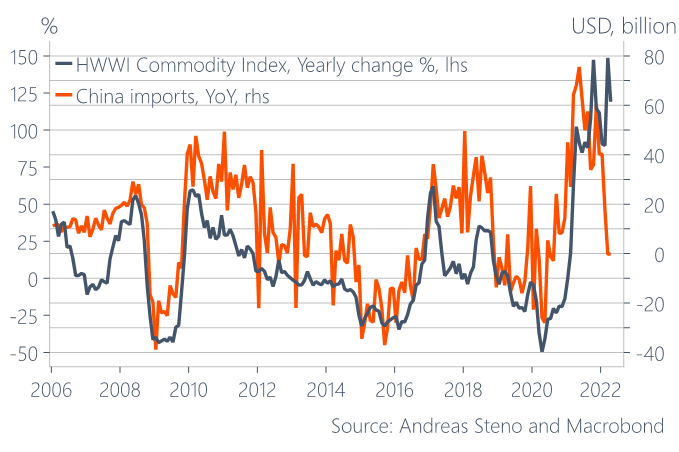
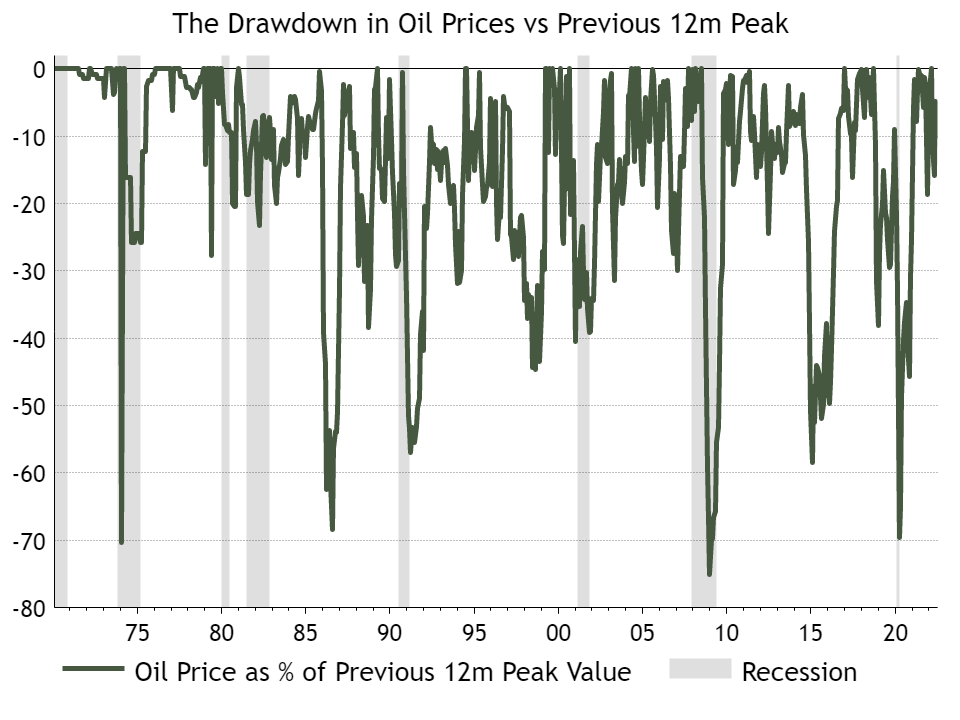
Additionally, commodities (even more so those that are industrial and “are the cleanest expression of global demand”) have endured selling pressure with a near 30% copper drawdown likely to precede positive total returns for long bonds, Peccatiello explains.

Graphic: Retrieved from Callum Thomas. With “[r]ecessions see[ing] oil prices fall by 20% to 70%, … being bullish on oil at this point is either betting against history or [] recession.”

Positioning

The drawdown in commodities is significant as that was, arguably, the last place that offered participants a hedge against their poorly performing bond and equity exposures. 

“A lot of people allocated to commodity trend following and that did a good job in the first two quarters,” The Ambrus Group’s Kris Sidial explained

“CTAs were performing and you had a lot of people who did not need to buy [equity] volatility because their portfolios were covered from the inflation hedges.”

Graphic: Shared by Benn Eifert of QVR Advisors.

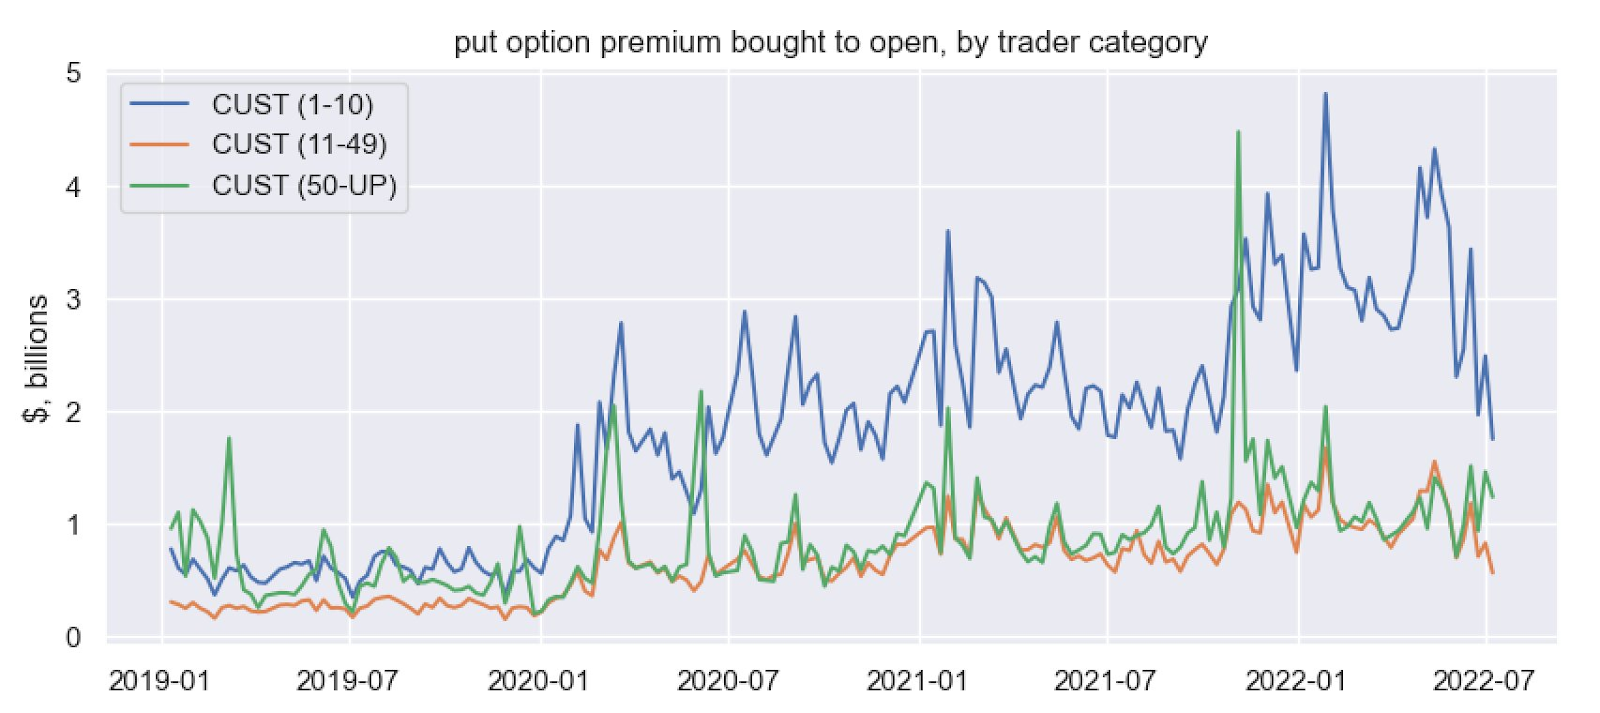
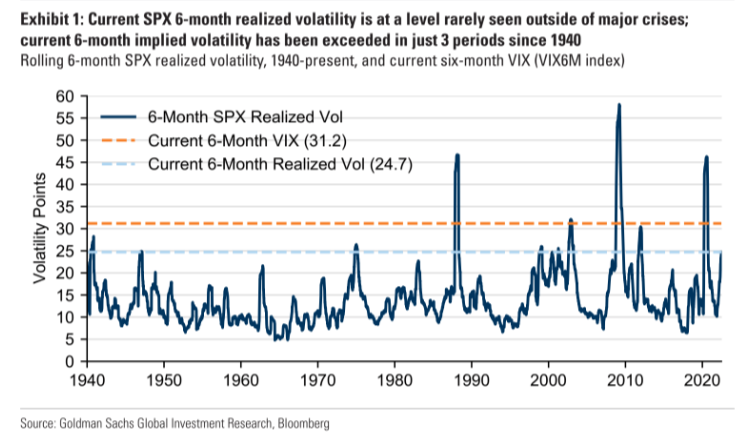
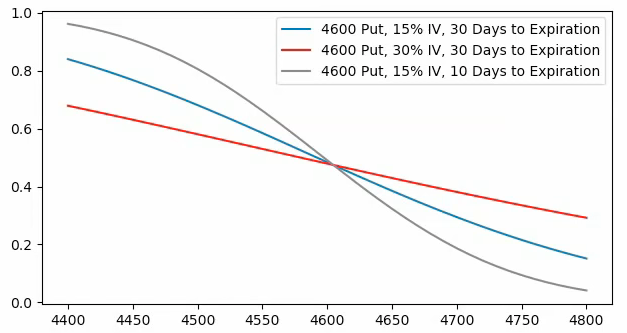
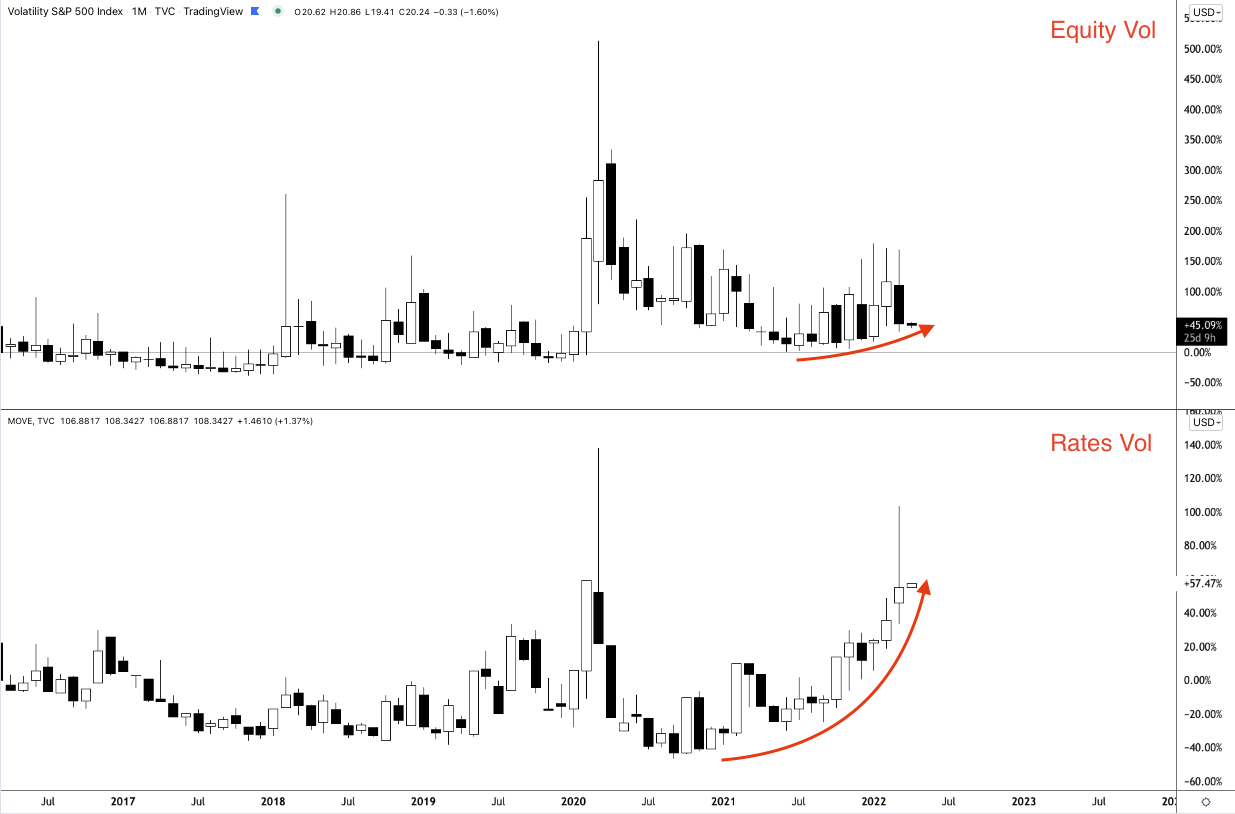
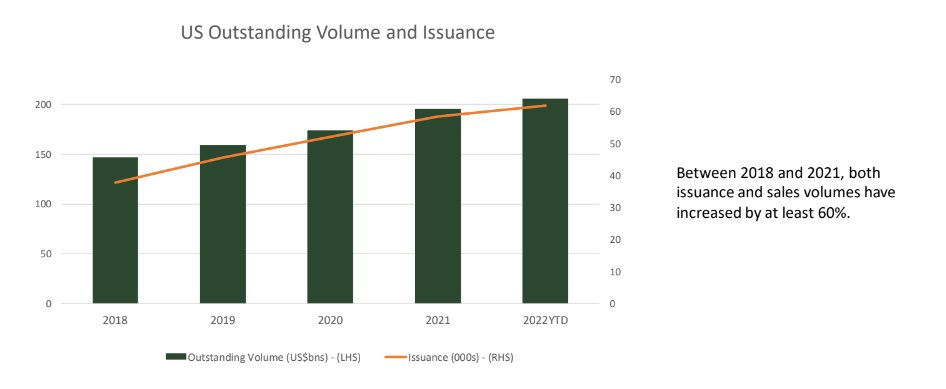
That, coupled with the sale of ultra-short-dated volatility, particularly in some of the single names to capture “rich” volatility, as well as hedging of structured products issuances, continues to play into suppressed index volatility.

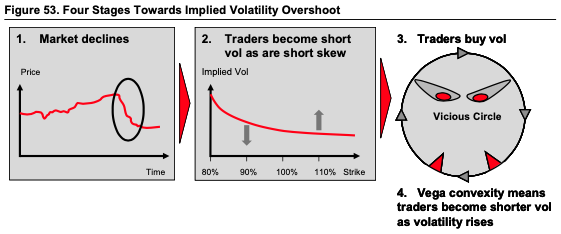
For context: Rising rates and a drive for yield have been a boon for exotic derivatives. 

Participants often seek exposure to products that are essentially short volatility a year or so out. The counterparty, here, is long volatility on these notes. To hedge risk – since “you can’t just be long volatility, … [otherwise] you’ll bleed money for long periods of time” – the bank will hedge risk in the listed market. 

However, on a one-year auto-callable, for which it would be appropriate to sell one-year volatility in the listed market, “some of these banks … create this synthetic calendar profile where they’re … sell[ing] a little bit of one-month vol because they can take in that theta a whole lot faster, or two- and three-month vol,” spreading exposure in buckets.

See, here, for a sample presentation on what is an Auto-Callable Yield Note.

This suppresses “vol in the front of the term structure, and … opens up the door to … that other move where if everybody is selling vol in the front of the term structure,” it may blow out on a large increase in demand.

“If you look back during COVID, there are articles about banks that lost a lot of money because of the[ir] hedges. This has happened previously and you’re seeing little blips of it start to” return.
Graphic: Retrieved from The Ambrus Group’s Kris Sidial. “[S]ome dealers will opportunistically look to sell vol in some buckets in the front of the term structure.”

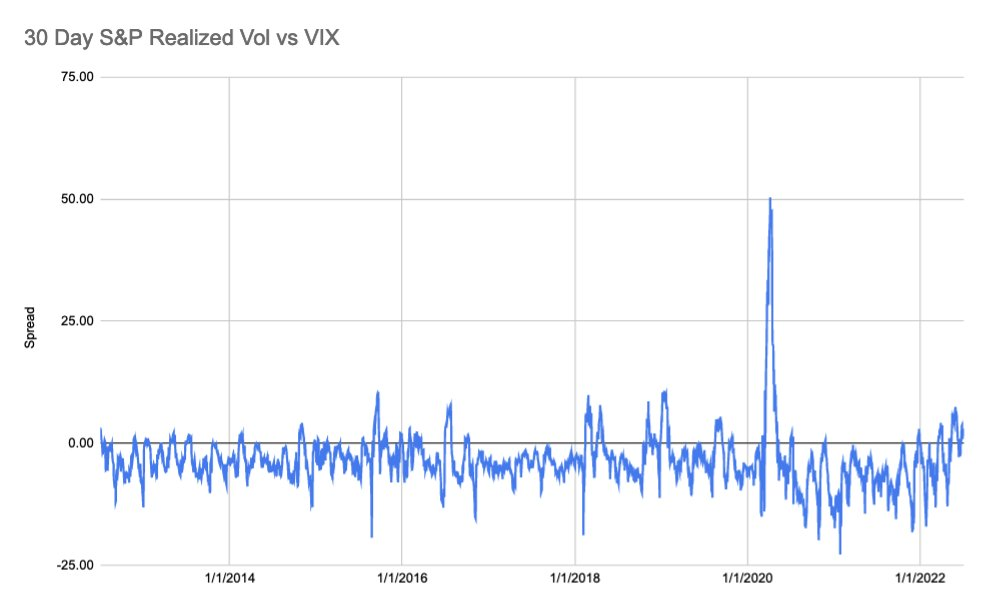
Basically, “the macro landscape … opened up another area to hedge” which resulted in the increased movement of realized equity (RVOL) volatility, relative to that which is implied (IVOL).

Graphic: Via S&P Global Inc (NYSE: SPGI). As explained by SpotGamma, “30-day realized SPX volatility is now trading above the VIX, something that generally shows after major selloffs wherein IV “premium” needs to reset to calmer/higher equity markets.”

Now, with commodities not offering protection, one has to be concerned if “the flock move[s].”

“If commodities are not performing, they’re not going to work as a hedge for your portfolio. That opens the door … [to] markets sliding lower and [people] need[ing] to get hedges on,” which is likely to bid equity volatility where some single names “are only trading three to four vol points above where they were trading in January of 2020,” the complete dismissal of a crash.

Therefore, “if you wanted to go out and hedge, the opportunity is still there in the equity space.”

Technical

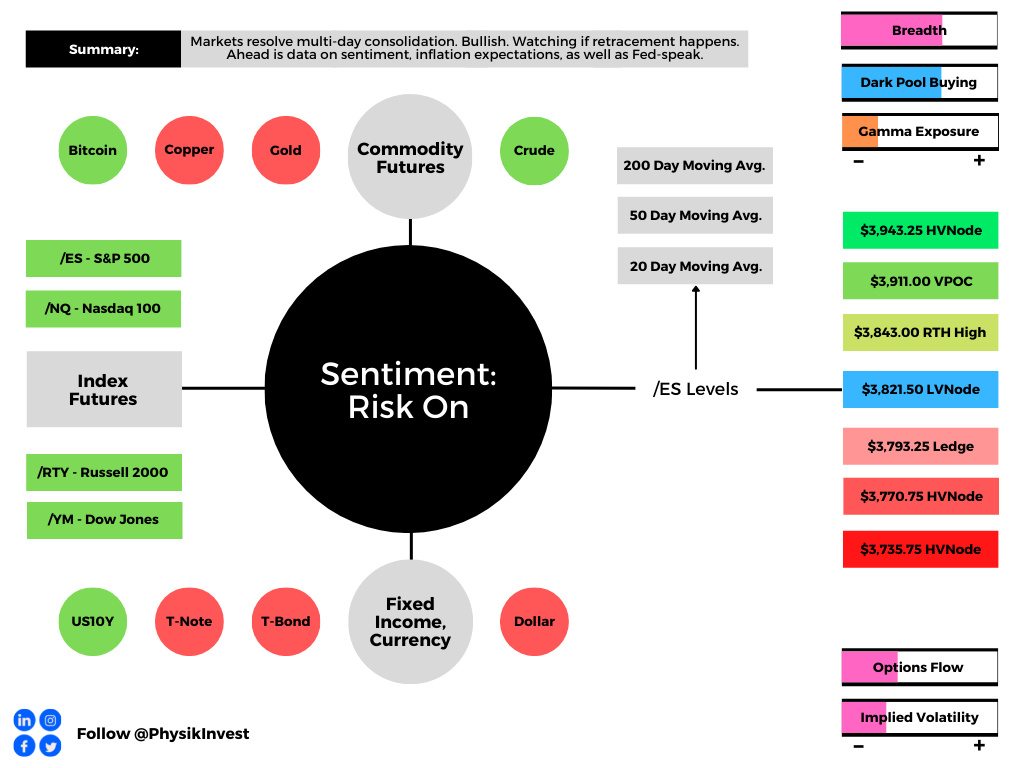
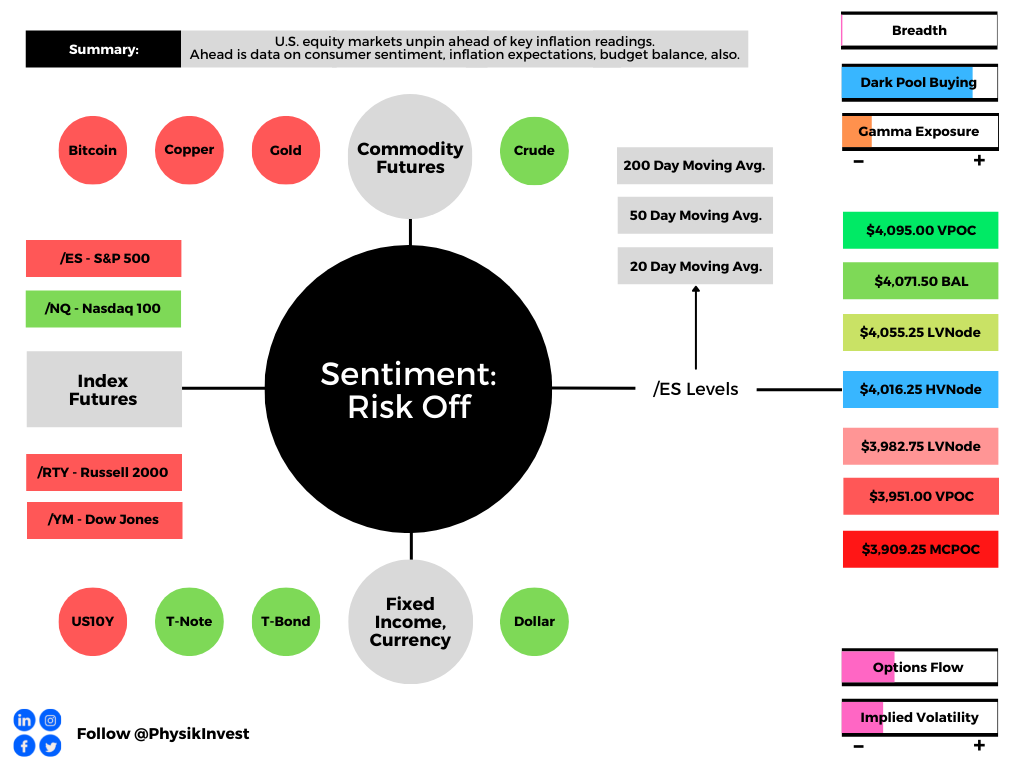
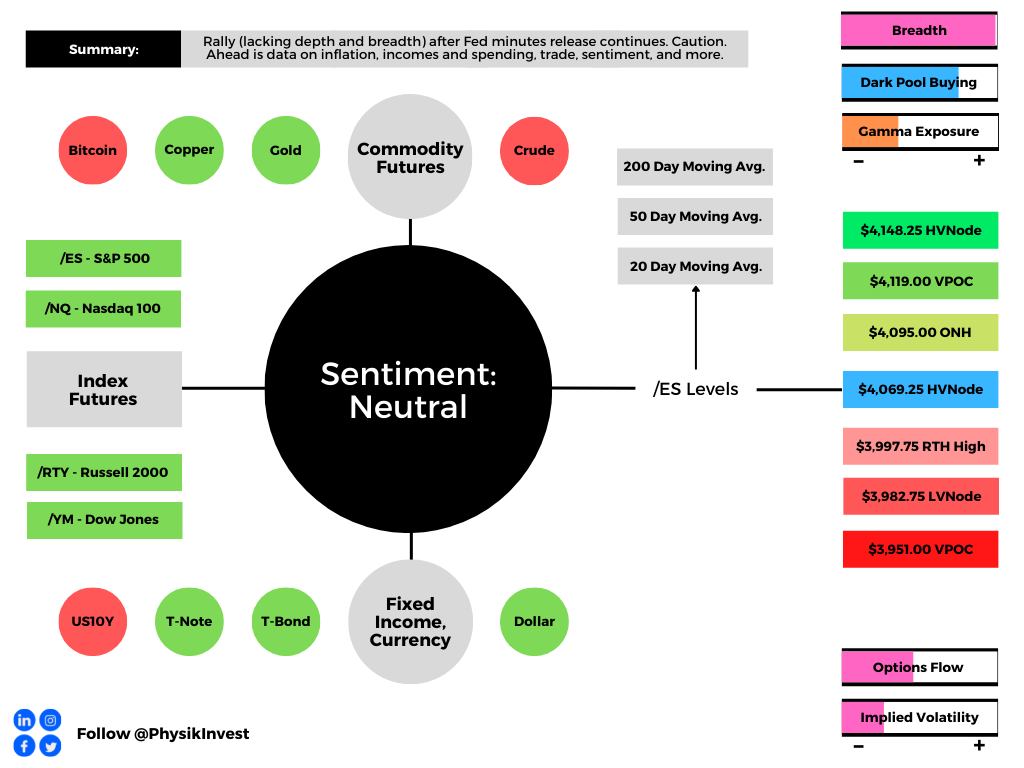
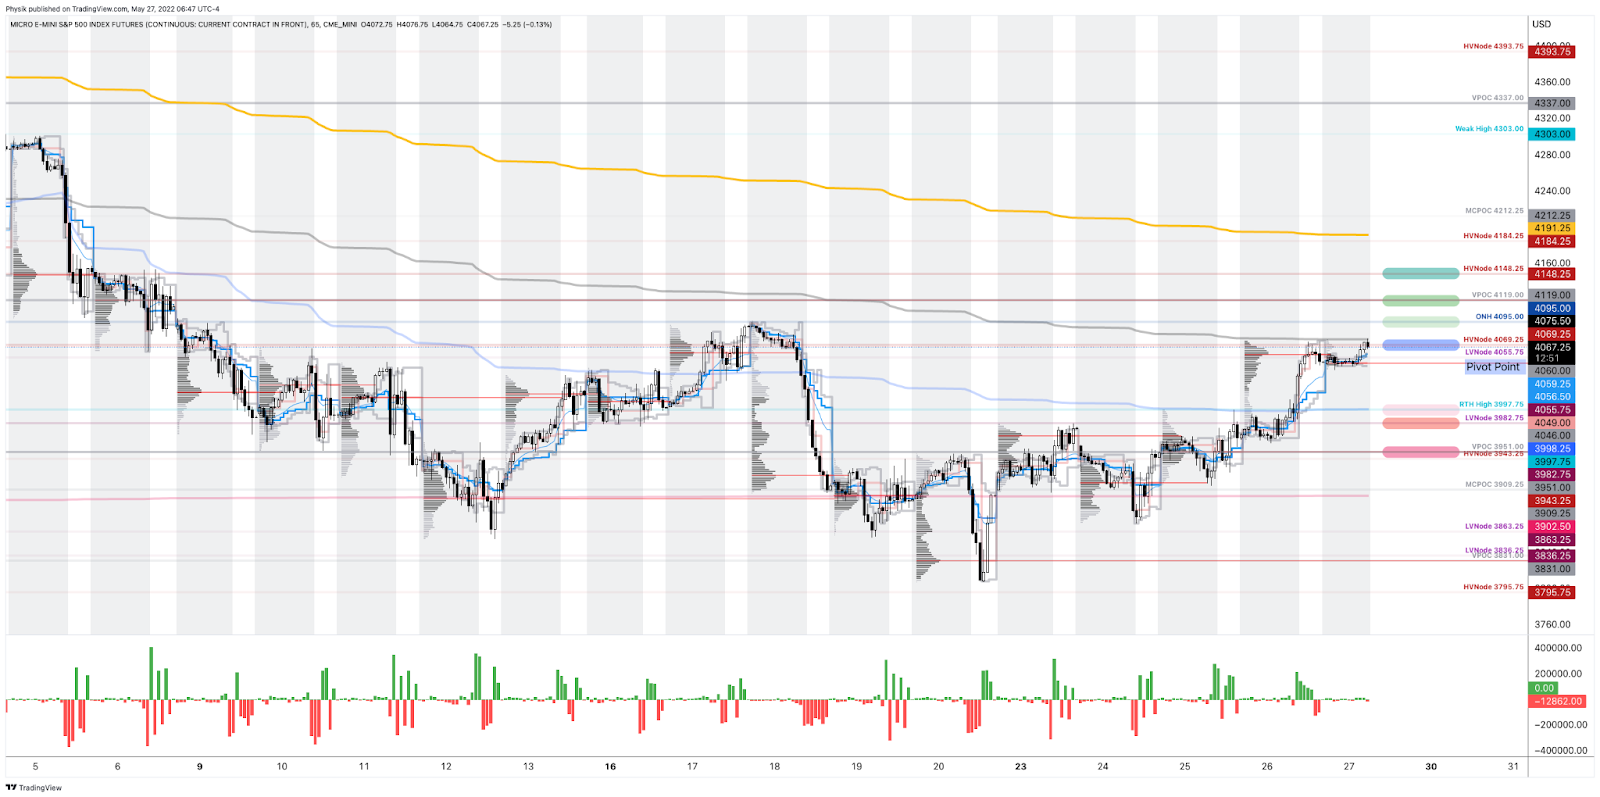
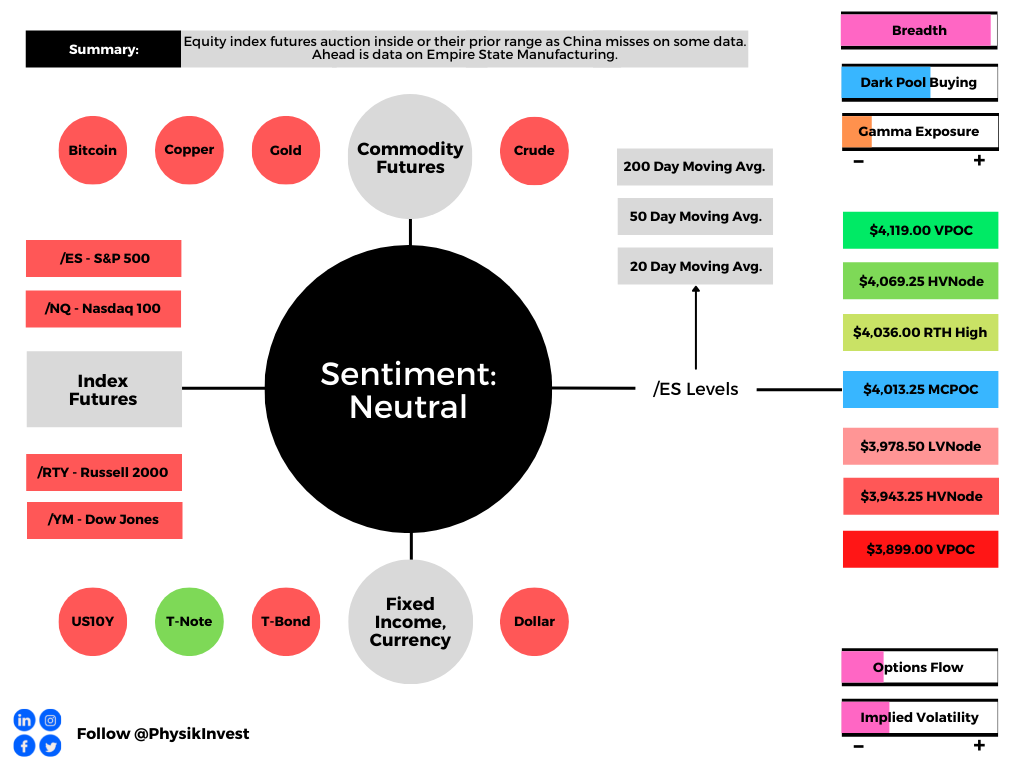
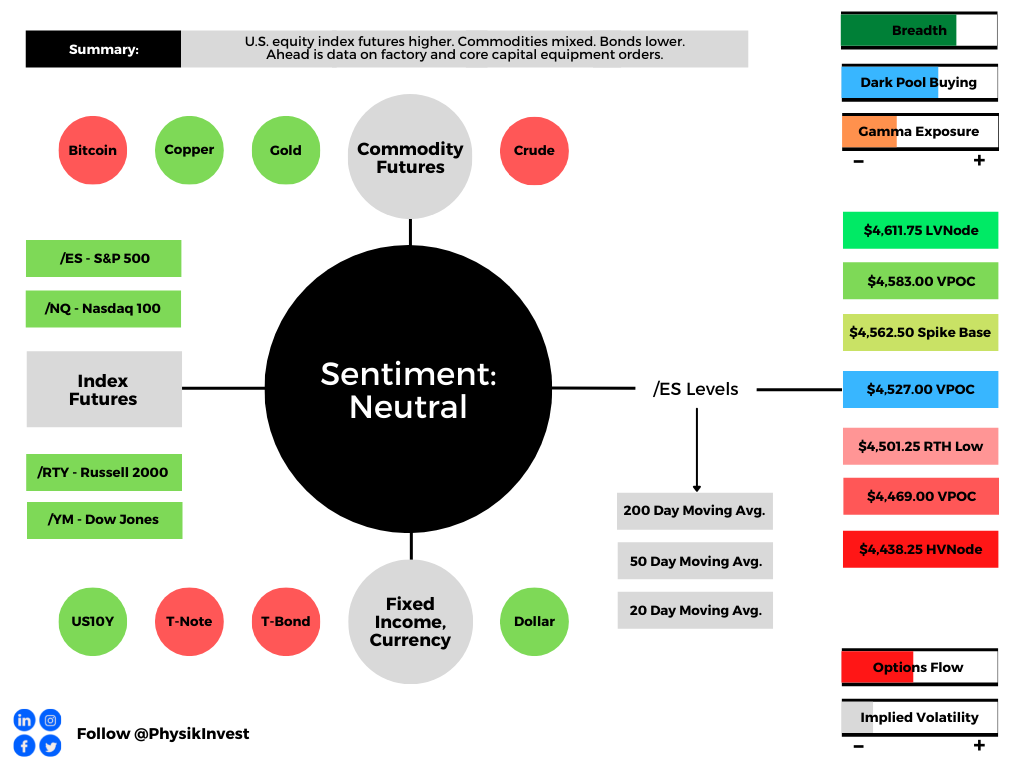
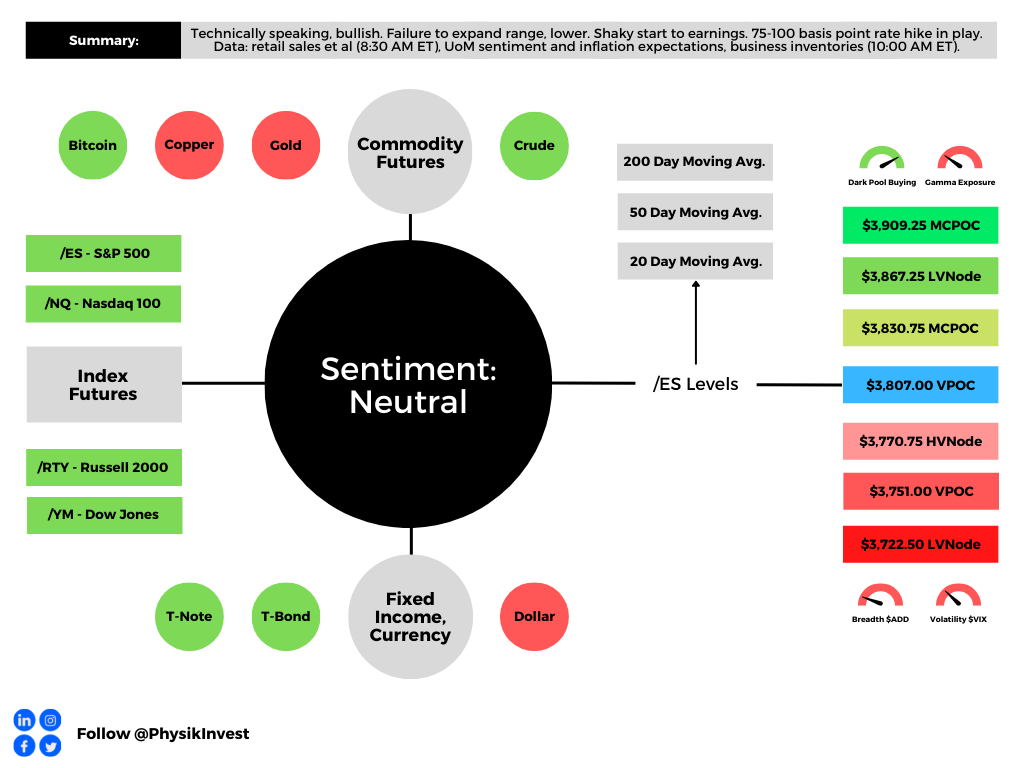
As of 6:30 AM ET, Friday’s regular session (9:30 AM – 4:00 PM ET), in the S&P 500, is likely to open in the middle part of a balanced overnight inventory, inside of prior-range and -value, suggesting a limited potential for immediate directional opportunity.

In the best case, the S&P 500 trades higher.

Any activity above the $3,807.00 VPOC puts into play the $3,830.75 MCPOC. Initiative trade beyond the MCPOC could reach as high as the $3,867.25 LVNode and $3,909.25 MCPOC, or higher.

In the worst case, the S&P 500 trades lower.

Any activity below the $3,807.00 VPOC puts into play the $3,770.75 HVNode. Initiative trade beyond the HVNode could reach as low as the $3,751.00 VPOC and $3,722.50 LVNode, or lower.

Click here to load today’s key levels into the web-based TradingView charting platform. Note that all levels are derived using the 65-minute timeframe. New links are produced, daily.
Graphic: 65-minute profile chart of the Micro E-mini S&P 500 Futures.

Considerations: Responsiveness near key-technical areas (that are discernable visually on a chart), suggests technically-driven traders with short time horizons are very active. 

Such traders often lack the wherewithal to defend retests and, additionally, the type of trade may be indicative of the other time frame participants waiting for more information to initiate trades.

Definitions

Volume Areas: A structurally sound market will build on areas of high volume (HVNodes). Should the market trend for long periods of time, it will lack sound structure, identified as low volume areas (LVNodes). LVNodes denote directional conviction and ought to offer support on any test. 

If participants were to auction and find acceptance into areas of prior low volume (LVNodes), then future discovery ought to be volatile and quick as participants look to HVNodes for favorable entry or exit.

POCs: POCs are valuable as they denote areas where two-sided trade was most prevalent in a prior day session. Participants will respond to future tests of value as they offer favorable entry and exit.

MCPOCs: POCs are valuable as they denote areas where two-sided trade was most prevalent over numerous day sessions. Participants will respond to future tests of value as they offer favorable entry and exit.

Volume-Weighted Average Prices (VWAPs): A metric highly regarded by chief investment officers, among other participants, for quality of trade. Additionally, liquidity algorithms are benchmarked and programmed to buy and sell around VWAPs.

About

After years of self-education, strategy development, mentorship, and trial-and-error, Renato Leonard Capelj began trading full-time and founded Physik Invest to detail his methods, research, and performance in the markets.

Capelj also develops insights around impactful options market dynamics at SpotGamma and is a Benzinga reporter.

Some of his works include conversations with ARK Invest’s Catherine Wood, investors Kevin O’Leary and John Chambers, FTX’s Sam Bankman-Fried, former Bridgewater Associate Andy Constan, Kai Volatility’s Cem Karsan, The Ambrus Group’s Kris Sidial, among many others.

Disclaimer

In no way should the materials herein be construed as advice. Derivatives carry a substantial risk of loss. All content is for informational purposes only.

Categories
Commentary

Daily Brief For June 24, 2022

The daily brief is a free glimpse into the prevailing fundamental and technical drivers of U.S. equity market products. Join the 300+ that read this report daily, below!

What Happened

Overnight, equity index futures resolved a multi-day consolidation and auctioned higher, far beyond the prior day’s range. Commodities were mixed while bonds were lower.

The break from consolidation is one of the most bullish happenings in weeks. We’re monitoring whether participants add to their recent short volatility bets against direction, or whether there is repositioning and this bolsters the initiative probe.

Ahead is data on University of Michigan consumer sentiment, inflation expectations, and new home sales (10:00 AM ET), as well as some Fed speak (7:30 AM and 4:00 PM ET).

Graphic updated 6:40 AM ET. Sentiment Risk-On if expected /ES open is above the prior day’s range. /ES levels are derived from the profile graphic at the bottom of the following section. Levels may have changed since initially quoted; click here for the latest levels. SqueezeMetrics Dark Pool Index (DIX) and Gamma (GEX) calculations are based on where the prior day’s reading falls with respect to the MAX and MIN of all occurrences available. A higher DIX is bullish. At the same time, the lower the GEX, the more (expected) volatility. Learn the implications of volatility, direction, and moneyness. SHIFT data used for S&P 500 (INDEX: SPX) options activity. Note that options flow is sorted by the call premium spent; if more positive, then more was spent on call options. Breadth reflects a reading of the prior day’s NYSE Advance/Decline indicator. VIX reflects a current reading of the CBOE Volatility Index (INDEX: VIX) from 0-100.

What To Expect

Fundamental: To start, I want to apologize for any confusion, yesterday, with respect to the /GE Eurodollar quote. This newsletter said the peak of the Fed-rate-hike cycle – terminal rate – sat near December 2023. 

That’s wrong. It’s December 2022.

Graphic: Via Charles Schwab Corporation-owned (NYSE: SCHW) TD Ameritrade’s Thinkorswim. The Eurodollar (FUTURE: /GE) futures curve is a reflection of participants’ outlook on interest rates. The peak of the Fed-rate-hike cycle – terminal rate – is around DEC 20[22].

Okay, moving on, now!

New data is pointing to a “remarkable” drop in demand for goods and services during June, compared to months prior. 

“US economic growth has slowed sharply in June, with deteriorating forward-looking indicators setting the scene for an economic contraction in the third quarter,” S&P Global (NYSE: SPGI) Market Intelligence’s Chris Williamson explained.

“The survey data are consistent with the economy expanding at an annualized rate of less than 1% in June, with the goods-producing sector already in decline and the vast service sector slowing sharply.”

Graphic: Via S&P Global Inc. “This is a sizeable miss and evidence of a quick slowdown in demand, though it’s still in positive territory (above 50). This report is consistent with a shifting narrative away from inflation worries and towards growth worries.”

Businesses (particularly in retail) are way “more concerned about the outlook” of costs and demand, as well as the path in monetary policies and deterioration in financial conditions. 

Graphic: Via Bloomberg. “Supply constraints, exacerbated by Russia’s war in Ukraine this year, account for about half of the surge in US inflation, with demand currently making up a third of the increase, according to new research from the Federal Reserve Bank of San Francisco.”

That’s validated by Tesla Inc’s (NASDAQ: TSLA) CEO Elon Musk speaking about the carmaker’s losses from new plants, supply chain problems, and the like. 

Graphic: Via Bloomberg. “Long-term ocean freight rates between China and the US West Coast are higher than spot prices for the first time since April 2020.”

“The past two years have been an absolute nightmare of supply chain interruptions, one thing after another,” Musk said.

“We’re not out of it yet. That’s overwhelmingly our concern is how do we keep the factories operating so we can pay people and not go bankrupt.”

Graphic: Via Bloomberg. “Supply chains in Asia look to be on the mend,” though it will “ take a while for supply and demand to rebalance.”

It’s a global move into recession all at once, as Jeffrey Snider of Alhambra Investments says

Read: Daily Brief for May 18, 2022

“​​Combine the potential for break in repo collateral with economy heading toward recession, no wonder the Euro[dollar] curve inversion is spreading as rapidly as it has. Possibility of something big going wrong, therefore ending rate hikes, is huge now.”

“Euro[dollar] squeeze, collateral shortage, deflationary potential in money, and now demand destruction in global real economy.”

Graphic: Via Alhambra Investments.

Over the last four decades, monetary policy was a go-to for supporting the economy. Money was sent to capital and that promoted innovation and, by that token, deflation, ultimately creating “unimportance to cash flows,” as well put by Kai Volatility’s Cem Karsan. 

Now, there’s a strong commitment to reducing liquidity and credit, all the while there are chokepoints monetary policymakers have little control over. 

This has consequences on the real economy and asset prices, accordingly, which rose and kept deflationary pressures at bay. A stock market drop is both a recession and a direct reflection of the unwind of carry. It is the manifestation of a deflationary shock, and today’s poor sentiments and economic data reflects this.

At the same time, “bonds are not acting as a hedge and appear to be becoming less ‘money’ like due persistent declines in price and elevated rate vol,” as Joseph Wang puts it. 

Bank deposits are to drain about $1 trillion or so by year-end, prompting investors to “continue to lower their selling prices to compete for the cash they want.”

Retail buyers, who, according to Michael Wang of Prometheus Alternative Investments, “were a significant driver of the inflated valuations we saw in tech and crypto,” are capitulating in stocks, all the while froth in housing markets is soon to abate, likewise.

Notwithstanding, Mark Zandi of Moody’s Corporation (NYSE: MCO) does not see “the kind of mortgage defaults and distressed sales that would be necessary for big declines in housing values,” just as prices of raw materials are retreating as inventories are bloating.

As put forth, partially, earlier this week, one has to wonder about the likelihood that inflation is near its high and whether the de-rates have played their course.

Let’s keep an open mind and follow up on this, in detail, next week.

Graphic: Via Bloomberg. “The hot commodities rally is cooling off fast as recession fears again ground and cloud the outlook for demand.”

Positioning: Keeping this section short. 

As stated yesterday, a feature of the equity sell-off is the suppression of implied volatility (IVOL) versus that which the market realizes (RVOL) given that participants are hedged and volatility remains in strong supply. 

Read: Daily Brief for June 23, 2022.

Graphic: Via Goldman Sachs Group Inc (NYSE: GS).

Options data and insights platform SqueezeMetrics explained that this is due in part to lower leverage, too.

“Leveraged long S&P lost favor (understandable), and marginal demand for puts went with it. Creeping into net selling territory is ‘smart’ bear market positioning. Short delta, short skew.”

Graphic: Via SqueezeMetrics.

As I said in SpotGamma’s note, last night, given “the high starting point in IVOL, as well as its place in relation to [RVOL], it makes sense to own structures that benefit either from sharp changes in underlying price or an abrupt repricing in volatility.”

Cutting into the realization of a sharp change in underlying price or a far-reaching rally, however, are short-volatility bets across shorter maturity periods (and the associated hedging), as well as big (and popularized) positions set to roll off at the quarter-end.

Liquidity providers, per SpotGamma, all else equal, will have to sell to re-hedge, and we will talk about this further, next week.

Graphic: Taken 6/22/2022. SpotGamma’s Hedging Impact of Real-Time Options (HIRO) indicator points to selling of put and call options in the S&P 500 (INDEX: SPX) and S&P 500 ETF (SPY). Those liquidity providers, who are on the other side, are more exposed to long volatility, which they hedge by buying (selling) into weakness (strength) underlying.

Technical: As of 6:40 AM ET, Friday’s regular session (9:30 AM – 4:00 PM ET), in the S&P 500, will likely open in the upper part of a positively skewed overnight inventory, outside of prior-range and -value, suggesting a potential for immediate directional opportunity.

In the best case, the S&P 500 trades higher; activity above the $3,821.50 LVNode puts in play the $3,843.00 RTH High. Initiative trade beyond the RTH High could reach as high as the $3,911.00 VPOC and $3,943.25 HVNode, or higher.

In the worst case, the S&P 500 trades lower; activity below the $3,821.50 LVNode puts in play the $3,793.25 ledge. Initiative trade beyond the ledge could reach as low as the $3,770.75 HVNode and $3,735.75 HVNode, or lower.

Click here to load today’s key levels into the web-based TradingView charting platform. Note that all levels are derived using the 65-minute timeframe. New links are produced, daily.
Graphic: 65-minute profile chart of the Micro E-mini S&P 500 Futures.

Considerations: Recent trade has been lackluster and the overnight break is the most bullish happening in weeks. The go-to trade this week was short volatility. Participants responded to tests of key visual areas, and sold options, particularly in shorter maturities.

In the coming session(s), some of those participants will respond to the break in a manner that bolsters the initiative drive. Notwithstanding, the key to watch for is whether participants will use the bump as an opportunity to add to their most recent short volatility bets against the direction. 

Ultimately, the more time that is spent outside of the prior consolidation area, the likelihood that the breakout is a signal to look for dips to buy and play rotations to key areas up above.

Definitions

Volume Areas: A structurally sound market will build on areas of high volume (HVNodes). Should the market trend for long periods of time, it will lack sound structure, identified as low volume areas (LVNodes). LVNodes denote directional conviction and ought to offer support on any test. 

If participants were to auction and find acceptance into areas of prior low volume (LVNodes), then future discovery ought to be volatile and quick as participants look to HVNodes for favorable entry or exit.

POCs: POCs are valuable as they denote areas where two-sided trade was most prevalent in a prior day session. Participants will respond to future tests of value as they offer favorable entry and exit.

Balance-Break + Gap Scenarios: A change in the market (i.e., the transition from two-time frame trade, or balance, to one-time frame trade, or trend) is occurring.

Monitor for acceptance (i.e., more than 1-hour of trade) outside of the balance area. 

Leaving value behind on a gap-fill or failing to fill a gap (i.e., remaining outside of the prior session’s range) is a go-with indicator. 

Rejection (i.e., return inside of balance) portends a move to the opposite end of the balance.

About

After years of self-education, strategy development, mentorship, and trial-and-error, Renato Leonard Capelj began trading full-time and founded Physik Invest to detail his methods, research, and performance in the markets.

Capelj also develops insights around impactful options market dynamics at SpotGamma and is a Benzinga reporter.

Some of his works include conversations with ARK Invest’s Catherine Wood, investors Kevin O’Leary and John Chambers, FTX’s Sam Bankman-Fried, Kai Volatility’s Cem Karsan, The Ambrus Group’s Kris Sidial, among many others.

Disclaimer

In no way should the materials herein be construed as advice. Derivatives carry a substantial risk of loss. All content is for informational purposes only.

Categories
Commentary

Daily Brief For June 13, 2022

The daily brief is a free glimpse into the prevailing fundamental and technical drivers of U.S. equity market products. Join the 300+ that read this report daily, below!

What Happened

Overnight, futures for commodities, the equity indexes, and bonds were weak. There was no salvation in different assets. Instead, the realized correlation, across markets, tightened.

This is on the heels of inflation data updates that have traders pricing a 50-50 odds for a 75 basis point interest rate hike in July, after a 50 basis point hike this month.

That said, Ben Bernanke, who is a former Federal Reserve (Fed) Chair, said monetary policy leaders may be able to sidestep a big recession, expressing hopes that improvements in supply chains, among other things, would help rein inflation.

In other news, Chinese military officials warned their U.S. counterparts to avoid the Taiwan Strait and dismissed the need for the United Nations to review labor standards in the Xinjiang region.

This is as Britain’s economy unexpectedly shrank and Russia claims it has destroyed U.S. and European weapons stores in Ukraine. Additionally, despite OPEC+’s modest output gains, the average price of a gallon of gas rose to over $5 per gallon in the U.S. 

This output shock is likely to last into 2023 with gas potentially reaching as high as $6-$7.

Interestingly, as an aside, power grid operators in the Midwest are suggesting rolling blackouts in the coming years. This is just as power use in the South hit all-time records.

Ahead is data on inflation expectations (11:00 AM ET). This week’s focus is on the Federal Open Market Committee’s (FOMC) monetary policy decisions and large derivative expirations.

Graphic updated 6:30 AM ET. Sentiment Risk-Off if expected /ES open is below the prior day’s range. /ES levels are derived from the profile graphic at the bottom of the following section. Levels may have changed since initially quoted; click here for the latest levels. SqueezeMetrics Dark Pool Index (DIX) and Gamma (GEX) calculations are based on where the prior day’s reading falls with respect to the MAX and MIN of all occurrences available. A higher DIX is bullish. At the same time, the lower the GEX, the more (expected) volatility. Learn the implications of volatility, direction, and moneyness. SHIFT data used for S&P 500 (INDEX: SPX) options activity. Note that options flow is sorted by the call premium spent; if more positive, then more was spent on call options. Breadth reflects a reading of the prior day’s NYSE Advance/Decline indicator. VIX reflects a current reading of the CBOE Volatility Index (INDEX: VIX) from 0-100.

What To Expect

Fundamental: The CPI report was released Friday. 

Expected was an 8.2% rise year-over-year (YoY) and 0.7% month-over-month (MoM). Core CPI (which excludes food and energy) was to rise by 5.9% YoY and 0.5% MoM, respectively.

Officially, the headline number rose to 8.6%, and, the same day, consumer sentiment dropped to record lows while expectations for inflation (5-10 years from now) jumped 0.3%.

Graphic: Via All-Star Charts. Taken from the Weekly S&P 500 ChartStorm.

As Bloomberg’s John Authers put it well, the report’s details “were if anything even more alarming. There’s no way around it; this was a bad report.”

Graphic: Via Schroders plc (OTC: SHNWF). Taken from the Weekly S&P 500 ChartStorm. “Everyone’s (current) favorite economic data report was out this week and it showed annual CPI inflation running at an 8.6% clip. On this chart that would imply a P/E ~11x (Current P/E is ~20x).

Subsequently, a key part of the U.S. yield curve turned upside down while traders priced more tightening by September (i.e., two 50 basis point hikes and one that is potentially 75 basis points), selling nearly everything but the U.S. dollar.

Graphic: Via CME Group Inc’s (NASDAQ: CME) FedWatch Tool.

Early last week, after commentaries resumed, we talked about the reach for cash amid poor safety in fixed income and stock price declines.

Ultimately, to quote Joseph Wang who was a trader at the Fed, an increase in the RRP (reverse repo) and QT (which is a direct flow of capital to capital markets) “would drain the pool of bank deposits by ~$1t by year-end,” and this may prompt investors to “continue to lower their selling prices to compete for the cash they want.”

Graphic: Via McClellan Financial Publications. “These bonds move a lot more like the stock market than like T-Bonds. What makes them even more interesting is that they tend to be terribly sensitive to liquidity, both good and bad.”

“Inflation is eating margins, eating consumer demand, and causing the dramatic monetary tightening we are witnessing. None of this is good for stocks,” said James Athey of Abrdn. 

“There is still much downside to come.” 

Positioning: In short, prior-mentioned supply and demand dynamics resulted in divergences between the volatility that the market realizes (RVOL) and that which is implied (IVOL).

Graphic: Via Robson Chow, founder at Tradewell. The SPDR S&P 500 ETF Trust (NYSE: SPY) “is off ~5% in two trading sessions and implied volatility is still below realized volatility.”

Basically, participants are hedged and volatility remains well-supplied, due in part to suppressive volatility selling, as well as passive flows supporting the largest index constituents.

Consequently, the market’s descent has been orderly and not exacerbated by the demand for hedges and associated repricings of volatility.

This was expected, per Kai Volatility Cem Karsan’s commentary published in December 2021.

Graphic: Commentary published by Kai Volatility.

Accordingly, for “divergences in RVOL and IVOL to resolve, it would likely take forced selling,” as I explained in a recent SpotGamma commentary.

This is similar to the happenings of the Global Financial Crisis when, according to The Ambrus Group’s Kris Sidial, “vol slowly [ground] until the eventual October 2008 move (i.e., Lehman).”

“The markets were understanding that there was a change going on, especially in credit. But that risk was discounted until it was forced into realization.”

In light of this, on June 8, we talked about long volatility structures (that, one, either sold very short-dated pre-FOMC and OPEX volatility to fund that which is farther-dated or, two, buy into implied skew convexity, non-linear with respect to delta [gamma] and vega [volga] changes).

Why would you do that?

When you think there is to be an outsized move in the underlying, relative to what is priced, you buy options (positive exposure to gamma) so that you may have gains that are potentially amplified in case of directional movement.

When you think there is to be an outsized move in the implied volatility, relative to what is priced, you buy options (positive exposure to volga) so that you may have gains that are potentially amplified in case of implied volatility repricing.

Graphic: Via Banco Santander SA (NYSE: SAN) research.

Ultimately, “liquidity providers’ response to demand for protection (en masse) would, then, likely exacerbate the move and aid in the repricing of volatility to levels where there would be more stored energy to catalyze a rally.”

More on these dynamics later this week.

Technical: As of 6:30 AM ET, Monday’s regular session (9:30 AM – 4:00 PM ET), in the S&P 500, will likely open in the lower part of a negatively skewed overnight inventory, outside of prior-range and -value, suggesting a potential for immediate directional opportunity.

In the best case, the S&P 500 trades higher; activity above the $3,808.50 HVNode puts in play the $3,836.25 LVNode. Initiative trade beyond the $3,836.25 LVNode could reach as high as the $3,863.25 LVNode and $3,911.00 VPOC, or higher.

In the worst case, the S&P 500 trades lower; activity below the $3,808.50 HVNode puts in play the $3,768.25 HVNode. Initiative trade beyond the $3,768.25 HVNode could reach as low as the $3,727.75 and $3,688.75 HVNode, or lower.

Click here to load today’s key levels into the web-based TradingView charting platform. Note that all levels are derived using the 65-minute timeframe. New links are produced, daily.
Graphic: 65-minute profile chart of the Micro E-mini S&P 500 Futures.

Definitions

Volume Areas: A structurally sound market will build on areas of high volume (HVNodes). Should the market trend for long periods of time, it will lack sound structure, identified as low volume areas (LVNodes). LVNodes denote directional conviction and ought to offer support on any test. 

If participants were to auction and find acceptance into areas of prior low volume (LVNodes), then future discovery ought to be volatile and quick as participants look to HVNodes for favorable entry or exit.

Point Of Control: POCs are valuable as they denote areas where two-sided trade was most prevalent in a prior day session. Participants will respond to future tests of value as they offer favorable entry and exit.

Micro Composite Point Of Control: POCs are valuable as they denote areas where two-sided trade was most prevalent over numerous day sessions. Participants will respond to future tests of value as they offer favorable entry and exit.

Volume-Weighted Average Prices (VWAPs): A metric highly regarded by chief investment officers, among other participants, for quality of trade. Additionally, liquidity algorithms are benchmarked and programmed to buy and sell around VWAPs.

About

After years of self-education, strategy development, mentorship, and trial-and-error, Renato Leonard Capelj began trading full-time and founded Physik Invest to detail his methods, research, and performance in the markets.

Capelj also develops insights around impactful options market dynamics at SpotGamma and is a Benzinga reporter.

Some of his works include conversations with ARK Invest’s Catherine Wood, investors Kevin O’Leary and John Chambers, FTX’s Sam Bankman-Fried, Kai Volatility’s Cem Karsan, The Ambrus Group’s Kris Sidial, among many others.

Disclaimer

In no way should the materials herein be construed as advice. Derivatives carry a substantial risk of loss. All content is for informational purposes only.

Categories
Commentary

Daily Brief For June 10, 2022

The daily brief is a free glimpse into the prevailing fundamental and technical drivers of U.S. equity market products. Join the 300+ that read this report daily, below!

What Happened

Overnight, equity index futures continued lower after breaking a multi-day consolidation late yesterday afternoon.

This is amid growth concerns and the European Central Bank (ECB) decision to end asset purchases this month and commit to a 25-basis-point interest rate hike at its next meeting, setting the stage for further rate hikes, potentially 50-basis-points or higher.

Ahead are updates to consumer prices (8:30 AM ET), which may shed further clarity on the path of the Federal Reserve’s policies. Later are updates to consumer sentiment and inflation expectations (10:00 AM ET), as well as the budget balance (2:00 PM ET).

Graphic updated 6:30 AM ET. Sentiment Risk-Off if expected /ES open is below the prior day’s range. /ES levels are derived from the profile graphic at the bottom of the following section. Levels may have changed since initially quoted; click here for the latest levels. SqueezeMetrics Dark Pool Index (DIX) and Gamma (GEX) calculations are based on where the prior day’s reading falls with respect to the MAX and MIN of all occurrences available. A higher DIX is bullish. At the same time, the lower the GEX, the more (expected) volatility. Learn the implications of volatility, direction, and moneyness. SHIFT data used for S&P 500 (INDEX: SPX) options activity. Note that options flow is sorted by the call premium spent; if more positive, then more was spent on call options. Breadth reflects a reading of the prior day’s NYSE Advance/Decline indicator. VIX reflects a current reading of the CBOE Volatility Index (INDEX: VIX) from 0-100.

What To Expect

Fundamental: The CPI report is a driver of perceptions regarding future Fed activity.

Graphic: Via Societe Generale SA (OTC: SCGLY). Taken from The Market Ear. SocGen’s Kit Juckes explains that “the Fed put its foot down on the accelerator in 2020, harder than ever before, to keep the global economy going. Now it’s put its foot on the brake, equally hard but perhaps, a little bit late. How this plays out will become clearer in the coming weeks.”

Expected is an 8.2% rise year-over-year (YoY) and 0.7% month-over-month (MoM). In April, these numbers were 8.3% and 0.3%, respectively.

Core CPI (which excludes food and energy) is expected to rise by a rate lower than in April, 5.9% YoY and 0.5% MoM, respectively.

Graphic: Via Bloomberg. “For two straight months, fuel, power and grocery-store food have all been rising at double-digit annual rates—and tomorrow’s data is likely to show a further surge. Meantime, stocks fell with growth concerns in focus after the ECB moved to combat inflation.”

What matters most is the latter – core inflation – which the Fed has more control over. If lower than expected, that may warrant more appetite for risk.

“While inflation in some parts of the world [is] yet to peak, there are at least some signs emerging that we may not be too far off in terms of a turning point,” adds Khoon Goh of Australia & New Zealand Banking Group ADR (OTC: ANZBY).

Bloomberg reports semiconductor prices are now down 14% from the middle of last year. Also, the spot rate for shipping containers fell 26% while fertilizer prices are 24% below their record.

Still, the commitment to aggressive contractionary monetary policies is likely to remain. This reduction of liquidity and credit has consequences on the real economy and asset prices which rose and kept the deflationary pressures of monetary intervention at bay.

Positioning: It remains profitable to own options structures as implied (IVOL) underprices the volatility which is realized (RVOL).

This is the result of what options analytics service SqueezeMetrics suggests is an “absolute slamming” (i.e., sale of options) that’s compressing IVOL in shorter-dated tenors. 

It is “[o]nly rational to consider a bulk of them as put underwrites, because completely irrational otherwise.”

Important to note that this is in the context of next week’s large options expirations.

Into those events, typically, the frontrunning of delta hedging flows with respect to changes in time (charm), mainly, and volatility (vanna) provide an added boost. 

Graphic: Via SpotGamma. “SPX prices X-axis. Option delta Y-axis. When the factors of implied volatility and time change, hedging ratios change. For instance, if SPX is at $4,700.00 and IV jumps 15% (all else equal), the dealer may sell an additional 0.2 deltas to hedge their exposure to the addition of a positive 0.2 delta. The graphic is for illustrational purposes, only.”

As stated Monday, however, the marginal impact of further volatility compression, since IVOL was falling from already low levels, was likely to do less to bolster equity upside. 

A lot of the supportive action happened in the days and weeks prior, hence the comments on owning options.

Graphic: @pat_hennessy breaks down returns for the S&P 500, categorized by the week relative to OPEX. 

Technical: As of 6:30 AM ET, Friday’s regular session (9:30 AM – 4:00 PM ET), in the S&P 500, will likely open in the lower part of a negatively skewed overnight inventory, outside of prior-range and -value, suggesting a potential for immediate directional opportunity.

In the best case, the S&P 500 trades higher; activity above the $4,016.25 HVNode puts in play the $4,055.25 LVNode. Initiative trade beyond the LVNode could reach as high as the $4,071.50 BAL and $4,095.00 VPOC, or higher.

In the worst case, the S&P 500 trades lower; activity below the $4,016.25 HVNode puts in play the $3,982.75 LVNode. Initiative trade beyond the LVNode could reach as low as the $3,951.00 VPOC and $3,909.25 MCPOC, or lower.

Click here to load today’s key levels into the web-based TradingView charting platform. Note that all levels are derived using the 65-minute timeframe. New links are produced, daily.
Graphic: 65-minute profile chart of the Micro E-mini S&P 500 Futures.

Standard Balance-Break + Gap Scenarios: A change in the market (i.e., the transition from two-time frame trade, or balance, to one-time frame trade, or trend) is occurring.

Monitor for acceptance (i.e., more than 1-hour of trade) outside of the balance area. 

Leaving value behind on a gap-fill or failing to fill a gap (i.e., remaining outside of the prior session’s range) is a go-with indicator. 

Rejection (i.e., return inside of balance) portends a move to the opposite end of the balance.

Definitions

Volume Areas: A structurally sound market will build on areas of high volume (HVNodes). Should the market trend for long periods of time, it will lack sound structure, identified as low volume areas (LVNodes). LVNodes denote directional conviction and ought to offer support on any test. 

If participants were to auction and find acceptance into areas of prior low volume (LVNodes), then future discovery ought to be volatile and quick as participants look to HVNodes for favorable entry or exit.

Point Of Control: POCs are valuable as they denote areas where two-sided trade was most prevalent in a prior day session. Participants will respond to future tests of value as they offer favorable entry and exit.

Micro Composite Point Of Control: POCs are valuable as they denote areas where two-sided trade was most prevalent over numerous day sessions. Participants will respond to future tests of value as they offer favorable entry and exit.

Volume-Weighted Average Prices (VWAPs): A metric highly regarded by chief investment officers, among other participants, for quality of trade. Additionally, liquidity algorithms are benchmarked and programmed to buy and sell around VWAPs.

About

After years of self-education, strategy development, mentorship, and trial-and-error, Renato Leonard Capelj began trading full-time and founded Physik Invest to detail his methods, research, and performance in the markets.

Capelj also develops insights around impactful options market dynamics at SpotGamma and is a Benzinga reporter.

Some of his works include conversations with ARK Invest’s Catherine Wood, investors Kevin O’Leary and John Chambers, FTX’s Sam Bankman-Fried, Kai Volatility’s Cem Karsan, The Ambrus Group’s Kris Sidial, among many others.

Disclaimer

In no way should the materials herein be construed as advice. Derivatives carry a substantial risk of loss. All content is for informational purposes only.

Categories
Commentary

Daily Brief For May 27, 2022

The Daily Brief will be on pause till June 7, 2022, due to the author’s travel commitments. Apologies for this inconvenience.

What Happened

Overnight, U.S. equity index futures came off of their Thursday peaks before, late in the morning, trading to a new rally high, at which is a confluence of technical nuances.

Thursday’s cash session was characterized by a near-vertical advance into mid-day. Then, trade became two-sided, a feature of short-covering and not new buying. More on this, later.

In the news was Citigroup Inc’s (NYSE: C) downgrading of U.S. stocks on recession risks and the “elements of a deflating bubble,” while leaning optimistic on China assets due to marginal policy support, there. This is on the heels of similar conclusions put forward by BlackRock Inc (NYSE: BLK) and Morgan Stanley (NYSE: MS).

Mortgage rates staged their biggest drop since April of 2020 as “the housing market has clearly slowed, and the deceleration is spreading to other segments of the economy,” the Federal Home Loan Mortgage Corporation’s (OTC: FMCC) Sam Khater explained.

In other news, Secretary of State Antony Blinken took aim at China, commenting on the U.S.’s intention to “shape the strategic environment around Beijing to advance [its] vision for an open, inclusive international system.” This is as the U.S. also plans economic talks with Taiwan.

Pippa Malmgren, who is a former White House adviser and economist we wrote on earlier this week, discussed more of this decoupling and coordination among Eastern and Western powers.

In a two-part series, she explains the challenging of U.S. island bases by China and Russia, as well as their maritime strategies, “island hopping [and] shopping.” Check them out.

Today we received data on PCE inflation, real disposable and personal income, along with consumer spending and trade in goods (8:30 AM ET). University of Michigan Sentiment and five-year inflation expectations come later (10:00 AM ET).

Graphic updated 6:45 AM ET. Sentiment Neutral if expected /ES open is inside of the prior day’s range. /ES levels are derived from the profile graphic at the bottom of the following section. Levels may have changed since initially quoted; click here for the latest levels. SqueezeMetrics Dark Pool Index (DIX) and Gamma (GEX) calculations are based on where the prior day’s reading falls with respect to the MAX and MIN of all occurrences available. A higher DIX is bullish. At the same time, the lower the GEX, the more (expected) volatility. Learn the implications of volatility, direction, and moneyness. SHIFT data used for S&P 500 (INDEX: SPX) options activity. Note that options flow is sorted by the call premium spent; if more positive, then more was spent on call options. Breadth reflects a reading of the prior day’s NYSE Advance/Decline indicator. VIX reflects a current reading of the CBOE Volatility Index (INDEX: VIX) from 0-100.

What To Expect

Fundamental: At its core, there’s a commitment to cutting liquidity and credit after the spending of COVID-era “benefits and lockdown savings … created a lot of demand,” and inflation.

Graphic: Via the Federal Reserve. Taken from Nasdaq Inc (NASDAQ: NDAQ). “Rates have risen dramatically this year, impacting valuations of stocks and bonds.”

This has consequences on the real economy and asset prices, accordingly, which rose and kept the deflationary pressures of prevailing monetary policies at bay.

Graphic: Taken from Nasdaq Inc. “At a very simple level, rising rates increase interest expenses, reducing profits. But they also cause investors, who can earn more interest on safe cash deposits, to demand stronger returns from all other investments too.”

As unpacked, in detail, on May 18, 2022, there is an argument that stock market drops are both a recession and a reflection of the unwind of carry (or investment in long-duration bets with cheap debt) – a deflationary shock.

Graphic: Via Bloomberg. “Tighter financial conditions themselves are a clear success story for the Fed — it is the only way they can reduce inflationary pressures,” said Seema Shah, chief strategist at Principal Global Investors.

“The Fed has a mandate … to control price stability,” Kai Volatility’s Cem Karsan had explained.

“With supply-side economics, the only way that they can control this ultimately is to pull back. And slow capital markets decrease via the wealth effect. Ultimately, there’s a significant lag, so they are not in a position to ultimately control inflation without bringing down markets.”

Graphic: Via Bloomberg. “Of course, economic growth is a good thing. But too much of that good thing will just continue to stoke inflation. With that perspective in mind, the slowdown in surprises is positive.”

Accordingly, in our May 25, 2022 commentary, in which we discussed what to search for in the minutes of the last Federal Open Market Committee (FOMC) meeting. Knowing that there’s a lag in policy impact, we accurately floated the potential for the Federal Reserve (Fed) to “shift gears” late this summer if further cooling of inflation and “evidence of a growth slowdown.”

Graphic: Via Bloomberg. “After hitting a record above 3% last month, 10-year breakevens are on track for their biggest monthly drop since March 2020. The so-called five-year, five-year forward — the Fed’s favored measure — is set to post its biggest drop in May since August 2019.”

“Policy works with a lag,” as Diane Swonk of Grant Thorton explained. The Fed may pause as it seeks to “catch up but not outrun the market in its effort to tighten credit market conditions.” 

“There is still more progress to be made in bringing inflation expectations down to resonate with the Committee’s target, but current valuations are at least in the realm of acceptable,” Ian Lyngen, who is head of U.S. rates strategy at the Bank of Montreal (NYSE: BMO), said

“The market is showing some faith in Powell’s inflation-fighting creditability.”

Graphic: Taken from Nasdaq Inc. “Although inflation is high right now, it’s because of Covid and the Ukraine war. Both, hopefully, will pass, and 3%-4% inflation a year from now seems possible if the economy slows to a more normal level. In turn, that means the interest rate that keeps the U.S. economy growing slowly is likely much lower than we might currently be thinking. It might, in fact, be right around where bond rates are now.”

Concluding the fundamental section with remarks from a March 2022 Substack newsletter published by Andreas Steno Larsen of the Stenos Signals Substack.

“I simply don’t find >3.5% territory for the Fed Funds feasible as the hiking cycle peaked at 2.25-2.50% in 2018/2019 and fundamentals have worsened since. Debt loads are much higher, demographics have weakened, and the labour force is smaller, which suggests that the neutral rate is lower, not higher, than in 2018/2019.”

Graphic: Via Bloomberg. “​​The swaps market and consensus forecasts to Bloomberg Economics both imply considerably faster rate hikes, while Bloomberg’s own forecast is more hawkish still.”

Positioning: Per Bank of America Corporation (NYSE: BAC) notes, investors poured nearly $20 billion into global stocks (in the week to May 25, 2022).

As I wrote in a SpotGamma note, notable was the reversal in beaten-down areas of the market, as well as the implosion at the front-end of the volatility term structure, affecting protection most sensitive to changes in direction and volatility.

The Cboe VVIX Index (INDEX: VVIX), the expected volatility of the 30-day forward price of the VIX or the volatility of volatility (a naive but useful measure of skew), dropped off markedly, too, in comparison to the VIX, itself.

Graphic: Via Physik Invest. Taken from TradingView. VVIX, top. VIX, bottom.

Further, as stated in SpotGamma’s note, a “falling VVIX (and VIX term structure drop off) may be the product of a collapse in the value of customers’ long put exposures concentrated in very short-dated timeframes (potentially exposures hedging tail risks with respect to the release of FOMC minutes, among other things).”

“It is then as the skew, here, decays, and term structure compresses, that liquidity providers buy back their hedges to the puts they are short (i.e., the vanna dynamic pointed to, earlier).”

This market-generated information helps us give context to this most recent equity market rally that is characterized by a little change in demand for bets on upside further in price and time 

All else equal, this is not a feature of sustainable market rallies.

Why you ask?

Those names that have been most depressed, and are now reversing, were recipients of heavy demand for protection in the months prior.

For this reason – participants being well hedged – selling was orderly, rather than violent as in past episodes of market shock when the reach for protection solicited a cascading reaction that exacerbated underlying price movements due to liquidity providers’ hedging.

Graphic: Via Banco Santander SA (NYSE: SAN) research.

The large drop off in term structure, as well as the VVIX versus the VIX, is affecting protection most sensitive to changes in direction and volatility and the unwind of liquidity providers’ short futures and stock hedges to this protection is, in part, playing into this internally weak rally.

So, what? How do you play this? Good question.

It still may make sense to have exposure to underlying markets, synthetically (i.e., own options), as detailed, well, May 25, 2022. Read that letter for detail on how to think about trade structure.

Technical: As of 6:45 AM ET, Friday’s regular session (9:30 AM – 4:00 PM ET), in the S&P 500, will likely open in the upper part of a positively skewed overnight inventory, inside of prior-range and -value, suggesting a limited potential for immediate directional opportunity.

In the best case, the S&P 500 trades higher; activity above the $4,069.25 HVNode puts in play the $4,095.00 ONH. Initiative trade beyond the ONH could reach as high as the $4,119.00 VPOC and $4,148.25 HVNode, or higher.

In the worst case, the S&P 500 trades lower; activity below the $4,069.25 HVNode puts in play the $3,997.75 RTH High. Initiative trade beyond the RTH High could reach as low as the $3,982.75 LVNode and $3,951.00 VPOC, or lower.

Click here to load today’s key levels into the web-based TradingView charting platform. Note that all levels are derived using the 65-minute timeframe. New links are produced, daily.
Graphic: 65-minute profile chart of the Micro E-mini S&P 500 Futures.

Definitions

Overnight Highs And Lows (ONH and ONL): Typically, there is a low historical probability associated with overnight rally-highs (lows) ending the upside (downside) discovery process.

Volume Areas: A structurally sound market will build on areas of high volume (HVNodes). Should the market trend for long periods of time, it will lack sound structure, identified as low volume areas (LVNodes). LVNodes denote directional conviction and ought to offer support on any test. 

If participants were to auction and find acceptance into areas of prior low volume (LVNodes), then future discovery ought to be volatile and quick as participants look to HVNodes for favorable entry or exit.

POCs: POCs are valuable as they denote areas where two-sided trade was most prevalent in a prior day session. Participants will respond to future tests of value as they offer favorable entry and exit.

MCPOCs: POCs are valuable as they denote areas where two-sided trade was most prevalent over numerous day sessions. Participants will respond to future tests of value as they offer favorable entry and exit.

About

After years of self-education, strategy development, mentorship, and trial-and-error, Renato Leonard Capelj began trading full-time and founded Physik Invest to detail his methods, research, and performance in the markets.

Capelj also develops insights around impactful options market dynamics at SpotGamma and is a Benzinga reporter.

Some of his works include conversations with ARK Invest’s Catherine Wood, investors Kevin O’Leary and John Chambers, FTX’s Sam Bankman-Fried, Kai Volatility’s Cem Karsan, The Ambrus Group’s Kris Sidial, among many others.

Disclaimer

In no way should the materials herein be construed as advice. Derivatives carry a substantial risk of loss. All content is for informational purposes only.

Categories
Commentary

Daily Brief For May 16, 2022

The daily brief is a free glimpse into the prevailing fundamental and technical drivers of U.S. equity market products. Join the 300+ that read this report daily, below!

What Happened

Overnight, equity index futures auctioned lower after a failed attempt to solicit strong buying on a break of Friday’s regular trade high. 

Coincidentally, after a test of an anchored volume-weighted average price level, some measures from China had traders concerned about global growth, and that fed into a risk-off sentiment and probe further into Friday’s range.

Moreover, ahead is data on Empire State Manufacturing (8:30 AM ET).

Today, we add light context to our narratives with an aim to elaborate further in letters later this week. Take care!

Graphic updated 6:45 AM ET. Sentiment Neutral if expected /ES open is inside of the prior day’s range. /ES levels are derived from the profile graphic at the bottom of the following section. Levels may have changed since initially quoted; click here for the latest levels. SqueezeMetrics Dark Pool Index (DIX) and Gamma (GEX) calculations are based on where the prior day’s reading falls with respect to the MAX and MIN of all occurrences available. A higher DIX is bullish. At the same time, the lower the GEX, the more (expected) volatility. Learn the implications of volatility, direction, and moneyness. SHIFT data used for S&P 500 (INDEX: SPX) options activity. Note that options flow is sorted by the call premium spent; if more positive, then more was spent on call options. Breadth reflects a reading of the prior day’s NYSE Advance/Decline indicator. VIX reflects a current reading of the CBOE Volatility Index (INDEX: VIX) from 0-100.

What To Expect

Fundamental: Data from China shows contraction in light of COVID-19 troubles.

Graphic: Via Bloomberg

Bloomberg’s John Authers explains that a contracting China “would be a deflationary force for the rest of the world.”

Graphic: Via Stenos Signals. “China imports vs. Commodities – the most important macro chart in the world right now.”

Andreas Steno Larsen, of the Stenos Signals letter, recently talked about this “lack of economic activity in China,” as well as “slowing demand in the West,” both of which are to “lead inflation expectations lower.”

Graphic: Via CrossBorder Capital. “Latest weekly Fed liquidity injections and the S&P 500. Bigger the bull, the harder they fall? Fed trying to crash [the] economy to kill inflation [and] Wall Street is the victim.”

Notwithstanding, the Federal Reserve (Fed) remains on track “to deliver substantial QT and rate hiking,” all the while investors “hold a relatively risk-friendly position in equities and credits.”

Graphic: Via Societe Generale SA (OTC: SCGLY). Taken from The Market Ear.

Steno Larsen explains: “That disconnect [between sentiment and exposure to risk] will have to wane before I truly dare to re-add risk asset exposure to my list of recommendations.”

Graphic: Via @TheBondFreak. University of Michigan Sentiment.

Pursuant to that remark, Authers notes that the latest Chinese data emboldens the risks of a recession which Credit Suisse Group AG’s (NYSE: CS) Zoltan Pozsar explains is not enough.

“[T]he risk of recession, whether it is real or merely implied by an inversion of the yield curve, won’t deter the Fed from hiking rates higher faster or from injecting more volatility to build up negative wealth effects, and signs of a recession might not mean immediate rate cuts to ramp demand back up.”

“Rallies could beget more forceful pushback from the Fed – the new game.”

Graphic: Via @TheBondFreak. “2/10s spread has delivered its message. The long end is beginning to trend lower. NOW…it’s time to start watching the 3m/10yr spread, which will likely invert as the Fed continues with its rate hikes to kill demand, cause a recession, but “us” from inflation.”

Per Goldman Sachs Group Inc (NYSE: GS), baseline forecasts assume “no recession” and imply the S&P 500’s P/E ends unchanged at 17x. 

“A recession would see the index fall by 11% to $3,600.00 as the P/E drops to 15x.”

Graphic: Via Goldman Sachs Group Inc. Taken from The Market Ear. A recession brings S&P 500 to $3,600.00.

Positioning: Early on Friday morning, we approached trade too optimistically but, to our credit, we focused on participating with as little risk as possible, via the use of complex strategies, as validated by quoted research.

Graphic: Via Goldman Sachs Group Inc. The VIX’s “high starting point leaves vol high overall, and we like strategies with a short volatility bias, including put selling and 1×2 call spread overlays.”

Heading into Monday’s regular trade, little has changed and indexes are holding well, relative to some constituents.

This is as participants are hedged and volatility markets remain well-supplied, due in part to suppressive volatility selling, as well as passive flows supporting the largest index constituents.

Kai Volatility’s Cem Karsan hypothesizes: “If a meaningful [volatility] event has happened within the last year, participants are more likely to be prepared for the move. So the ‘2nd event’ dramatically underperforms [implied volatility] skew expectations.”

“Take Jan/Feb 2016, Oct-Dec 2018, &…Sep 2020? All these ‘2nd Events’ ended up being as meaningful as their 1st events, if not more, for markets, but were much more orderly [and] accompanied by poor [volatility] performance.”

Graphic: Via Bloomberg. “For all the recent declines — the S&P 500 is down more than 13% from its high on March 29 — stress indicators also aren’t at levels seen during comparable slumps. Fewer than 30% of the benchmark’s members have hit a one-year low, compared with nearly 50% during the growth scare in 2018 and 82% during the global financial crisis in 2008.”

Given the aforementioned supply and demand dynamic, we continue to observe “divergence in the volatility (movement of underlying equity market up and down) realized, versus that which is implied by options activity,” SpotGamma says. 

Graphic: Via @HalfersPower. “1 day return distribution when QQQ ROC[1] > 3.7%. Historically you can expect the weakest relative mean forward returns, and second-highest mean realized volatility amongst deciles.”

For “divergences in volatility realized and implied to resolve, it would likely take forced selling. Liquidity providers’ response to demand for protection would, then, likely exacerbate the move and aid in the repricing of volatility to levels where there would be more stored energy to catalyze a rally.”

All else equal, SpotGamma adds, there is no catalyst to rally until the May 20, 2022 options expiration (OPEX). Till then, rallies are subject to failure.

Graphic: Via SqueezeMetrics. Updated May 13, 2022. “VIX compressing to 30 on a modest pre-market rally with dealer gamma exposure more negative than it’s been in years is not how you get sustained rallies—it’s how you get energy for bigger downside moves.”

Technical: As of 6:30 AM ET, Monday’s regular session (9:30 AM – 4:00 PM ET), in the S&P 500, will likely open in the middle part of a negatively skewed overnight inventory, inside of prior-range and -value, suggesting a limited potential for immediate directional opportunity.

In the best case, the S&P 500 trades higher; activity above the $4,013.25 micro composite point of control (MCPOC) puts in play the $4,036.00 regular trade high (RTH High). Initiative trade beyond the $4,069.25 high volume area (HVNode) could reach as high as the HVNode and $4,119.00 untested point of control (VPOC), or higher.

In the worst case, the S&P 500 trades lower; activity below the $4,013.25 MCPOC puts in play the $4,3978.50 low volume area (LVNode). Initiative trade beyond the LVNode could reach as low as the $3,943.25 HVNode and $3,899.00 VPOC, or lower.

Click here to load today’s key levels into the web-based TradingView charting platform. Note that all levels are derived using the 65-minute timeframe. New links are produced, daily.
Graphic: 65-minute profile chart of the Micro E-mini S&P 500 Futures.

Definitions

Volume Areas: A structurally sound market will build on areas of high volume (HVNodes). Should the market trend for long periods of time, it will lack sound structure, identified as low volume areas (LVNodes). LVNodes denote directional conviction and ought to offer support on any test. 

If participants were to auction and find acceptance into areas of prior low volume (LVNodes), then future discovery ought to be volatile and quick as participants look to HVNodes for favorable entry or exit.

POCs: POCs are valuable as they denote areas where two-sided trade was most prevalent in a prior day session. Participants will respond to future tests of value as they offer favorable entry and exit.

MCPOCs: POCs are valuable as they denote areas where two-sided trade was most prevalent over numerous day sessions. Participants will respond to future tests of value as they offer favorable entry and exit.

Volume-Weighted Average Prices (VWAPs): A metric highly regarded by chief investment officers, among other participants, for quality of trade. Additionally, liquidity algorithms are benchmarked and programmed to buy and sell around VWAPs.

About

After years of self-education, strategy development, mentorship, and trial-and-error, Renato Leonard Capelj began trading full-time and founded Physik Invest to detail his methods, research, and performance in the markets.

Capelj also develops insights around impactful options market dynamics at SpotGamma and is a Benzinga reporter.

Some of his works include conversations with ARK Invest’s Catherine Wood, investors Kevin O’Leary and John Chambers, FTX’s Sam Bankman-Fried, Kai Volatility’s Cem Karsan, The Ambrus Group’s Kris Sidial, among many others.

Disclaimer

In no way should the materials herein be construed as advice. Derivatives carry a substantial risk of loss. All content is for informational purposes only.

Categories
Commentary

Daily Brief For April 4, 2022

The Daily Brief is a free glimpse into the prevailing fundamental and technical drivers of U.S. equity market products. Join the 200+ that read this report daily, below!

Editor’s Note: Hey team, thanks again for your reading of this daily newsletter. Due to travel commitments, I will not be writing reports consistently for the rest of this month.

Don’t expect any updates until Monday, April 11, 2022. Thereafter, coverage may be sporadic for the rest of the month.

What Happened

Overnight, equity index futures were higher after exploring lower, briefly. Commodities were mixed while bonds were lower and implied volatility measures were bid.

In terms of news, the European Union said it was interested in penalizing Russia, further, for its actions in Ukraine. This is as China battles new COVID-19 sub-strains. 

Ahead is data on factory and core capital equipment orders (10:00 AM ET). 

Graphic updated 5:45 AM ET. Sentiment Neutral if expected /ES open is inside of the prior day’s range. /ES levels are derived from the profile graphic at the bottom of the following section. Levels may have changed since initially quoted; click here for the latest levels. SqueezeMetrics Dark Pool Index (DIX) and Gamma (GEX) calculations are based on where the prior day’s reading falls with respect to the MAX and MIN of all occurrences available. A higher DIX is bullish. At the same time, the lower the GEX, the more (expected) volatility. Learn the implications of volatility, direction, and moneyness. SHIFT data used for S&P 500 (INDEX: SPX) options activity. Note that options flow is sorted by the call premium spent; if more positive, then more was spent on call options. Breadth reflects a reading of the prior day’s NYSE Advance/Decline indicator. VIX reflects a current reading of the CBOE Volatility Index (INDEX: VIX) from 0-100.

What To Expect

Fundamental: In the face of geopolitical tension, supply pressures, and inflation, consumer sentiment is at or below pandemic levels, prompting the Federal Reserve (Fed) to destimulate.

Graphic: Via S&P Global Inc (NYSE: SPGI) research. “Confluence Of Risks Halts Positive Credit Momentum.

“It has entered 2008-09 territory and is not far from all-time lows in the ‘80s when inflation and interest rates hit double digits,” ARK Invest’s Catherine Wood explained in a Twitter discussion on yield-curve inversions and aggressive action by the Federal Reserve, as well as inflation.

“The economy succumbed to recession in each of those periods. Europe and China are also in difficult straits. The Fed seems to be playing with fire.”

In accordance, the Macro Compass’ Alfonso Peccatiello explains that his credit impulse metrics, which lead economic activity and risk asset performance, imply a slowdown in earnings.

Graphic: Via The Macro Compass.

Still, in spite of these metrics, on average, recessions happen 12 to 24 months after the first yield curve inversions, according to Jefferies Financial Group Inc (NYSE: JEF).

Post-inversion S&P 500 performance, actually, is often positive.

Graphic: Via Jefferies Financial Group. Taken from The Market Ear.

Bolstering the call for positive equity market performance are strong seasonality trends during Fed-rate-hike episodes, a contraction in equity risk premia, and “still accommodative” monetary policy, per explanations by rates strategist Rishi Mishra. 

Graphic: Via Goldman Sachs Group Inc (NYSE: GS). Taken from The Market Ear. “Equities are a real asset as they make a claim on nominal GDP. In the post-financial crisis era, weak economic activity and lower inflation pushed down nominal GDP, raising the equity risk premium and reducing the bond term premium. So as long as economies grow, revenues and dividends should also grow. The dividend yield can be thought of as a real yield. Equity risk premia have started to decline in the post COVID cycle but remain higher than in the pre-financial crisis era.”

“[T]he 3ms2s vs 2s10s spread (or the 3m2s10s fly) is the widest it has been since the end of 1994. The widening of this fly is indicative of the fact that while the Fed shifted its guidance from dovish to extremely hawkish, the policy is still accommodative.”

Graphic: Via Bloomberg. Taken from Rishi Mishra.

Positioning: The equity market’s ferocious end-of-March rally, which placed the S&P 500 back above a key go/no-go level – the 200-period simple moving average – may have been in part the result of institutional investors purchasing equities ahead of quarterly reporting.

“Remember that stocks settle T+2, meaning that shares are actually owned by buyers two business days after they are purchased in the market,” says Interactive Brokers’ Group Inc (NASDAQ: IBKR) Steve Sosnick. 

“That means that institutions who wanted to show stock positions on their quarterly reports would have needed to purchase those shares no later than Tuesday the 29th. The sharp end-of-day runups that we saw on Monday and Tuesday had the hallmarks of aggressive institutional buying.”

According to Deutsche Bank AG (NYSE: DB) analyses, “[a]ggregate equity positioning has now risen off the lows but only to the 22nd percentile and is still well below neutral.”

That said, quarter-end rebalances and options expirations (OPEX) likely do little to upset the balance of trade. Based on a lot of the insights shared in this letter, barring some exogenous event, the market is in a position to drift or balance.

This, as a result, may solicit a “stronger impulse to chase the rally,” at which point JPMorgan Chase & Co (NYSE: JPM) strategists say they would “generally be more concerned.”

A collapse (or convergence) in volatility metrics for different asset classes (like the Merrill Lynch Options Volatility Estimate [INDEX: MOVE] and Cboe Volatility Index [INDEX: VIX]) would bolster the “drift or balance” thesis.

Graphic: Via Physik Invest.

Technical: As of 5:45 AM ET, Monday’s regular session (9:30 AM – 4:00 PM ET), in the S&P 500, will likely open in the upper part of a positively skewed overnight inventory, inside of prior-range and -value, suggesting a limited potential for immediate directional opportunity.

In the best case, the S&P 500 trades higher; activity above the $4,527.00 untested point of control (VPOC) puts in play the $4,562.50 spike base. Initiative trade beyond the spike base could reach as high as the $4,583.00 VPOC and $4,611.75 low volume area (LVNode), or higher.

In the worst case, the S&P 500 trades lower; activity below the $4,527.00 VPOC puts in play the $4,501.25 regular trade low (RTH Low). Initiative trade beyond the RTH Low could reach as low as the $4,469.00 VPOC and $4,438.25 HVNode, or lower.

Considerations: Spikes often mark the beginning of a break from value. Spikes higher (lower) are validated by trade at or above (below) the spike base (i.e., the origin of the spike). 

In a spike up (down) situation, trade below (above) the spike base, negates the buying (selling).

Click here to load today’s key levels into the web-based TradingView charting platform. Note that all levels are derived using the 65-minute timeframe. New links are produced, daily.

Graphic: 65-minute profile chart of the Micro E-mini S&P 500 Futures.

What People Are Saying

Definitions

Volume Areas: A structurally sound market will build on areas of high volume (HVNodes). Should the market trend for long periods of time, it will lack sound structure, identified as low volume areas (LVNodes). LVNodes denote directional conviction and ought to offer support on any test. 

If participants were to auction and find acceptance into areas of prior low volume (LVNodes), then future discovery ought to be volatile and quick as participants look to HVNodes for favorable entry or exit.

POCs: POCs are valuable as they denote areas where two-sided trade was most prevalent in a prior day session. Participants will respond to future tests of value as they offer favorable entry and exit.

About

After years of self-education, strategy development, mentorship, and trial-and-error, Renato Leonard Capelj began trading full-time and founded Physik Invest to detail his methods, research, and performance in the markets.

Capelj also develops insights around impactful options market dynamics at SpotGamma and is a Benzinga reporter.

Some of his works include conversations with ARK Invest’s Catherine Wood, investors Kevin O’Leary and John Chambers, FTX’s Sam Bankman-Fried, Kai Volatility’s Cem Karsan, The Ambrus Group’s Kris Sidial, among many others.

Disclaimer

In no way should the materials herein be construed as advice. Derivatives carry a substantial risk of loss. All content is for informational purposes only.