Financial markets tend to oscillate like a pendulum, but recently, the fluctuations have intensified. For example, interest rates rapidly climbed from zero to 5%, and markets often alternate dramatically between despair and euphoria.
Decades-long policies concentrating wealth and incentivizing risk-taking are at the heart of these fluctuations. Central bank interventions, passive investing, and regulatory quirks have created fertile ground for dislocations and headline-grabbing events like the GameStop saga in 2021. For younger generations, these dynamics have been particularly tough. Millennials and Gen Z face delayed milestones, diminishing wealth, and growing skepticism about traditional, centralized financial structures.
Jannick Malling, co-founder and co-CEO of Public.com, aims to help investors adapt and thrive in this evolving landscape. In our latest podcast, Malling explains how Public engages a newer, active generation of investors.
You can watch the linked full video and/or read about some key points below.
Who is Jannick Malling?
Malling, of Danish descent, began his entrepreneurial journey in Copenhagen. His childhood curiosity about technology led him to build computers and explore the digital world. What started as a simple interest soon became a passion, as he began creating websites to organize video game meetups and help small businesses increase their visibility.
“You spend a lot of time in front of the computer, and you can’t be gaming 24/7,” he reflects. “So, when you’re not gaming, you’re just hanging out online, and I started to get excited about building websites. I wanted to design to solve problems, and this led to finding the design process so incredibly rewarding, interesting, and fulfilling that I just stayed with it my whole life.”
Unconventional for a 17-year-old, Malling later entered the professional world by joining Saxo Bank, a fintech that radically transformed investing in Europe. The experience was incredibly formative, teaching Malling about work ethic and the importance of speed, adaptability, and user-centric design—principles that continue to guide him at Public today.
Malling parallels his experience after Saxo Bank with that of the PayPal Mafia, a group of former PayPal employees who went on to shape the tech and venture capital worlds. Like PayPal’s Peter Thiel, Reid Hoffman, and Elon Musk, Malling and his Saxo Bank colleagues stayed connected, collaborating on new ventures after leaving the company.
Why build Public.com?
After co-founding and building several companies, Malling took a break and moved to New York City. Frustrated with managing his portfolio as a retail investor, he realized fractional shares could ease rebalancing and dollar-cost averaging for everyday investors. Inspired by this insight, he designed mockups for an app with a Venmo-like user experience. This ultimately became Public.com.
“I think there’s always been this overarching trend of leveling the playing field between institutions and individual investors,” Malling explains, highlighting Public’s focus on providing better information, community, and access at a lower cost. “Now, the question is what they should buy and why, which is where the research comes in.”
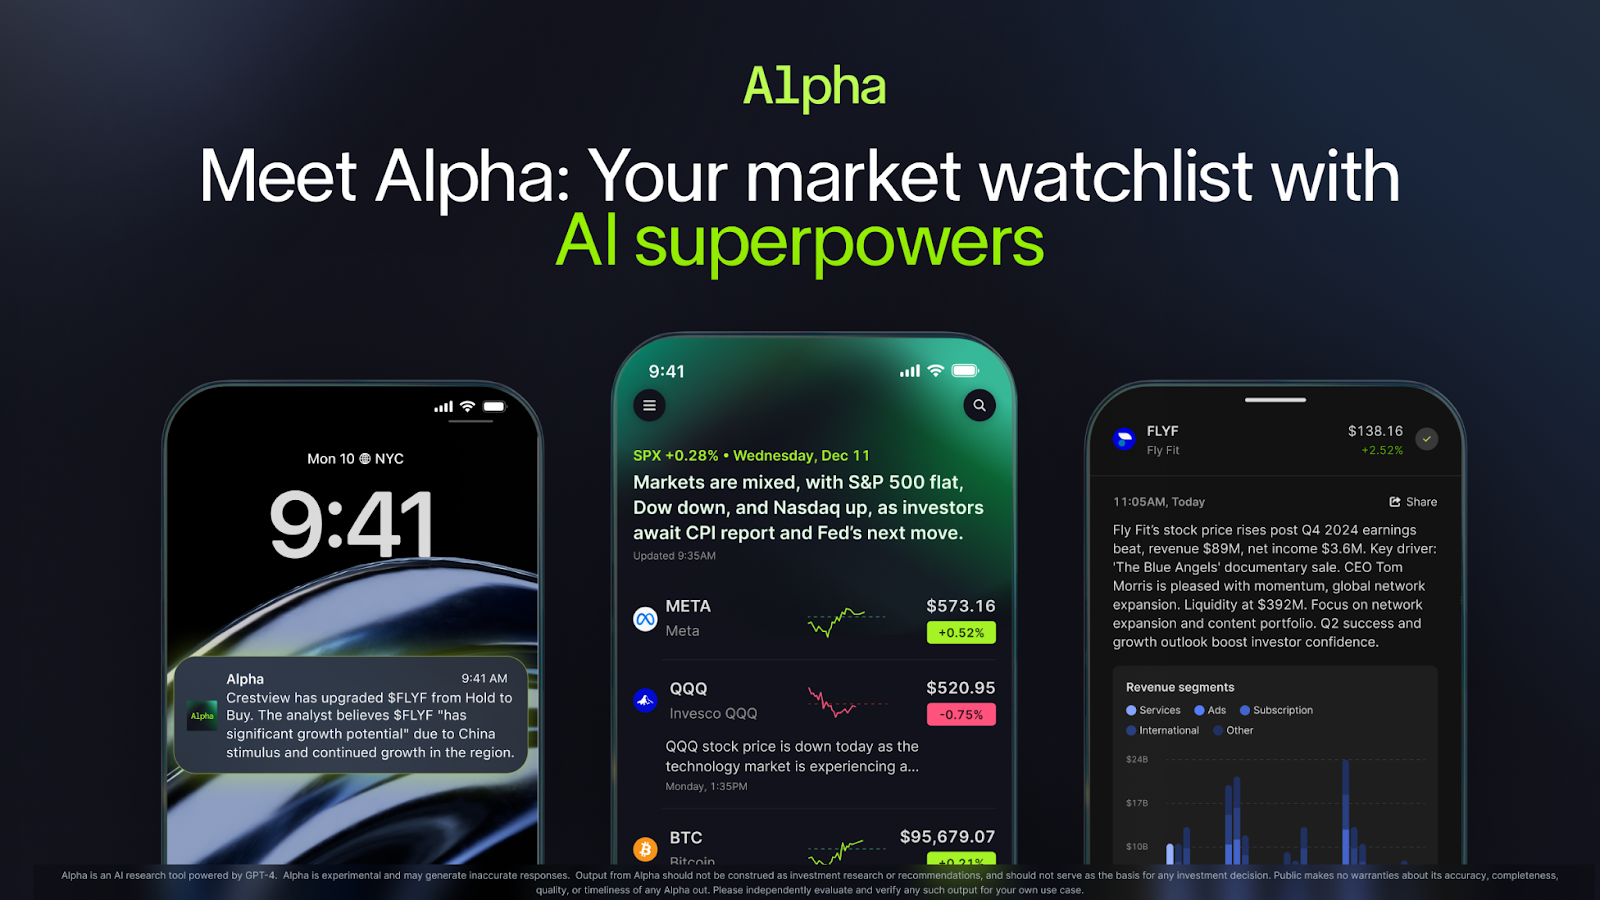
Retail brokerage platforms usually offer research, which can be challenging for investors without financial expertise. However, thanks to recent AI advancements, Public has enhanced its offerings, introducing products like Alpha.
“When ChatGPT came out, our imaginations were captured, and we started tinkering with this intersection of research and LLM interfaces,” he says. “Now, you can go to a stock on Public and ask any question. It’ll answer immediately, scanning the earnings files, financials, and analyst ratings. The process of researching a company is so much higher quality, and we’ve been able to drive AI hallucinations to basically zero, improving trust.”
Alpha has proven so effective in answering investor questions that Public launched it as a standalone platform. Those with a Public account can access Alpha for free, while those without can subscribe for just $1 weekly.
“Just screenshot your Apple Stocks, and Alpha auto-follows all those stocks, constantly scanning and telling you not just if they’re moving, but why they’re moving. That’s a great example of how AI can enhance the research experience without requiring people to dig too deep, creating more informed investors.”
Why did Public ditch PFOF?
In 2021, Public discontinued payments for order flow (PFOF). This decision underscores a more significant concern: the shortcomings of the National Best Bid and Offer (NBBO) system, which represents the best available bid and offer prices for equities across U.S. exchanges, serving as a benchmark for order execution.
The NBBO was created long before retail investing and zero-commission trading rocketed. Malling notes that it is based on market volumes of 100 shares or more, leaving out much of the current retail trading activity, like fractional and smaller trades. Although retail trading now accounts for a substantial share of market volume—sometimes over 40%—the NBBO does not adjust to this; firms complying with NBBO standards may provide prices that are not the best available.
“Retail makes up a much larger part of the market, but the NBBO doesn’t consider that in its reference price,” Malling explains. “So, sort of the hurdle that you have to clear is a little broken, which means that some firms can say, ‘Hey, we gave you the NBBO,’ but there may be a price that nobody else sees that’s lower than that.”
However, Public continues using the PFOF model in options trading, which works differently.
“In the options world, orders must be posted to an exchange, which creates more competition and drives better customer outcomes,” Malling explains. Public also shares up to 50% of its order flow rebates with customers. “You make what we make on your flow, so for those customers, it’s just incredibly transparent.
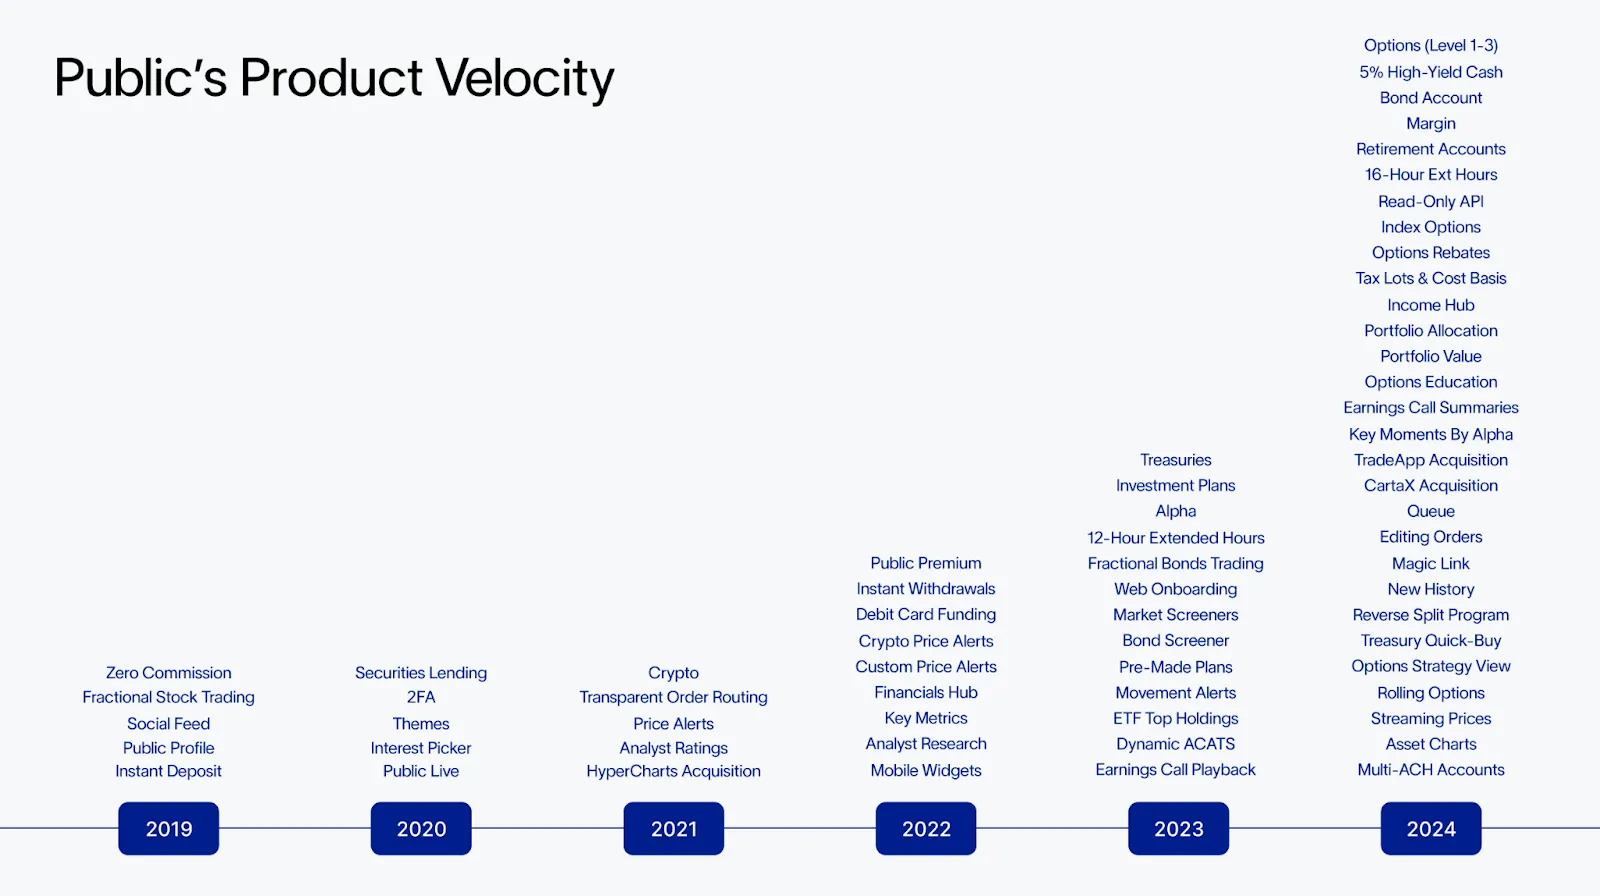
How does Public launch quicker?
Last year, Public launched a significant new feature roughly every ten days. Malling attributes this speed and adaptability—such as launching options on cash-settled indexes and Bitcoin in just over two weeks—to the company’s horizontal tech stack, lean team, and commitment to minimizing technical debt.
“Most big players in the space rack up technical debt, which happens when code is written in a way that makes it hard to maintain or further develop,” Malling elaborates. “To add new products, you’re forced to rewrite entire features, which slows down product velocity. Our engineers are allergic to that. By building a horizontal stack, we can move much more quickly.”
Partnerships that mitigate risks in everything from clearing to custody bolster this adaptability, enabling Public to concentrate on providing valuable features like seamless, real-time money transfers across asset classes, unified performance reporting, and tax optimization tools—all accessible via a single login for multiple account types, including cash, margin, IRA, and trust accounts.
What’s Public positioning for?
Looking ahead, Malling sees enormous opportunity in the ~$100 trillion wealth transfer from Baby Boomers to Millennials and Gen Z. These generations grew up with information at their fingertips and distrust in traditional financial structures. Accordingly, they seek alternatives like DIY investing, which, as was discussed, Public is making easier.
“This shift will redefine how wealth is managed. Younger generations are fundamentally different in how they approach investing, prioritizing transparency, technology, and self-direction,” he says. “Now, I have all the tools in the world to do it myself, which is the simple one-two punch that puts this generation on a fundamentally different path.”
For more, please consider watching the YouTube interview. Jannick Malling can be followed on LinkedIn and Twitter/X. Thank you!
Disclaimer
By viewing our content, you agree to be bound by the terms and conditions outlined in this disclaimer. Consume our content only if you agree to the terms and conditions below.
Physik Invest is not registered with the US Securities and Exchange Commission or any other securities regulatory authority. Our content is for informational purposes only and should not be considered investment advice or a recommendation to buy or sell any security or other investment. The information provided is not tailored to your financial situation or investment objectives.
We do not guarantee the accuracy, completeness, or timeliness of any information. Please do not rely solely on our content to make investment decisions or undertake any investment strategy. Trading is risky, and investors can lose all or more than their initial investment. Hypothetical performance results have limitations and may not reflect actual trading results. Other factors related to the markets and specific trading programs can adversely affect actual trading results. We recommend seeking independent financial advice from a licensed professional before making investment decisions.
We don’t make any claims, representations, or warranties about the accuracy, completeness, timeliness, or reliability of any information we provide. We are not liable for any loss or damage caused by reliance on any information we provide. We are not liable for direct, indirect, incidental, consequential, or damages from the information provided. We do not have a professional relationship with you and are not your financial advisor. We do not provide personalized investment advice.
Our content is provided without warranties, is the property of our company, and is protected by copyright and other intellectual property laws. You may not be able to reproduce, distribute, or use any content provided through our services without our prior written consent. Please email renato@physikinvest for consent.
We reserve the right to modify these terms and conditions at any time. Following any such modification, your continued consumption of our content means you accept the modified terms. This disclaimer is governed by the laws of the jurisdiction in which our company is located.