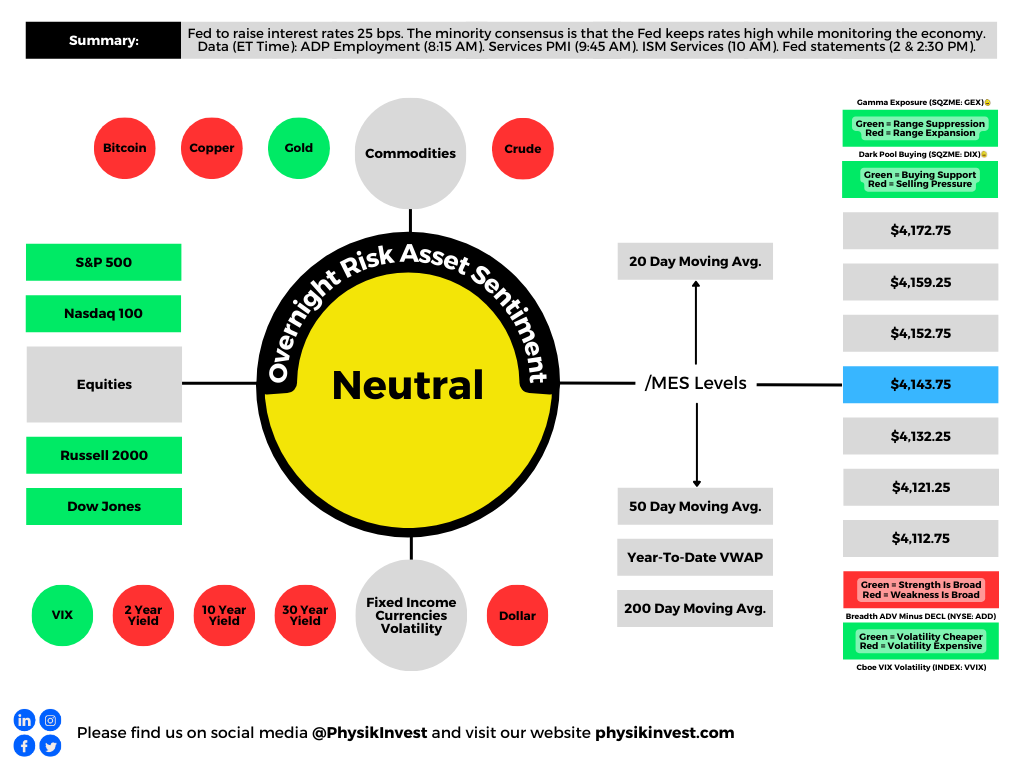
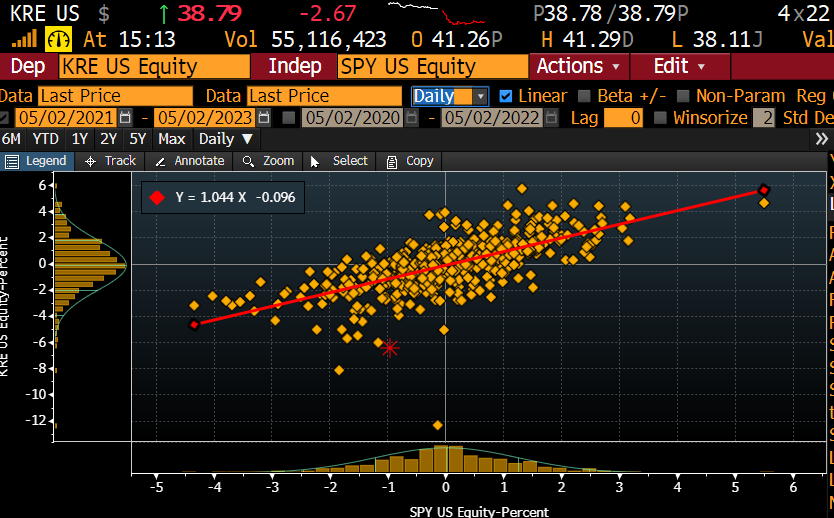
The S&P 500 (INDEX: SPX) recovered after a violent sell-off led by products like the SPDR S&P Regional Banking ETF (NYSE: KRE). This is before updates on the Federal Reserve’s (Fed) monetary policy today.
Graphic: Retrieved from Danny Kirsch of Piper Sandler Companies (NYSE: PIPR).
The consensus is the Fed ratchets up the target rate to 5.00-5.25%. Following this, it is likely to keep rates at this higher level for longer than markets expect, letting the effects of the tightening work through the economy and tame the still-sticky inflation (e.g., lenders eating the cost of interest to sell more goods, job vacancies dropping, and payrolls surprising higher).
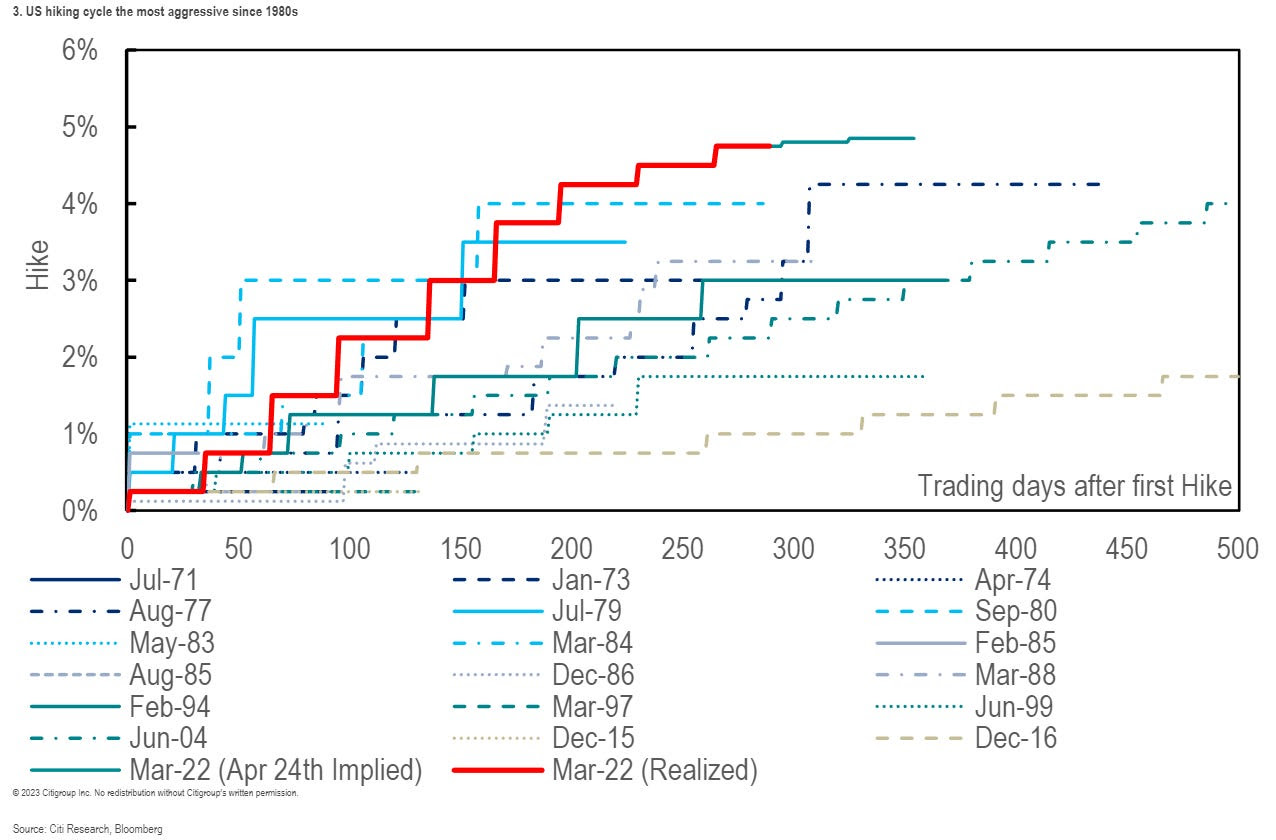
Graphic: Retrieved from Citigroup Inc (NYSE: C) via Bloomberg. “The Fed’s own projections from March suggest rates will be only just above 5% by year’s end — implying a protracted pause with no cuts, after the most aggressive hiking campaign in decades. It’s marked in red in the chart [above].”
Strategists at JPMorgan Chase & Co (NYSE: JPM) think a “hike and pause” scenario prompts a push higher in stocks.
“Here, the Fed would be relying on a tightening of lending standards stemming from the banking crisis to act as de facto rate hikes. Any language that the market interprets as the Fed being on pause should benefit stocks,” JPM wrote. “This outcome is not fully priced into equities.”
This idea was alluded to in yesterday’s letter; stocks likely do “ok” in a higher rates for longer environment. Beyond economic surprises and the debt ceiling issue, the Fed’s balance sheet (not likely to be addressed in this next announcement) strategists like Andy Constan of Damped Spring Advisors are most concerned about, since the size of quantitative easing or QE made stocks less sensitive to interest rates. Ratcheting quantitative tightening or QT, the flow of capital out of markets, would prompt some increased bearishness among those strategists.
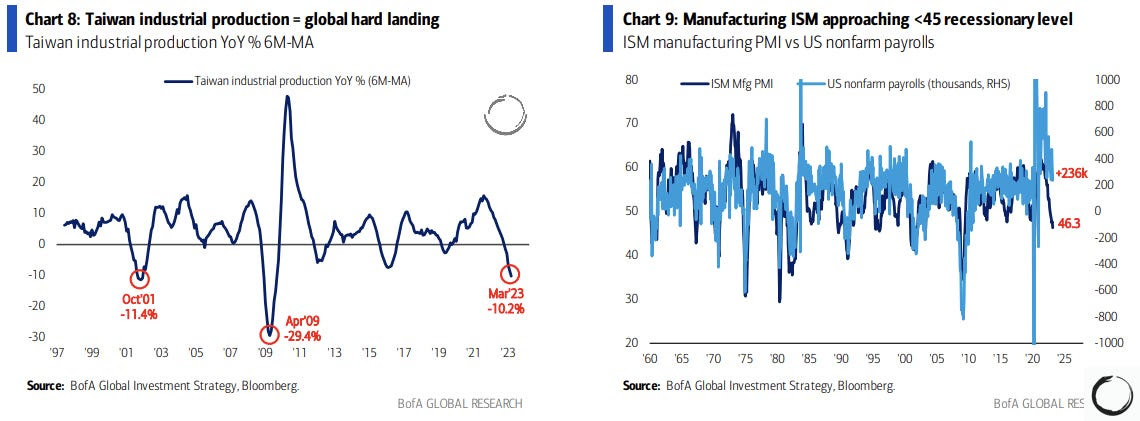
Graphic: Retrieved from Bank of America Corporation (NYSE: BAC) via Macro Ops.
JPM strategists add the market may continue “artificially suppress[ing] perceptions of fundamental macro risks,” prompting upside momentum.
“We expect these inflows to persist over the next two weeks, with several more large returns expected to drop from the trailing sample window,” Tier1Alpha explains. “Even if market volatility increases during this time, it would take exceptionally significant moves to trigger substantial selling. While these inflows are advantageous during market upswings, it’s essential to remember that they can be particularly brutal on the way back down once volatility inevitably returns.”
Eventually, “as recessionary conditions proliferate,” EPB’s Eric Basmajian says, asset prices will turn. Downside accelerants include the debt limit breach, which Nasdaq Inc (NASDAQ: NDAQ) and Moody’s Corporation (NYCE: MCO) think portends recession and volatility spike.
Trade ideas and more in our recently published report.
Welcome to the Daily Brief by Physik Invest, a soon-to-launch research, consulting, trading, and asset management solutions provider. Learn about our origin story here, and consider subscribing for daily updates on the critical contexts that could lend to future market movement.
Separately, please don’t use this free letter as advice; all content is for informational purposes, and derivatives carry a substantial risk of loss. At this time, Capelj and Physik Invest, non-professional advisors, will never solicit others for capital or collect fees and disbursements. Separately, you may view this letter’s content calendar at this link.
The Daily Brief is a free glimpse into the prevailing fundamental and technical drivers of U.S. equity market products. Join the 200+ that read this report daily, below!
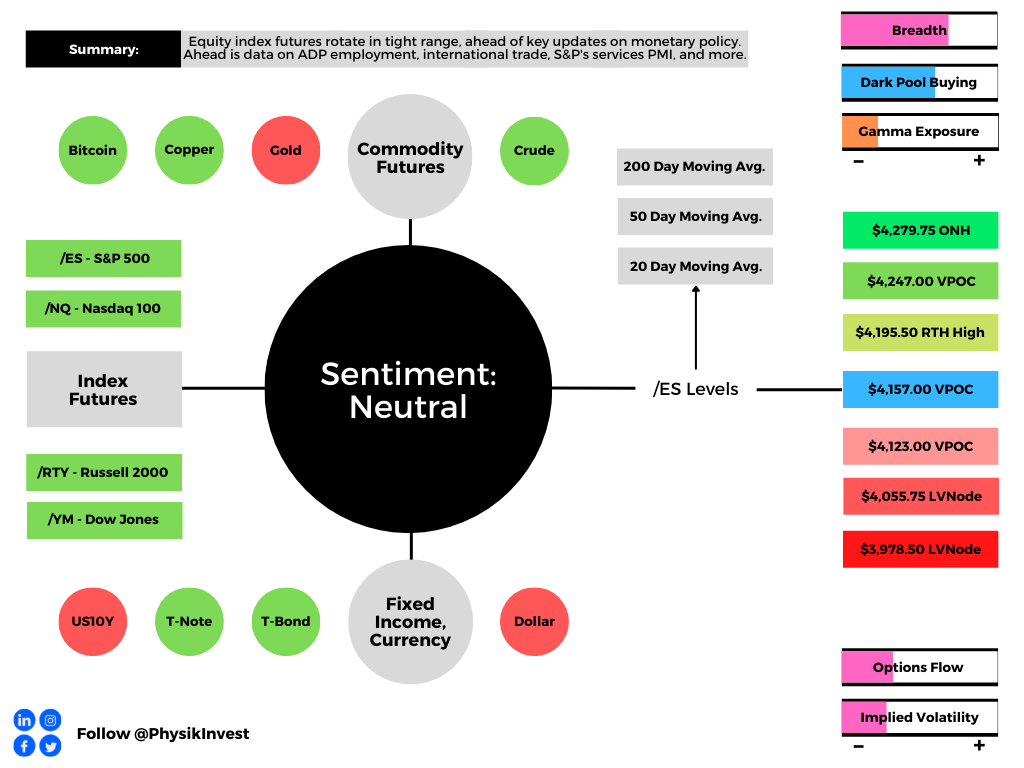
Overnight, equity index futures were quiet, auctioning sideways-to-higher, ahead of updates on monetary policies.
A check on some naive measures suggests we’re in for an expansion of range (i.e., heightened realized volatility) in the coming session(s). Key, today, are Federal Open Market Committee (FOMC) updates (2:00 PM ET) and a news conference (2:30 PM ET).
The expectation is a 50 basis point hike and balance sheet contraction with run-off caps of $95 billion. If the action is in line with expectations (priced in), the reaction is likely to be positive.
Today’s economic calendar includes, also, a release of the Automatic Data Processing Inc’s (NASDAQ: ADP) employment report (8:15 AM ET), international trade balance (8:30 AM ET), S&P Global Inc’s (NYSE: SPGI) U.S. services PMI (9:45 AM ET), and the ISM services index (10:00 AM ET).
Graphic updated 7:00 AM ET. Sentiment Neutral if expected /ES open is inside of the prior day’s range. /ES levels are derived from the profile graphic at the bottom of the following section. Levels may have changed since initially quoted; click here for the latest levels. SqueezeMetrics Dark Pool Index (DIX) and Gamma (GEX) calculations are based on where the prior day’s reading falls with respect to the MAX and MIN of all occurrences available. A higher DIX is bullish. At the same time, the lower the GEX, the more (expected) volatility. Learn the implications of volatility, direction, and moneyness. SHIFT data used for S&P 500 (INDEX: SPX) options activity. Note that options flow is sorted by the call premium spent; if more positive, then more was spent on call options. Breadth reflects a reading of the prior day’s NYSE Advance/Decline indicator. VIX reflects a current reading of the CBOE Volatility Index (INDEX: VIX) from 0-100.
What To Expect
Fundamental: Expected is front-loaded tightening, by the Federal Reserve (Fed), today.
The consensus is anchored around a 50 basis-point hike in May and no adjustments to the Reverse Repo Rate (RRP) or Interest on Reserve Balances (IORB), says Nordea Bank (OTC: NRDBY) research. The Fed may opt, also, to initiate a 75 basis-point hike in June.
“We believe that after the FOMC hikes by a half-point in May and presents a detailed plan to reduce the Fed balance sheet,” imminently, says Anna Wong, Yelena Shulyatyeva, Andrew Husby, and Eliza Winger of Bloomberg.
“Powell will avoid definitive guidance about the size of future hikes, as policymakers assess how the runoff is affecting the economy in coming months.”
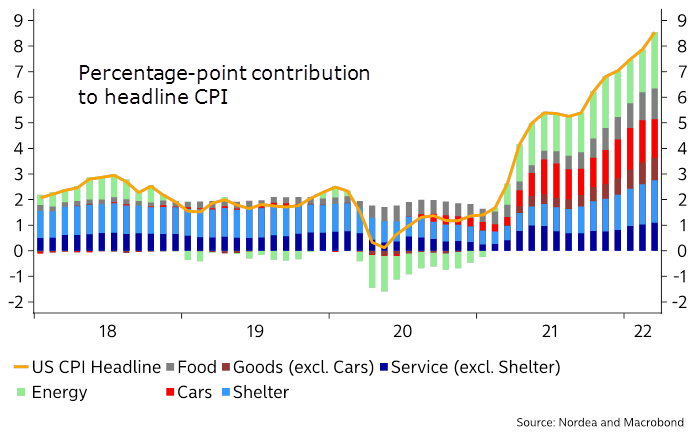
Graphic: Via Nordea research. Heightened inflation, exacerbated by sticky supply pressures and the conflict in Ukraine, and trends in demand have played into a tough talk on monetary policies.
As noted before, the key (risk) is the statements on the Fed’s balance sheet and the (imminent) process to shrink it through quantitative tightening (QT).
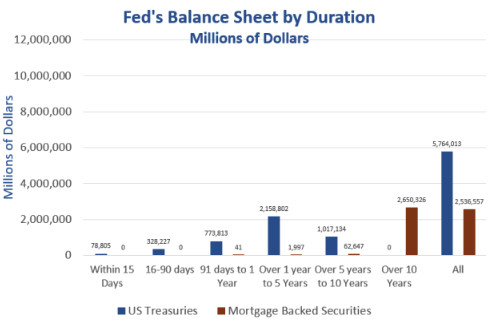
Graphic: Via Mish Talk. “The Fed expanded QE aggressively for years. But nearly all of that expansion was longer-dated securities as the [] chart shows. If the Fed had short-term securities it could reduce its balance sheet simply by runoff. Instead, the Fed will aggressively have to sell securities, especially MBS, if it really wants to reduce its balance sheet as quickly as it has implied.
Per Nordea, QT is likely to consist of a 3-month phase-in period and run-off caps of $95 billion (i.e., $60 billion on U.S. Treasuries [USTs] and $35 billion in mortgage-backed securities [MBSs]), effectively lowering the Fed’s balance sheet by $670 billion by year-end.
Graphic: Via Bloomberg and Mitsubishi UFJ Financial Group Inc (NYSE: MUFG) U.S. Macro Strategy.
This is alongside the realization that “1Q may be the last good quarter of earnings as higher costs and increased recession risks weigh on future growth,” Morgan Stanley’s (NYSE: MS) Mike Wilson explains.
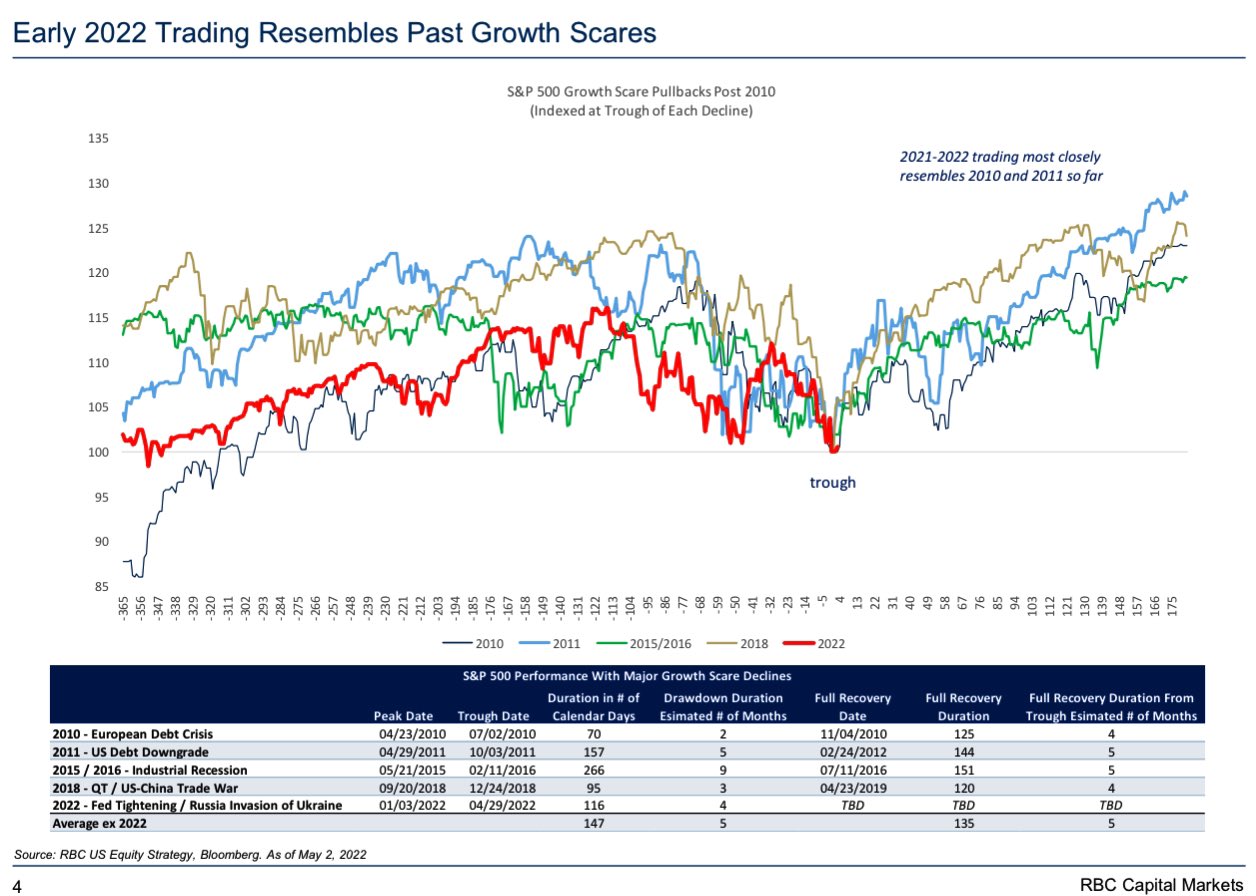
Graphic: Via Royal Bank of Canada (NYSE: RY) U.S. Equity Strategy and Bloomberg.
Market weakness in the past weeks was the result of “growing evidence that growth is slowing faster than most investors believe,” Wilson adds, and “the market is currently so oversold, any good news [such as Fed action being as expected] could lead to a vicious bear market rally.”
“We can’t rule anything out in the short term but we want to make it clear this bear market is far from complete.”
Happy Fed Day: not all Fed Days are created =, but here’s a little historic data 🤔 pic.twitter.com/WKTVgn8D2m
Positioning: Borrowing from yesterday’s letter, as little has changed, bets on the direction are concentrated in negative delta (long puts, short calls). The exposure is short-dated and highly sensitive to changes in implied volatility and direction.
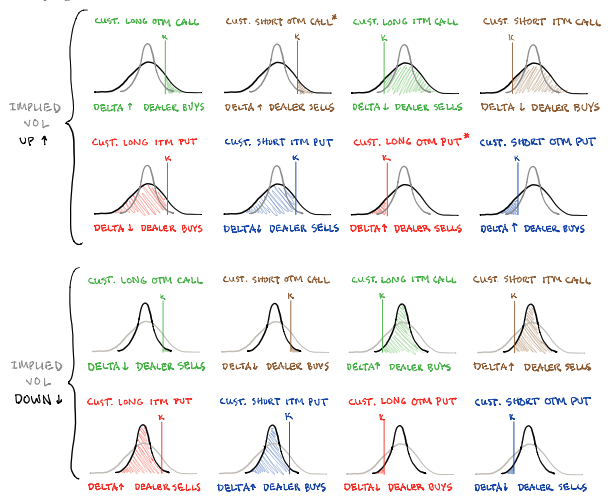
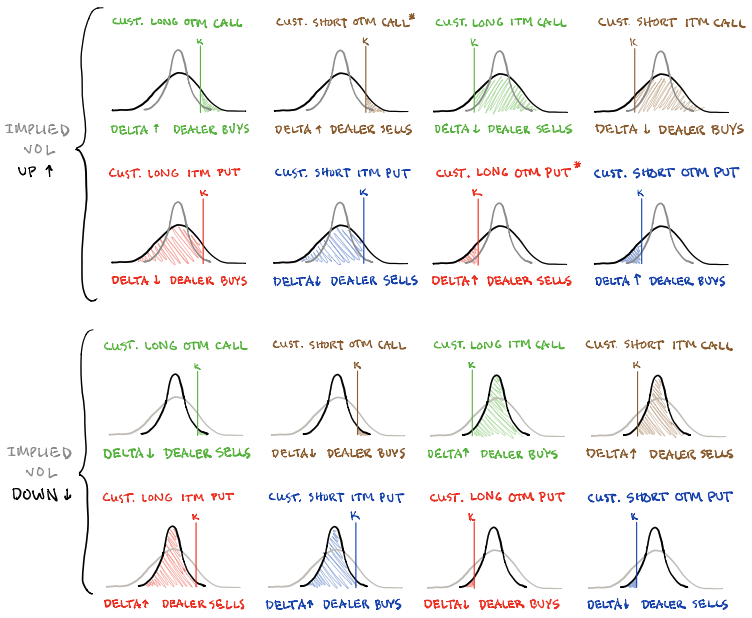
Graphic: SqueezeMetrics on “how IV, direction, and moneyness cause option dealers to buy or sell the underlying.”
This exposure’s roll-off and compression in volatility ought to coincide with liquidity provider support to markets (i.e., relief of pressure from hedges to concentrated options positioning).
Per Kai Volatility’s Cem Karsan, on a Fed day, “the first move tends to be structural. A function of the inevitable rebalancing of dealer inventory post-event. The second move and final resolution, if you wait for it, is usually tied to the incremental effects on liquidity (QE/QT).”
Validation of the latter (move) ought to be confirmed by participants’ new concentration of bets. In other words, if participants start to concentrate their bets at higher prices, further out in time, that confirms (changing sentiment) and (improves) the odds of sustained follow-through.
If not, it’s likely that prices, after a short-term relief, will succumb to fundamental weaknesses.
Technical: As of 7:00 AM ET, Wednesday’s regular session (9:30 AM – 4:00 PM ET), in the S&P 500, will likely open in the upper part of a balanced overnight inventory, just inside of prior-range and -value, suggesting a limited potential for immediate directional opportunity.
In the best case, the S&P 500 trades higher; activity above the $4,157.00 untested point of control (VPOC) puts in play the $4,195.50 regular trade high (RTH High). Initiative trade beyond the RTH High could reach as high as the $4,247.00 VPOC and $4,279.75 overnight high (ONH), or higher.
In the worst case, the S&P 500 trades lower; activity below the $4,157.00 VPOC puts in play the $4,123.00 VPOC. Initiative trade beyond the $4,123.00 VPOC could reach as low as the $4,055.75 and $3,978.50 low volume areas (LVNodes), or lower.
Click here to load today’s key levels into the web-based TradingView charting platform. Note that all levels are derived using the 65-minute timeframe. New links are produced, daily.
Graphic: 65-minute profile chart of the Micro E-mini S&P 500 Futures.
What People Are Saying
1/x It is time to wake up to the fact that the Fed has little to no power to control price inflation…the fact that they are charged w/ price stability in today’s economy is a charade….For 43 yrs the Fed has lowered rates & For 43 yrs the result of this policy has been secular
Overnight Rally Highs (Lows): Typically, there is a low historical probability associated with overnight rally-highs (lows) ending the upside (downside) discovery process.
Volume Areas: A structurally sound market will build on areas of high volume (HVNodes). Should the market trend for long periods of time, it will lack sound structure, identified as low volume areas (LVNodes). LVNodes denote directional conviction and ought to offer support on any test.
If participants were to auction and find acceptance into areas of prior low volume (LVNodes), then future discovery ought to be volatile and quick as participants look to HVNodes for favorable entry or exit.
POCs: POCs are valuable as they denote areas where two-sided trade was most prevalent in a prior day session. Participants will respond to future tests of value as they offer favorable entry and exit.
Volume-Weighted Average Prices (VWAPs): A metric highly regarded by chief investment officers, among other participants, for quality of trade. Additionally, liquidity algorithms are benchmarked and programmed to buy and sell around VWAPs.
About
After years of self-education, strategy development, mentorship, and trial-and-error, Renato Leonard Capelj began trading full-time and founded Physik Invest to detail his methods, research, and performance in the markets.
Capelj also develops insights around impactful options market dynamics at SpotGamma and is a Benzinga reporter.
In no way should the materials herein be construed as advice. Derivatives carry a substantial risk of loss. All content is for informational purposes only.
Editor’s Note: The Daily Brief is a free glimpse into the prevailing fundamental and technical drivers of U.S. equity market products. Join the 200+ that read this report daily, below!
Overnight, futures were mixed. The equity indices auctioned sideways to higher, in line with most commodity products. Bonds were lower, as was the VIX, an implied volatility measure.
Pursuant to the VIX remark, volatility measures in the rates, foreign exchange, and commodity markets are surging amidst geopolitical uncertainties and monetary policy action.
Ahead is data on ADP employment (8:15 AM ET), Fed-speak by Charles Evans (9:00 AM ET), James Bullard (9:30 AM ET), and Jerome Powell (10:00 AM ET). Later, is a release of the Beige Book (2:00 PM ET).
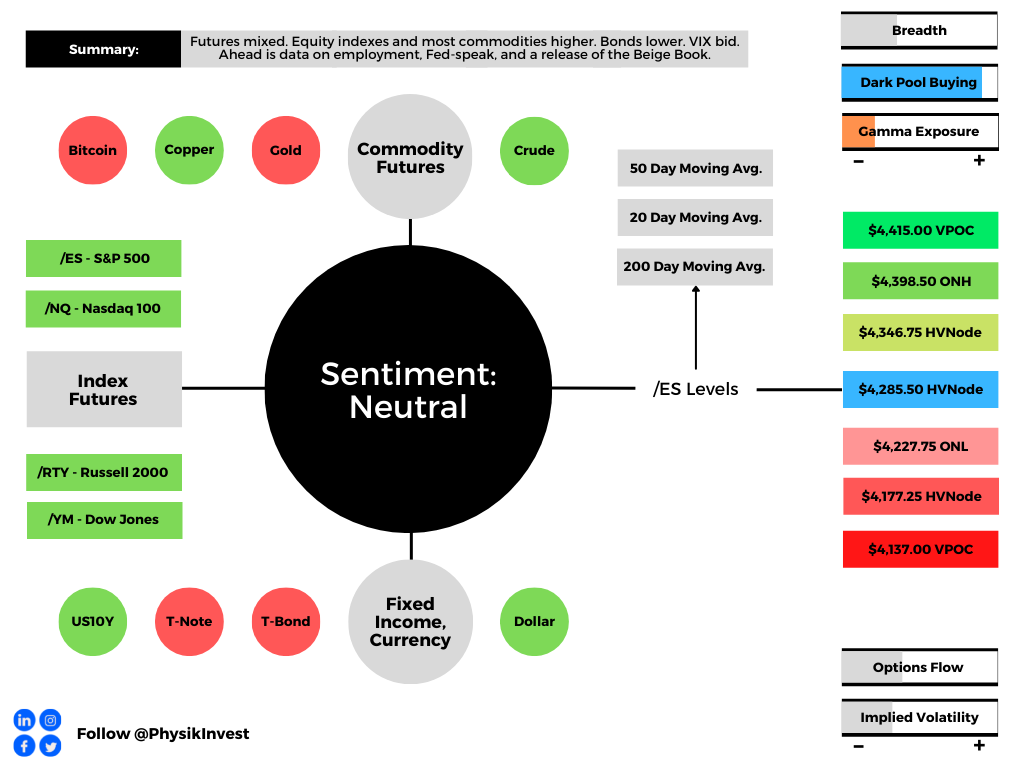
Graphic updated 6:30 AM ET. Sentiment Neutral if expected /ES open is inside of the prior day’s range. /ES levels are derived from the profile graphic at the bottom of the following section. Levels may have changed since initially quoted; click here for the latest levels. SqueezeMetrics Dark Pool Index (DIX) and Gamma (GEX) calculations are based on where the prior day’s reading falls with respect to the MAX and MIN of all occurrences available. A higher DIX is bullish. At the same time, the lower the GEX, the more (expected) volatility. Learn the implications of volatility, direction, and moneyness. SHIFT data used for S&P 500 (INDEX: SPX) options activity. Note that options flow is sorted by the call premium spent; if more positive, then more was spent on call options. Breadth reflects a reading of the prior day’s NYSE Advance/Decline indicator. VIX reflects a current reading of the CBOE Volatility Index (INDEX: VIX) from 0-100.
What To Expect
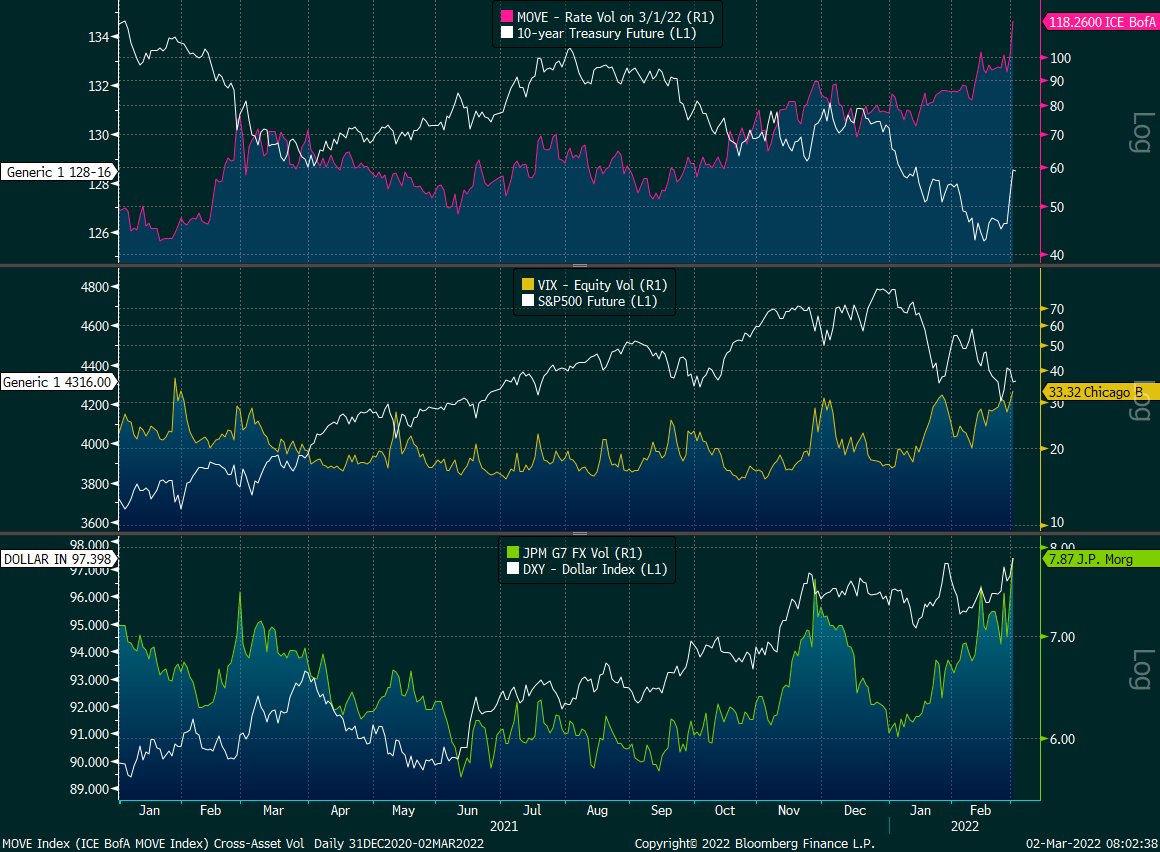
Fundamental: Cross-asset volatility is spiking as investors look to protect against Russia-Ukraine and monetary policy action, among other things.
Graphic: Via @EffMktHype. “Rate vol through the roof, FX picking up steam while equity vol arguably still cheap in comparison despite being at the high end of its 1-year end.” Please note the spike in rate and FX vol versus equity vol (which is sideways to higher, mostly).
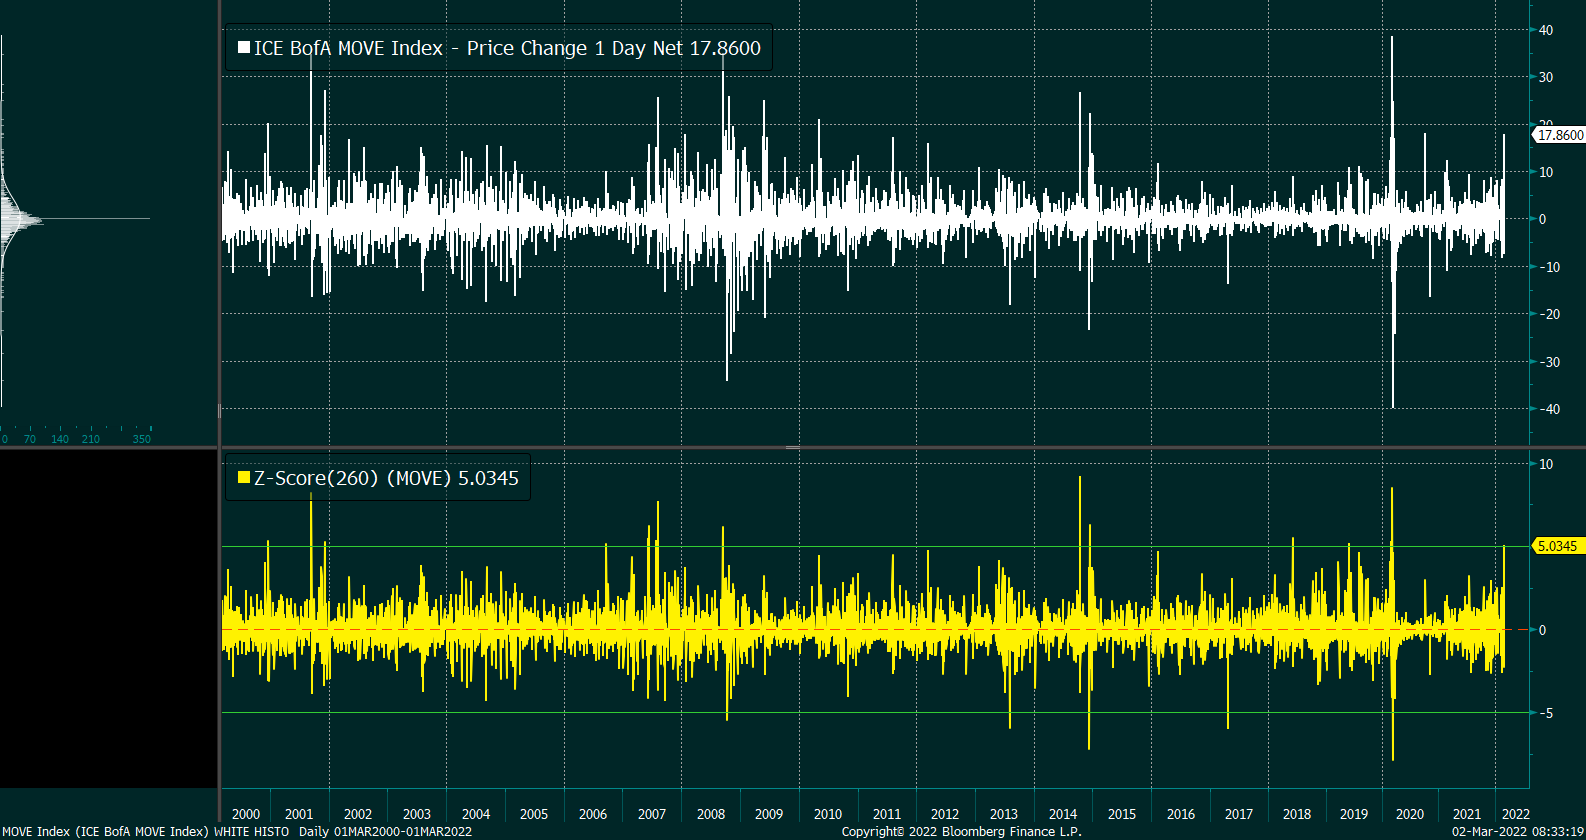
Very interesting is action in the rates market where there was a “5-sigma upward shift in MOVE on 3/1/22. [This] has happened 13 times prior in the last 22 years,” said one commentator.
Graphic: Via @EffMktHype. Merrill Lynch Option Volatility Estimate (INDEX: MOVE).
Taken together, the bond market’s pricing of risk – reflected by the Merrill Lynch Option Volatility Estimate (INDEX: MOVE) – is not in line (or moving in-step) with equity market risk, via the CBOE Volatility Index (INDEX: VIX).
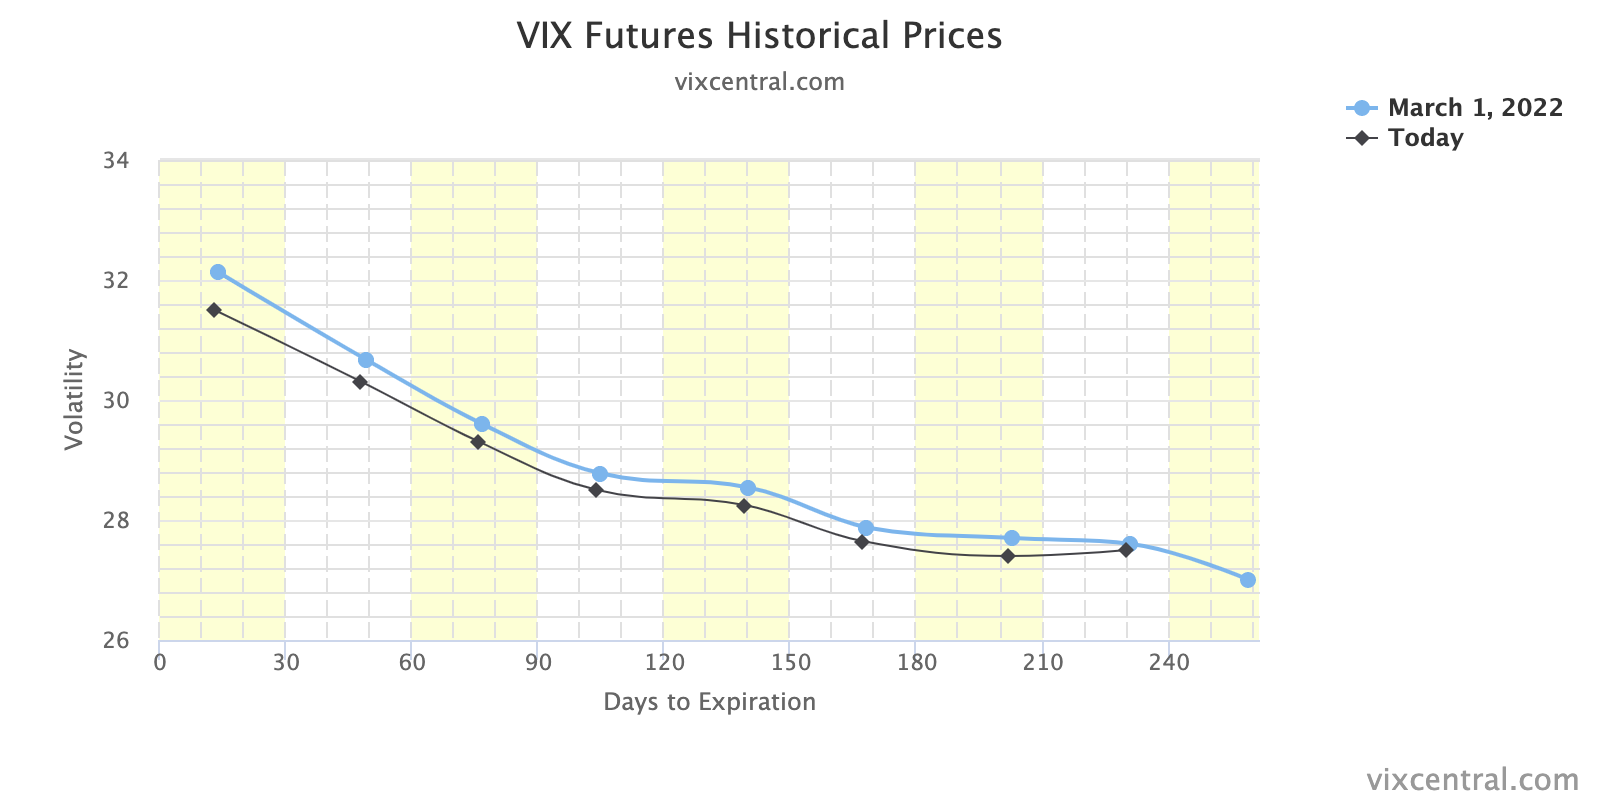
Today is the first day since late Jan that the option market is pricing up volatility a noteworthy but not extreme amount (on a closing basis). $VIX closed at 33.32, ATM implied volatility closed at ~29 highest in over a yr.
The fear in one market tends to feed into the fear of another; regardless of the cause, it seems that equity and bond market participants are not (quite) on the same page.
Moreover, this is in part beyond a decline in liquidity (the variable that’s been connected with the creation of wealth through higher asset prices over time), and has much to do with participants “de-risking” amidst a wide distribution of potential outcomes, another commentator explained.
These fears are in the face of emerging risks to growth (given Russia-Ukraine and beyond); the question is whether there is a dovish surprise and this lends to assuaging participants of fear.
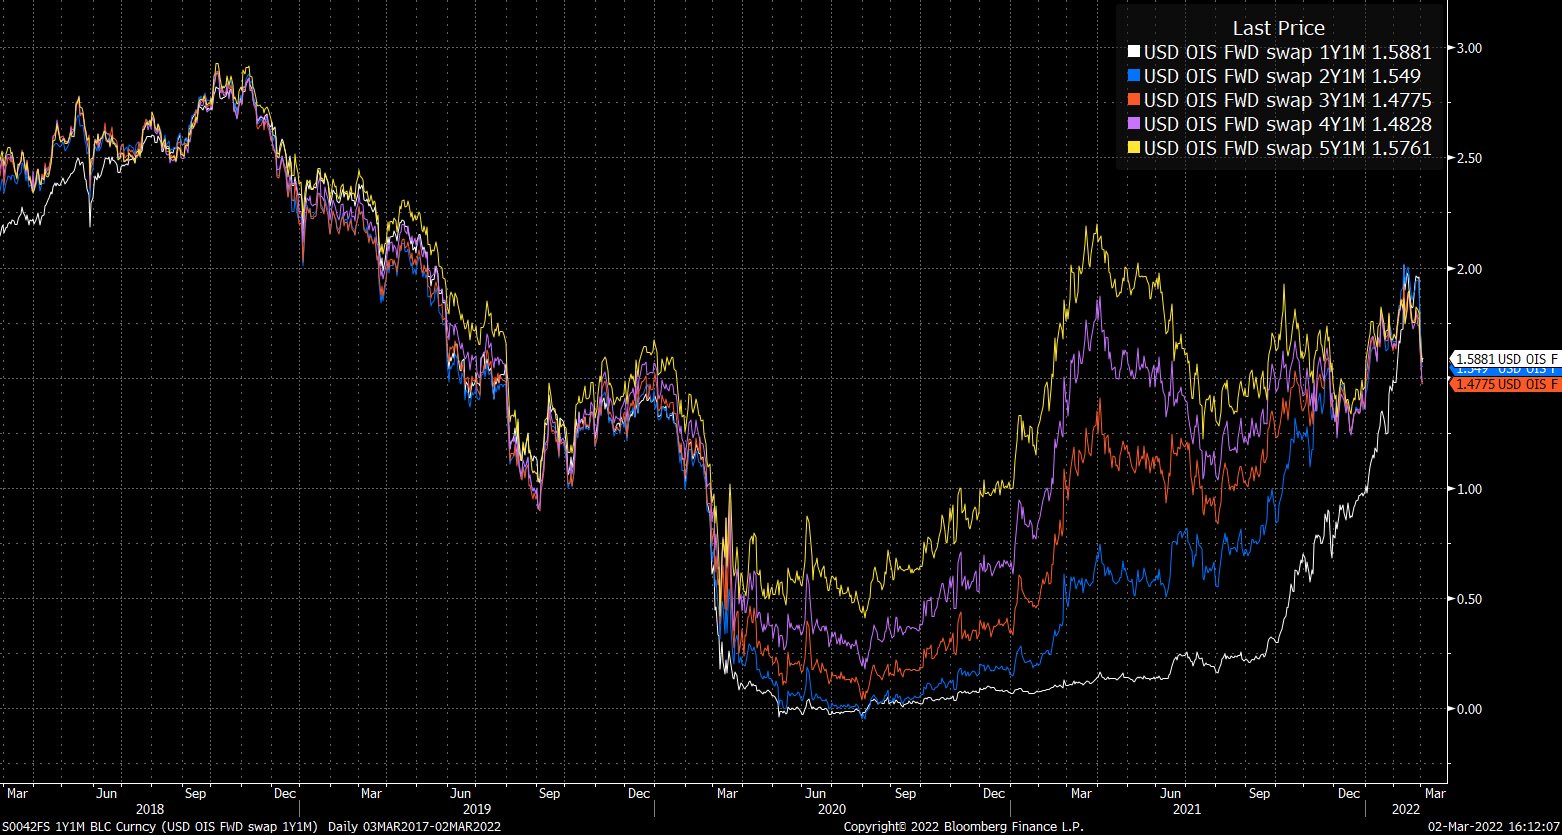
Graphic: Via @EffMktHype. “Forward OIS have coalesced since end-Jan and started to aggressively price out rate hikes.”
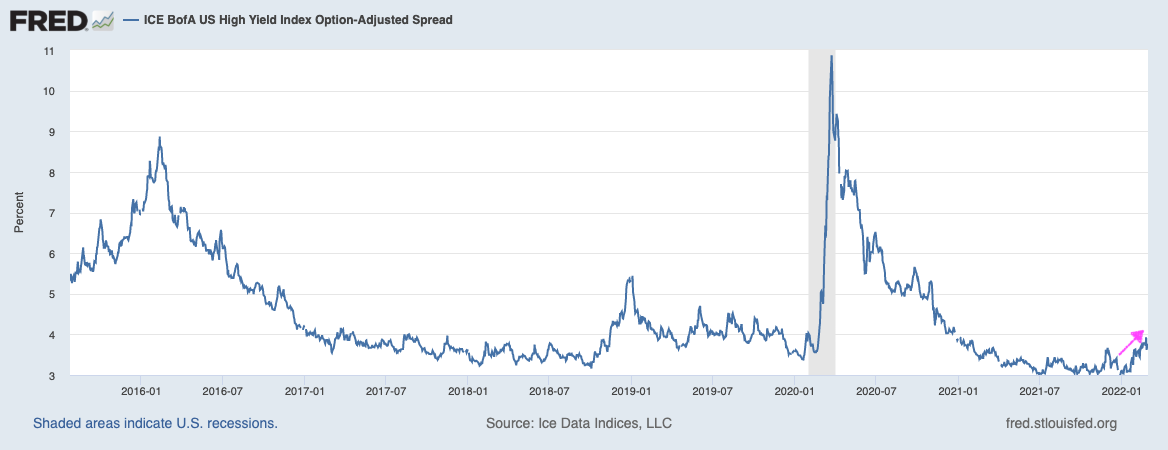
Taking a look at the U.S. high yield OAS (option-adjusted spread), participants see a “risk-off” bottom; deteriorating credit conditions are a bearish leading indicator.
Will there be further deterioration that feeds into an eventual repricing of equity market risk? Or, will there be a pullback on hawkishness like the market has started pricing?
Positioning: Pursuant to the remarks made on equity implied volatility, March 1, 2022, was “the first day since late January that the options market [was] pricing up volatility a noteworthy but not extreme amount (on a closing basis).”
This is, per SpotGamma, amidst participants’ heightened demand for downside (put) protection; in purchasing protection, traders indirectly take liquidity as counterparties hedge exposure in the underlying.
Everyone in the world is sick of the “dealer gamma hedging” narrative. Including myself and the rest of the vol guys.
However, it remains such a big part of this market it’s hard to downplay the implications and not discuss it when talking about the environment. pic.twitter.com/pDLmlALNR1
The effects of this hedging are more notable given reticence on the part of counterparties.
“Essentially, with markets swinging there is a hesitance amongst liquidity providers to step in. This creates an environment in which the absorption of orders deteriorates,” SpotGamma explains. “Given this, the hedging of options exposure further amplifies market moves.”
A heightened VIX, in the face of an equity market that is not trading much weaker, is a clear reflection of this so-called reticence.
Pictured: SqueezeMetrics highlights implications of volatility, direction, and moneyness.
Going forward, bearing in mind the continued passive buying support alluded to in past commentaries, if participants were to be assuaged of their fears, that would likely coincide with less(er) demand for downside protection and compression in volatility.
The implications of this? Reduced demand for protection coincides with less counterparty negative gamma exposure (as counterparty put buying [a negative delta, positive gamma trade] coincides with the addition of liquidity [purchase of underlying, a positive delta trade]).
In counterparties being less exposed to losses on the downside (via reduced negative gamma exposure), their (re)hedging may bolster attempts higher (i.e., open the door to the upside).
The likelihood of this dynamic coming to fruition is low(er), up until the passage of the Federal Open Market Committee event March 15-16, 2022, and options expiration (that same week).
Graphic: Fear and demand for protection concentrated in shorter-dated contracts most sensitive to changes in implied volatility and direction results in pressure from hedging. The compression of volatility likely coincides with support of attempts higher (as this removes pressure).
Technical: As of 6:30 AM ET, Wednesday’s regular session (9:30 AM – 4:00 PM ET), in the S&P 500, will likely open in the upper part of a balanced overnight inventory, inside of prior-range and -value, suggesting a limited potential for immediate directional opportunity.
In the best case, the S&P 500 trades higher; activity above the $4,285.50 high volume area (HVNode) puts in play the $4,346.75 HVNode. Initiative trade beyond the $4,346.75 HVNode could reach as high as the $4,398.50 overnight high (ONH) and $4,415.00 VPOC, or higher.
In the worst case, the S&P 500 trades lower; activity below the $4,285.50 HVNode puts in play the $4,227.75 overnight low. Initiative trade beyond the ONL could reach as low as the $4,177.25 HVNode and $4,137.00 untested point of control (VPOC), or lower.
Considerations: The market is in balance or rotational trade that suggests current prices offer favorable entry and exit. Balance-areas make it easy to spot a change in the market (i.e., the transition from two-time frame trade, or balance, to one-time frame trade, or trend).
Modus operandi is responsive trade (i.e., fade the edges), rather than initiative trade (i.e., play the break).
Click here to load today’s key levels into the web-based TradingView charting platform. Note that all levels are derived using the 65-minute timeframe. New links are produced, daily.
Graphic: 65-minute profile chart of the Micro E-mini S&P 500 Futures.
What People Are Saying
For investors who imagine the S&P 500 is somehow "cheap" at a P/E above 22 – amid record profit margins – you may want to examine historical data and think through what P/E ratios mean.
Volume Areas: A structurally sound market will build on areas of high volume (HVNodes). Should the market trend for long periods of time, it will lack sound structure, identified as low volume areas (LVNodes). LVNodes denote directional conviction and ought to offer support on any test.
If participants were to auction and find acceptance into areas of prior low volume (LVNodes), then future discovery ought to be volatile and quick as participants look to HVNodes for favorable entry or exit.
Gamma: Gamma is the sensitivity of an option to changes in the underlying price. Dealers that take the other side of options trades hedge their exposure to risk by buying and selling the underlying. When dealers are short-gamma, they hedge by buying into strength and selling into weakness. When dealers are long-gamma, they hedge by selling into strength and buying into weakness. The former exacerbates volatility. The latter calms volatility.
Vanna: The rate at which the delta of an option changes with respect to volatility.
Charm: The rate at which the delta of an option changes with respect to time.
POCs: POCs are valuable as they denote areas where two-sided trade was most prevalent in a prior day session. Participants will respond to future tests of value as they offer favorable entry and exit.
Volume-Weighted Average Prices (VWAPs): A metric highly regarded by chief investment officers, among other participants, for quality of trade. Additionally, liquidity algorithms are benchmarked and programmed to buy and sell around VWAPs.
Rates: Low rates have to potential to increase the present value of future earnings making stocks, especially those that are high growth, more attractive. To note, inflation and rates move inversely to each other. Low rates stimulate demand for loans (i.e., borrowing money is more attractive).
About
After years of self-education, strategy development, mentorship, and trial-and-error, Renato Leonard Capelj began trading full-time and founded Physik Invest to detail his methods, research, and performance in the markets.
Capelj is also a Benzinga finance and technology reporter interviewing the likes of Shark Tank’s Kevin O’Leary, JC2 Ventures’ John Chambers, FTX’s Sam Bankman-Fried, and ARK Invest’s Catherine Wood, as well as a SpotGamma contributor developing insights around impactful options market dynamics.
Disclaimer
Physik Invest does not carry the right to provide advice.
In no way should the materials herein be construed as advice. Derivatives carry a substantial risk of loss. All content is for informational purposes only.
The Daily Brief is a free glimpse into the prevailing fundamental and technical drivers of U.S. equity market products. Join the 200+ that read this report daily, below!
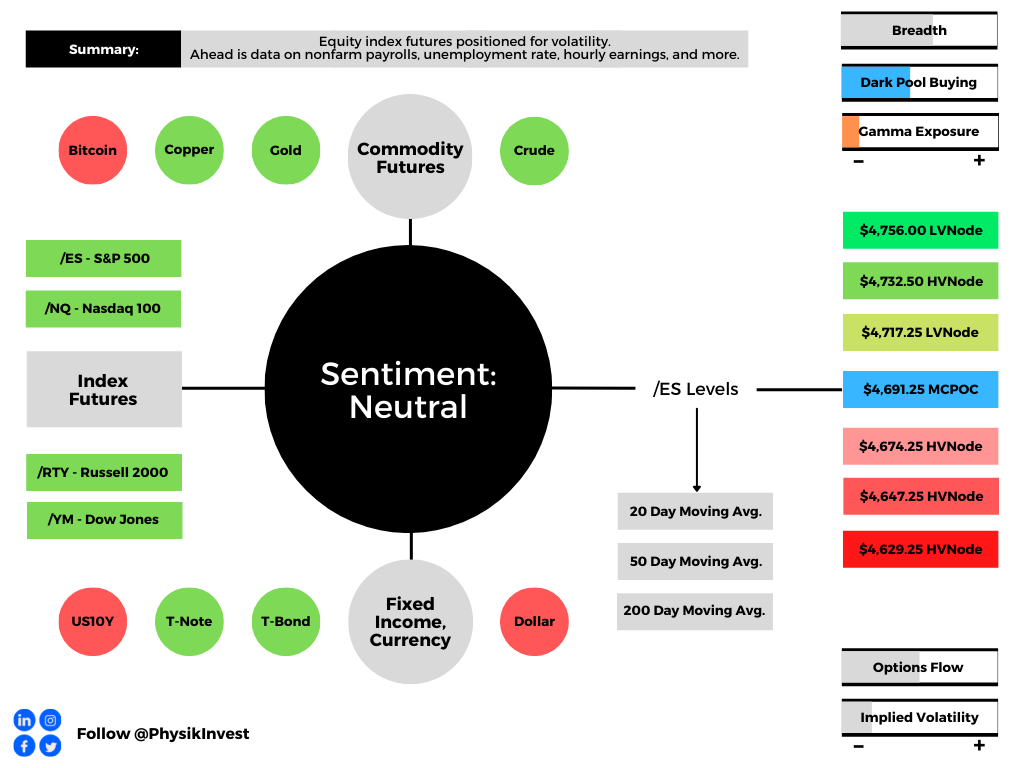
Equity index futures auctioned sideways, mostly, ahead of important economic releases such as data on Nonfarm payrolls, the unemployment rate, and average hourly earnings (8:30 AM ET), as well as Fed-speak (10:00 AM and 12:15 PM ET), and consumer credit data (3:00 PM ET).
Graphic updated 6:30 AM ET. Sentiment Neutral if expected /ES open is inside of the prior day’s range. /ES levels are derived from the profile graphic at the bottom of the following section. Levels may have changed since initially quoted; click here for the latest levels. SqueezeMetrics Dark Pool Index (DIX) and Gamma (GEX) calculations are based on where the prior day’s reading falls with respect to the MAX and MIN of all occurrences available. A higher DIX is bullish. At the same time, the lower the GEX, the more (expected) volatility. Learn the implications of volatility, direction, and moneyness. SHIFT data used for S&P 500 (INDEX: SPX) options activity. Note that options flow is sorted by the call premium spent; if more positive, then more was spent on call options. Breadth reflects a reading of the prior day’s NYSE Advance/Decline indicator. VIX reflects a current reading of the CBOE Volatility Index (INDEX: VIX) from 0-100.
What To Expect
Fundamental: Participants will receive further clarity around payrolls data.
According to Bloomberg, the expectation is that Friday’s jobs report ought to show the addition of about 450,000 workers, last month.
“[T]he so-called whisper number has already jumped to 500,000,” in light of this “Wednesday’s consensus-busting ADP Research Institute data that showed U.S. companies added the most jobs in seven months.”
This is all the while major equity indices are down on the week, “fueled by one of the most intense bouts of selling by professional speculators since the financial crisis.”
Per Goldman Sachs Group Inc (NYSE: GS) prime broker data, the sale of highly valued growth stocks reached levels not seen in more than 10 years. Selling worsened after minutes to the Federal Reserve’s last policy meeting pointed to faster hikes and balance sheet normalization.
As higher rates are to fend off inflation, they, too, have the potential to decrease the present value of future earnings making stocks (especially high growth) less attractive.
“A strong [payrolls] print will see the market factor in hikes/quantitative tightening even earlier,” strategists at Mizuho International Plc said. “We’d therefore prefer to be positioned for more equity downside, and for higher yields.”
Fresh in my mind is a conversation I had with Karan Sood, CEO and Managing Director, Head of Product Development at Cboe Vest Financial LLC, regarding his firm’s packaged options and volatility targeting strategies that help investors manage their portfolio volatility.
Moreover, over the past 40 or so years, monetary policy was used as a crutch to support the economy. This promoted deflation, innovation, and the subsequent rise in valuations.
“Bonds have been giving you really good returns because interest rates have been going down since the 1970s when they peaked at about 11%,” Sood explained to me.
“That’s changing now; we’re at the zero bound, and it’s unlikely that will be as a strong of a tailwind. Worse, it could be a headwind if interest rates start to rise.”
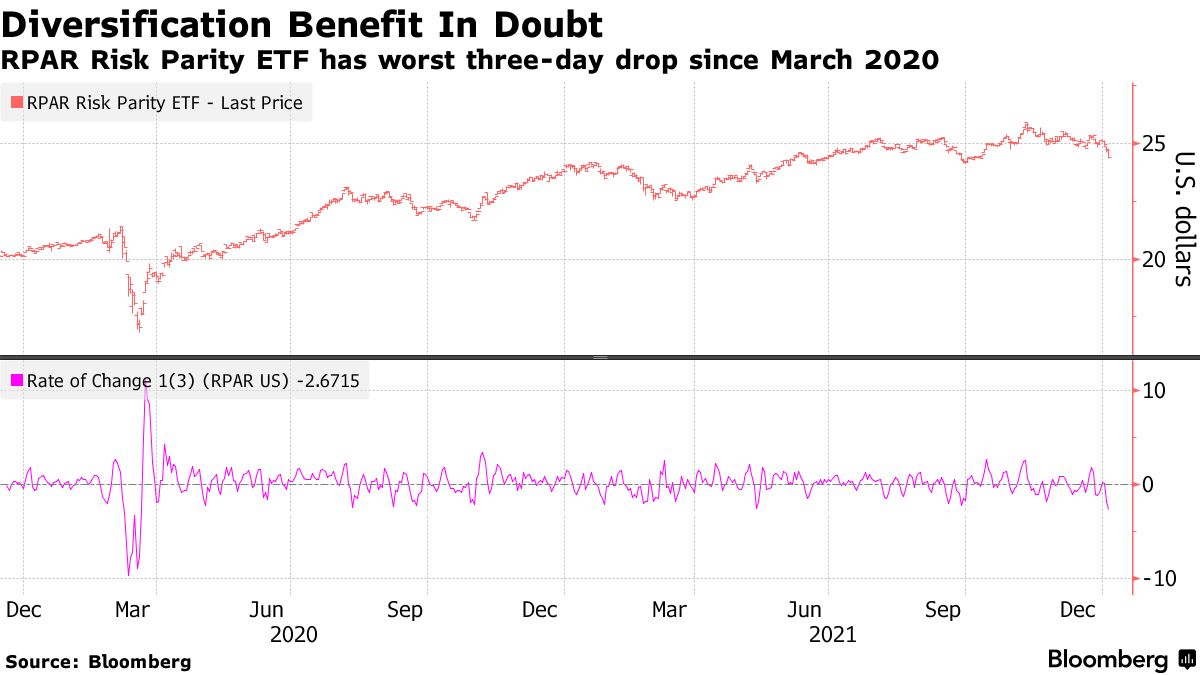
As a result of this dynamic, coupled with participants’ increased exposure to rate and equity market risk which can play into cross-market hedging and de-leveraging cascades, 60/40 can be somewhat of a poor hedge.
“Now, with the Fed poised to hike interest rates to combat raging inflation, the bond-stock relationship could be upended,” Bloomberg explains.
“At stake are trillions of dollars that are managed at risk parity funds, balanced mutual funds, and pension funds that follow the framework of 60/40 asset allocation.”
Graphic: Via Bloomberg.
Why mention any of this? Well, it forces us to look elsewhere for protection.
In this case, the growing asset class of volatility, so to speak, is that protection. Investors are aware of both the protective and speculative efficiency afforded to them by options and that is the primary reason option volumes are so comparable to stock volumes, now.
Notwithstanding, with option volumes higher, related hedging flows can represent an increased share of volume in underlying stocks. Therefore, the correlation of stock moves, versus options activity, is more pronounced.
To put it simply, we can look to the options market for clues on where to next, for lack of better phrasing. So, let’s do that!
Wednesday’s session unwound some of the single-stock bullishness (in stocks like Tesla) that fed into the S&P 500, itself; an expansion in volatility coincided with the demand for downside (put) protection and supply of upside (call) protection.
Conditions settled, Thursday. Though positioning metrics had little to offer in terms of predicting movement, implied volatility remained heightened and many products did not expand range.
All else equal, higher implied volatility marks up options delta (exposure to direction).
Knowing that demand for downside protection coincides with customers indirectly taking liquidity and destabilizing the market as the participant short the put will sell underlying to neutralize risk, participants ought to keep their eye out on whether implied volatility expands or contracts.
Graphic: SqueezeMetrics details the implications of customer activity in the options market, on the underlying’s order book.
Higher implied volatility, higher delta, more selling. Hedging pressures will exacerbate weakness, as a result of real selling (as talked about above), at the index and single-stock level.
Graphic: The “Biggest tail risk to SPX isn’t any macro data/virus/war but its own options market.”
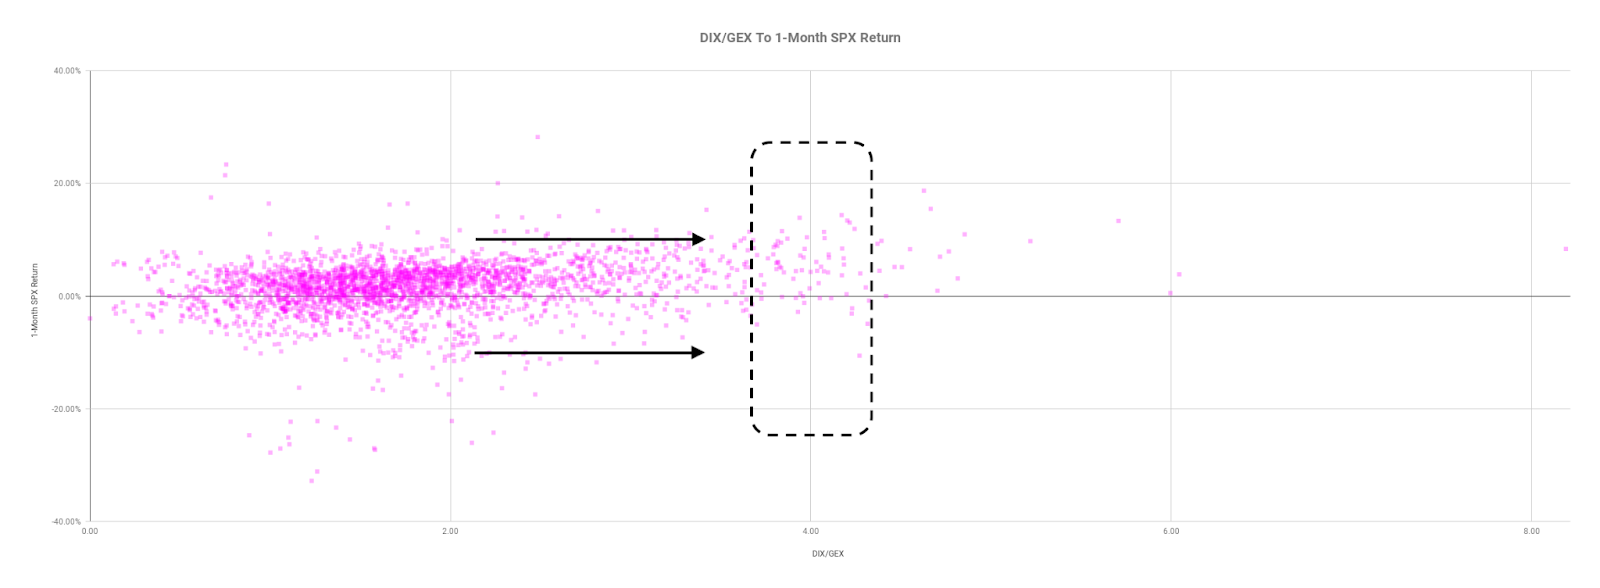
Taking into account options positioning, versus buying pressure (measured via short sales or liquidity provision on the market-making side), positioning metrics remain positively skewed, even more so than before.
Graphic: Data SqueezeMetrics. Graph via Physik Invest.
As stated yesterday, though the dip lower and demand for protection may serve to prime the market for upside (when volatility starts to compress again and counterparties unwind hedges thus supporting any attempt higher), markets will tend toward instability so long as volatility is heightened and the market remains in short-gamma territory.
Technical: As of 6:30 AM ET, Friday’s regular session (9:30 AM – 4:00 PM ET), in the S&P 500, will likely open in the middle part of a balanced overnight inventory, inside of prior-range and -value, suggesting a limited potential for immediate directional opportunity.
Spike Scenario In Play: Spike’s mark the beginning of a break from value. Spikes higher (lower) are validated by trade at or above (below) the spike base (i.e., the origin of the spike).

Spike base is at $4,761.25. Above, bullish. Below, bearish.
In the best case, the S&P 500 trades higher; activity above the $4,691.25 micro composite point of control (MCPOC) puts in play the $4,717.25 low volume area (LVNode). Initiative trade beyond the LVNode could reach as high as the $4,732.50 high volume area (HVNode) and $4,756.00 LVNode, or higher.
In the worst case, the S&P 500 trades lower; activity below the $4,691.25 MCPOC puts in play the $4,674.25 HVNode. Initiative trade beyond the latter could reach as low as the $4,647.25 and $4,629.25 HVNode, or lower.
Click here to load today’s key levels into the web-based TradingView charting platform. Note that all levels are derived using the 65-minute timeframe. New links are produced, daily.
Graphic: 65-minute profile chart of the Micro E-mini S&P 500 Futures.
What People Are Saying
Summary of near term outlook 1. Economic growth expectations are rising 2. High CPI print is discounted 3. Earnings will slay 4. Actual real drivers of risk premiums are supportive 5. Covid will peak or has 6. Options influence supportive Today 🥁 of QT is opportunity Net BTFD
Please find the results of my interview with the options flow master @bennpeifert for Top Traders Unplugged below. Thanks Benn! 06 Volatility Series: Finding True Value in the World of Volatility ft. Benn Eifert — January 5th, 2021 – Top Traders Unplugged https://t.co/8aNJjhBcTJ
Volume Areas: A structurally sound market will build on areas of high volume (HVNodes). Should the market trend for long periods of time, it will lack sound structure, identified as low volume areas (LVNodes). LVNodes denote directional conviction and ought to offer support on any test.
If participants were to auction and find acceptance into areas of prior low volume (LVNodes), then future discovery ought to be volatile and quick as participants look to HVNodes for favorable entry or exit.
DIX: For every buyer is a seller (usually a market maker). Using DIX — which is derived from short sales (i.e., liquidity provision on the market-making side) — we can measure buying pressure.
Gamma: Gamma is the sensitivity of an option to changes in the underlying price. Dealers that take the other side of options trades hedge their exposure to risk by buying and selling the underlying. When dealers are short-gamma, they hedge by buying into strength and selling into weakness. When dealers are long-gamma, they hedge by selling into strength and buying into weakness. The former exacerbates volatility. The latter calms volatility.
Vanna: The rate at which the delta of an option changes with respect to volatility.
Charm: The rate at which the delta of an option changes with respect to time.
Options: If an option buyer was short (long) stock, he or she would buy a call (put) to hedge upside (downside) exposure. Option buyers can also use options as an efficient way to gain directional exposure.
POCs: POCs are valuable as they denote areas where two-sided trade was most prevalent in a prior day session. Participants will respond to future tests of value as they offer favorable entry and exit.
MCPOCs: POCs are valuable as they denote areas where two-sided trade was most prevalent over numerous day sessions. Participants will respond to future tests of value as they offer favorable entry and exit.
About
After years of self-education, strategy development, mentorship, and trial-and-error, Renato Leonard Capelj began trading full-time and founded Physik Invest to detail his methods, research, and performance in the markets.
Capelj is also a Benzinga finance and technology reporter interviewing the likes of Shark Tank’s Kevin O’Leary, JC2 Ventures’ John Chambers, FTX’s Sam Bankman-Fried, and ARK Invest’s Catherine Wood, as well as a SpotGamma contributor developing insights around impactful options market dynamics.
Disclaimer
Physik Invest does not carry the right to provide advice.
In no way should the materials herein be construed as advice. Derivatives carry a substantial risk of loss. All content is for informational purposes only.
The Daily Brief is a free glimpse into the prevailing fundamental and technical drivers of U.S. equity market products. Join the 200+ that read this report daily, below!
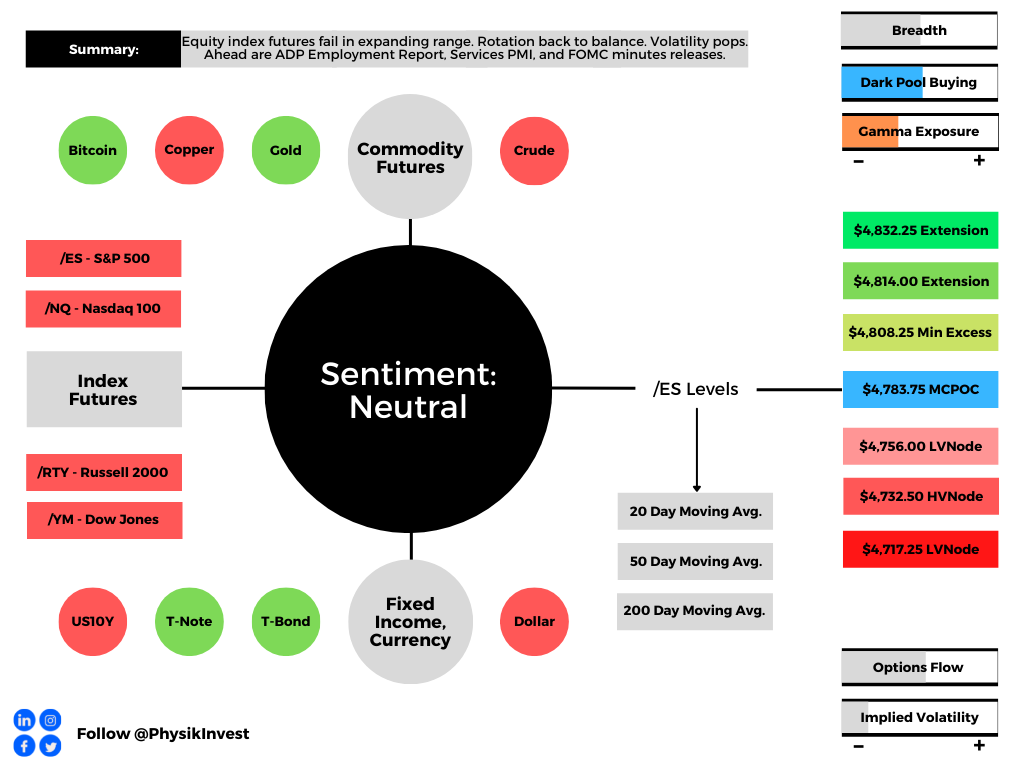
Overnight, equity indices auctioned sideways to lower after a failed balance-area breakout resulted in a rotation back toward the most accepted (or traded at) price levels over two weeks.
Ahead is data on ADP National Employment Report (8:15 AM ET), Markit Services PMI (9:45 AM ET), and FOMC minutes (2:00 PM ET).
Graphic updated 6:30 AM ET. Sentiment Neutral if expected /ES open is inside of the prior day’s range. /ES levels are derived from the profile graphic at the bottom of the following section. Levels may have changed since initially quoted; click here for the latest levels. SqueezeMetrics Dark Pool Index (DIX) and Gamma (GEX) calculations are based on where the prior day’s reading falls with respect to the MAX and MIN of all occurrences available. A higher DIX is bullish. At the same time, the lower the GEX, the more (expected) volatility. Learn the implications of volatility, direction, and moneyness. SHIFT data used for S&P 500 (INDEX: SPX) options activity. Note that options flow is sorted by the call premium spent; if more positive, then more was spent on call options. Breadth reflects a reading of the prior day’s NYSE Advance/Decline indicator. VIX reflects a current reading of the CBOE Volatility Index (INDEX: VIX) from 0-100.
What To Expect
Fundamental: Today, participants ought to get further clarity around the timing of the Federal Reserve’s first interest-rate hike and its taper to the pace of asset buying.
The central bank doubled the pace of tapering in mid-December, setting the stage for rate hikes, later in 2022.
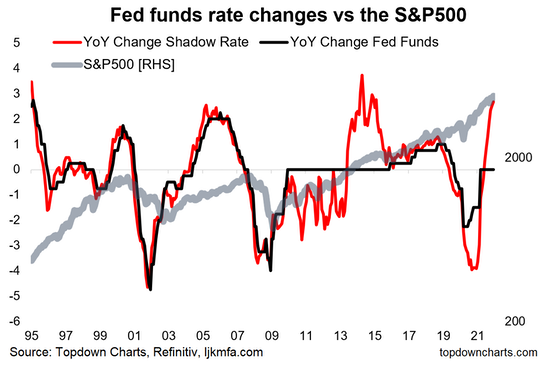
According to Bloomberg, expected are three quarter-percentage-point increases in the key federal funds rate target in 2022.
Graphic: The “annual rate of change in the Fed Funds rate” via topdowncharts.com.
This expectation has coincided with a move higher in Treasury yields and weakness in the growth- and innovation-heavy Nasdaq 100.
Recall that inflation and rates move inverse to each other. In defending against the pressures of inflation, higher rates have the potential to decrease the present value of future earnings making stocks, especially those that are high growth, less attractive.
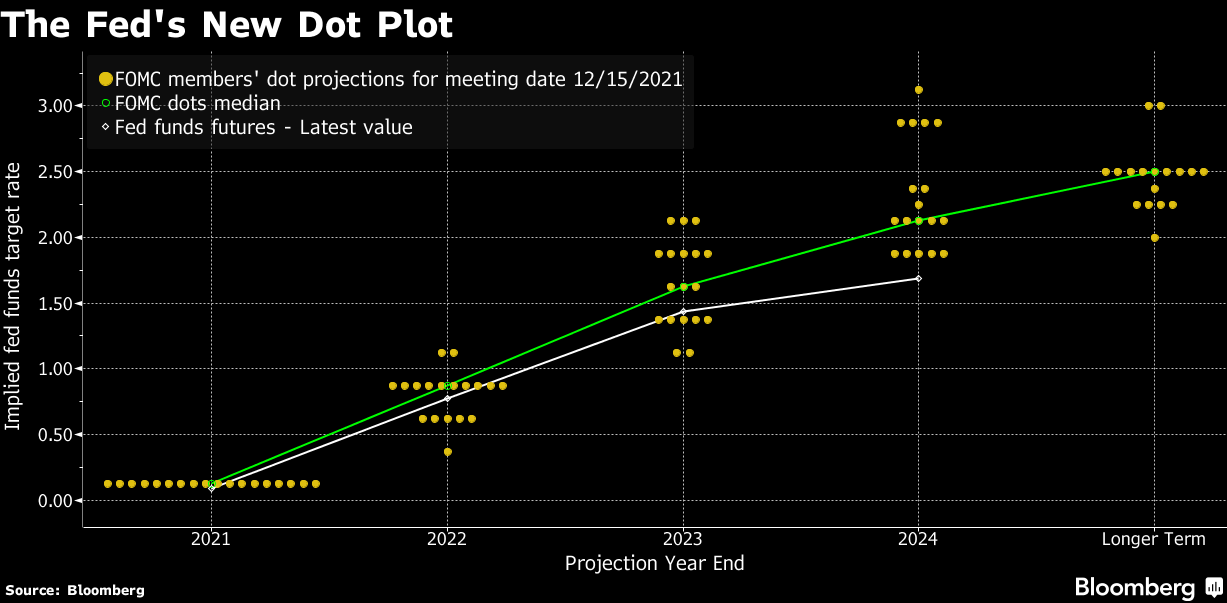
Graphic: Via Bloomberg, “Fed Chair Jerome Powell at his press conference after last month’s meeting said that policy makers eventually ‘expect a gradual pace of policy firming.’ They don’t anticipate raising rates before ending the taper process, but could hike before reaching full employment, he added.”
Moreover, a concern is that “[t]he minutes could hint at a quicker start to shrinking the balance sheet than after the prior tapering.”
With the equity market rallying on the back of easy monetary frameworks and max liquidity, markets diverged from fundamentals.
So all the rally in SPX last year was 'fake', driven by negative real rates and 'liquidity' (QE + ZIRP) – which led to a huge jump in multiples (valuation) – as investors and companies borrowed cheap money to buy (or buyback) stocks in the face of TINA, right?
Reductions in the balance sheet (i.e., removal of liquidity) may help prick the bubble.
Additionally, with the use of leveraged products trending higher than in the past, cross-asset correlations increase with volatility and stress. This may result in “hedging and de-leveraging cascades that affect the stability of all markets,” as well put in one article I recently wrote.
In other words, the response by customers, as well as the dynamics of dealers’ risk exposure to direction and volatility, can cause violent crash dynamics to transpire, further cutting into liquidity, and aiding an unraveling.
“It’s not a coincidence that the mid-February to mid-March 2020 downturn literally started the day after February expiration and ended the day of March quarterly expiration,” Kai Volatility’s Cem Karsan once told me. “These derivatives are incredibly embedded in how the tail reacts and there’s not enough liquidity, given the leverage, if the Fed were to taper.”
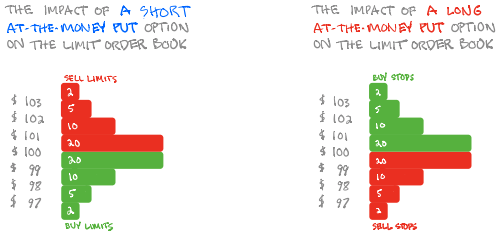
See the graphic below for implications of customers’ demands for downside protection.
Graphic: SqueezeMetrics details the implications of customer activity in the options market, on the underlying’s order book. For instance, in selling a put, customers add liquidity and stabilize the market. How? The market maker long the put will buy (sell) the underlying to neutralize directional risk as price falls (rises).
Positioning: Pursuant to some of the comments made in yesterday’s commentary, expected is a continued compression in volatility.
Monday saw the selling of upside (call) and downside (put) protection. Tuesday saw more of the former, and that promoted some of the reversion, for lack of better phrasing, seen yesterday.
Recall that the participant on the other side of this dominant trade is taking on more exposure to positive delta.
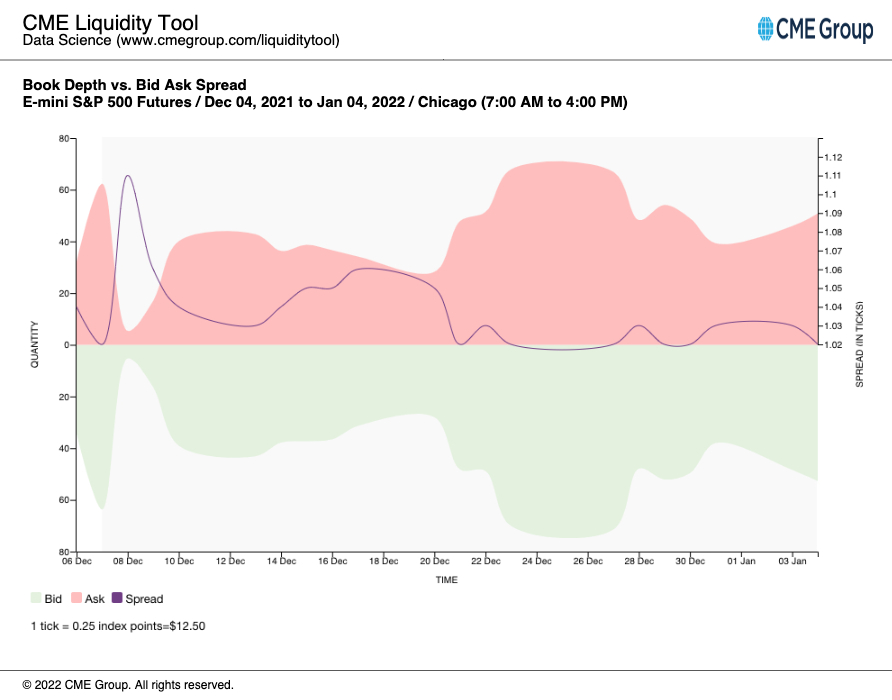
Why? Well, with any price rise, gamma (or how an option’s delta is expected to change given a change in the underlying) is added to the delta. Counterparties are to offset gamma by adding liquidity (as can be approximated with thickening of book depth, below) to the market (i.e., buy dips, sell rips).
Graphic: Analysis of book depth for the E-mini S&P 500 futures contract, via CME Group Inc’s (NASDAQ: CME) Liquidity Tool. For more on the implications of participants’ options positioning and dealer hedging, read here.
The continued compression of volatility will only serve to bolster any price rise as “hedging vanna and charm flows, and whatnot will push the markets higher.”
Were participants to reach for downside protection, markets will tend toward instability. Not seeing this yet.
Graphic: The “Biggest tail risk to SPX isn’t any macro data/virus/war but its own options market.”
Technical: As of 6:40 AM ET, Wednesday’s regular session (9:30 AM – 4:00 PM ET), in the S&P 500, will likely open in the middle part of a negatively skewed overnight inventory, inside of prior-range and -value, suggesting a limited potential for immediate directional opportunity.
Balance (Two-Timeframe Or Bracket) Scenarios: Rotational trade that denotes current prices offer favorable entry and exit. Balance-areas make it easy to spot a change in the market (i.e., the transition from two-time frame trade, or balance, to one-time frame trade, or trend).

Modus operandi is responsive trade (i.e., fade the edges), rather than initiative trade (i.e., play the break).
In the best case, the S&P 500 trades higher; activity above the $4,783.75 micro composite point of control (MCPOC) puts in play the $4,808.25 minimal excess high. Initiative trade beyond the $4,808.25 figure could reach as high as the $4,814.00 and $4,832.25 extension, or higher.
In the worst case, the S&P 500 trades lower; activity below the $4,783.75 MCPOC puts in play the $4,756.00 low volume area (LVNode). Initiative trade beyond the LVNode could reach as low as the $4,732.50 high volume area (HVNode) and $4,717.25 LVNode, or lower.
Considerations: The aforementioned trade in the S&P 500 marks a potential willingness to continue balance, and it is built on poor structure, a dynamic that adds to technical instability.
On a liquidation that finds acceptance (i.e., more than 30-minutes of trade at a particular price level) below $4,756.00, there is increased potential for a fast move lower to $4,732.50 or lower.
This is as there has been a persistence of responses to technical levels; weaker-handed participants (which seldom defend retests) are carrying a heavier hand in recent discovery.
With that, any penetration of low-volume pockets – voids like gaps that can be seen on a chart – there ought to be follow-through as the participants that were most active at those levels run for the exits.
Click here to load today’s key levels into the web-based TradingView charting platform. Note that all levels are derived using the 65-minute timeframe. New links are produced, daily.
Graphic: 65-minute profile chart of the Micro E-mini S&P 500 Futures.
What People Are Saying
Successful traders understand they need to study themselves as much they study markets. Don’t neglect journaling & studying the person who’s clicking the buttons.
Volume Areas: A structurally sound market will build on areas of high volume (HVNodes). Should the market trend for long periods of time, it will lack sound structure, identified as low volume areas (LVNodes). LVNodes denote directional conviction and ought to offer support on any test.
If participants were to auction and find acceptance into areas of prior low volume (LVNodes), then future discovery ought to be volatile and quick as participants look to HVNodes for favorable entry or exit.
Gamma: Gamma is the sensitivity of an option to changes in the underlying price. Dealers that take the other side of options trades hedge their exposure to risk by buying and selling the underlying. When dealers are short-gamma, they hedge by buying into strength and selling into weakness. When dealers are long-gamma, they hedge by selling into strength and buying into weakness. The former exacerbates volatility. The latter calms volatility.
Vanna: The rate at which the delta of an option changes with respect to volatility.
Charm: The rate at which the delta of an option changes with respect to time.
Options: If an option buyer was short (long) stock, he or she would buy a call (put) to hedge upside (downside) exposure. Option buyers can also use options as an efficient way to gain directional exposure.
MCPOCs: POCs are valuable as they denote areas where two-sided trade was most prevalent over numerous day sessions. Participants will respond to future tests of value as they offer favorable entry and exit.
Excess: A proper end to price discovery; the market travels too far while advertising prices. Responsive, other-timeframe (OTF) participants aggressively enter the market, leaving tails or gaps which denote unfair prices.
About
After years of self-education, strategy development, mentorship, and trial-and-error, Renato Leonard Capelj began trading full-time and founded Physik Invest to detail his methods, research, and performance in the markets.
Capelj is also a Benzinga finance and technology reporter interviewing the likes of Shark Tank’s Kevin O’Leary, JC2 Ventures’ John Chambers, FTX’s Sam Bankman-Fried, and ARK Invest’s Catherine Wood, as well as a SpotGamma contributor developing insights around impactful options market dynamics.
Disclaimer
Physik Invest does not carry the right to provide advice.
In no way should the materials herein be construed as advice. Derivatives carry a substantial risk of loss. All content is for informational purposes only.