Big news includes Netflix Inc (NASDAQ: NFLX) beating earnings estimates but having a weaker-than-expected forecast, Tesla Inc (NASDAQ: TSLA) cutting prices the sixth time this year, Meta Platforms Inc (NASDAQ: META) and Walt Disney Co (NYSE: DIS) commencing layoffs, and mortgage rates edging higher to ~6.4%.
Graphic: Retrieved from Bloomberg. “US mortgage rates increased last week by the most in two months to 6.43%, denting already sluggish demand.”
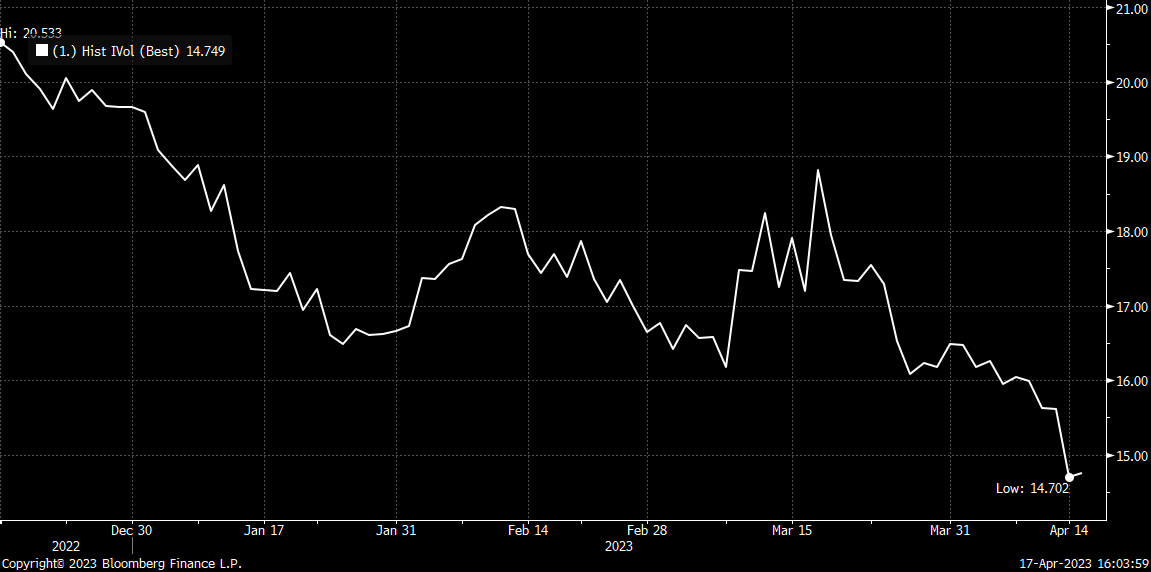
Equity markets are down, and equity implied volatility (IVOL) measures, including the Cboe Volatility Index or VIX, are climbing. Notwithstanding, the trend lower in IVOL is intact, and that’s good for traders biased short volatility.
Graphic: Retrieved from Bloomberg via Danny Kirsch of Piper Sandler Companies (NYSE: PIPR). Call option volatility for the $4,150.00 strike. May monthly expiration.
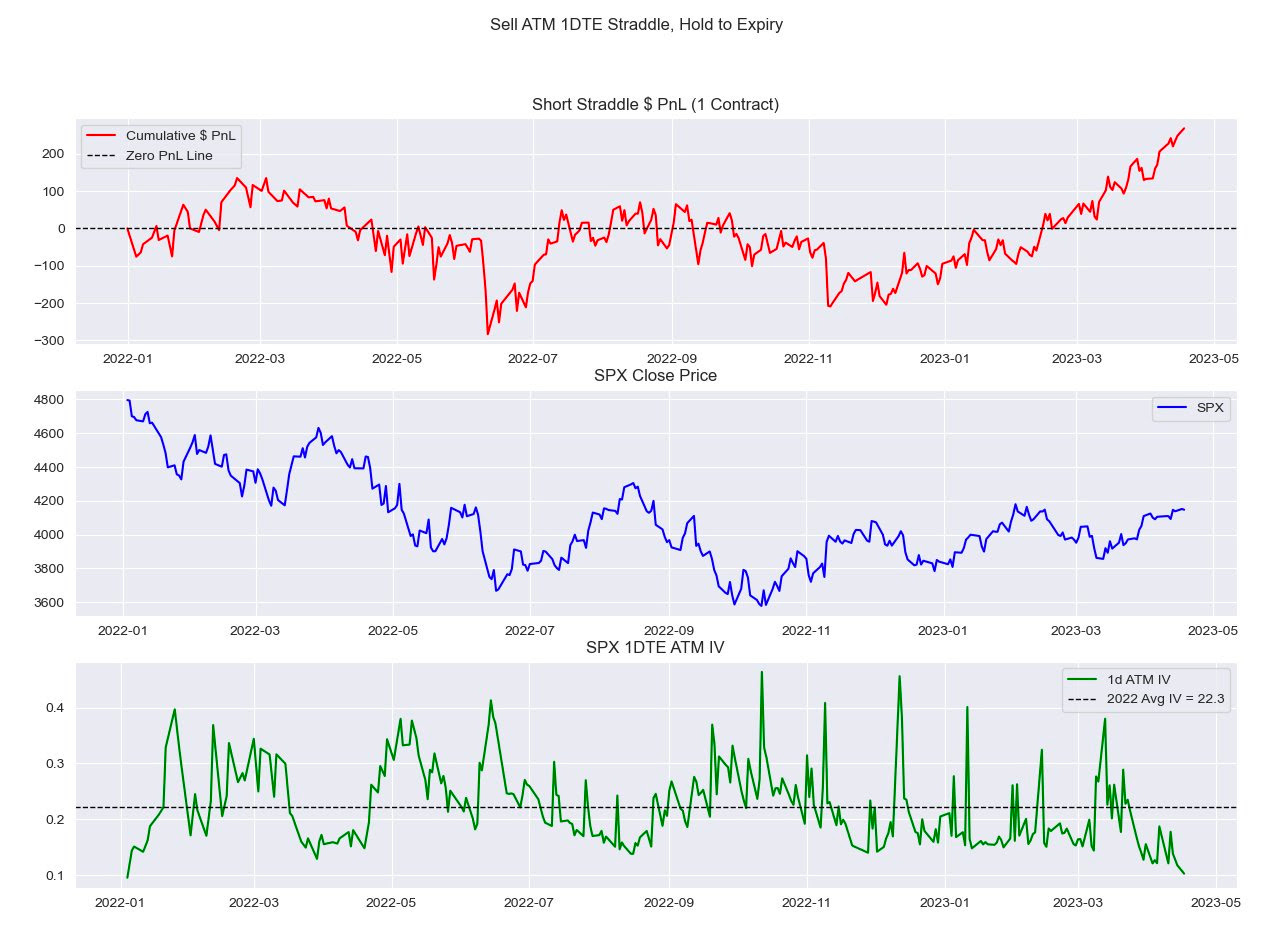
“With all the focus [on S&P 500 (INDEX: SPX)] 0 DTE lately, I look at how expensive these have been since 2022,” IPS Strategic Capital’s Pat Hennessy says, referencing a backtest he conducted selling a 1 DTE straddle and holding till maturity.
“Performance since the November CPI has been stellar, with a 63% win rate and an average gain of $20.00.”
Graphic: Retrieved from IPS Strategic Capital’s Pat Hennessy.
Volatility trader Darrin John agrees, noting volatility remains expensive, a detriment to those who may be biased long volatility.
“The VRP is so wide across all of the tenors I track,” John elaborates. “It’s going to be hard for gamma buyers to cover daily theta bills.”
Clouds are appearing on the horizon, however, and the trend higher (lower) in stocks (volatility) may not last. Bloomberg forecasts the largest fall in SPX earnings since the start of 2020. Notwithstanding, strength can continue for longer …
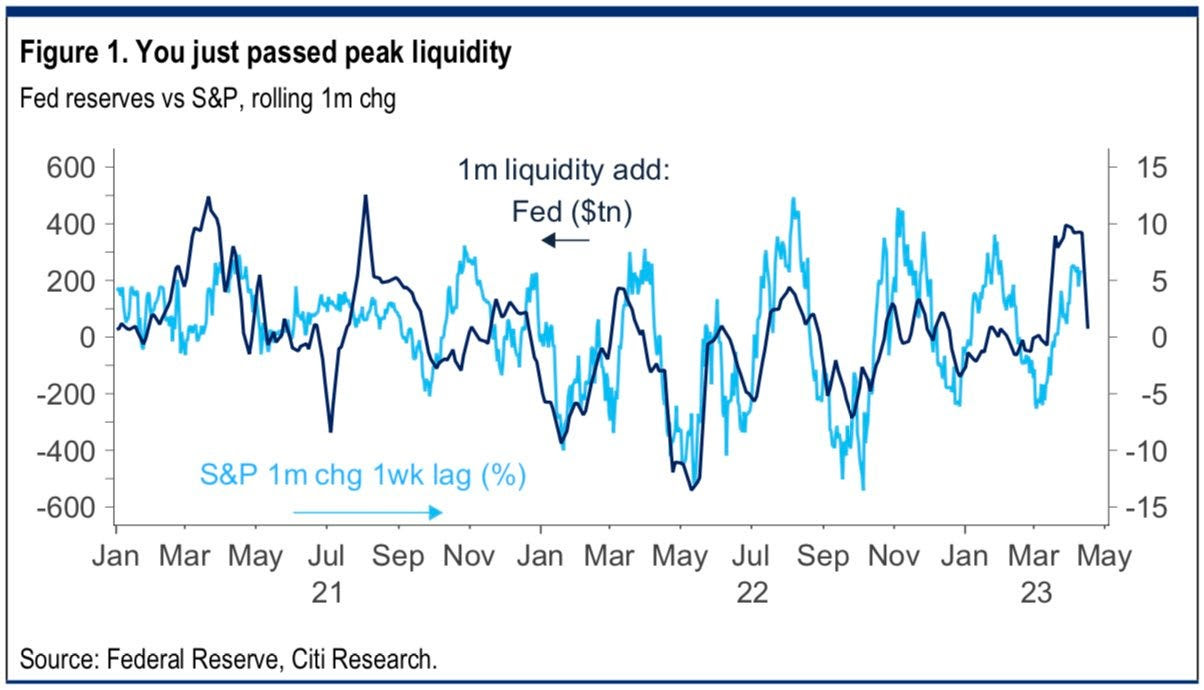
Graphic: Retrieved from Citigroup Inc Research (NYSE: C) via @tr8derz. “YTD rally stems from $1tn in CB liquidity. High-frequency indicators suggest this is already stalling, and coming weeks seem increasingly likely to bring a sharp reversal. Higher TGA and RRP, ECB QT and reduced China easing could easily see a net drain of some $6-800bn.”
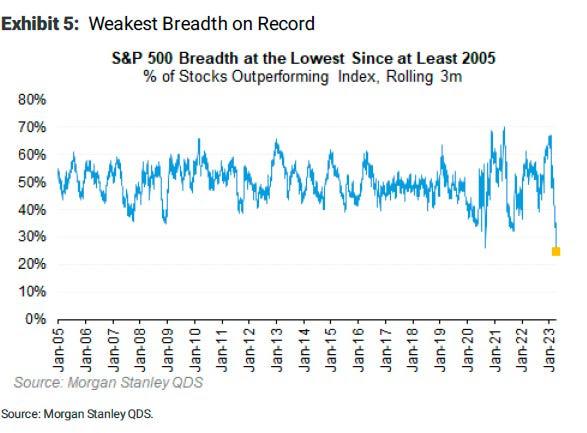
… even with the SPX breadth reading poor. The SPX has rallied with multiples rising; strength came with positive earnings surprises, bond demand, and other things.
Graphic: Retrieved from Morgan Stanley (NYSE: MS) via Bloomberg.
Hence, at the risk of sounding like a broken record, the low-cost call structures we’ve talked about in the past remain attractive.
If markets move higher, you can monetize and roll profits into put spreads (i.e., buy put and sell another at a lower strike). This may work well if JPMorgan Chase & Co’s (NYSE: JPM) call that “even a mild recession would warrant retesting the previous lows” is realized.
Such structures work well as “a big pop in the market can result in a decent drop in the VIX…and vice versa, a market sell-off will result in a greater increase in the VIX now than it did in 2022,” says Alpha Exchange.
Alternatively, lean neutral and buy into cash or bonds yielding 4-5%. Some long box spreads yield 5.4% as of yesterday’s close.
In other news, Physik Invest’s first in-depth note is nearing completion and will be available for public viewing in short order. Take care and watch your risk!
About
Welcome to the Daily Brief by Physik Invest, a soon-to-launch research, consulting, trading, and asset management solutions provider. Learn about our origin story here, and consider subscribing for daily updates on the critical contexts that could lend to future market movement.
Separately, please don’t use this free letter as advice; all content is for informational purposes, and derivatives carry a substantial risk of loss. At this time, Capelj and Physik Invest, non-professional advisors, will never solicit others for capital or collect fees and disbursements. Separately, you may view this letter’s content calendar at this link.
Physik Invest’s Daily Brief is read free by thousands of subscribers. Join this community to learn about the fundamental and technical drivers of markets.
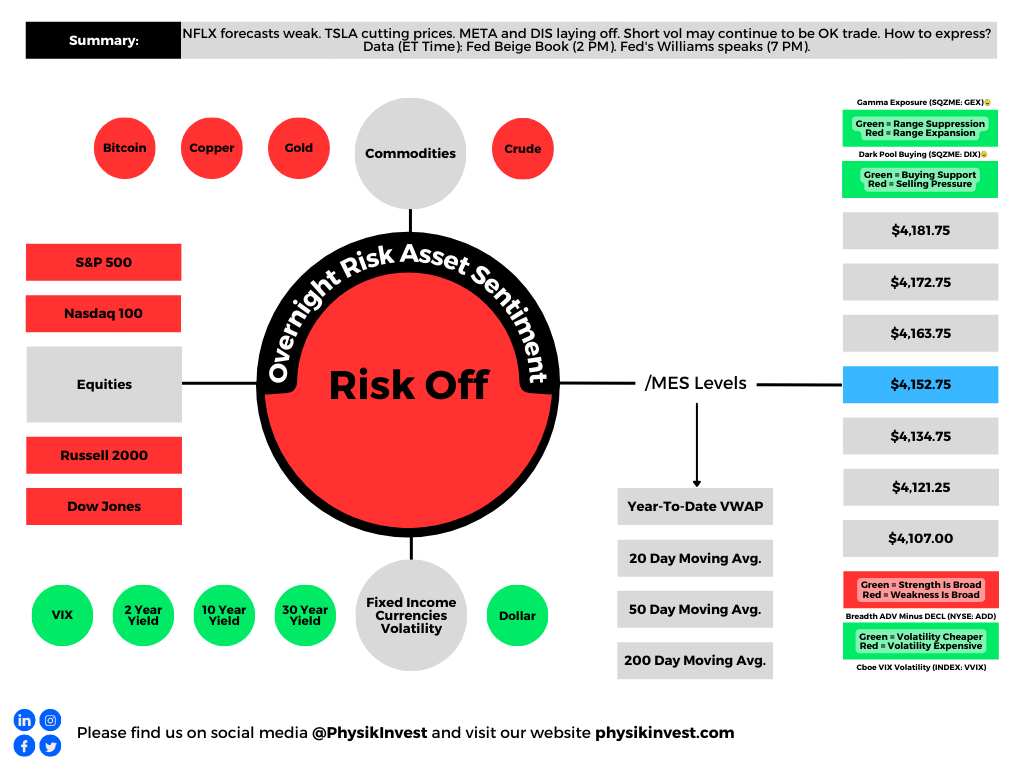
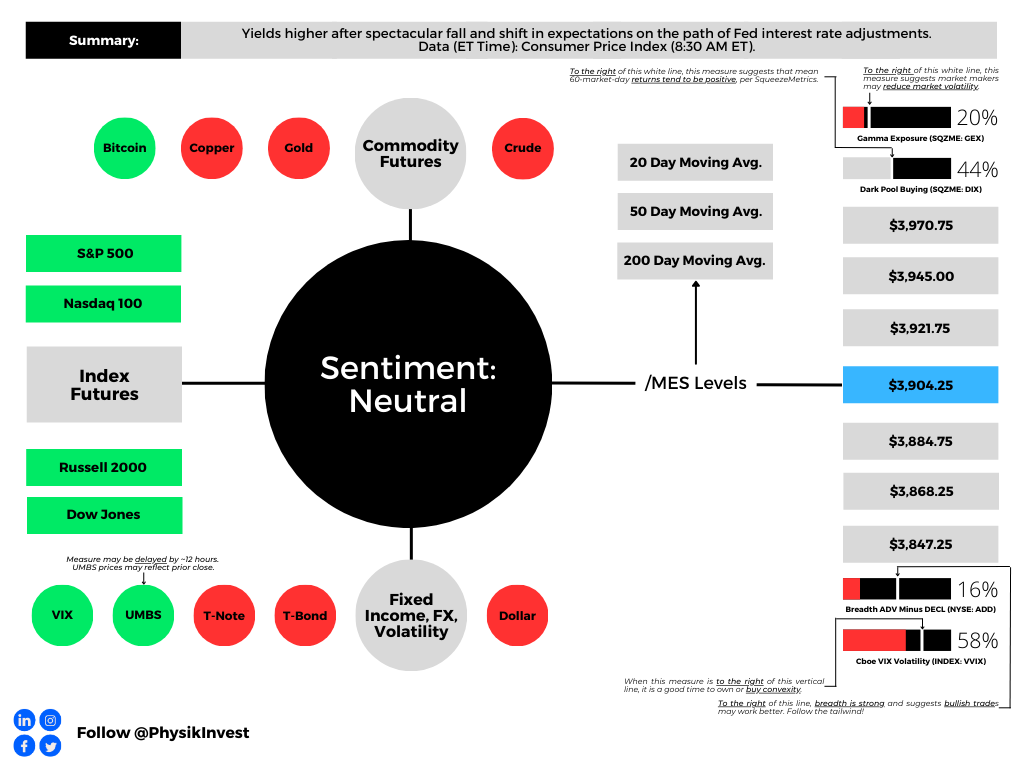
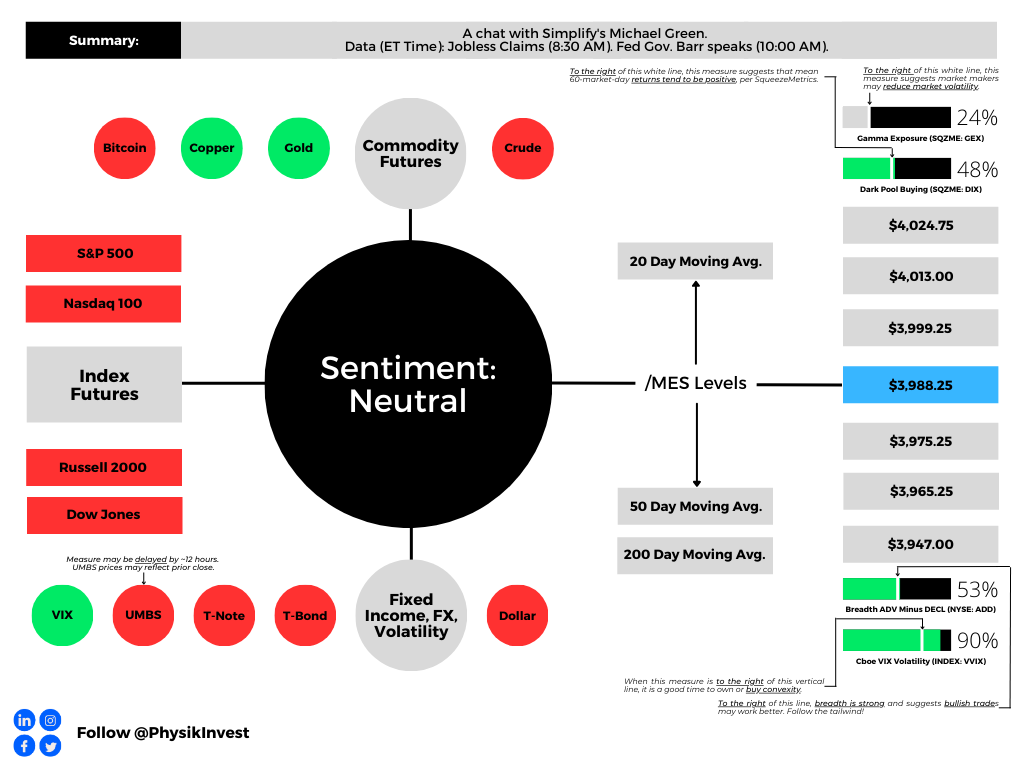
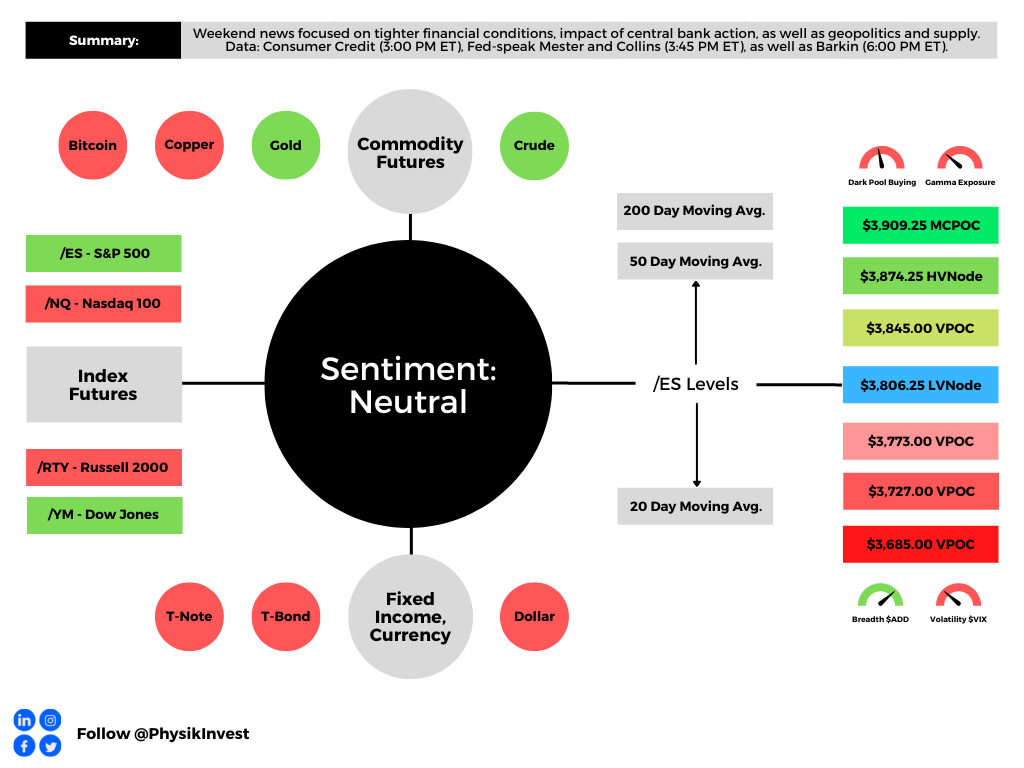
Graphic updated 6:30 AM ET. Sentiment Neutral if expected /MES open is inside of the prior day’s range. /MES levels are derived from the profile graphic at the bottom of this letter. Click here for the latest levels. SqueezeMetrics Dark Pool Index (DIX) and Gamma (GEX) with the latter calculated based on where the prior day’s reading falls with respect to the MAX and MIN of all occurrences available. A higher DIX is bullish. The lower the GEX, the more (expected) volatility. Click to learn the implications of volatility, direction, and moneyness. Breadth reflects a reading of the prior day’s NYSE Advance/Decline indicator. The CBOE VIX Volatility Index (INDEX: VVIX) reflects the attractiveness of owning volatility. UMBS prices via MND. Click here for the economic calendar.
Administrative
A long(er) letter, today. Through the end-of-this week, newsletters may be shorter due to the letter writer’s commitments. Take care!
Fundamental
Yesterday’s letter focused on the SVB Financial Group (NASDAQ: SIVB) failure, albeit with an optimistic tone. In short, the bank could not make good on fast accelerating withdrawals. Read more here.
According to one TechCrunch article, the likes of Founders Fund “reportedly advised their portfolio companies … to withdraw their money, … [and], if everybody is telling each other that SVB is in trouble, that will be a challenge,” as it was.
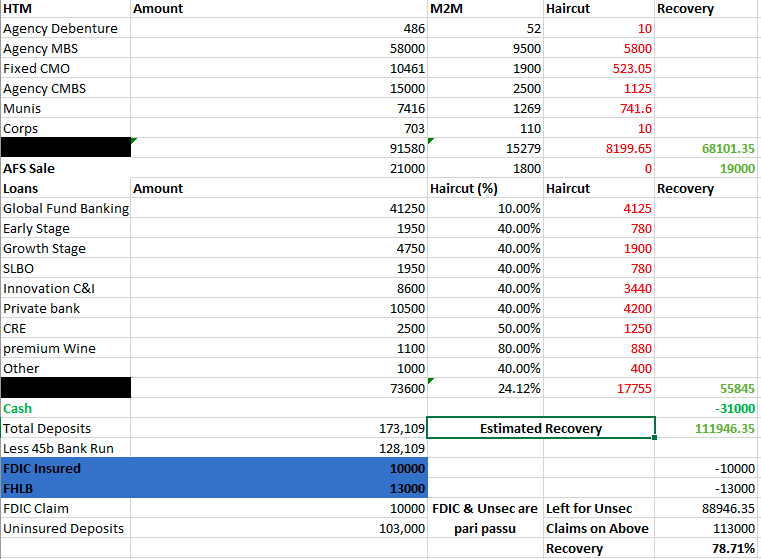
Graphic: Retrieved from @Citrini7. In the worst-case scenario, it was likely that uninsured depositors at SIVB would have received $0.80 on each dollar barring a bailout.
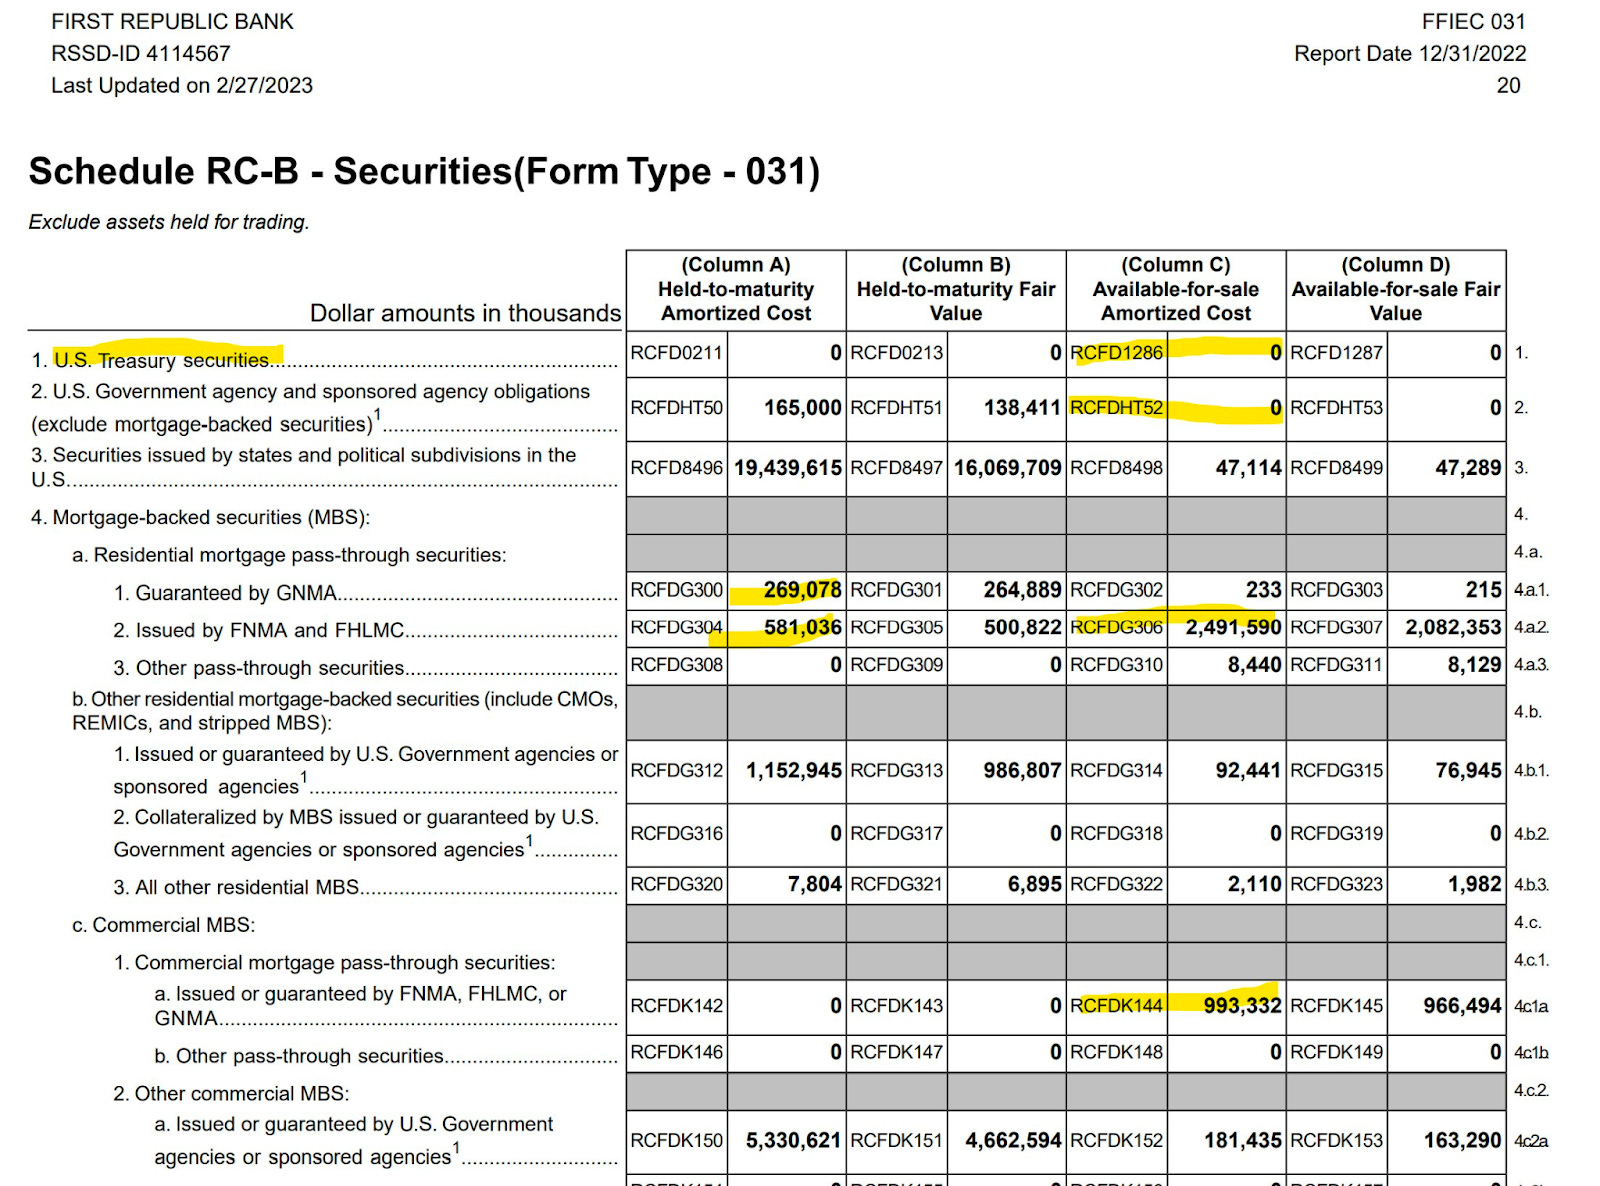
Authorities later put forth emergency measures guaranteeing all deposits. The effort shored up confidence in the banking system and markets strengthened, though some regional names such as First Republic Bank (NYSE: FRC) continued trading weak. In FRC’s case, the Federal Reserve’s (Fed) new bailout facility does not help. As former Fed trader Joseph Wang explains, “you need Treasuries and Agency MBS to tap the facility, and [FRC] barely owns any.”
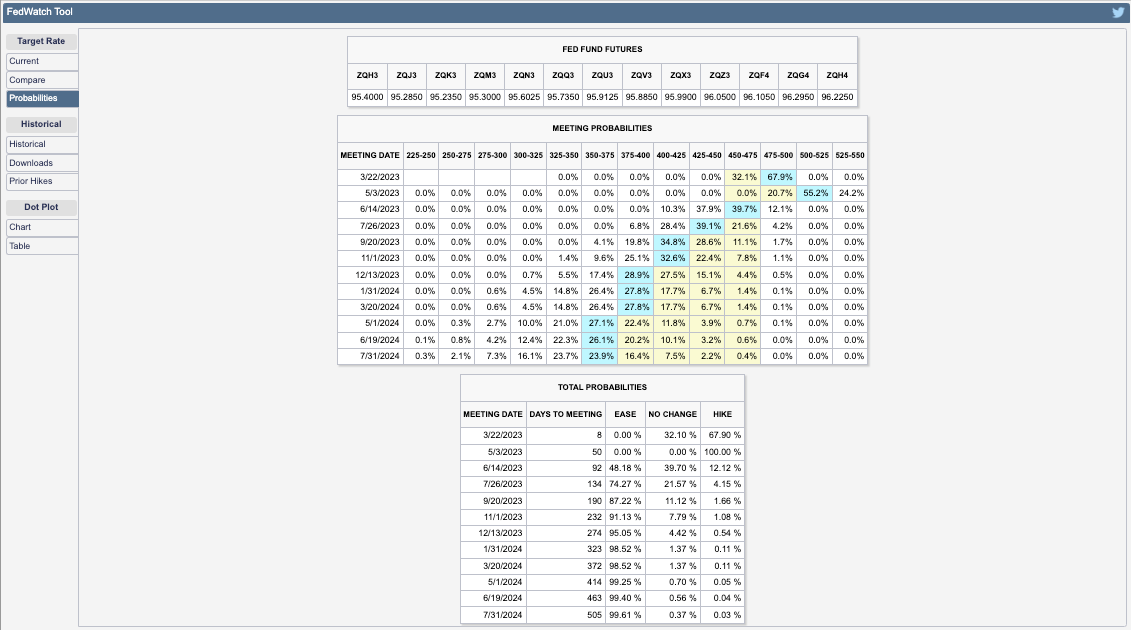
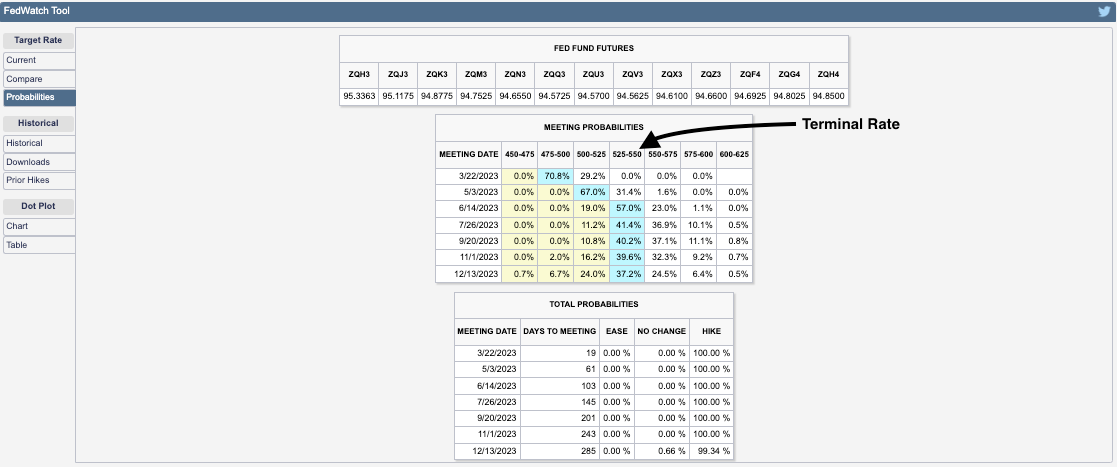
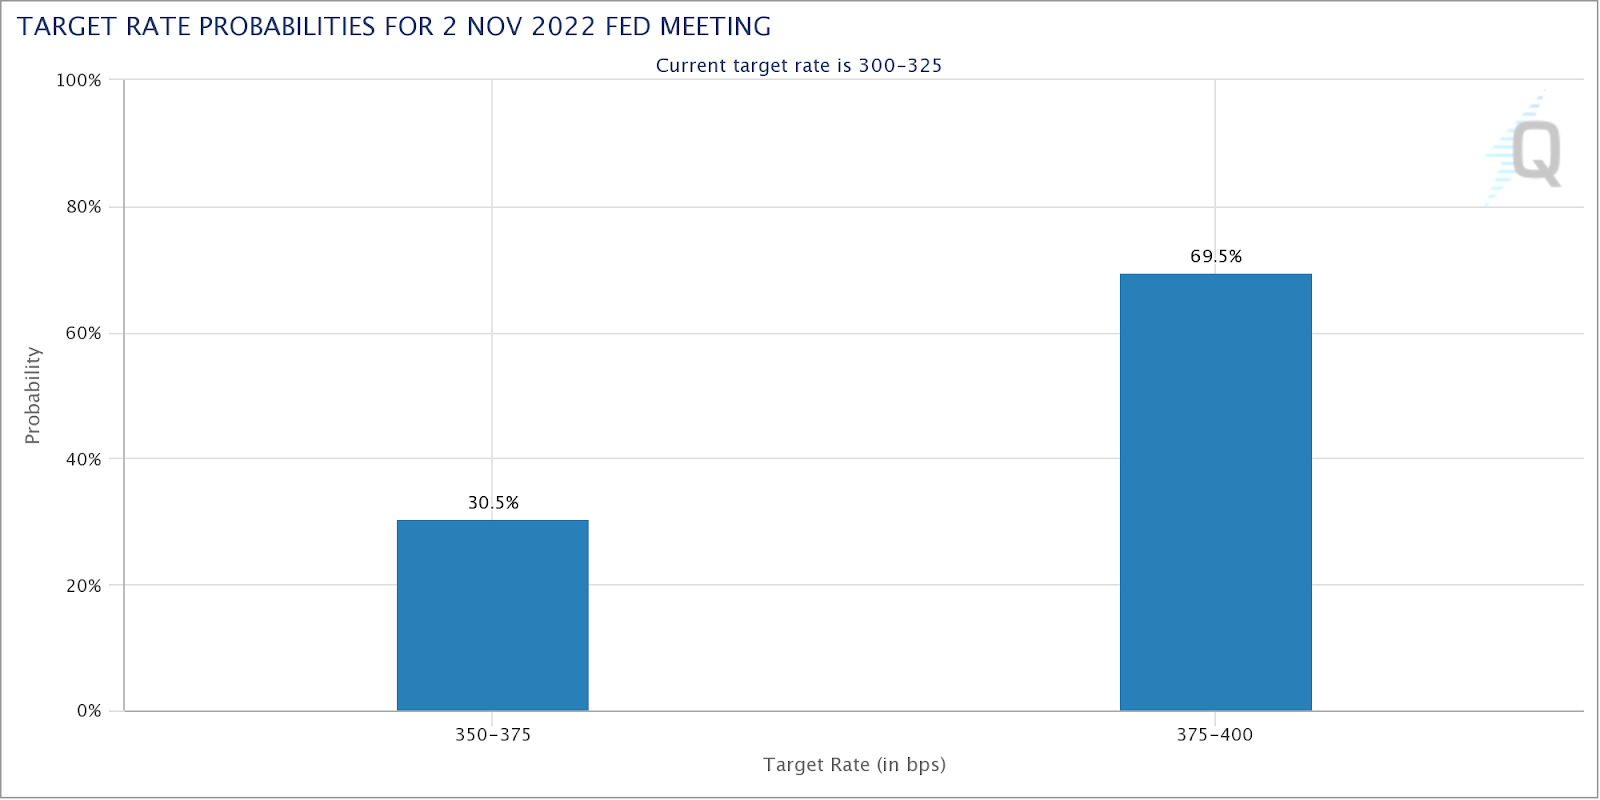
Anyways, as yesterday’s letter briefly mentioned, expectations on the path of Fed Funds shifted. Traders put the terminal/peak rate at 5.00-5.25%, down from 5.50-5.75%, while pricing cuts after spring. Previously, no cuts were expected in 2023.
Graphic: Retrieved from CME Group Inc’s (NASDAQ: CME) FedWatch Tool.
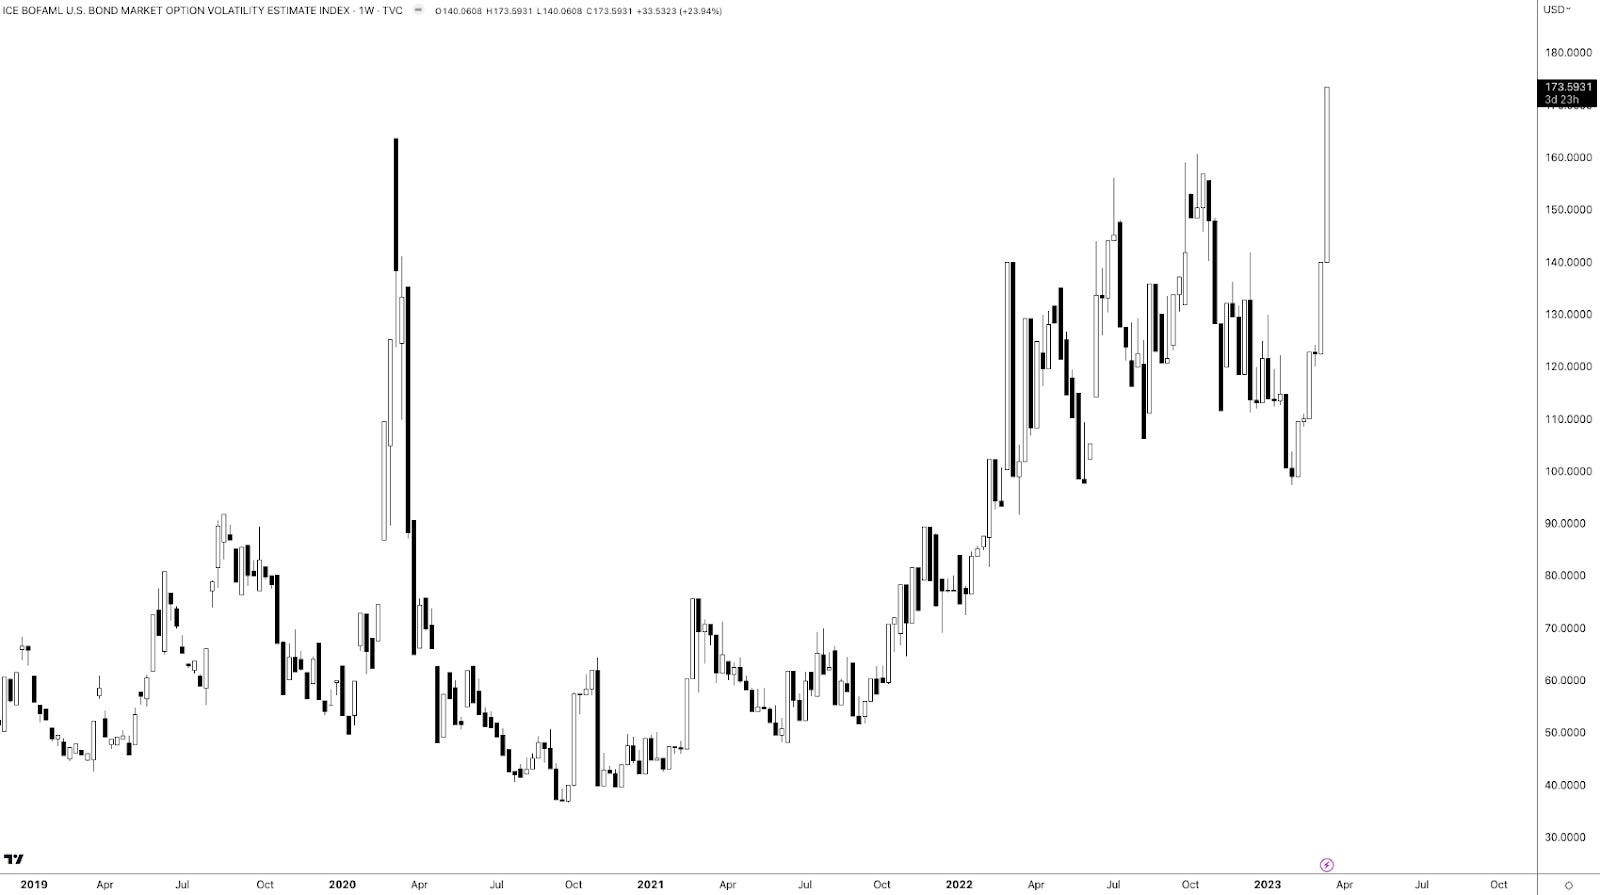
Measures of US Treasury yield volatility implied by options (i.e., bets or hedges on or against market movement) adjusted higher, accordingly. This is often a harbinger of equity market volatility.
Graphic: Merrill Lynch Option Volatility Estimate retrieved from TradingView
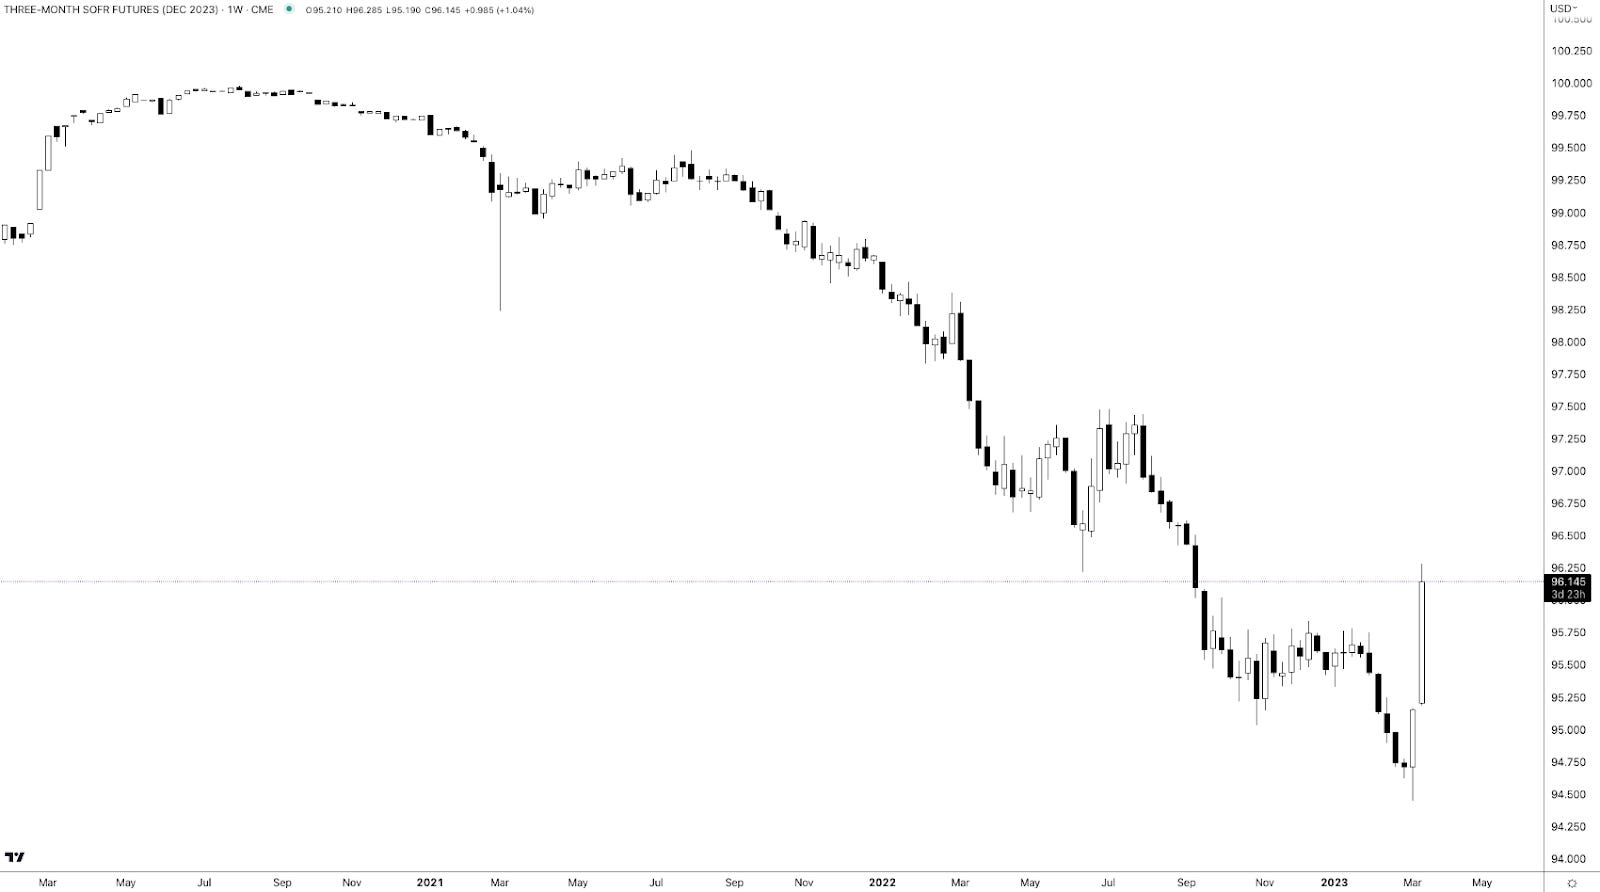
Call options on the three-month Secured Overnight Financing Rate (FUTURE: SOFR) future (i.e., bets on interest rates falling in the future) paid handsomely.
For instance, bull call spreads that expire in December 2023 (e.g., BUY +1 VERTICAL /SR3Z23:XCME 1/2500 DEC 23 /SR3Z23:XCME 96/97 CALL @.0375) increased in value by about 650.00% to $0.33 (i.e., $750.00 per contract).
Graphic: Retrieved via TradingView. Three-month SOFR Future (December 2023). When SOFR is at a lower (higher) number, the market is pricing an increase (decrease) in interest rates. Participants put the December 2023 SOFR rate at 100-96.145 = 3.855%.
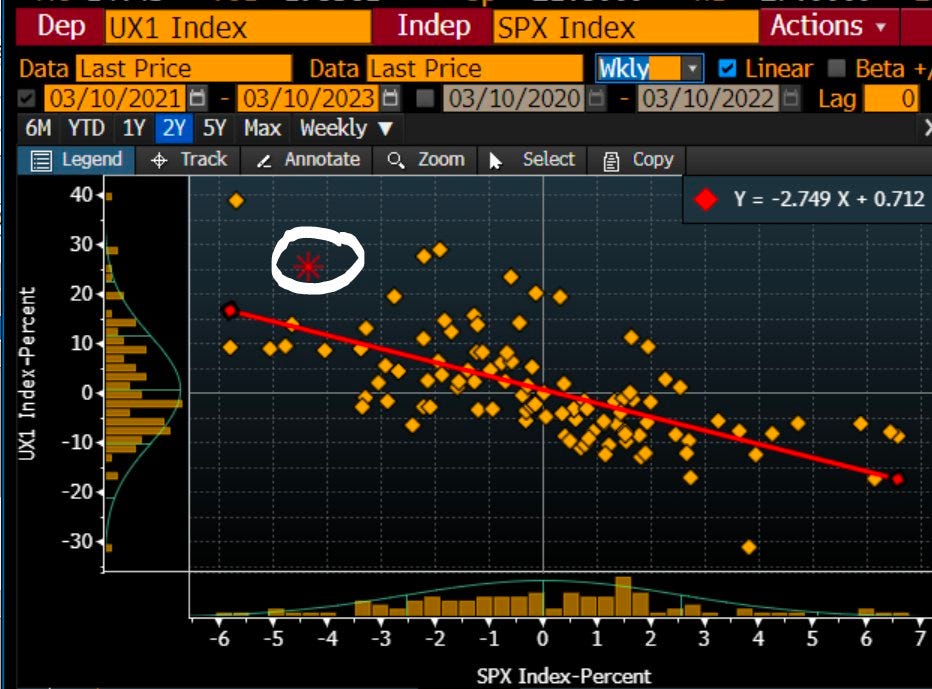
In the equity space, some readers may have caught some commentary on spot-vol beta in the VIX complex strengthening like we have not seen in a while, a nod to the harbinger of equity market volatility remark a few paragraphs higher.
Recommended Readings:
Read: The Ambrus Group’s Kris Sidial on two major risks investors should watch out for in 2023. In short, volatility’s sensitivity to underlying prices (spot-vol beta) was low, and Sidial cast blame, in part, on commodity trading advisors and strong volatility supply.
Read: Simplify Asset Management’s Michael Green on using option and bond overlays to hedge big uncertainties facing markets. Following 2022, investors swapped poor-performing long-dated volatility exposures for ones with bounded risk and less time to expiry, hence the increase in 0 DTE trading.
Graphic: Retrieved from Piper Sandler’s (NYSE: PIPR) Danny Kirsch.
This spot-vol beta remark suggests that (at least some of) the volatility in rates, as well as certain small pockets of the equity and crypto market, manifested demand for crash protection in the S&P 500, “which feeds back into VIX,” one explanation put well.
Graphic: Retrieved from Piper Sandler’s (NYSE: PIPR) Danny Kirsch. “[Last] week finally got a bit of explosiveness in VIX as fixed strike volatility got bid. This is VIX generic front month future and move in SPX. Last time it really “paid” to have VIX upside was Jan of 2022 (point in upper left corner).”
Notwithstanding, for these options to keep their value and continue to perform well, realized volatility (RVOL) must pick up substantially, which is not likely.
Unlimited’s Bob Elliott comments: “the bond market is pricing a broad-based credit crunch, … [and though] it’s not crazy for the Fed to slow down here given the current uncertainty,” odds are financial problems are contained and the Fed moves forward with its mission to get (and keep) inflation down.
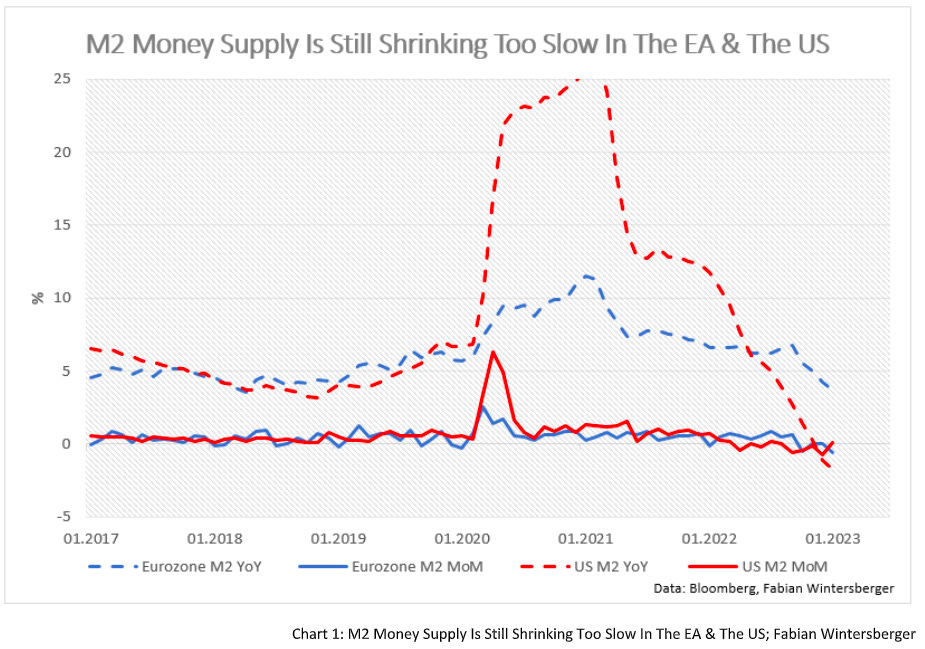
Graphic: Retrieved from Fabian Wintersberger. Just as the “monetary expansion supported the rise in equity and bond prices in January.”
Consequently, “the pricing of Dec23s and 5yr BEIs makes no sense,” Elliott adds. This means the example SOFR trade above is/was ripe for some monetization, and equity volatility must be dealt with carefully (i.e., price movements must be higher than they are now which would be difficult given that authorities/Fed do not want liquidations).
In support of siding with the less extreme take, we paraphrase Kai Volatility’s Cem Karsan who says that for years prior to the 2007-2008 turmoil, macro tourists were calling for a crash.
For markets to crumble, there would have to be an exogenous event far greater in implications than what just transpired with SIVB over the weekend. With odds that such turmoil doesn’t happen soon, coupled with participants easing up on their long-equity exposure (i.e., selling stock and not needing to hedge, hence the statement that owning equity volatility must be dealt with carefully), RVOL is likely to stay contained. That’s not to say that this volatility observed in the rates market can’t persist. It’s also not to say that markets can’t continue to trade lower (in fact, with interest rates rising and processes like quantitative tightening challenging bank liquidity, there is less incentive for investors to reside in lower-yielding equities). It just means that, barring some exogenous event, the market remains intact.
Graphic: Retrieved from Jack Farley. “Silicon Valley Bank owns >$80 Billion of Mortgage-Backed Securities (MBS), a market that is ‘more prone to bouts of volatility’ because ‘small investors & leveraged funds have become the main buyers’ as the Fed & banks step away from market, according to Dec 2022 BIS report.”
Positioning
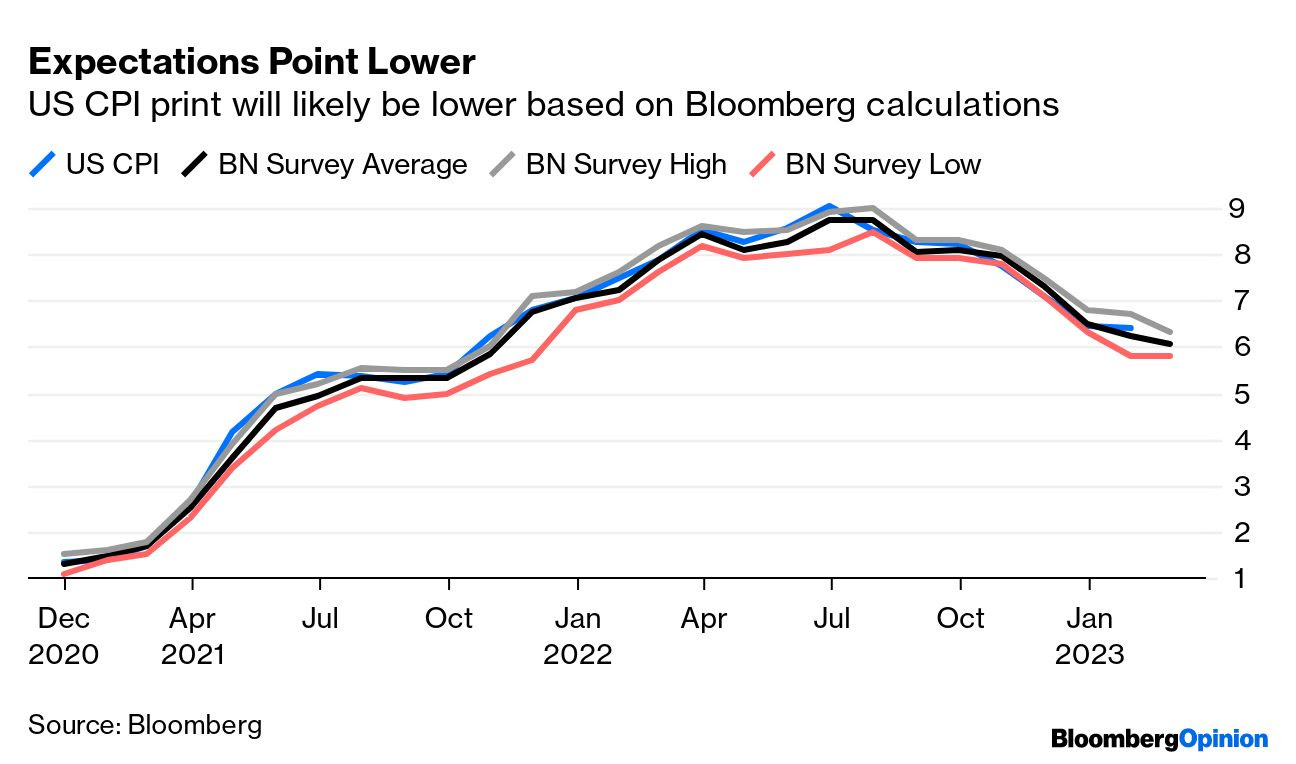
Following important events like the release of the Consumer Price Index (CPI) today, the compression of implied volatility or IVOL, coupled with the nearing of big options expirations (OpEx), sets the market up for potential short bursts of strength heading into the end of the month and next month.
Graphic: Retrieved from Bloomberg. Inflation has been well within forecasts.
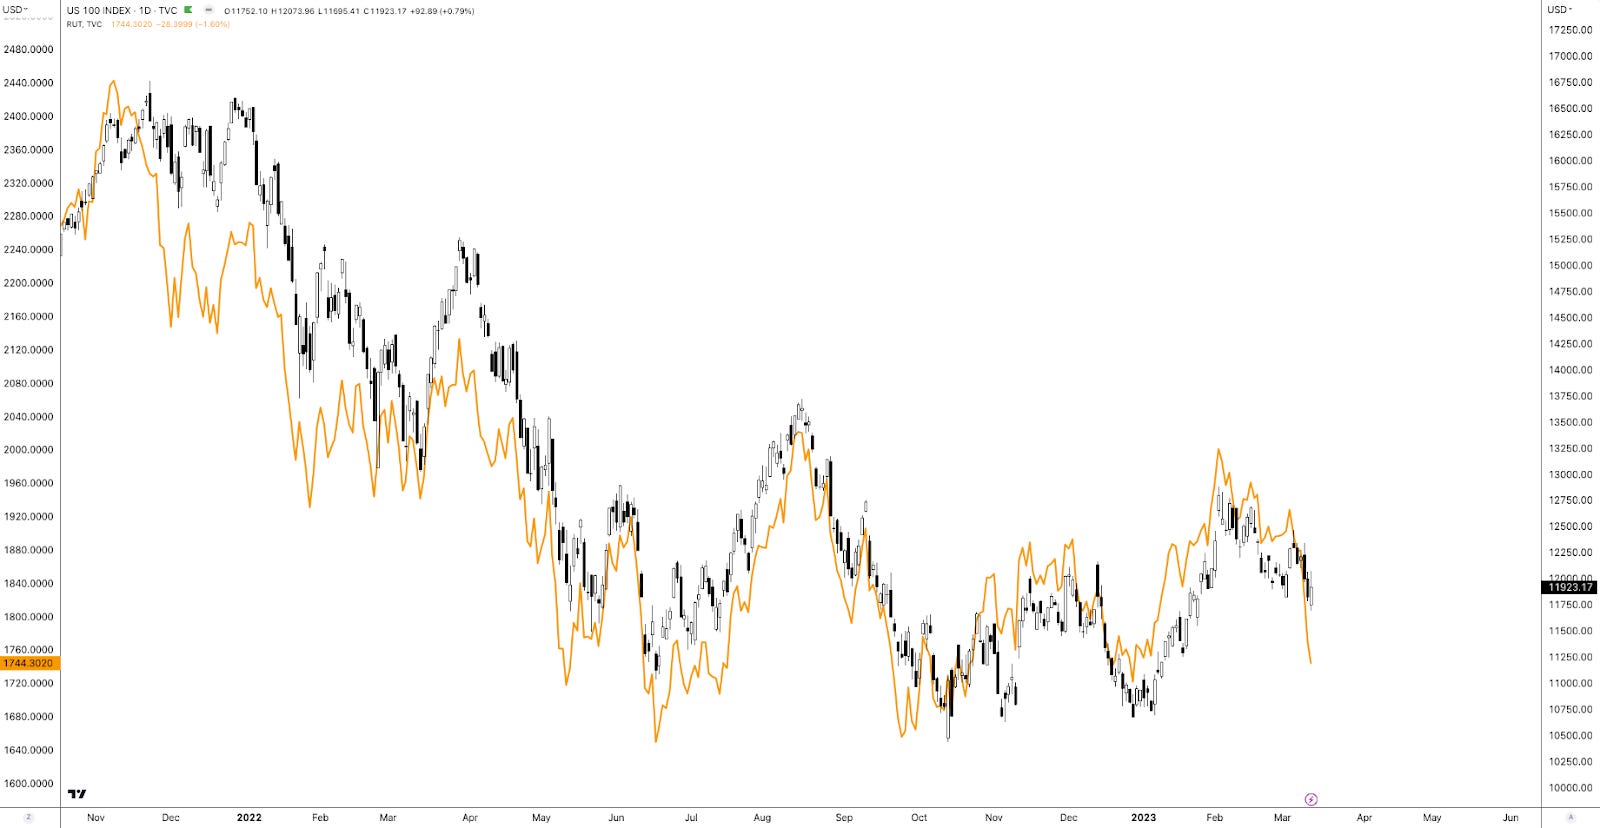
A quick comparison of the Russell 2000 (INDEX: RUT) and Nasdaq 100 (INDEX: NDX) suggests this options-induced strength may help keep the recent re-grossing theme intact. The compression of wound IVOL and passage of OpEx, coupled with the still-live re-grossing theme, may put a floor under equities.
Graphic: Retrieved from TradingView. Orange = RUT. Candles = NDX. Note the weakness in RUT. Note the strength of the Nasdaq relative to the Russell.
To play, one could place a portion of their cash in money market funds or T-bill ETFs or box spreads, for instance, while allocating another portion to leverage potential by way of some call options structures that use one or more short options to help bring down the cost of a long option that is closer to current market prices (e.g., a bull call spread or short ratio call spread). To note, based on options prices as of this writing, it may be too early to enter call structures (i.e., too expensive given the context).
DEFINED OUTCOME INVESTING
-Worried about the prospects of the 60/40 portfolio? -Looking for a strategy that takes advantage of higher interest rates? -Tired of market timing?
A 🧵on how to use exchange-traded options + U.S. Treasurys to define your risk today, for tomorrow.
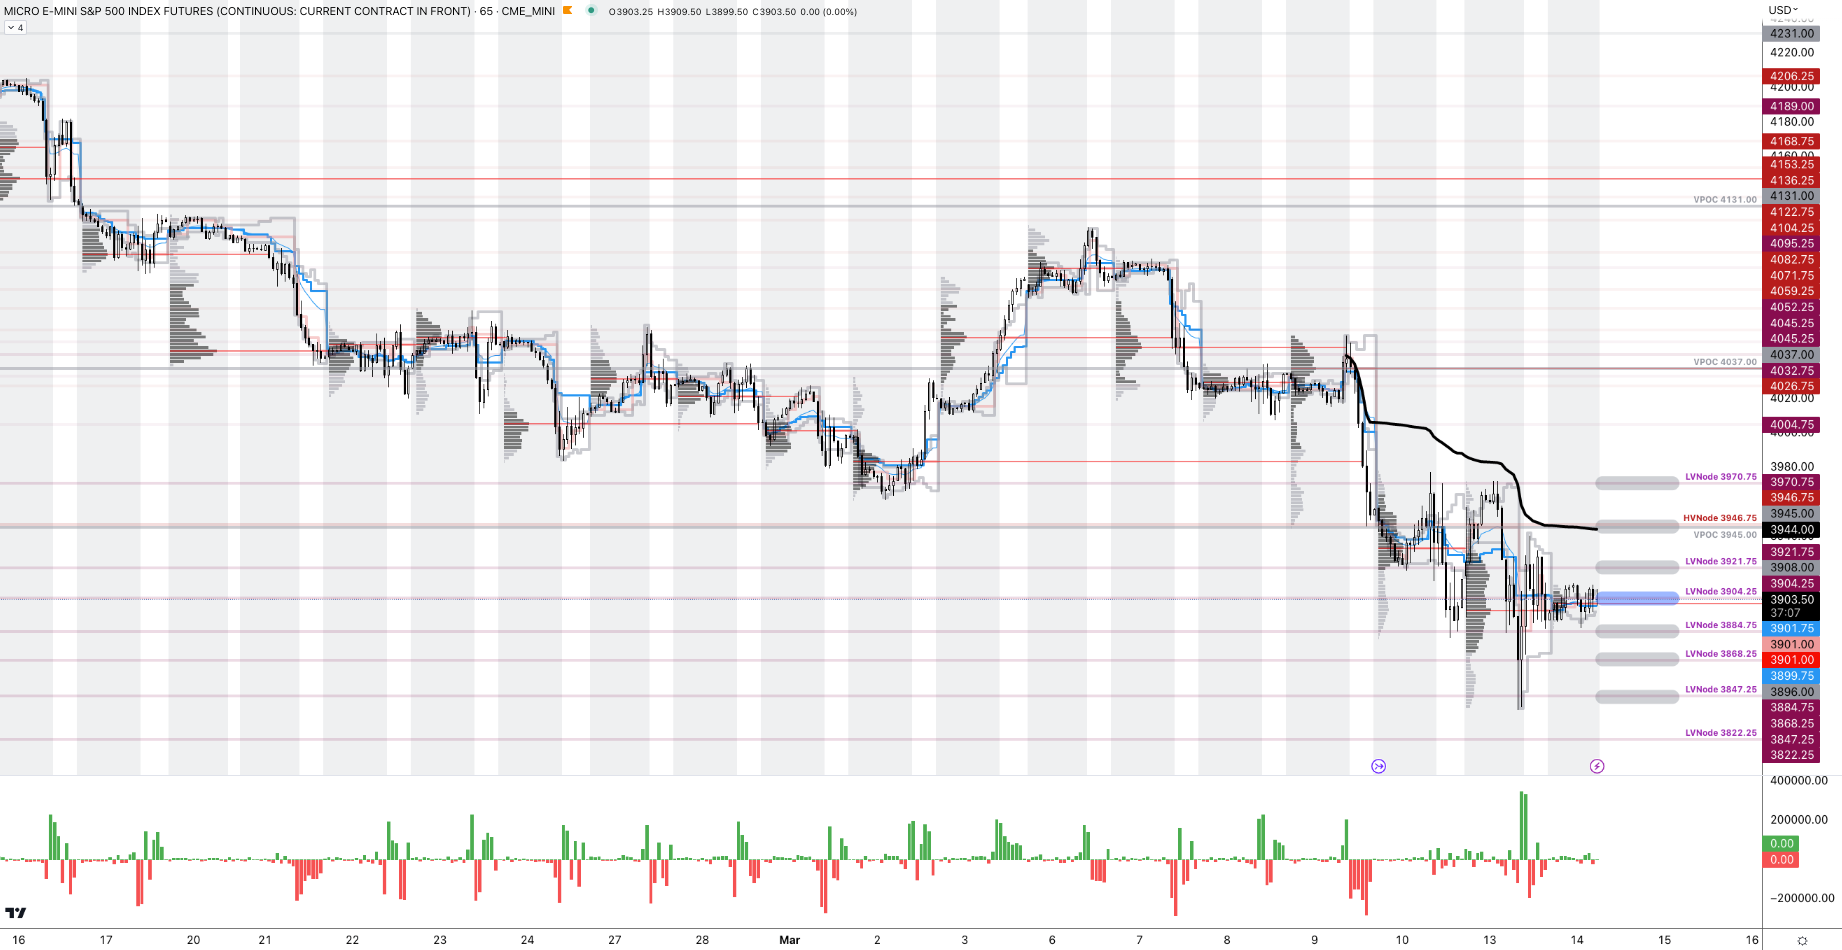
As of 6:30 AM ET, Tuesday’s regular session (9:30 AM – 4:00 PM ET), in the S&P 500, is likely to open in the middle part of a balanced overnight inventory, inside of the prior day’s range, suggesting a limited potential for immediate directional opportunity.
The S&P 500 pivot for today is $3,904.25.
Key levels to the upside include $3,921.75, $3,945.00, and $3,970.75.
Key levels to the downside include $3,884.75, $3,868.25, and $3,847.25.
Disclaimer: Click here to load the updated key levels via the web-based TradingView platform. New links are produced daily. Quoted levels likely hold barring an exogenous development.
Graphic: 65-minute profile chart of the Micro E-mini S&P 500 Futures.
Definitions
Volume Areas: Markets will build on areas of high-volume (HVNodes). Should the market trend for a period of time, this will be identified by a low-volume area (LVNodes). The LVNodes denote directional conviction and ought to offer support on any test.
If participants auction and find acceptance in an area of a prior LVNode, then future discovery ought to be volatile and quick as participants look to the nearest HVNodes for more favorable entry or exit.
POCs: Areas where two-sided trade was most prevalent in a prior day session. Participants will respond to future tests of value as they offer favorable entry and exit.
Volume-Weighted Average Prices (VWAPs): A metric highly regarded by chief investment officers, among other participants, for quality of trade. Additionally, liquidity algorithms are benchmarked and programmed to buy and sell around VWAPs.
About
The author, Renato Leonard Capelj, spends the bulk of his time at Physik Invest, an entity through which he invests and publishes free daily analyses to thousands of subscribers. The analyses offer him and his subscribers a way to stay on the right side of the market.
You may view this letter’s content calendar at this link.
Disclaimer
Do not construe this newsletter as advice. All content is for informational purposes. Capelj and Physik Invest manage their own capital and will not solicit others for it.
Physik Invest’s Daily Brief is read free by thousands of subscribers. Join this community to learn about the fundamental and technical drivers of markets.
Graphic updated 8:30 AM ET. Sentiment Neutral if expected /MES open is inside of the prior day’s range. /MES levels are derived from the profile graphic at the bottom of this letter. Click here for the latest levels. SqueezeMetrics Dark Pool Index (DIX) and Gamma (GEX) with the latter calculated based on where the prior day’s reading falls with respect to the MAX and MIN of all occurrences available. A higher DIX is bullish. The lower the GEX, the more (expected) volatility. Click to learn the implications of volatility, direction, and moneyness. Breadth reflects a reading of the prior day’s NYSE Advance/Decline indicator. The CBOE VIX Volatility Index (INDEX: VVIX) reflects the attractiveness of owning volatility. UMBS prices via MND. Click here for the economic calendar.
Fundamental
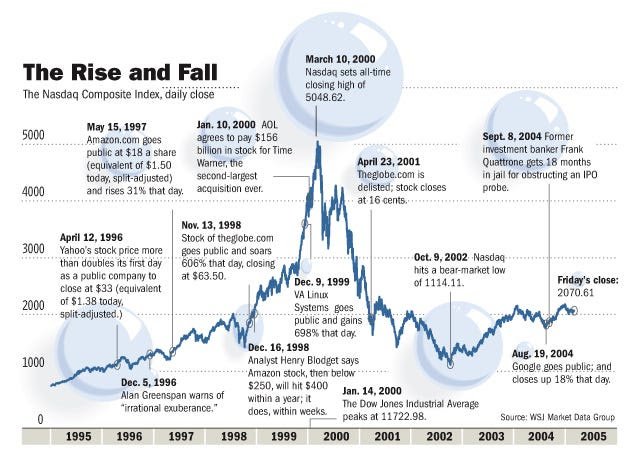
Last year, Simplify Asset Management’s Michael Green, an active manager focused on creating portfolios mimicking traditional constructions like 60/40, albeit with less realized volatility (RVOL), thought a dot-com-type collapse was unfolding under the surface of the indexes.
In an interview for an upcoming Benzinga article, Green explained to your letter writer that he maintains today’s action is similar to the early 2000s.
Prior to 1999, “many of the early winners in the dot-com cycle had already started to falter and, as we came into the market peak for the Nasdaq (INDEX: NDX) in March of 2000, the Nasdaq was much higher and the market was much more narrow,” Green says. “This is 2021 into 2022.” Green adds that the S&P 500 (INDEX: SPX) correction didn’t begin until late-2000, and the homebuilder- and energy-type stocks were the ones that outperformed, as we saw in 2022.
Ultimately, a recession hit in 2001, and credit deteriorated, Green explains, revealing fraud among many high-flyers of the dot-com boom. Many were unprepared, Green adds, drawing parallels to 2022 events concerning the likes of FTX.
Graphic: Retrieved from WSJ Market Data Group.
In 2023 and beyond, Green thinks the economy and markets are set for a bumpy ride. He projects that rising interest rates cause pain for businesses that received a stay of execution in 2020 through PPP loans and subsidized borrowing.
“Many of them put in two- or three-year paper as a stopgap,” he explains. Now, due to the higher rate environment, “companies can’t refinance, so we’re seeing Blackstone Inc (NYSE: BX) and Brookfield Corp (NYSE: BN) hand in keys.”
As put in yesterday’s letter, the deterioration in markets has, in part, been “offset by a lack of inventory,” as well as the hesitancy to sell (i.e., lack of supply). However, the marginal impact of one new person “in distress … [may] set a new clearing price” that changes valuations for everybody. Green says that investors know supply will cause markets to weaken, and that is why products like Bitcoin (CRYPTO: BTC) are intact.
“If we tie up stuff in bankruptcy courts for the next three or four years, nothing will get done,” Green elaborates. “That’s part of what we’re seeing in the crypto space where part of the strength for Bitcoin is simply the absence of sellers as we navigate our way through bankruptcy on many of these entities.”
As an example, Voyager Digital Ltd (ex-OTC: VYGVF) claimants “desperately [sought] to submit a bid to prevent Bitcoin from having to be sold” because these sales would pressure prices and “increase the damage across the entire crypto universe.”
Graphic: Retrieved from Bank of America (NYSE: BAC) via Bloomberg.
Green went on to add his firm objection to Federal Reserve’s (Fed) policy choices noting that deterioration is threatening the “commercial real estate bubble … and residential real estate” currently afloat on a “lack of inventory.”
The “multiplier effect” will be a serious challenge for markets; monetary policy drives fiscal policy and this has an impact elsewhere on geopolitics, manufacturing, and so on (e.g., the cost of interest rates offset by credits to households, the relocation and addition of manufacturing at home and outside of China), which only serves to boost inflation over the short term and further complicate things for the Fed.
Positioning
With data very unreliable and markets fearful of a 2020-like decline, 2022 was a far more orderly year than expected.
“I think people were extremely well-hedged,” he explains. “There was a tremendous amount of exposure that had been purchased for deep out-of-the-money, relatively long-dated [put options], and that created conditions under which the volatility surface, beyond six months, was extremely elevated heading into 2022.”
Green says one-year variance swaps and implied volatility (IVOL) on at-the-money S&P 500 puts was “in the neighborhood of 25-30%, … which is very expensive … [and this] implies a level of daily price movement that is difficult to achieve.”
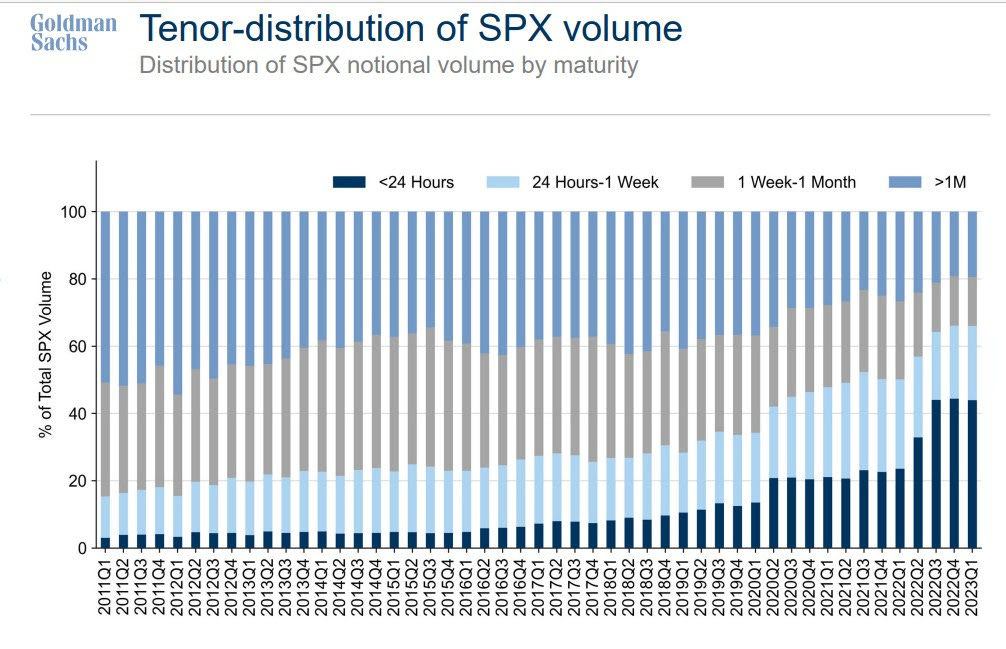
Consequently, investors’ hedges did not work. Green adds that “having learned their lesson from 2022, people have by and large abandoned those types of hedges and have instead moved, even as skew moves to near-record cheapness, … to spreads” and shorter-dated options (e.g., 0 DTE).
Graphic: Retrieved from Goldman Sachs Group Inc (NYSE: GS) via Bloomberg.
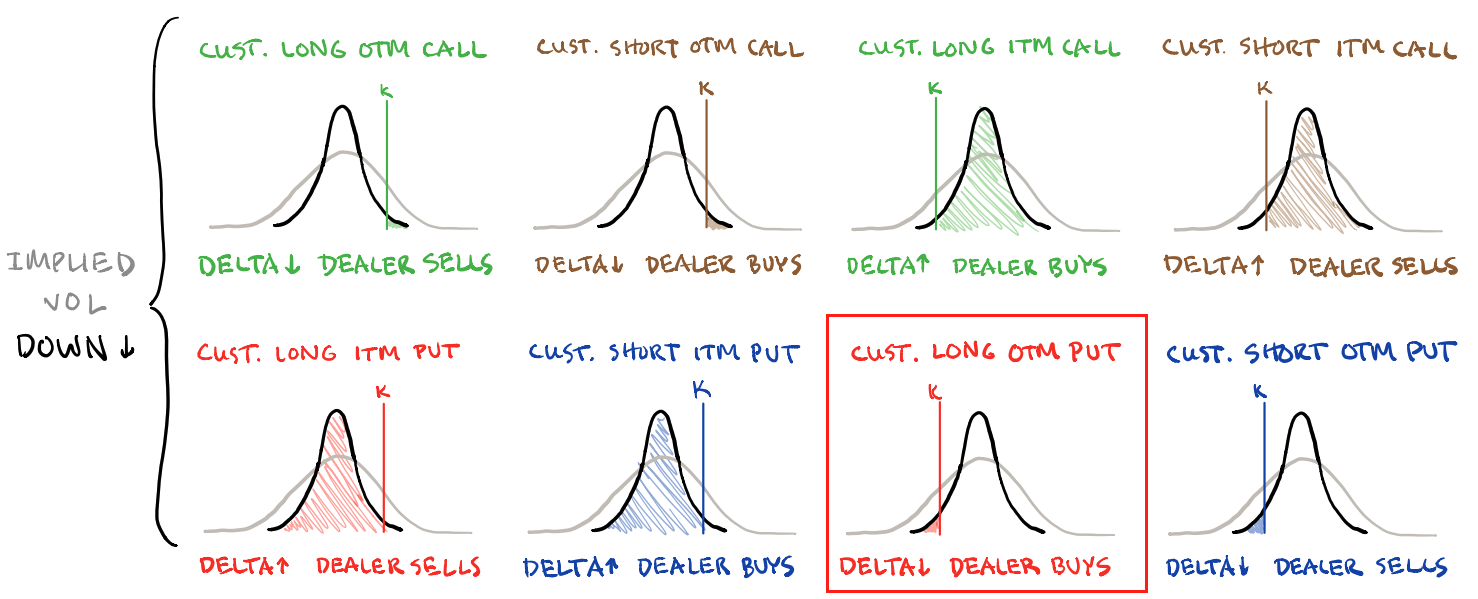
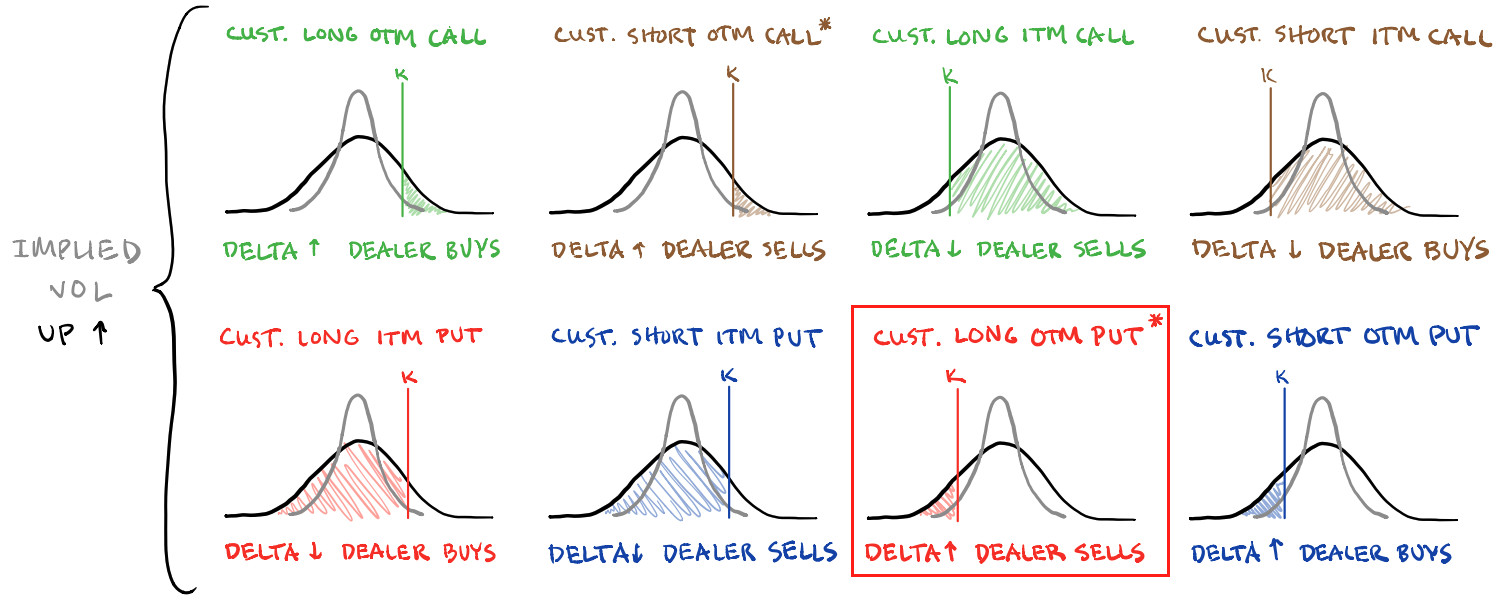
With a vast majority of these shorter-dated options exposures held short by investors, this creates conditions of suppressed volatility that can last; dealers own volatility and in hedging that, they promote mean reversion-type activity (i.e., instead of institutions writing calls against long exposure out one-month, they are writing calls against long exposure out one-day, and this supply of options has dealers pressuring the market on their initial hedging and supporting the market on later re-hedging) over the very short-term. In other words, when investors sell those calls, the dealer receives them and sells futures to hedge. This “pressures the market lower which causes … the delta of that option or replicating exposure to decline and, now, the dealers have to buy back that exposure and push the markets upward,” later, because the risk they are exposed to by that exposure has declined (i.e., lower delta). See the image below.
Graphic: Retrieved from Bank of America Corporation (NYSE: BAC).
This options activity may become problematic. If there is a gap, investors’ “scramble to hedge those positions” may lead to even larger movement, given that the market “is not prepared to provide liquidity,” generally speaking.
One options trader is making a monster bet on market volatility exploding into the summer months.
Green suggests that investors can side-step a lot of the turmoil by allocating some or all of their portfolio to bonds. Any cash remaining could be used to amplify portfolio returns in a fixed-risk manner (e.g., buy bond and SPX options and options spreads).
DEFINED OUTCOME INVESTING
-Worried about the prospects of the 60/40 portfolio? -Looking for a strategy that takes advantage of higher interest rates? -Tired of market timing?
A 🧵on how to use exchange-traded options + U.S. Treasurys to define your risk today, for tomorrow.
More detail to come in the next sessions. Hope you enjoyed this (rushed) letter.
Technical
As of 8:30 AM ET, Thursday’s regular session (9:30 AM – 4:00 PM ET), in the S&P 500, is likely to open in the lower part of a negatively skewed overnight inventory, inside of the prior day’s range, suggesting a limited potential for immediate directional opportunity.
The S&P 500 pivot for today is $3,988.25.
Key levels to the upside include $3,999.25, $4,013.00, and $4,024.75.
Key levels to the downside include $3,975.25, $3,965.25, and $3,947.00.
Disclaimer: Click here to load the updated key levels via the web-based TradingView platform. New links are produced daily. Quoted levels likely hold barring an exogenous development.
Graphic: 65-minute profile chart of the Micro E-mini S&P 500 Futures.
About
The author, Renato Leonard Capelj, spends the bulk of his time at Physik Invest, an entity through which he invests and publishes free daily analyses to thousands of subscribers. The analyses offer him and his subscribers a way to stay on the right side of the market.
You may view this letter’s content calendar at this link.
Disclaimer
Do not construe this newsletter as advice. All content is for informational purposes. Capelj and Physik Invest manage their own capital and will not solicit others for it.
Physik Invest’s Daily Brief is read free by thousands of subscribers. Join this community to learn about the fundamental and technical drivers of markets.
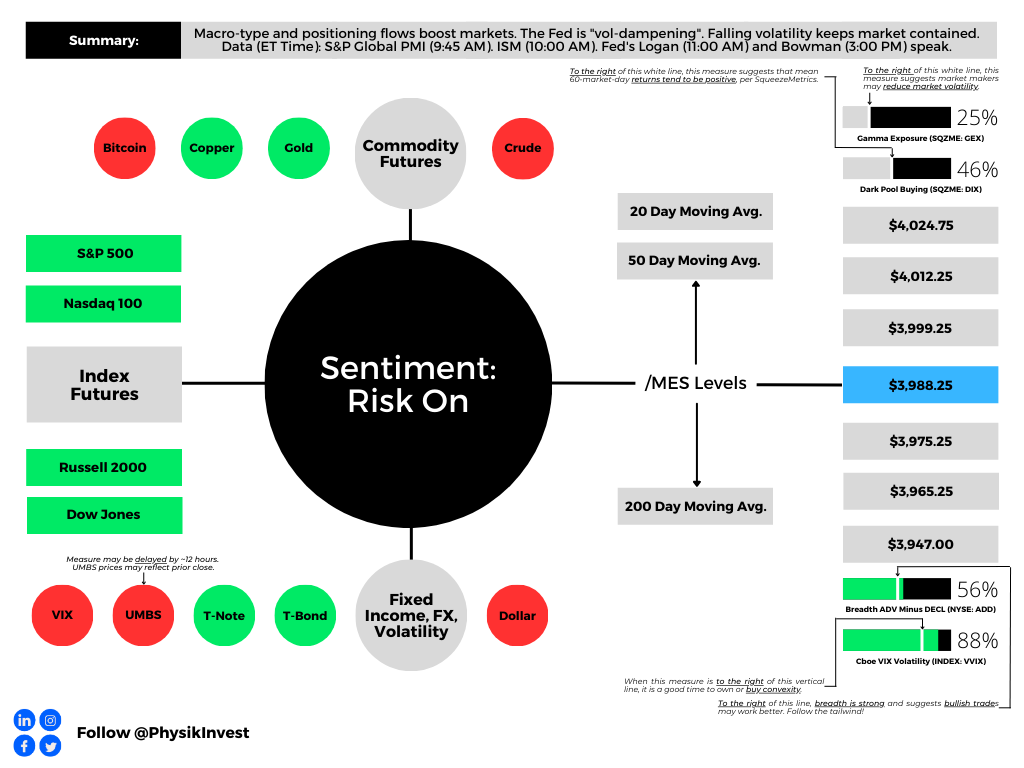
Graphic updated 7:00 AM ET. Sentiment Risk-On if expected /MES open is above the prior day’s range. /MES levels are derived from the profile graphic at the bottom of this letter. Click here for the latest levels. SqueezeMetrics Dark Pool Index (DIX) and Gamma (GEX) with the latter calculated based on where the prior day’s reading falls with respect to the MAX and MIN of all occurrences available. A higher DIX is bullish. The lower the GEX, the more (expected) volatility. Click to learn the implications of volatility, direction, and moneyness. Breadth reflects a reading of the prior day’s NYSE Advance/Decline indicator. The CBOE VIX Volatility Index (INDEX: VVIX) reflects the attractiveness of owning volatility. UMBS prices via MND. Click here for the economic calendar.
Administrative
Lots of content today but a bit rushed at the desk. If anything is unclear, we will clarify it in the coming sessions. Have a great weekend! – Renato
Fundamental
Physik Invest’s Daily Brief for March 2 talked about balancing the implications of still-hot inflation and an economy on solid footing. Basically, the probability the economy is in a recession is lower than it was at the end of ‘22. For the probabilities to change markedly, there would have to be a big increase in unemployment, for one.
According to a blog by Unlimited’s Bruce McNevin, if the unemployment rate rises by about 1%, recession odds go up by 29%. If the non-farm payroll employment falls by about 2% or 3 million jobs, recession odds increase by about 74%. After a year or so of tightening, unemployment measures are finally beginning to pick up.
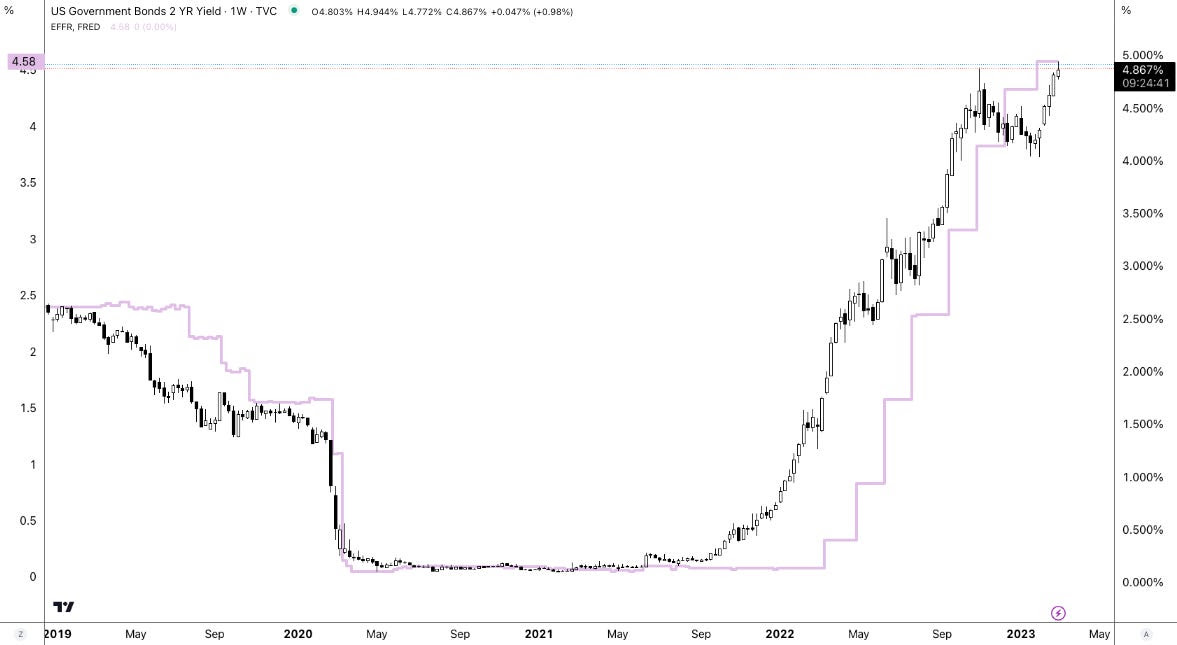
Policymakers, per recent remarks, maintain that more needs to be done, however. For instance, the Federal Reserve’s (Fed) Raphael Bostic, who generally carries an easier stance on monetary policy, mulled whether the Fed should raise interest rates beyond the 5.00-5.25% terminal rate consensus he previously endorsed. This commentary, coupled with newly released economic data, has sent yields surging at the front end.
Graphic: Retrieved from TradingView.
Traders are wildly repricing their terminal rate expectations this week. The terminal rate over the past few days has gone up from 5.25-5.50% to 5.50-5.75%, and back down to 5.25-5.50%.
Graphic: Retrieved from CME Group Inc (NASDAQ: CME).
Positioning
Stocks and bonds performed poorly. Commodity hedges are uninspiring also in that they do not hedge against (rising odds of) recession, per the Daily Brief for March 1.
In navigating this precarious environment, this letter has put forward a few trade ideas including the sale of call options structures to finance put options structures, after the mid-February monthly options expiration (OpEx). Though measures suggest “we can [still] get cheap exposure to convexity while a lot of people are worried,” the location for similar (short call, long put) trades is not optimal. Rather, trades including building your own structured note, now catching the attention of some traders online, appear attractive now with T-bill rates surging.
Such trades reduce portfolio volatility and downside while providing upside exposure comparable to poorly performing traditional portfolio constructions like 60/40.
As an example, per IPS Strategic Capital’s Pat Hennessy, with $1,000,000 to invest and rates at ~5% (i.e., $50,000 is 5% of $1,000,000), one could buy 1000 USTs or S&P 500 (INDEX: SPX) Box Spreads which will have a value of $1 million at maturity for the price of $950,000.
With $50,000 left in cash, one can use options for leveraged exposure to an asset of their choosing, Hennessy explained. Should these options expire worthless, the $50,000 gain from USTs, at maturity, provides “a full return of principal.”
For traders who are focused on short(er)-term movements, one could allocate the cash remaining toward structures that buy and sell call options over very short time horizons (e.g., 0 DTE).
Knowing that the absence of range expansion to the downside, positioning flows may build a platform for the market to rally, one could lean into structures like fixed-width call option butterflies.
For instance, yesterday, Nasdaq 100 (INDEX: NDX) call option butterflies expanded in value ~10 times (i.e., $5 → $50). An example 0 DTE trade is the BUTTERFLY NDX 100 (Weeklys) 2 MAR 23 12000/12100/12200 CALL. Such trade could have been bought near ~$5.00 in debit and, later, sold for much bigger credits (e.g., ~$40.00).
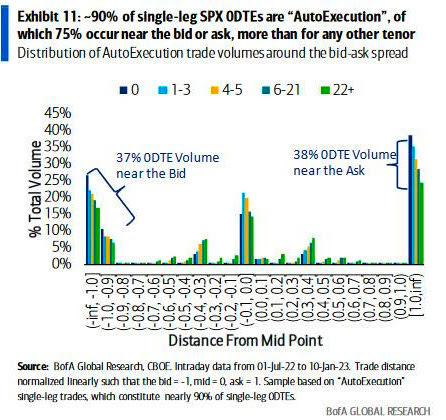
Such trade fits and plays on the narrative described in Physik Invest’s Daily Brief for February 24. That particular letter detailed Bank of America Corporation’s (NYSE: BAC) finding that “volume is uniquely skewed towards the ask early in the day but towards the bid later in the day” for these highly traded ultra-short-dated options.
Graphic: Retrieved from Goldman Sachs Group Inc (NYSE: GS) via Bloomberg.
Even options insight and data provider SqueezeMetrics agrees: “Buy 0 DTE call.” The typical “day doesn’t end above straddle b/e, but call makes money,” SqueezeMetrics explained. “Dealer and call-buyer both profit. Gap down, repeat.”
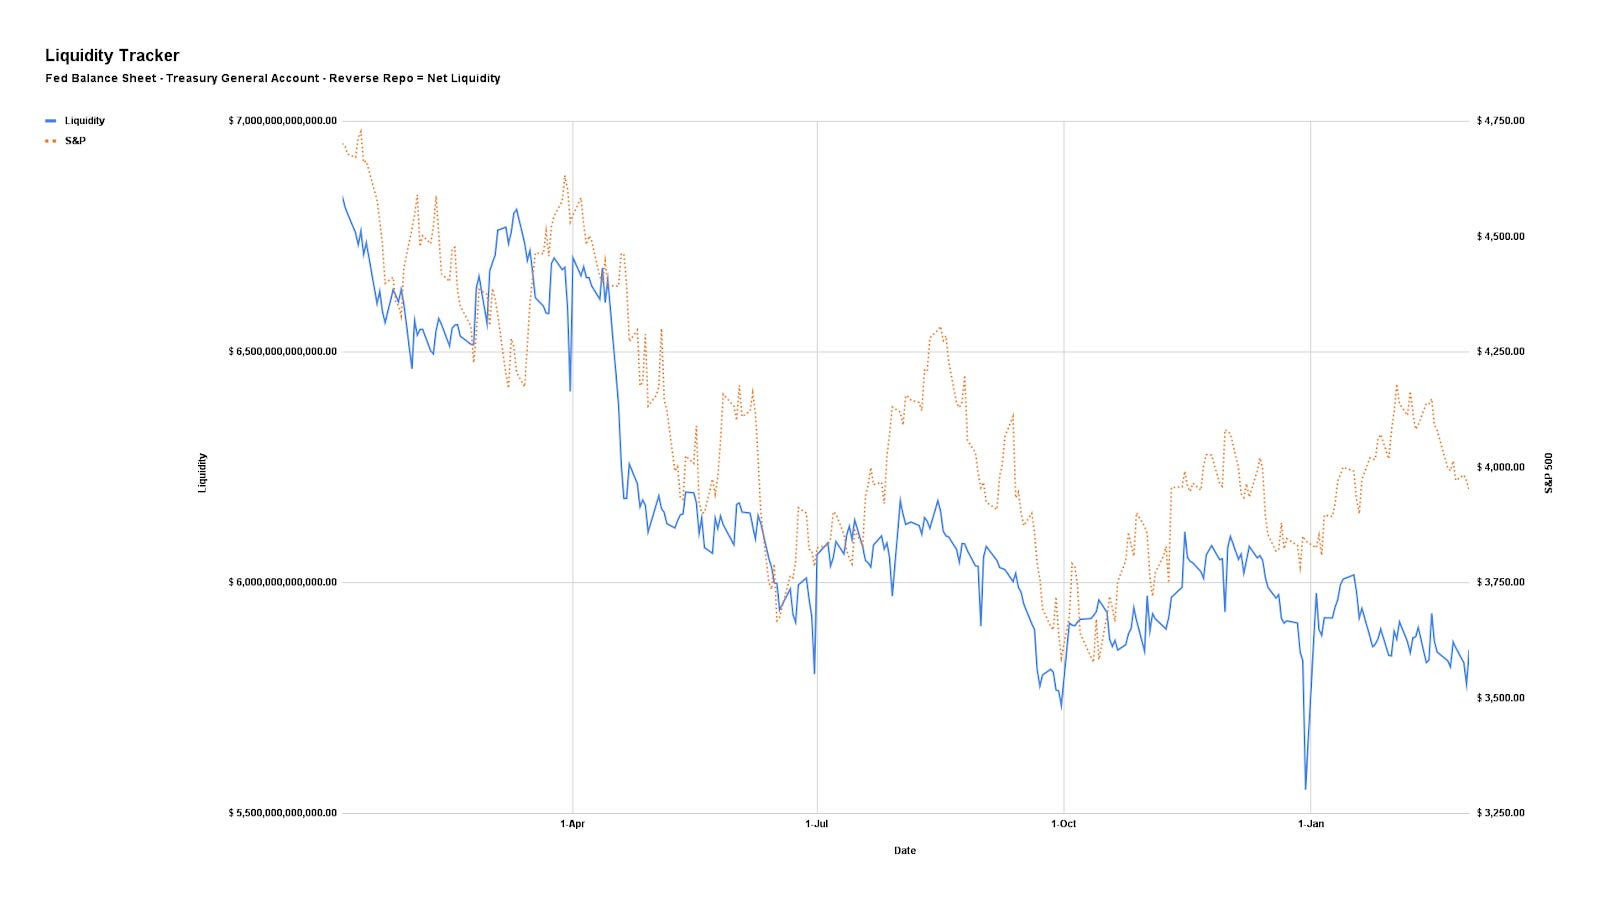
Anyways, back to the bigger trends impacted by liquidity coming off the table and increased competition between equities and fixed income.
Graphic: Via Physik Invest. Net Liquidity = Fed Balance Sheet – Treasury General Account – Reverse Repo.
As this letter put forth in the past, if the “market consolidates and doesn’t break,” as we see, the delta buy-back with respect to dropping implied volatility (IVOL) or vanna and buy-back with respect to the passage of time or charm could build a platform for a FOMO-driven call buying rally that ends in a blow-off.
Graphic: Retrieved from Piper Sandler’s (NYSE: PIPR) Danny Kirsch. Short volatility and short stocks was attractive to trade. As your letter writer put in a recent SpotGamma note: “With IV at already low levels, the bullish impact of it falling further is weak, hence the SPX trending lower all the while IV measures (e.g., VIX term structure) have shifted markedly lower since last week. If IV was at a higher starting point, its falling would work to keep the market in a far more positive/bullish stance.”
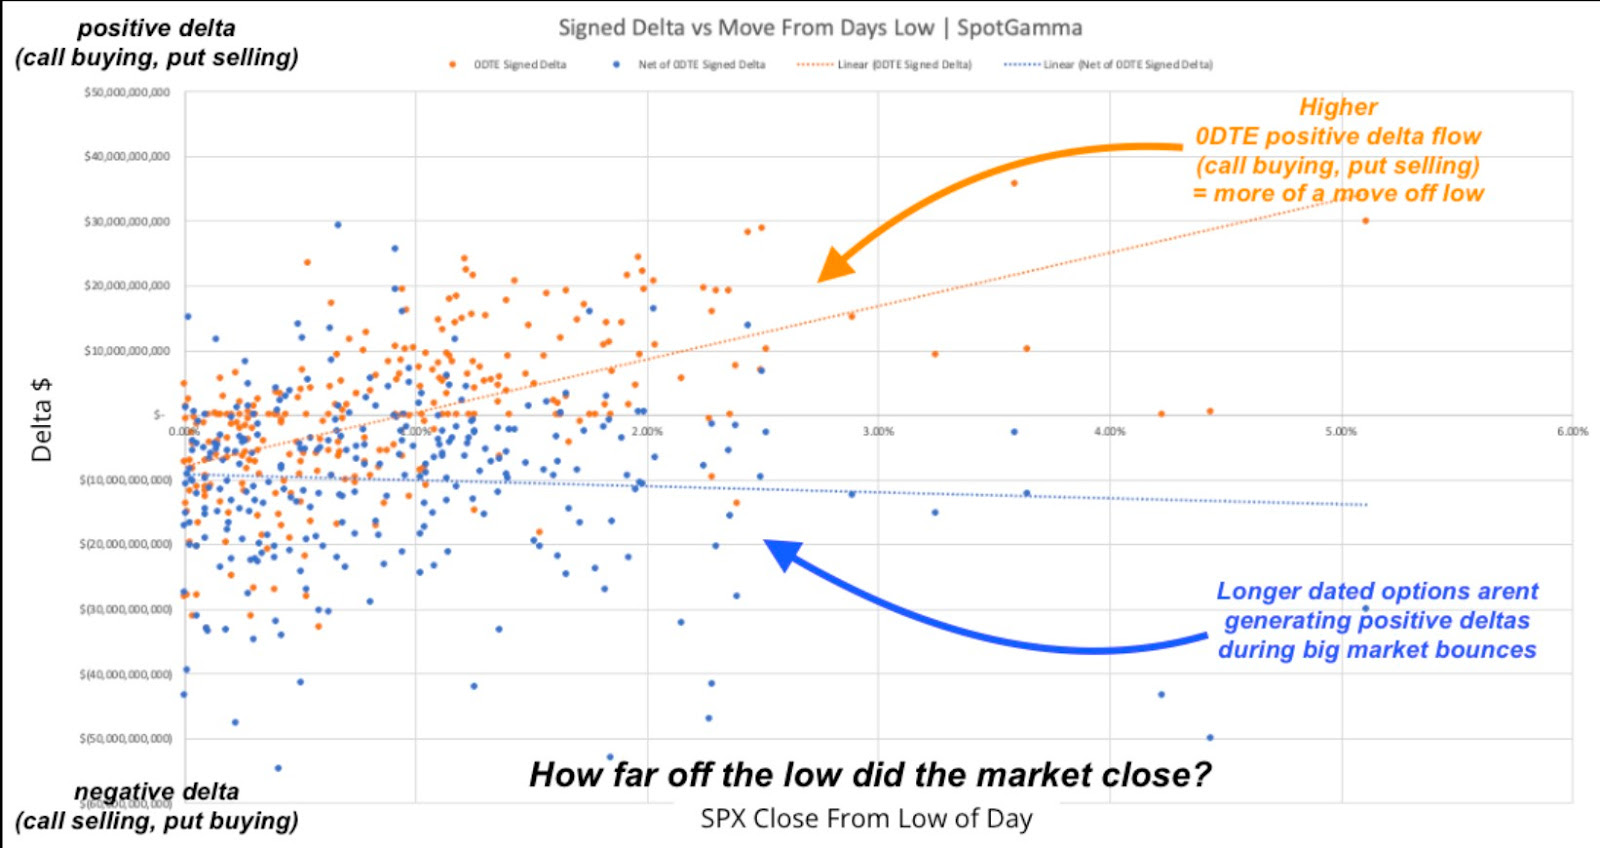
Per data by SpotGamma, another options insight and data provider your letter writer used to write for and highly recommends checking out, call buying, particularly over short time horizons, was often tied to market rallies.
“0DTE does not seem to be associated with betting on a large downside movement. Large downside market volatility appears to be driven by larger, longer-dated S&P volume,” SpotGamma founder Brent Kochuba said in the Bloomberg article. “Where 0DTE is currently most impactful is where it seems 0DTE calls are being used to ‘buy the dips’ after large declines. In a way this suppresses volatility.”
Anyways, the signs of a “more combustible situation” would likely show when “volatility is sticky into a rally,” explained Kai Volatiity’s Cem Karsan. To gauge combustibility, look to the Daily Brief for February 17.
Technical
As of 6:50 AM ET, Friday’s regular session (9:30 AM – 4:00 PM ET), in the S&P 500, is likely to open in the upper part of a positively skewed overnight inventory, outside of the prior day’s range, suggesting a potential for immediate directional opportunity.
The S&P 500 pivot for today is $3,988.25.
Key levels to the upside include $3,999.25, $4,012.25, and $4,024.75.
Key levels to the downside include $3,975.25, $3,965.25, and $3,947.00.
Disclaimer: Click here to load the updated key levels via the web-based TradingView platform. New links are produced daily. Quoted levels likely hold barring an exogenous development.
Graphic: 65-minute profile chart of the Micro E-mini S&P 500 Futures.
Definitions
Volume Areas: Markets will build on areas of high-volume (HVNodes). Should the market trend for a period of time, this will be identified by a low-volume area (LVNodes). The LVNodes denote directional conviction and ought to offer support on any test.
If participants auction and find acceptance in an area of a prior LVNode, then future discovery ought to be volatile and quick as participants look to the nearest HVNodes for more favorable entry or exit.
Vanna: The rate at which the Delta of an option changes with respect to implied volatility.
Charm: The rate at which the Delta of an option changes with respect to time.
POCs: Areas where two-sided trade was most prevalent in a prior day session. Participants will respond to future tests of value as they offer favorable entry and exit.
MCPOCs: Denote areas where two-sided trade was most prevalent over numerous sessions. Participants will respond to future tests of value as they offer favorable entry and exit.
Options Expiration (OPEX): Reduction in dealer Gamma exposure. Often, there is an increase in volatility after the removal of large options positions and associated hedging.
Options: Options offer an efficient way to gain directional exposure.
If an option buyer was short (long) stock, he or she could buy a call (put) to hedge upside (downside) exposure. Additionally, one can spread, or buy (+) and sell (-) options together, strategically.
Commonly discussed spreads include credit, debit, ratio, back, and calendar.
Credit: Sell -1 option closer to the money. Buy +1 option farther out of the money.
Debit: Buy +1 option closer to the money. Sell -1 option farther out of the money.
Ratio: Buy +1 option closer to the money. Sell -2 options farther out of the money.
Back: Sell -1 option closer to the money. Buy +2 options farther out of the money.
Calendar: Sell -1 option. Buy +1 option farther out in time, at the same strike.
Typically, if bullish (bearish), sell at-the-money put (call) credit spread and/or buy a call (put) debit/ratio spread structured around the target price. Alternatively, if the expected directional move is great (small), opt for a back spread (calendar spread). Also, if credit spread, capture 50-75% of the premium collected. If debit spread, capture 2-300% of the premium paid.
Be cognizant of risk exposure to the direction (Delta), movement (Gamma), time (Theta), and volatility (Vega).
Negative (positive) Delta = synthetic short (long).
Negative (positive) Gamma = movement hurts (helps).
Negative (positive) Theta = time decay hurts (helps).
The author, Renato Leonard Capelj, spends the bulk of his time at Physik Invest, an entity through which he invests and publishes free daily analyses to thousands of subscribers. The analyses offer him and his subscribers a way to stay on the right side of the market.
You may view this letter’s content calendar at this link.
Disclaimer
Do not construe this newsletter as advice. All content is for informational purposes. Capelj and Physik Invest manage their own capital and will not solicit others for it.
Physik Invest’s Daily Brief is read free by thousands of subscribers. Join this community to learn about the fundamental and technical drivers of markets.
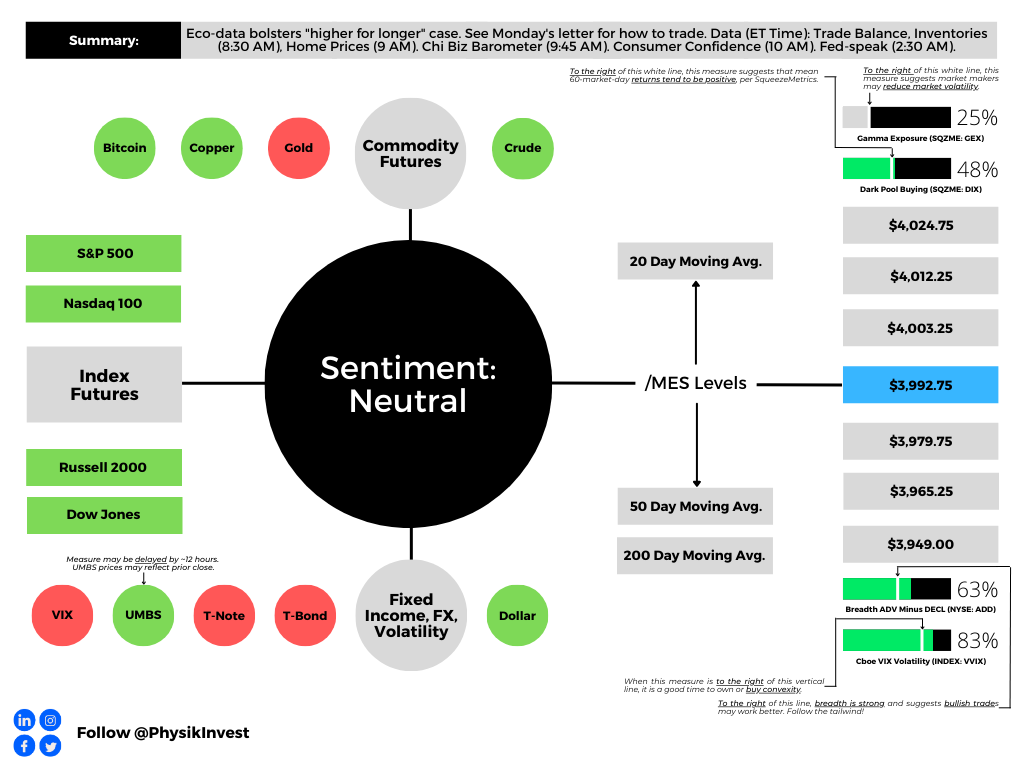
Graphic updated 6:30 AM ET. Sentiment Neutral if expected /MES open is inside of the prior day’s range. /MES levels are derived from the profile graphic at the bottom of this letter. Click here for the latest levels. SqueezeMetrics Dark Pool Index (DIX) and Gamma (GEX) with the latter calculated based on where the prior day’s reading falls with respect to the MAX and MIN of all occurrences available. A higher DIX is bullish. The lower the GEX, the more (expected) volatility. Click to learn the implications of volatility, direction, and moneyness. Breadth reflects a reading of the prior day’s NYSE Advance/Decline indicator. The CBOE VIX Volatility Index (INDEX: VVIX) reflects the attractiveness of owning volatility. UMBS prices via MND. Click here for the economic calendar.
Administrative
A light letter, today.
Check out the Daily Brief for February 27, 2023, for how to take advantage of higher interest rates and define the outcome of your trading.
As an aside, the second to last positioning section paragraph in that letter talks about using short-dated bets like “butterflies, broken-wing butterflies, ratio spreads, back spreads, and beyond.” In the initial version of the letter, your letter writer accidentally wrote box spreads instead of back spreads. Apologies.
Positioning
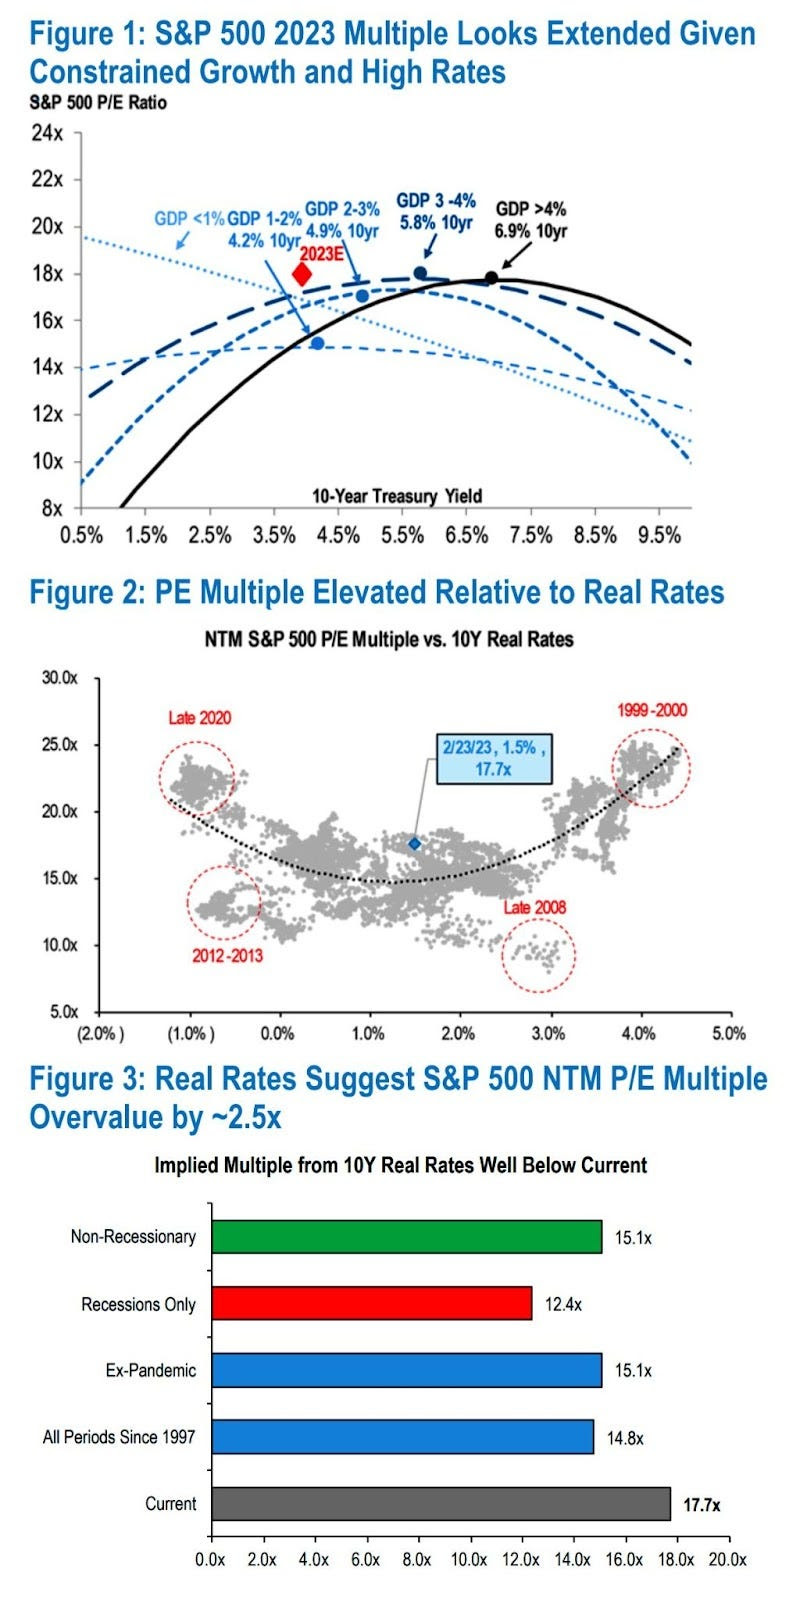
Yields are ~5.00%, and this is around the S&P 500’s (INDEX: SPX) earnings yield (i.e., the 6-month Treasury yield is about equal to the SPX’s earnings yield of 5.2%).
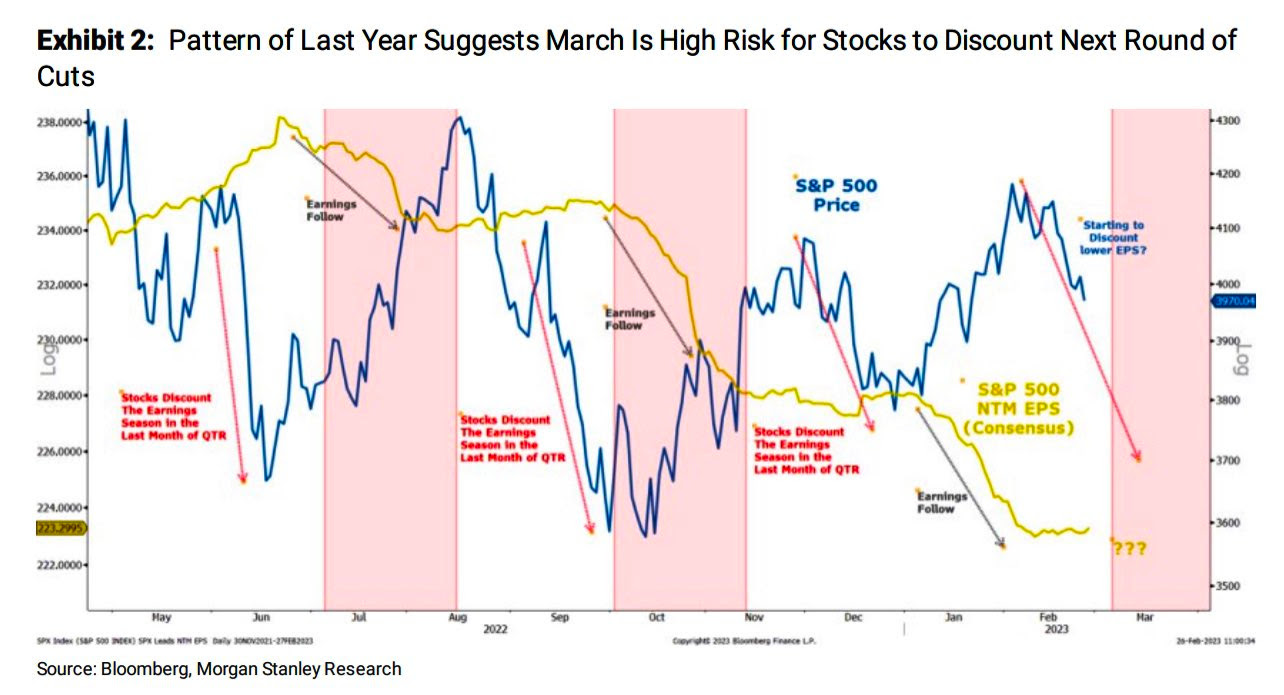
A nod to rising rates and risk premiums, the likes of Morgan Stanley suggest the S&P 500 (INDEX: SPX) will come under further pressure.
Graphic: Retrieved from Morgan Stanley (NYSE: MS).
Since not all who read the letter are active in the same timeframe, in the interest of expanding the opportunity set if we will, your letter writer detailed ways to express one’s longer-term opinion on the upside or downside in a capital-protected way.
Essentially, traders can create their own structured notes, investing in a manner that returns principal only. The difference between the bond/box spread outlay and cash remaining is invested in leverage potential. At maturity, the worst-case is a return of principal.
Further, through such structures, traders can participate in the upside by about the same amount they would with a traditional construction (e.g., 60/40). However, you cut the downside.
Graphic: Retrieved from IPS Strategic Capital’s Pat Hennessy.
Alternatively, traders can bias themselves short or non-directionally. In a short-bias situation, one can buy a put spread (and/or sell a call spread) with an outlay (or max loss) not exceeding the cash remaining after the purchase of a bond or box spread.
Through a short-biased setup, traders may participate in potential downside on the pricing of equity market headwinds.
Graphic: Retrieved from JPMorgan Chase & Co (NYSE: JPM).
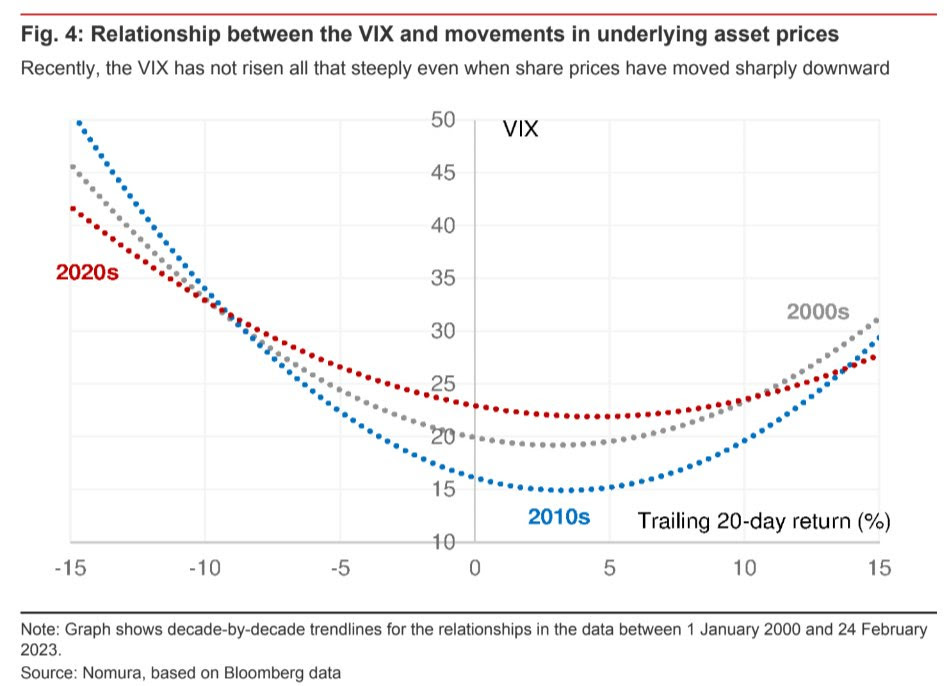
The suggested downside trades are rather attractive now in the absence of hedging demands in longer-dated protection convex in price and volatility. Naive measures like the Cboe VIX Volatility (INDEX: VVIX), as well as the graphic below, allude to the little demands for convexity and a declining sensitivity of the VIX with respect to changes in share prices.
Graphic: Retrieved from Nomura Holdings Inc (NYSE: NMR).
Technical
As of 6:30 AM ET, Tuesday’s regular session (9:30 AM – 4:00 PM ET), in the S&P 500, is likely to open in the upper part of a negatively skewed overnight inventory, inside of the prior day’s range, suggesting a limited potential for immediate directional opportunity.
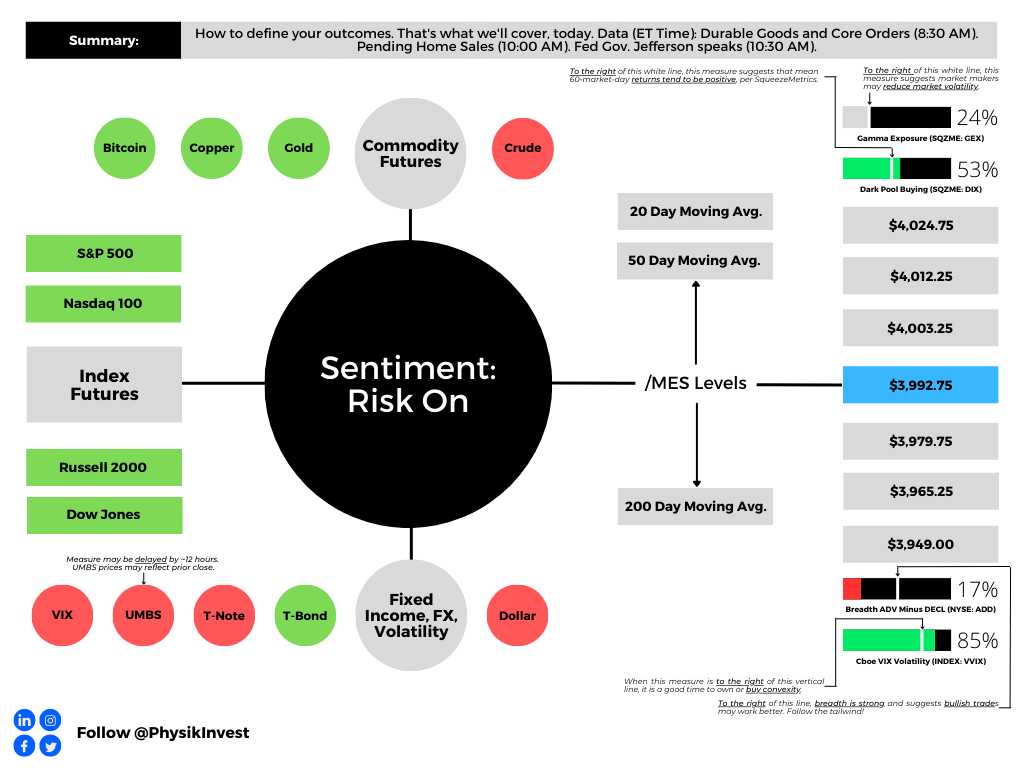
The S&P 500 pivot for today is $3,992.75.
Key levels to the upside include $4,003.25, $4,012.25, and $4,024.75.
Key levels to the downside include $3,979.75, $3,965.25, and $3,949.00.
Disclaimer: Click here to load the updated key levels via the web-based TradingView platform. New links are produced daily. Quoted levels likely hold barring an exogenous development.
Graphic: 65-minute profile chart of the Micro E-mini S&P 500 Futures.
Definitions
Volume Areas: Markets will build on areas of high-volume (HVNodes). Should the market trend for a period of time, this will be identified by a low-volume area (LVNodes). The LVNodes denote directional conviction and ought to offer support on any test.
If participants auction and find acceptance in an area of a prior LVNode, then future discovery ought to be volatile and quick as participants look to the nearest HVNodes for more favorable entry or exit.
POCs: Areas where two-sided trade was most prevalent in a prior day session. Participants will respond to future tests of value as they offer favorable entry and exit.
MCPOCs: Denote areas where two-sided trade was most prevalent over numerous sessions. Participants will respond to future tests of value as they offer favorable entry and exit.
About
The author, Renato Leonard Capelj, works in finance and journalism.
Capelj spends the bulk of his time at Physik Invest, an entity through which he invests and publishes free daily analyses to thousands of subscribers. The analyses offer him and his subscribers a way to stay on the right side of the market. Separately, Capelj is an options analyst at SpotGamma and an accredited journalist.
You may view this letter’s content calendar at this link.
Disclaimer
Do not construe this newsletter as advice. All content is for informational purposes. Capelj and Physik Invest manage their own capital and will not solicit others for it.
Physik Invest’s Daily Brief is read free by thousands of subscribers. Join this community to learn about the fundamental and technical drivers of markets.
Graphic updated 7:45 AM ET. Sentiment Risk-On if expected /MES open is above the prior day’s range. /MES levels are derived from the profile graphic at the bottom of this letter. Click here for the latest levels. SqueezeMetrics Dark Pool Index (DIX) and Gamma (GEX) with the latter calculated based on where the prior day’s reading falls with respect to the MAX and MIN of all occurrences available. A higher DIX is bullish. The lower the GEX, the more (expected) volatility. Click to learn the implications of volatility, direction, and moneyness. Breadth reflects a reading of the prior day’s NYSE Advance/Decline indicator. The CBOE VIX Volatility Index (INDEX: VVIX) reflects the attractiveness of owning volatility. UMBS prices via MND. Click here for the economic calendar.
Positioning
In The Second Leg Down: Strategies For Profiting After A Market Sell-Off, there is one passage on the inaccuracy of normal distributions in markets and serial correlation, as well as the underpricing of rare events. In that same passage, Nassim Nicholas Taleb is credited for his advocacy on portfolio allocations to safe short-term government bonds and high-risk speculative bets through which “you could lose no more than your initial investment.”
Naturally, this leads to Exotic Options and Hybrids. Structured notes, to quote chapter two, are “composed of a non-risky asset providing a percentage of protected capital and a risky asset offering leverage potential.”
The structure, as a whole, is not risky in the absence of defaults. The bond, which is bought at a discount, increases in value until maturity. The difference between the initial value to allocate (100% of notional) and the bond purchase price is allocated to the leverage (e.g., options) component of the structure.
Graphic: Retrieved from Exotic Options and Hybrids.
This type of capital-protected structure is particularly attractive right now, given the interest rate environment. That’s because high-interest rates decrease the initial value of the bond. This means we can allocate more to leveraged bets, for example.
During the life of the structured note, the value of the non-risky part increases when interest rates decrease. At maturity, the value of the bond component is equal to 100% of the notional while the value of the riskier part of the note is “non-linear and fluctuates depending on many market parameters such as the underlying’s spot, interest rates, borrowing costs, dividend yield or volatility.”
Graphic: Retrieved from Exotic Options and Hybrids. For illustration only.
Last week, IPS Strategic Capital’s Pat Hennessy wrote a thread on how to apply this information.
Basically, with interest rates near 5% at the front of the yield curve, and traditional portfolio constructions performing poorly, defined-outcome investing is attractive.
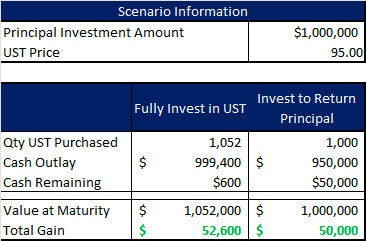
With $1,000,000 to invest and rates at ~5% (i.e., $50,000 is 5% of $1,000,000), one could “purchase 1000 USTs [or S&P 500 (INDEX: SPX) Box Spreads] which will have a value of $1 million at maturity for the price of $950,000.”
Graphic: Retrieved from IPS Strategic Capital’s Pat Hennessy.
With $50,000 left in cash, one can use options for leveraged exposure to an asset of their choosing, Hennessy explained. Should these options expire worthless, the $50,000 gain from USTs, at maturity, provides “a full return of principal.”
In an example, Hennessy presented a structure providing 60% of the upside gain of the S&P 500 with full principal protection should markets fall. Though “you may initially scoff at 60%, [] keep in mind that historically 60/40 has captured between 60-70% of the upside of equities.”
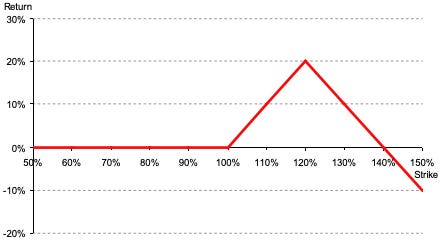
Graphic: Retrieved from IPS Strategic Capital’s Pat Hennessy.
If you’re bearish or unopinionated, Hennessy presented capital-protected structures that make money if the market moves lower (e.g., instead of buying a call option on the SPX, buy put options or a put options spread) or sideways (e.g., sell defined-risk option condor structures).
Graphic: Retrieved from IPS Strategic Capital’s Pat Hennessy.
Markets have a tendency to move big and continue moving big in the same direction, over the very short term, hence the “fat tails in the distribution over short horizons,” to quote The Second Leg Down. Given this, your letter writer can use his analyses to capitalize big on underpricing and participate in upside or downside through a series of short-dated options bets (e.g., butterflies, broken-wing butterflies, ratio spreads, back spreads, and beyond) that, in time, may return in excess of ~10 times the initial investment. Should nothing happen, then he walks away with his principal. That’s trading made less stressful.
Have a great day. If you enjoyed today’s letter, consider sharing it with your friends!
Graphic: Via Banco Santander SA (NYSE: SAN) research, the return profile, at expiry, of a classic 1×2 (long 1, short 2 further away) ratio spread.
Technical
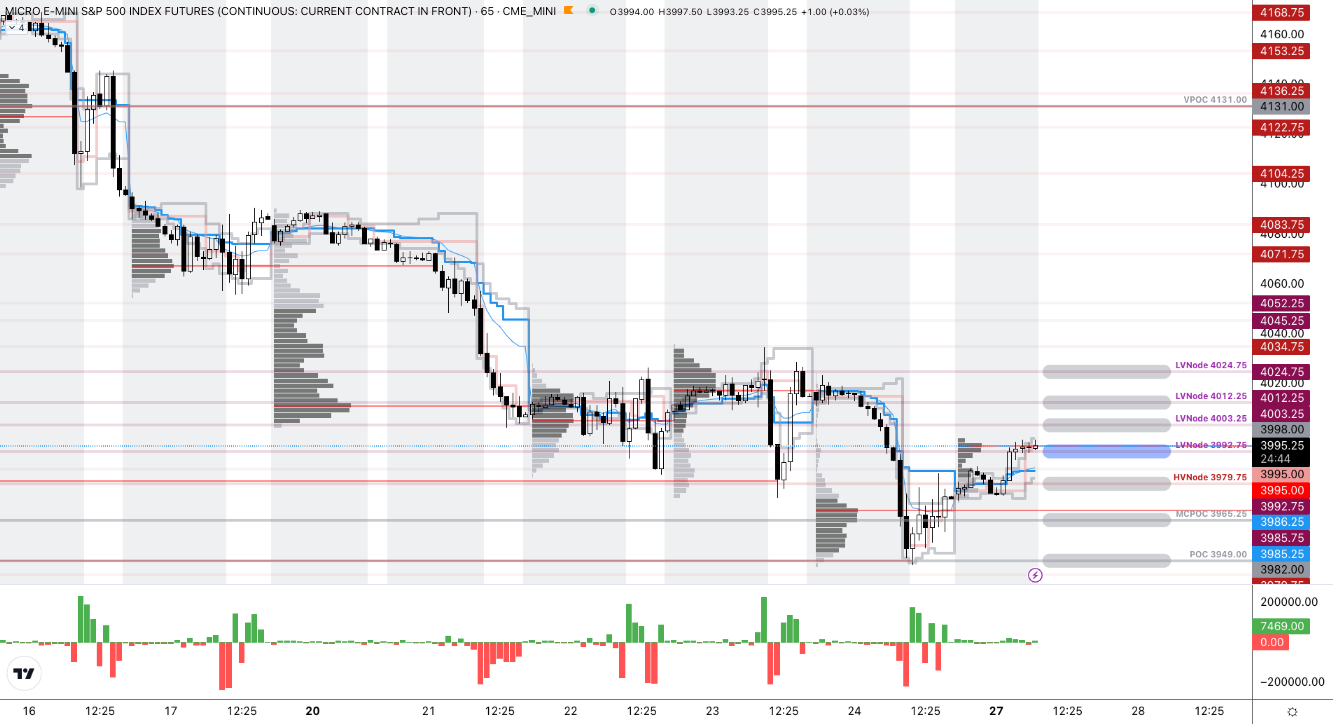
As of 7:40 AM ET, Monday’s regular session (9:30 AM – 4:00 PM ET), in the S&P 500, is likely to open in the upper part of a positively skewed overnight inventory, outside of the prior day’s range, suggesting a potential for immediate directional opportunity.
The S&P 500 pivot for today is $3,992.75.
Key levels to the upside include $4,003.25, $4,012.25, and $4,024.75.
Key levels to the downside include $3,979.75, $3,965.25, and $3,949.00.
Disclaimer: Click here to load the updated key levels via the web-based TradingView platform. New links are produced daily. Quoted levels likely hold barring an exogenous development.
Graphic: 65-minute profile chart of the Micro E-mini S&P 500 Futures.
Definitions
Volume Areas: Markets will build on areas of high-volume (HVNodes). Should the market trend for a period of time, this will be identified by a low-volume area (LVNodes). The LVNodes denote directional conviction and ought to offer support on any test.
If participants auction and find acceptance in an area of a prior LVNode, then future discovery ought to be volatile and quick as participants look to the nearest HVNodes for more favorable entry or exit.
POCs: Areas where two-sided trade was most prevalent in a prior day session. Participants will respond to future tests of value as they offer favorable entry and exit.
MCPOCs: Denote areas where two-sided trade was most prevalent over numerous sessions. Participants will respond to future tests of value as they offer favorable entry and exit.
About
The author, Renato Leonard Capelj, works in finance and journalism.
Capelj spends the bulk of his time at Physik Invest, an entity through which he invests and publishes free daily analyses to thousands of subscribers. The analyses offer him and his subscribers a way to stay on the right side of the market. Separately, Capelj is an options analyst at SpotGamma and an accredited journalist.
You may view this letter’s content calendar at this link.
Disclaimer
Do not construe this newsletter as advice. All content is for informational purposes. Capelj and Physik Invest manage their own capital and will not solicit others for it.
Physik Invest’s Daily Brief is read by over 1,200 people. To join this community and learn about the fundamental and technical drivers of markets, subscribe below.
Graphic updated 9:30 AM ET. Sentiment Risk-On if expected /ES open is above the prior day’s range. /ES levels are derived from the profile graphic at the bottom of this letter. Levels may have changed since initially quoted; click here for the latest levels. SqueezeMetrics Dark Pool Index (DIX) and Gamma (GEX) with the latter calculated based on where the prior day’s reading falls with respect to the MAX and MIN of all occurrences available. A higher DIX is bullish. At the same time, the lower the GEX, the more (expected) volatility. Click to learn the implications of volatility, direction, and moneyness. Breadth reflects a reading of the prior day’s NYSE Advance/Decline indicator. VIX reflects a current reading of the CBOE Volatility Index (INDEX: VIX) from 0-100.
Administrative:
Crazy morning! Coming in really late, today. Not the best letter. I know.
Positioning
To preface, trading is a lonely game and having people to speak with means a lot. So, I call up my trading partner, yesterday, and we chat markets and some other unrelated stuff. During the call, he said something I couldn’t shake. It was along the lines of the following: “Active traders (e.g., directional stock and futures bettors) are getting killed right now, and we are sitting on our hands not getting killed.”
This is a nod to context. We mustn’t look at the market from a single angle, in short.
Starting on the fundamental side of things, the 2022 market de-rate had much to do with participants’ repricing of assets in the context of monetary tightening (to stem structural inflation). As Joseph Wang wrote in one post, the “Fed’s rapid tightening markedly reduced the level of household wealth and thus potential demand.”
It’s “[o]ne of the Fed’s tools to impact aggregate demand [] by adjusting household wealth,” he adds. This “in turn impacts household spending power.”
Adding: “The wealth effect was an explicit rationale for [quantitative easing or QE], where higher asset prices were thought to boost consumer spending. By the same logic, lowering household wealth can potentially lower consumer spending and dampen inflation.”
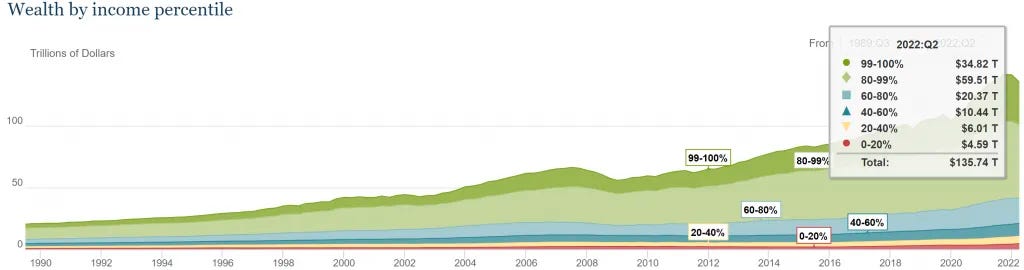
Graphic: Retrieved from Joseph Wang’s “Stock and Flow” post. “Public data suggests [the] top 20% of earners hold 70% of household wealth.”
With “the bulk of asset repricing … behind us,” markets have turned; support is fundamental, for one, and positioning, as we discuss in this letter, has added to market support.
A similar setup occurred late this summer; investors’ supply of protection added to the macro-type flows after elections and CPI. Following the last weeks, the pulling forward of the supportive hedging (linked to the decay of options with respect to the passing of time), in light of the holidays, would keep markets intact.
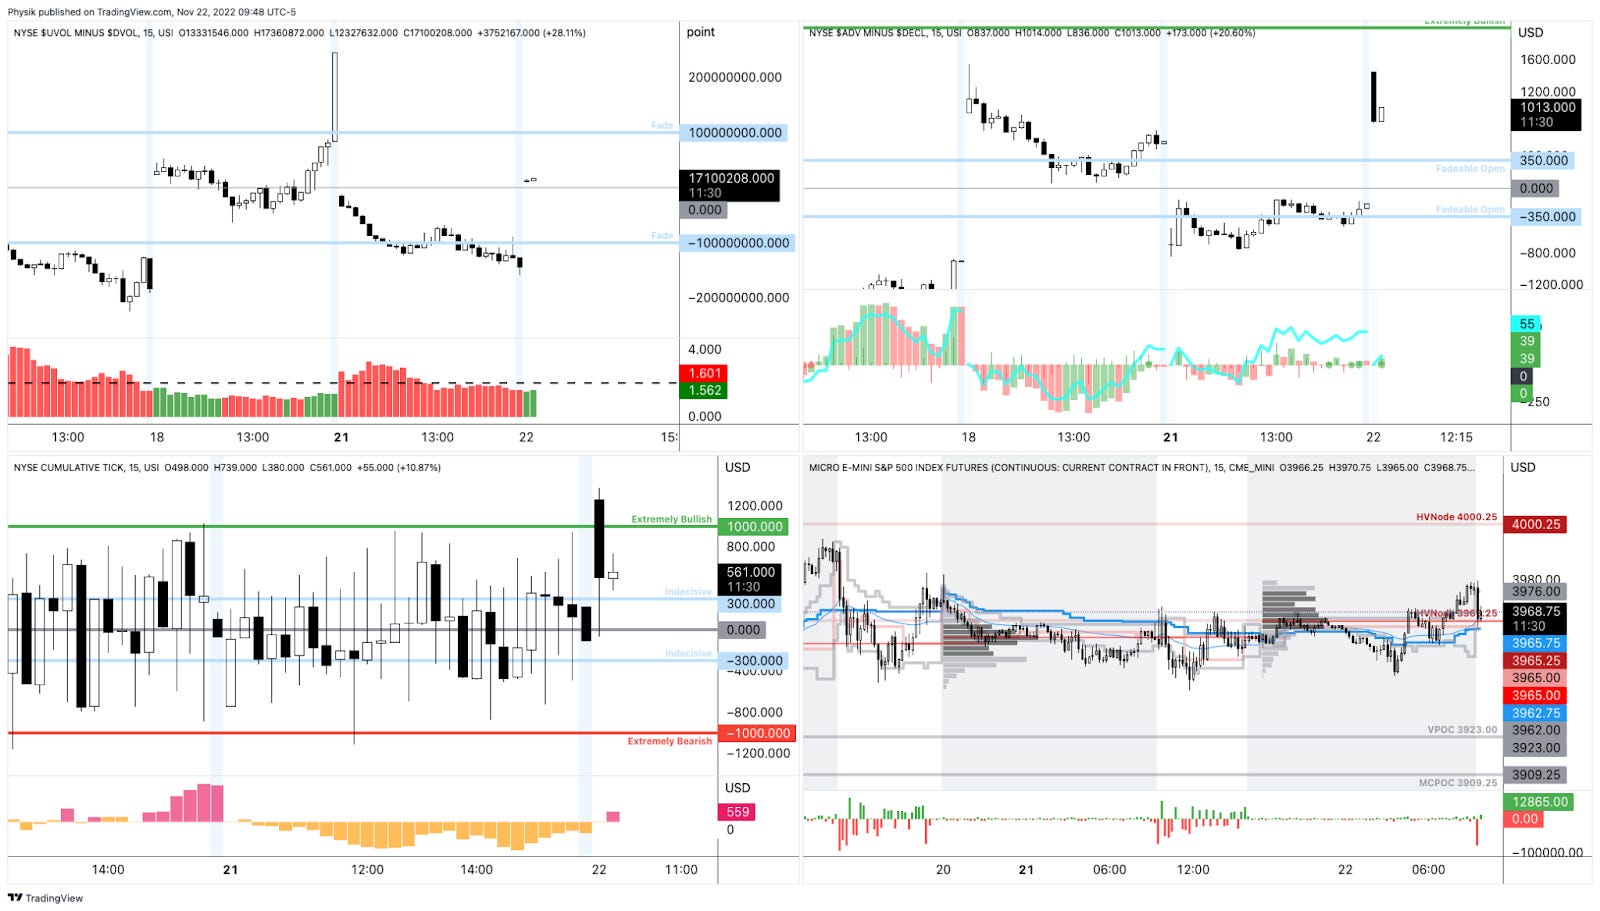
As some evidence, see the below graphic. Yesterday, the S&P 500 (INDEX: SPX) auctioned sideways (the bottom right) while breadth (the top left) was weak.
Graphic: Market Internals (Advance/Decline, Up-Volume/Down-Volume, Tick) as Peter Reznicek at ShadowTrader teaches. Though positive, readings were weak and supportive of responsive trade, similar to what market liquidity (via Bookmap) was showing.
As SpotGamma put forward yesterday, in addition to the “support coming from the time decay that’s likely being pulled forward due to the holidays, implied volatility compressed and provided the market with that Vanna boost we talk much about.”
Accordingly, “[w]hen investors supply protection,” hence lower IVOL, counterparties “hedge in a manner that reduces market swings,” SpotGamma explained.
How do we capitalize on this information? A few ways stick out.
First, interesting are trades that bet on less whipsaw over the short term (e.g., sell a short-dated option and buy a far-dated option).
You are betting against movement (-Gamma) over a span of time you don’t think the market will move. And, you are betting on movement (+Gamma) over a larger span of time. In theory, using a calendar spread strategy as just described would position you for market movement when the context develops to “catalyze increased whipsaw.”
Second, if you own the S&P 500, sell call skew to fund put skew. By doing so, you will put yourself into a protective collar. For reasons we won’t go into today, according to a recent posting by IPS Strategic Capital’s Pat Hennessy, collars are an “attractive trade for those who are worried about the performance of stocks over the next year but do not want to sell or try timing the market.”
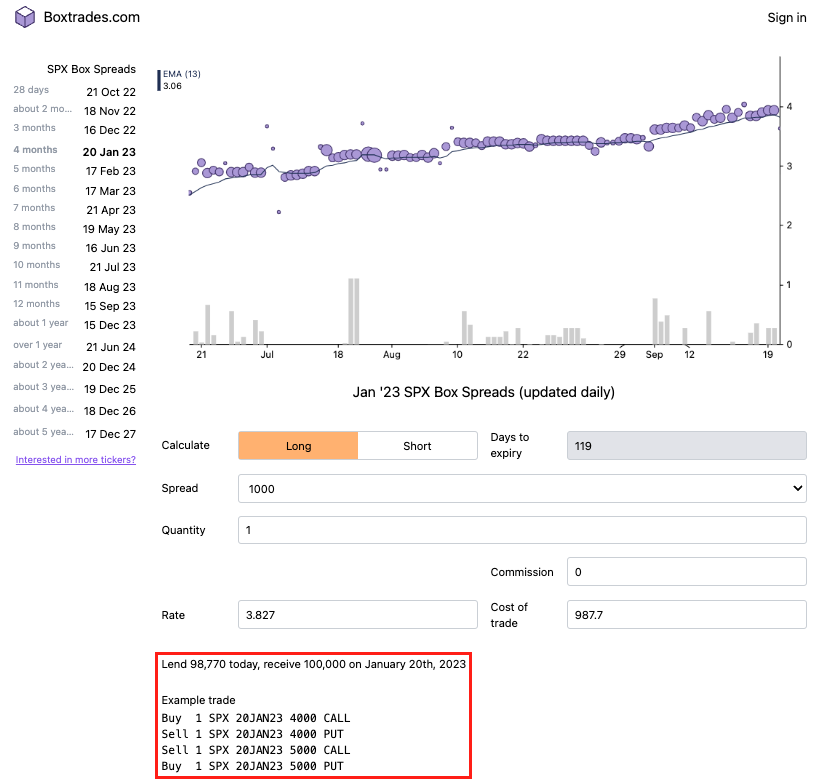
Lastly, if guaranteed returns are desired, box spreads enable you to create “a loan structure similar to a Treasury bill.” Upon maturity, the box spread earns a competitive interest rate. Price some trades at boxtrades.com.
Technical
As of 9:30 AM ET, Tuesday’s regular session (9:30 AM – 4:00 PM ET), in the S&P 500, is likely to open in the upper part of a balanced skewed overnight inventory, just outside of prior-range and -value, suggesting a potential for immediate directional opportunity.
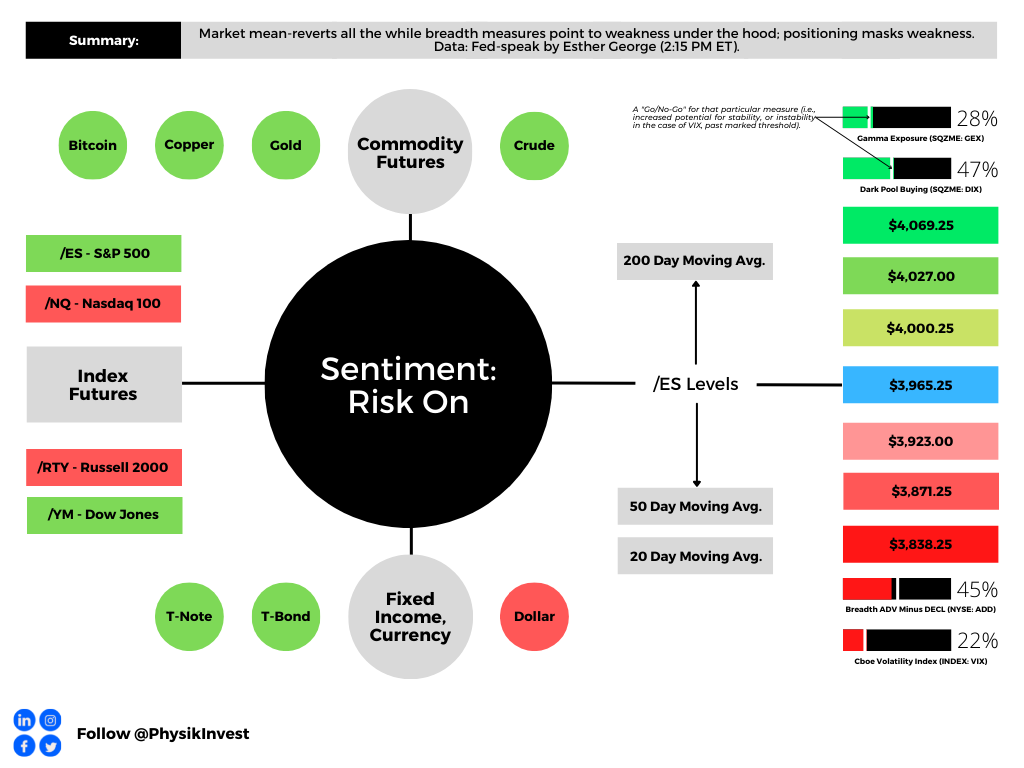
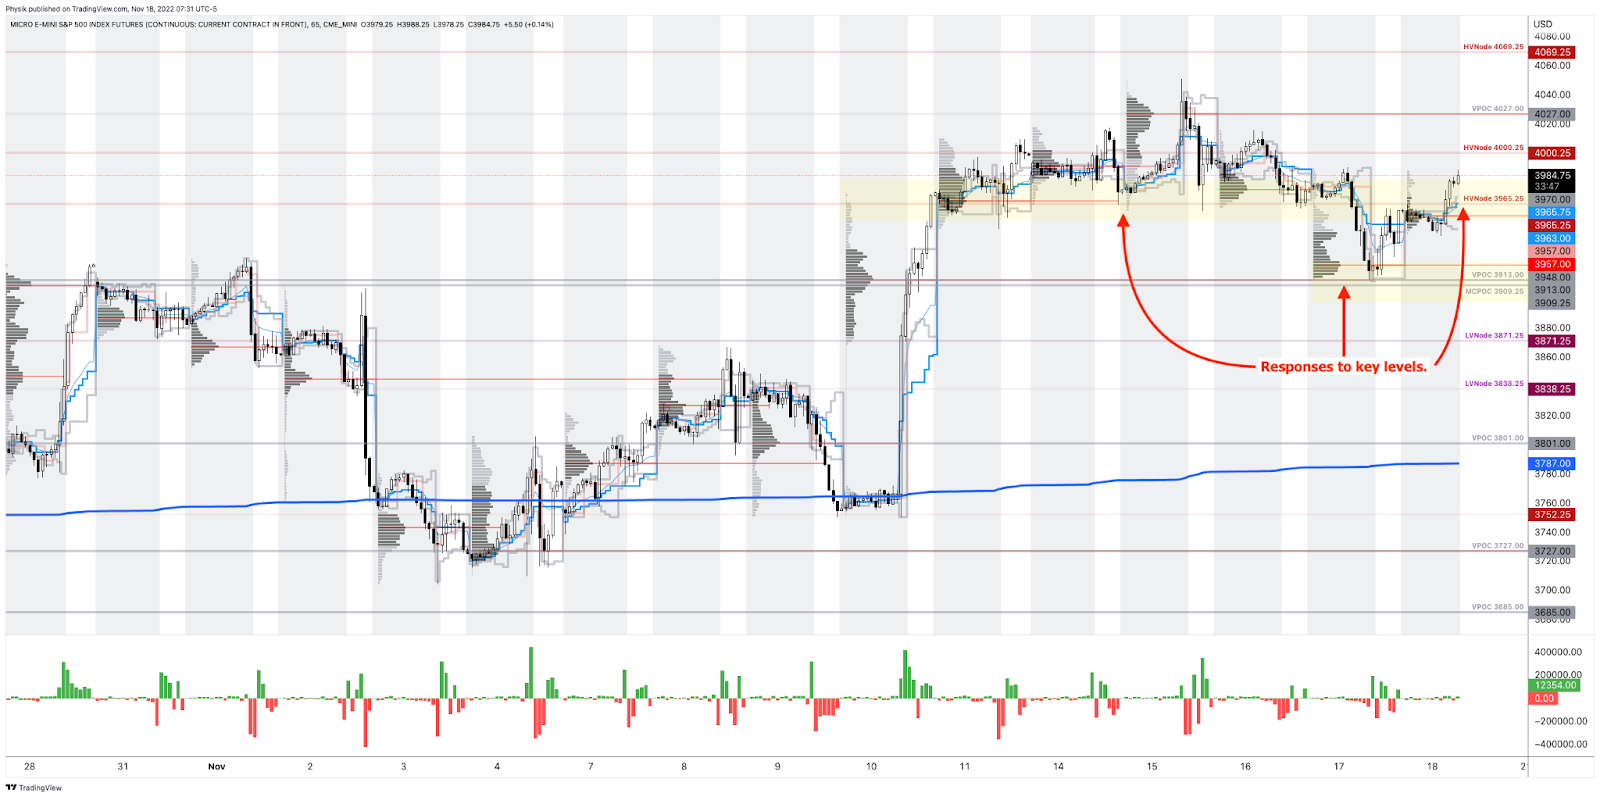
Our S&P 500 pivot for today is $3,965.25.
Key levels to the upside include $4,000.25, $4,027.00, and $4,069.25.
Key levels to the downside include $3,923.00, $3,871.25, and $3,838.25.
Click here to load today’s key levels into the web-based TradingView platform. All levels are derived using the 65-minute timeframe. New links are produced, daily.
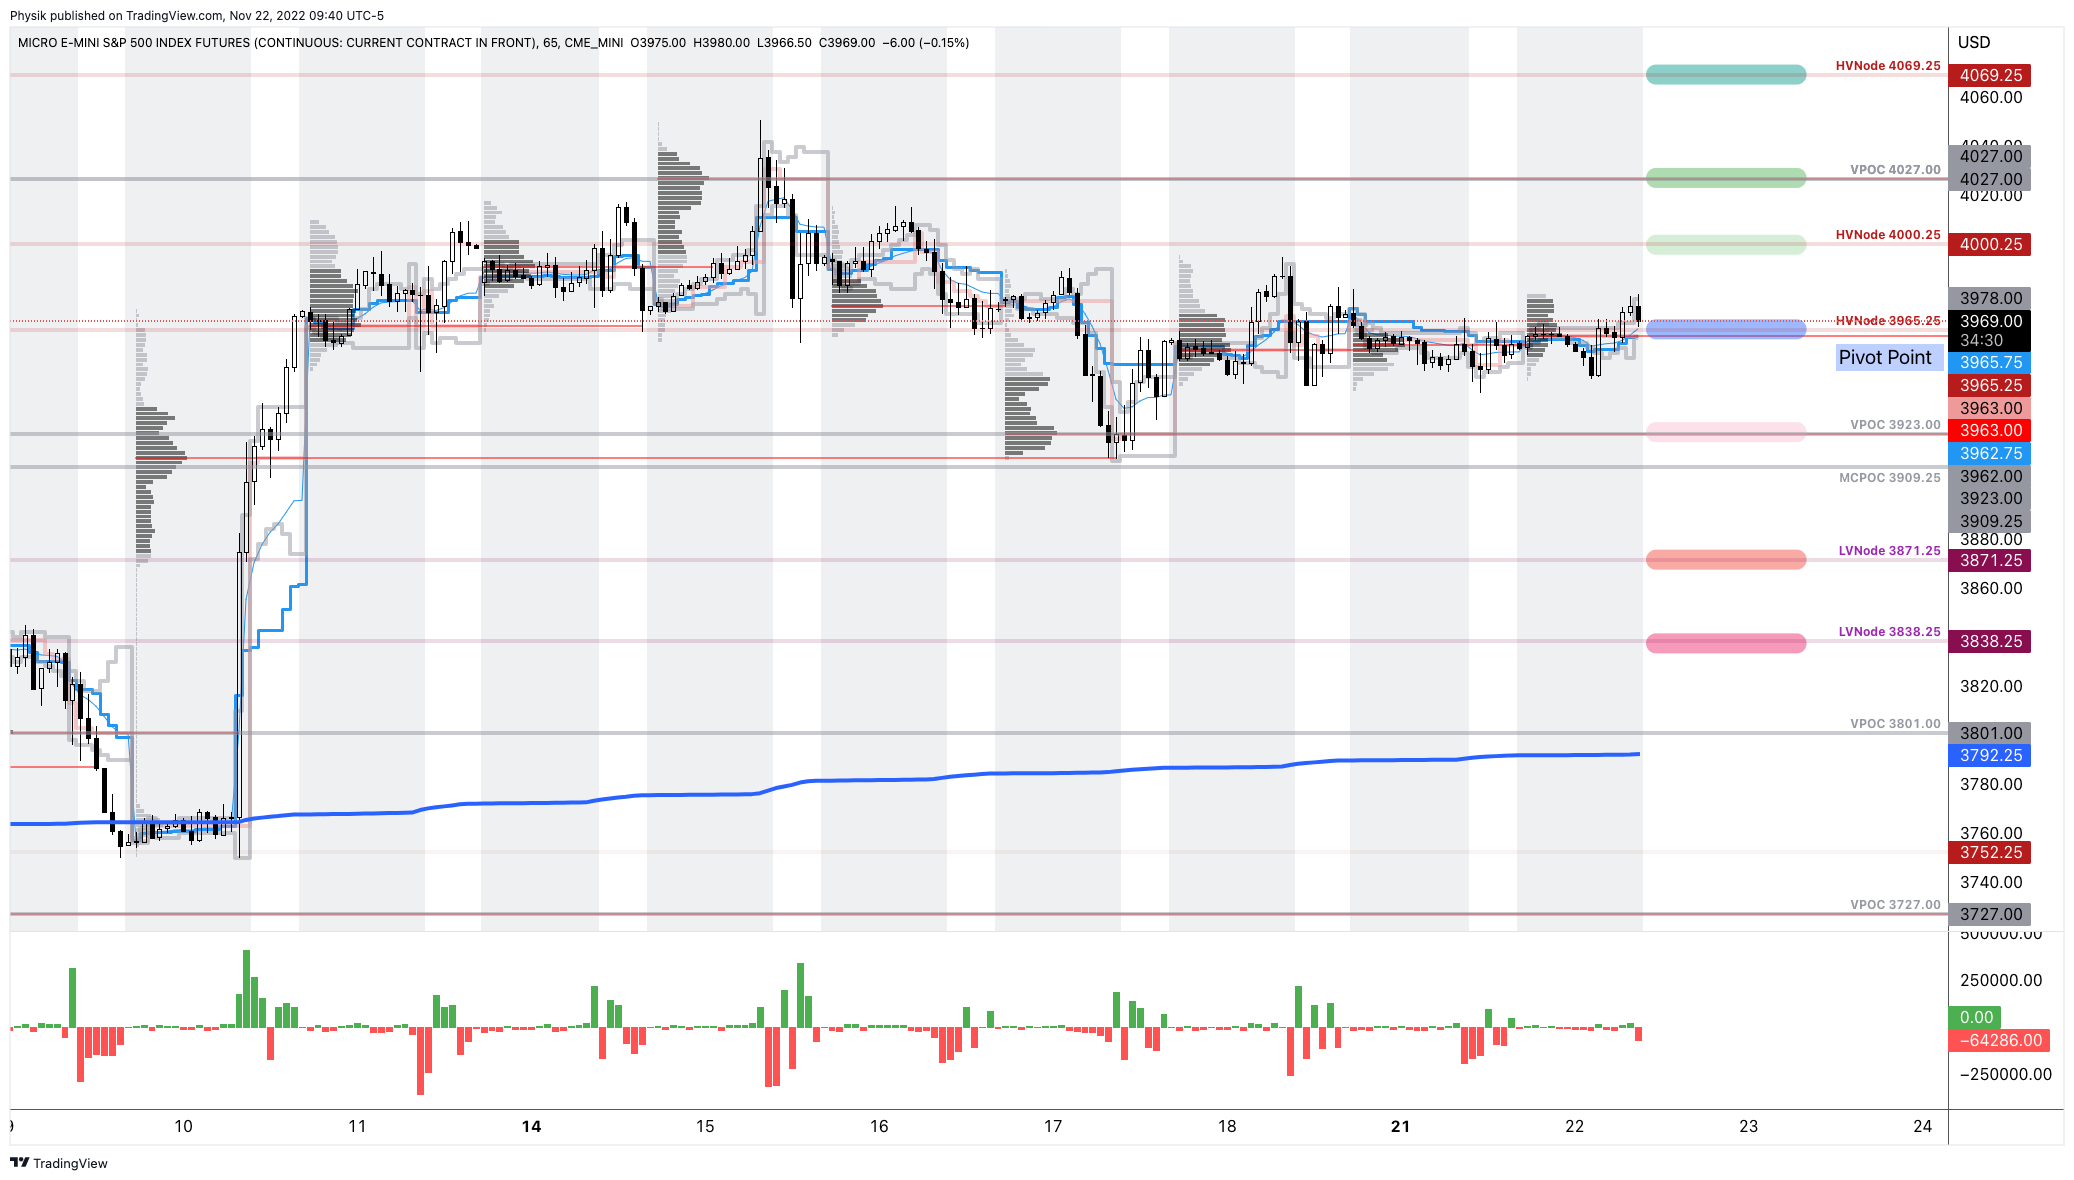
Graphic: 65-minute profile chart of the Micro E-mini S&P 500 Futures.
Considerations: Bigger participants, some of whom move by a committee and seldom respond to technical nuances, are likely waiting for more information before entering and initiating an expansion of the range. For that reason, our key levels have held to the tick, per the below.
Graphic: 65-minute profile chart of the Micro E-mini S&P 500 Futures.
Definitions:
Volume Areas: A structurally sound market will build on areas of high volume (HVNodes). Should the market trend for long periods of time, it will lack sound structure, identified as low volume areas (LVNodes). LVNodes denote directional conviction and ought to offer support on any test.
If participants were to auction and find acceptance into areas of prior low volume (LVNodes), then future discovery ought to be volatile and quick as participants look to HVNodes for favorable entry or exit.
POCs: POCs are valuable as they denote areas where two-sided trade was most prevalent in a prior day session. Participants will respond to future tests of value as they offer favorable entry and exit.
MCPOCs: POCs are valuable as they denote areas where two-sided trade was most prevalent over numerous day sessions. Participants will respond to future tests of value as they offer favorable entry and exit.
About
After years of self-education, strategy development, mentorship, and trial-and-error, Renato Leonard Capelj began trading full-time and founded Physik Invest to detail his methods, research, and performance in the markets.
Capelj also writes options market analyses at SpotGamma and is a Benzinga journalist.
Physik Invest’s Daily Brief is read by over 1,200 people. To join this community and learn about the fundamental and technical drivers of markets, subscribe below.
Graphic updated 9:00 AM ET. Sentiment Risk-On if expected /ES open is above the prior day’s range. /ES levels are derived from the profile graphic at the bottom of this letter. Levels may have changed since initially quoted; click here for the latest levels. SqueezeMetrics Dark Pool Index (DIX) and Gamma (GEX) with the latter calculated based on where the prior day’s reading falls with respect to the MAX and MIN of all occurrences available. A higher DIX is bullish. At the same time, the lower the GEX, the more (expected) volatility. Click to learn the implications of volatility, direction, and moneyness. Breadth reflects a reading of the prior day’s NYSE Advance/Decline indicator. VIX reflects a current reading of the CBOE Volatility Index (INDEX: VIX) from 0-100.
Fundamental
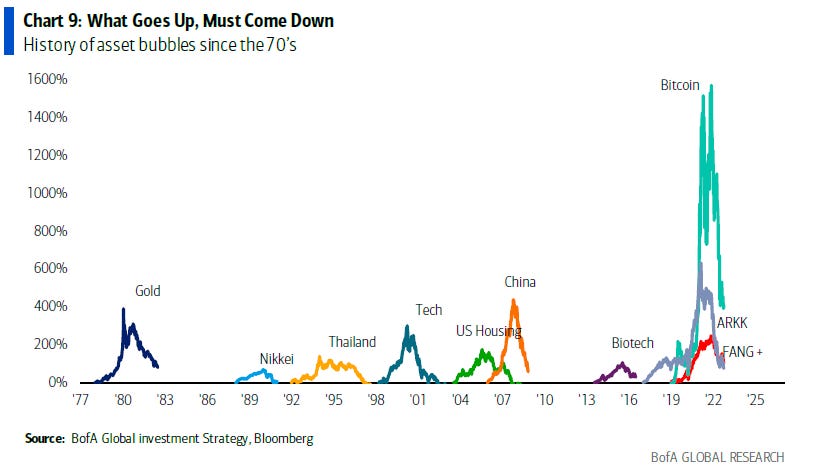
S&P Global Inc (NYSE: SPGI) put it really well in a recent update comparing today to the events of the mid-to-late 1630s. Dutch tulip bulbs traded as high as $750,000 per bulb (today’s money) before collapsing to near-zero.
That’s akin to what happened with the non-fungible token (NFT) craze of the late 2010s and early 2020s. Pictures of rocks sold for millions as recently as last year. Those pictures are worthless, now, and this has done a bit to dent the ecosystem’s apparent value, as well.
Graphic: Retrieved from Bank of America Corporation (NYSE: BAC) via @LanceRoberts.
What’s going on to cause this:
It’s basically the case that easy money policies enabled market participants to borrow and fund longer-duration bets on ideas with (potential) promise in the future.
Financial asset investments, too, were far more attractive, and that’s why we saw the asset inflation accelerate, followed by goods and services inflation that was bolstered by chokepoints and trends (e.g., deglobalization via supply chain security and geopolitics) and, ultimately, prompted policymakers to pivot.
i always used to assume the large sophisticated crypto firms were mostly focused on the high risk-adjusted-return relative value arb opportunities in the space: cross exchange arb, cash-futures basis; etc
FTX (CRYPTO: FTT) is among the victims of this pivot. It’s apparent that the events surrounding the collapse of crypto ecosystems months back prompted a so-called “credit crunch,” an insider close to FTX’s leadership explained.
“Many loaners suddenly recalled all of their loans just to see who was still liquid. Alameda lost a lot from giving out loans to firms [that] defaulted. Alameda was now, also, on the hook for money they didn’t have since they had given a lot of the loan money to FTX or had lost it loaning to now bankrupt counterparties. [Founder and CEO Sam Bankman-Fried] had two choices at this point, let Alameda get liquidated or send user money from FTX to ensure Alameda’s survival.”
Apart from “strong governance and transparency [to] grow in importance as the cryptocurrency industry attempts to reassure investors and customers, … regulation of cryptocurrency markets, which was already a matter of serious debate, could accelerate,” SPGI explained, noting that some “other areas of the decentralized finance [or DeFi] market may be affected. And lastly, these contagion effects are unlikely to ripple into traditional finance [or TradFi].”
Check out Reuters (FTX bankruptcy filings in, French central bank wants quick regulation) and The Information (Startups should prepare for ‘second order fallout’ from FTX collapse).
Simplify Asset Management’s Michael W. Green (who we quoted in the past for his perspective and belief that we are in “a dot-com type collapse” that’s happened “underneath the surface of the indices which is [a result of] … passive flows supporting the largest stocks within the index, whereas the smaller stocks can be influenced to a greater extent by [] discretionary managers”) said a likely result is a Central Bank Digital Currency (CBDC) and an “almost certain … change in the monetary system,” echoing what Kai Volatility’s Cem Karsan said a long-time ago: “I don’t see … a clear window where cryptocurrency is not subject to constraints and I think it’s highly likely that we move towards a digital dollar.”
CBDCs are highly controversial per my chats with the likes of Edge & Node’s Tegan Kline. She said they could “be used as a mass surveillance tool. Leaders have done little to invalidate her beliefs given their recent discussions on, for example, using CBDCs to derive “carbon footprint.”
That means having a read on where people are “traveling, how are they traveling, what are they eating, what are they consuming … This is something we’re working on,” leaders have put forth.
The point of this all is as follows:
As many may know, “there’s no ultimate buyer” in spaces like crypto and DeFi, as ex-Goldman Sachs Group Inc (NYSE: GS) emerging market FX and yield trader Seraphim Czecker, who is now heading risk and product management at Euler Labs, said.
It’s that and the persistent interest in illiquid products that leave the door open to manipulation. Barring illiquidity, “if there’s a 10 or 15 standard deviation move, the liquidity will allow for … you [to] offload those assets quickly.”
However, that’s not the widespread case.
“For example, look at what happened in the UK with the pension funds and margin calls. That is a classic DeFi strategy. You take your bonds and borrow cash against them. Then, you put it back into bonds and loop it a couple of times. That way, you have a leveraged interest rate exposure. That’s the same principle of lending staked Ethereum (CRYPTO: ETH), borrowing ETH, and doing it a couple of times.”
So, there may be “second order fallout” amid all this tightening. Markets, everywhere, are to de-rate. Ultimately, there’s probably a pivot to happen, in the future, with many leaders and strategists in finance unable to agree whether that (pivot) is the result of a recession.
Ukraine central bank says it is preparing banking system for blackouts. It is also suddenly clear that Ukraine might have had $ in FTX. They had partnered w FTX on donations. https://t.co/oZSOchz8bI + https://t.co/sDpXGNGuNn
“To take the foot off the brake right now and not finish the job, I think it’s the absolute worst mistake that the Fed could possibly make,” Citadel’s Ken Griffin said at the Bloomberg New Economy Forum in Singapore. In spite of Citadel seeing a recession averted, Griffin said: “I am finding it a bit hard to believe we are not going to have a recessionat that point of time, sometime in the middle to back half of 2023,” adding this year finishes with “modest growth.”
Those in agreement include Stanley Druckenmiller, who once managed George Soros’ funds. “You don’t even need to talk about Black Swans to be worried here. To me, the risk-reward of owning assets doesn’t make a lot of sense,” Druckenmiller said.
“When you make a mistake, you got to admit you’re wrong and move on that nine or 10 months, that [policymakers] just sat there and bought $120 billion in bonds,” he added. The “repercussions of that are going to be with us for a long, long time.”
Positioning
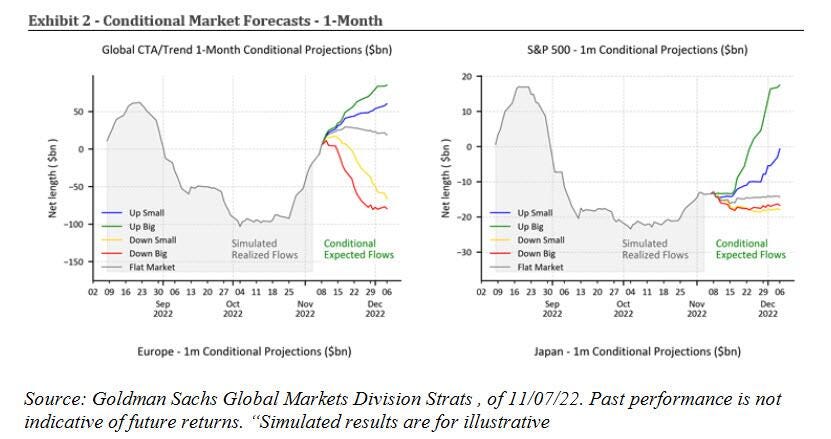
From a positioning perspective, much of what we’ve discussed in past notes is still true. Among others, Goldman Sachs Group Inc calculates up to $40 billion in buying over the next weeks with more than $80 billion of buying in an up market.
Graphic: Retrieved from @LanceRoberts. “Goldman calculates a whopping $38 billion to buy over the next week and substantially more (green line) if the market is up big. The chart below shows that the bank expects more than +$79 billion of net buying over the month.”
This is pursuant to our statements on the compression of implied volatility (evidenced by a shift lower in the term structure, particularly at the front end where options are most sensitive) compounding macro-type repositioning, with follow-on support coming from the reach for “Deltas and leverage” to the upside (call options).
Graphic: Retrieved from Goldman Sachs Group Inc (NYSE: GS).
As Alfonso Peccatiello of The Macro Compass puts it well: “incentive schemes drive people to be much more willing to pay and chase upside.”
Preferred are “convex structures” that would benefit from rallies.
However, in traders’ monetization of put protection they owned, as well as reach for upside calls (to not miss out on a potential reversal), skew is at its lows.
Graphic: Retrieved from The Ambrus Group’s Kris Sidial. “2017 is a year that is notorious for extremely low implied and realized vol. It is fascinating to see how insanely low the call-side volatility has been this year. There is low vol and then there is, in the gutter low vol.”
If the assumption is that “further tightening monetary policy and draining liquidity off the market might cause some problems down the road,” per Fabian Wintersberger, downside convexity (bets that trade non-linearly to changes in underlying price and volatility) are attractive.
Graphic: Retrieved from Banco Santander SA (NYSE: SAN).
Trades that may be attractive include collars, as well explained in a recent thread by IPS Strategic Capital’s Pat Hennessy.
“[T]he combination of historically flat skew [and] the highest rates we’ve seen in 15 years makes longer dated collars an attractive trade for those who are worried about the performance of stocks over the next year but do not want to sell or try timing the market.”
Technical
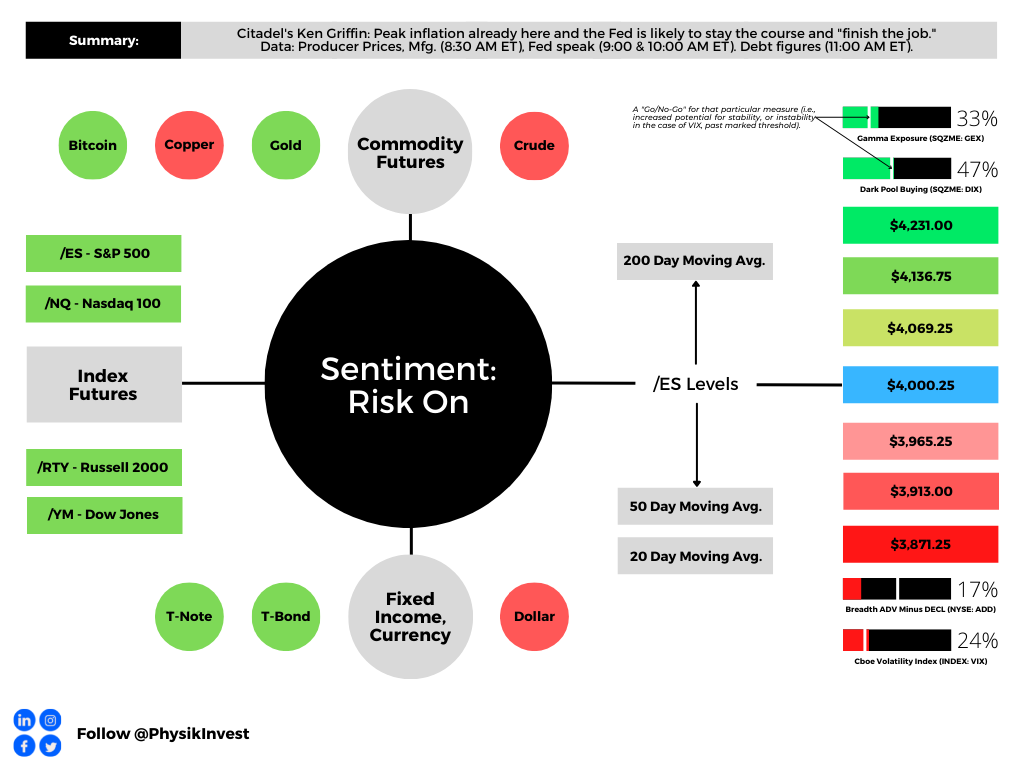
As of 9:00 AM ET, Tuesday’s regular session (9:30 AM – 4:00 PM ET), in the S&P 500, is likely to open in the upper part of a positively skewed overnight inventory, outside of prior-range and -value, suggesting a potential for immediate directional opportunity.
Our S&P 500 pivot for today is $4,000.25.
Key levels to the upside include $4,069.25, $4,136.75, and $4,231.00.
Key levels to the downside include $3,965.25, $3,913.00, and $3,871.25.
Click here to load today’s key levels into the web-based TradingView platform. All levels are derived using the 65-minute timeframe. New links are produced, daily.
Graphic: 65-minute profile chart of the Micro E-mini S&P 500 Futures.
Definitions
Volume Areas: A structurally sound market will build on areas of high volume (HVNodes). Should the market trend for long periods of time, it will lack sound structure, identified as low volume areas (LVNodes). LVNodes denote directional conviction and ought to offer support on any test.
If participants were to auction and find acceptance into areas of prior low volume (LVNodes), then future discovery ought to be volatile and quick as participants look to HVNodes for favorable entry or exit.
POCs: POCs are valuable as they denote areas where two-sided trade was most prevalent in a prior day session. Participants will respond to future tests of value as they offer favorable entry and exit.
MCPOCs: POCs are valuable as they denote areas where two-sided trade was most prevalent over numerous day sessions. Participants will respond to future tests of value as they offer favorable entry and exit.
About
After years of self-education, strategy development, mentorship, and trial-and-error, Renato Leonard Capelj began trading full-time and founded Physik Invest to detail his methods, research, and performance in the markets.
Capelj also develops insights around impactful options market dynamics at SpotGamma and is a Benzinga journalist.
The daily brief is a free glimpse into the prevailing fundamental and technical drivers of U.S. equity market products. Join the 1,190+ that read this report daily, below!
Graphic updated 11:00 AM ET. Sentiment Neutral if expected /ES open is inside of the prior day’s range. /ES levels are derived from the profile graphic at the bottom of the following section. Levels may have changed since initially quoted; click here for the latest levels. SqueezeMetrics Dark Pool Index (DIX) and Gamma (GEX) calculations are based on where the prior day’s reading falls with respect to the MAX and MIN of all occurrences available. A higher DIX is bullish. At the same time, the lower the GEX, the more (expected) volatility. Learn the implications of volatility, direction, and moneyness. Breadth reflects a reading of the prior day’s NYSE Advance/Decline indicator. VIX reflects a current reading of the CBOE Volatility Index (INDEX: VIX) from 0-100.
Administrative
After a one-month hiatus, the Daily Brief by Physik Invest is back, albeit with new inspiration and direction.
Previously, the letter was focused on analyses of secondary and tertiary sources. New for the letter will be the inclusion of primary source information. It will be some time before these changes are most noticeable but that’s the general direction.
For instance, interviewing a country’s economic minister on policy and discussing how that policy impacts markets, at the end of it all, is on the table.
That said, apologies for not being there for the past month. I found a lot happened and I could not rid myself of the desire to unpack. This letter helps me structure trades through which real capital is at risk.
Not having the full picture did me a disservice, in short.
Going forward, I will try to feature a good mix of detail and pointedness. Take care and I look forward to learning and earning together!
Fundamental
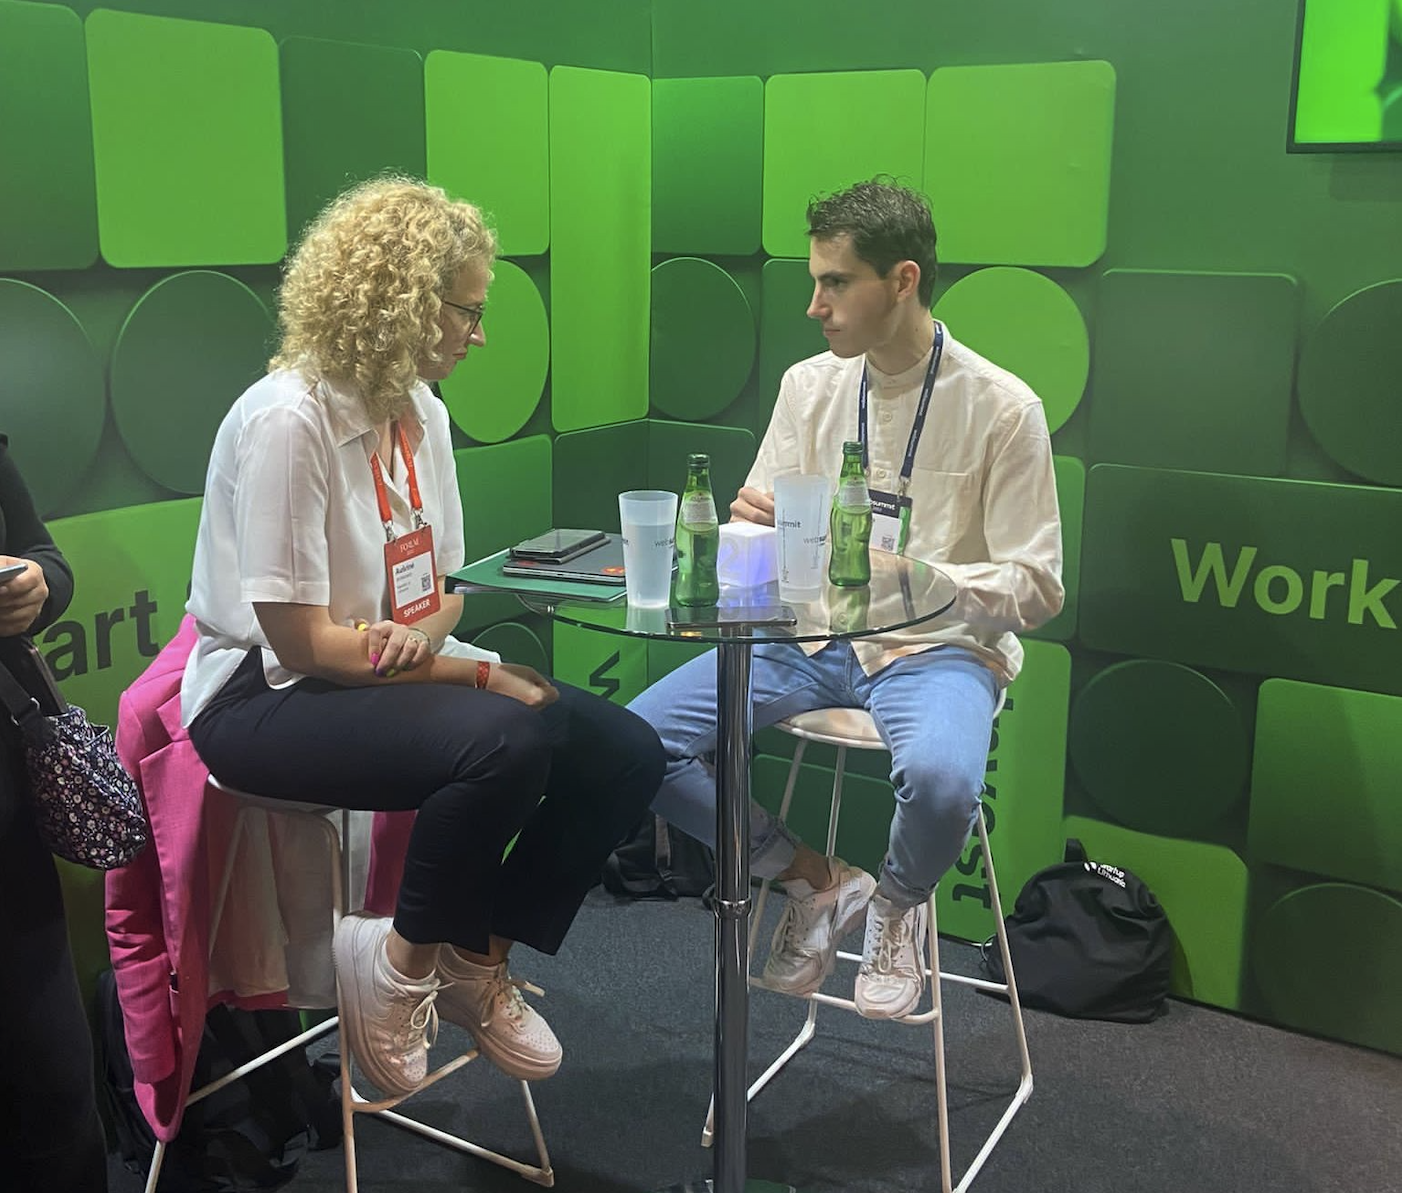
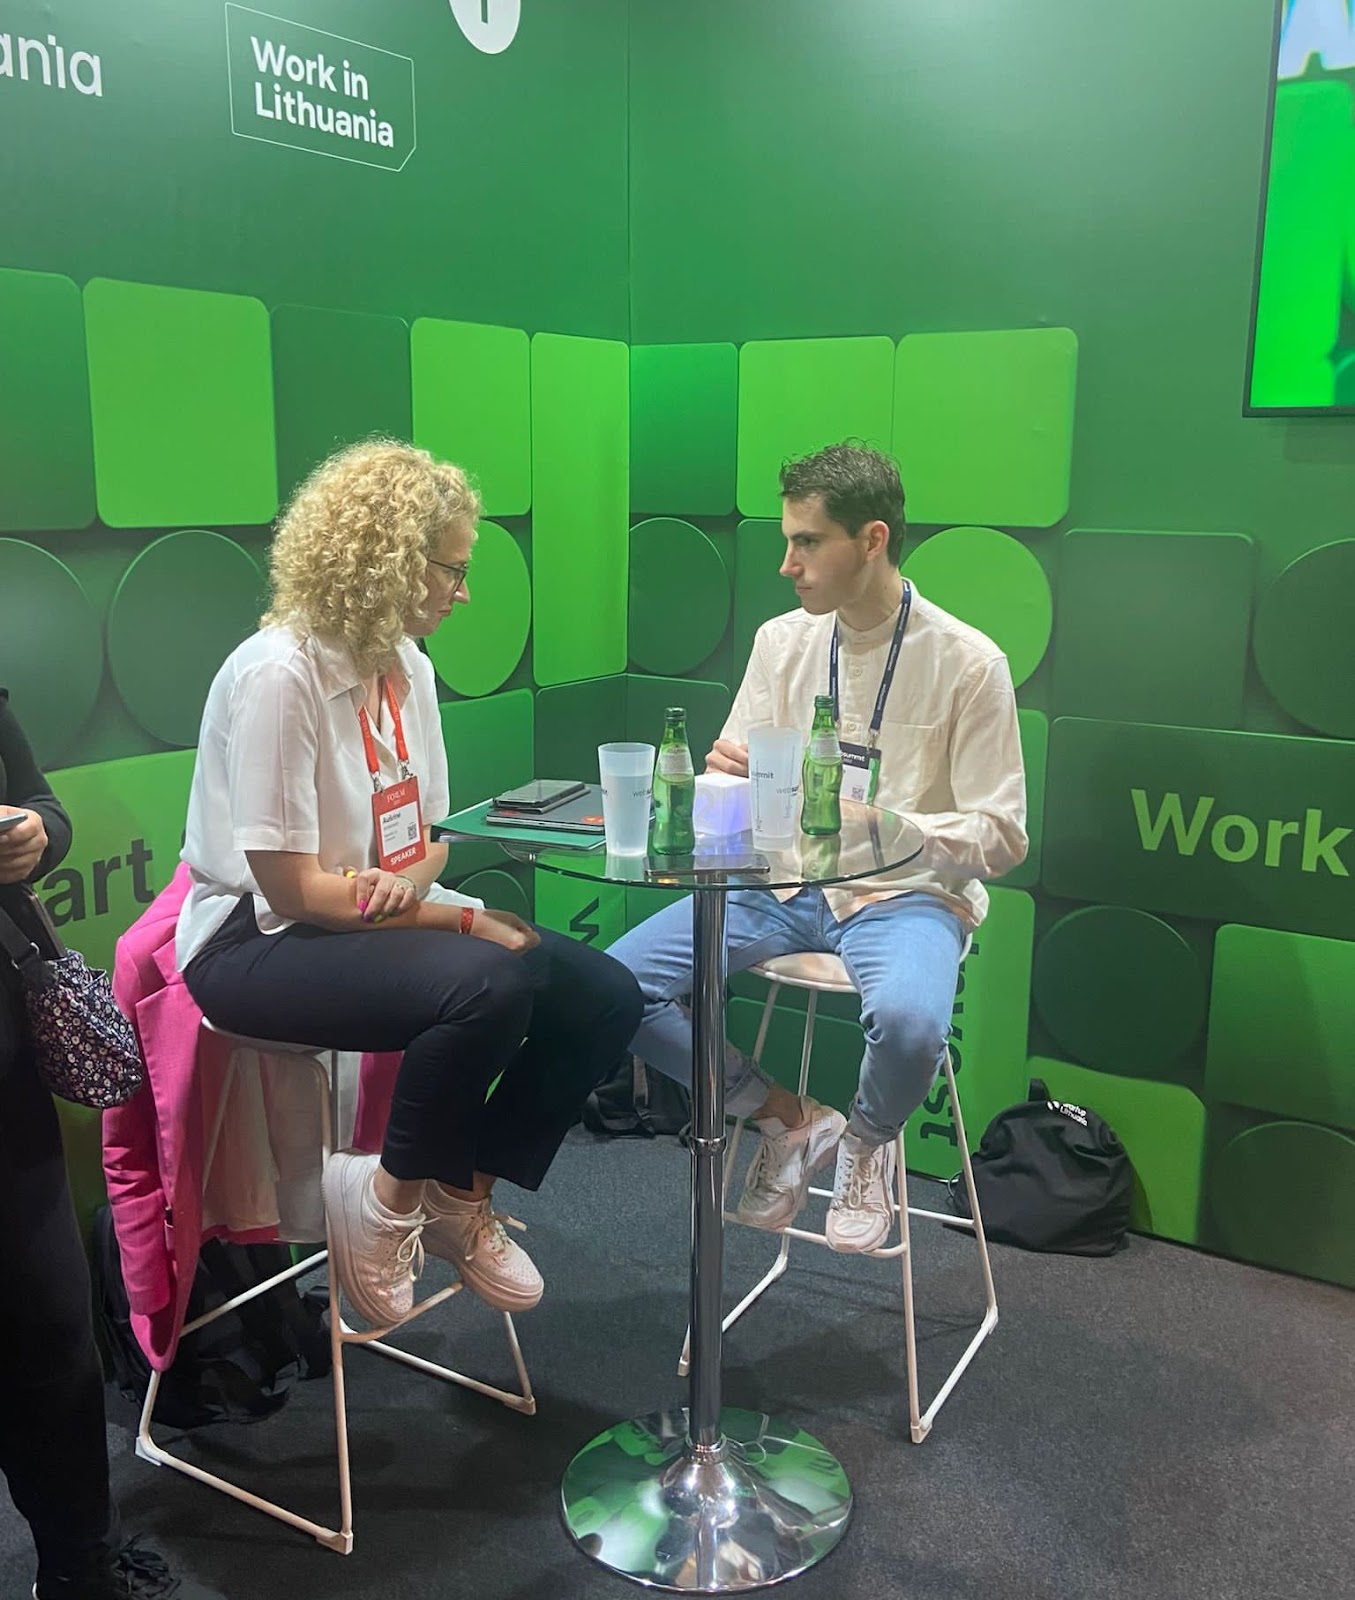
Weekend news was centered around the tightening of financial conditions, the impact of central bank action, as well as geopolitics (e.g., Lithuania opening a trade office in Taiwan), and supply chokepoints.
By happenstance, I interviewed the Lithuanian Economy Minister Ausrine Armonaite, quoted by Bloomberg in the above story, last week in Lisbon. More on this, later.
Graphic: Provided by the Lithuanian Delegation. Left, Lithuanian Economy Minister Ausrine Armonaite. Right, Renato Leonard Capelj conducting an interview on behalf of Benzinga.com.
The One Big Thing:
With labor still tight, former New York Fed President Bill Dudley commented that “there’s a lot of work to do … [so] inflation expectations don’t become unanchored” and force “something really, really harsh later.”
Unfortunately, the impact of actions here, in the US, is not isolated.
US tightening pains the rest of the world, too. Stronger dollars pressure emerging-market economies with dollar-denominated debts. This, ultimately, works to upend the dollar’s role as a reserve.
Margin Compression, Dollar Debt:
Dollar strength feeds margin compression (just now filtering through, according to Kai Volatility’s Cem Karsan, and impacting dollar-denominated debt), adding to the “billion[s] less in demand for assets per day” via quantitative tightening (QT).
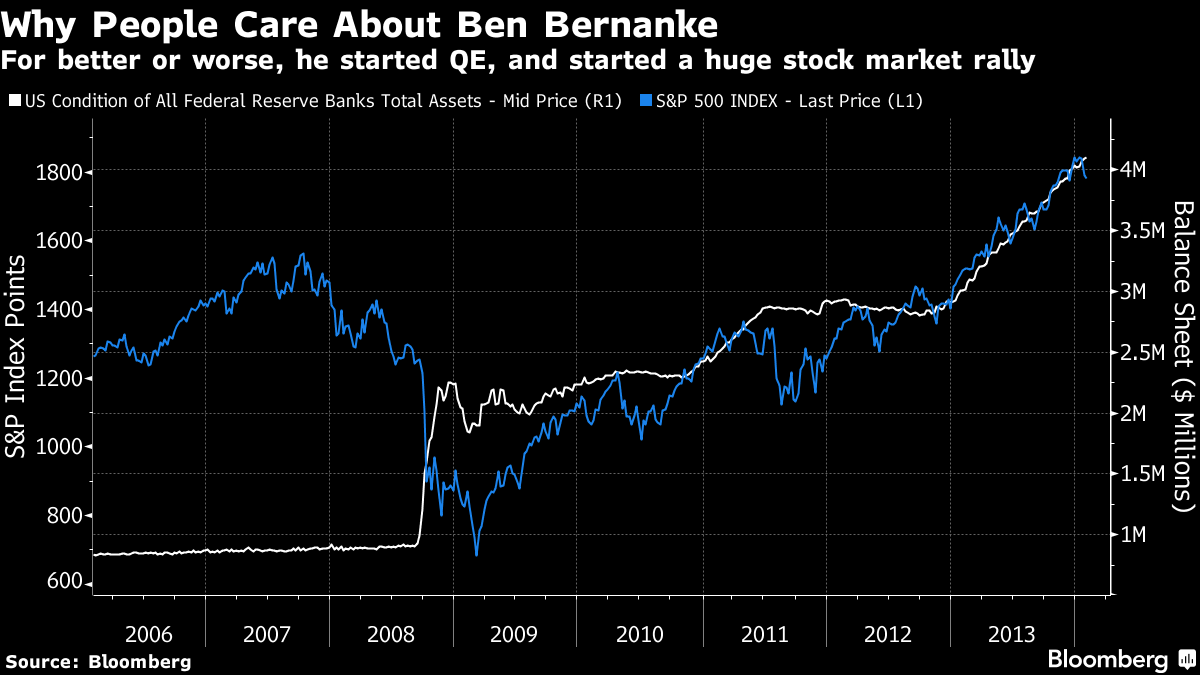
As a refresher, quantitative easing (QE) lowers interest rates and makes investments in financial assets more attractive. This bolsters asset inflation and deflation in the real economy.
Graphic: Retrieved from Bloomberg. The chart is an example showing “money-printing or ‘quantitative easing’ that [Ben Bernanke] pioneered seemed to prop up the stock market.”
QT Compounds Rising Rate Impact:
Moreover, in 2020, policymakers embarked on historic interventions.
Monetary authorities cut interest rates and bought bonds, all the while money was sent to people. Risk assets were the first to respond. Then, as the economy reopened, demand picked up, supply chains (that were slowed) tightened, and prices in the real economy inflated.
Threats to globalization and persistent supply chokepoints (e.g., Ukraine and Russia) have done little to help. Inflation remains a problem and investors are seeking safety amid Fed intervention.
Financial assets are in less demand while real assets are in more demand; sticky inflation and the policymaker reactions are putting in jeopardy dollar carry (mentioned above) and the S&P 500, a focus point for this letter and a center of the global carry regime, among other things.
Responses Invoke Collateral Damage:
As Credit Suisse Group AG’s Zoltan Pozsar summarizes, inflation is a structural issue, and “we [have] to generate a round of negative wealth effects to lower demand such that it becomes more in line with the new realities of supply.”
That invokes “collateral damage to the US economy,” S&P Global Inc (NYSE: SPGI) economists have put forth “as households and businesses pull back spending and investment.”
Ultimately, “[a]s demand erodes, businesses that changed inventory strategy to ‘just-in-case’ from ‘just-in-time’ are left with full shelves to unwind at a loss and less need for workers that were in high demand just a few months ago.” That’s a recession.
Positioning
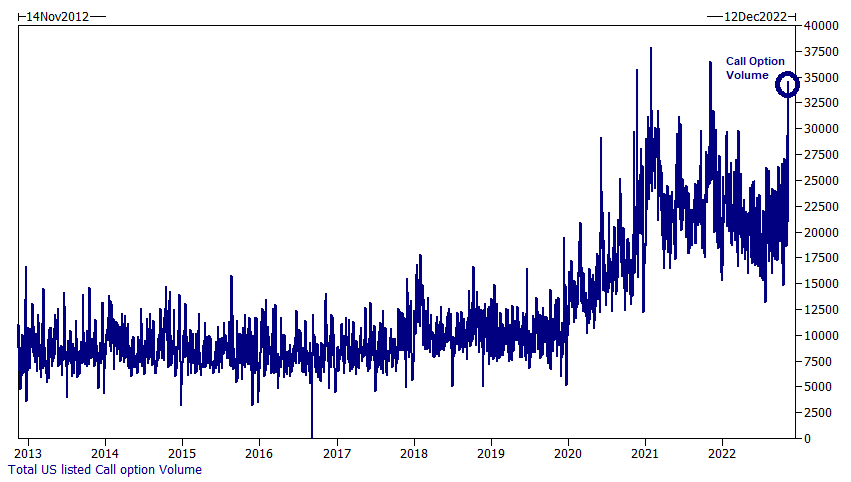
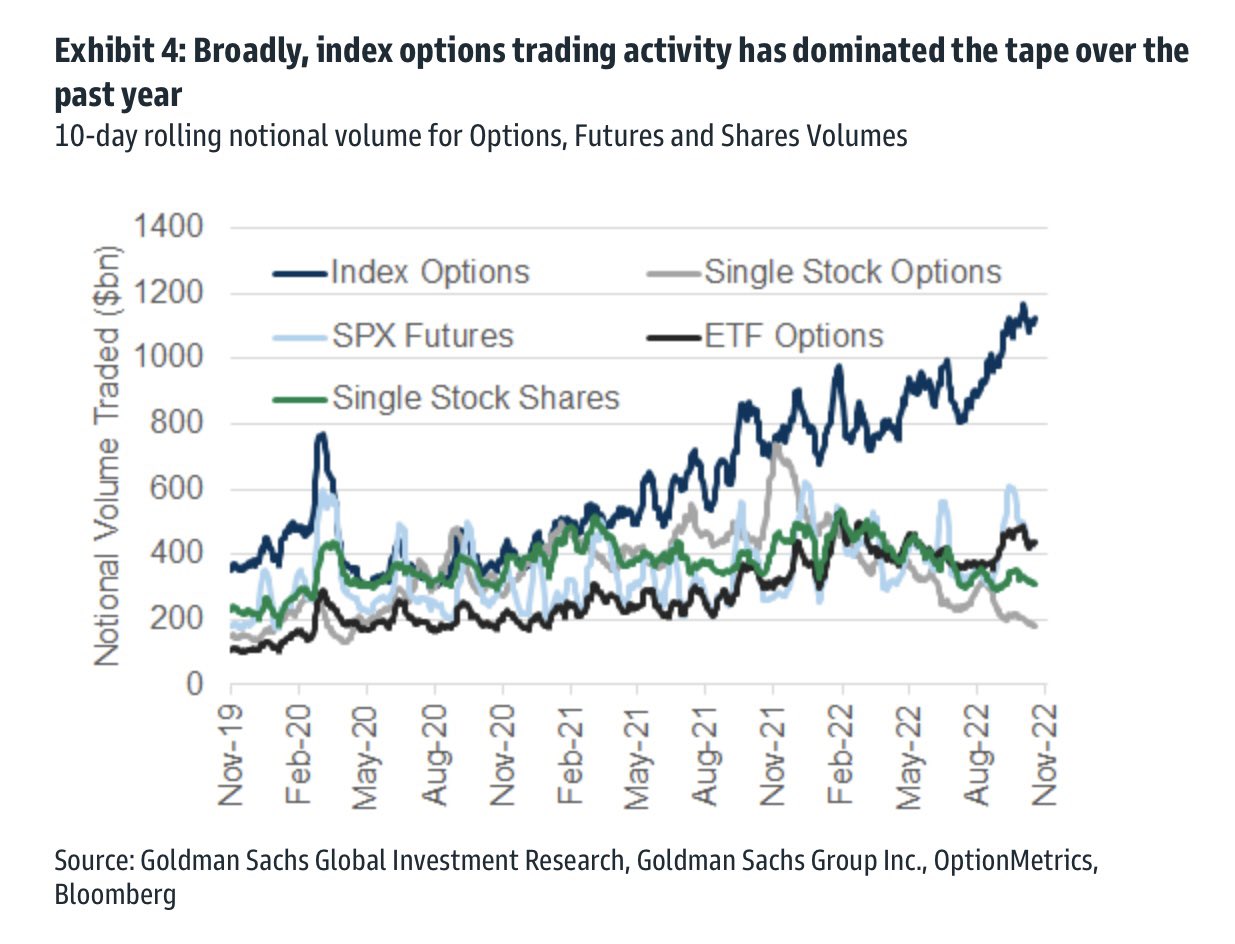
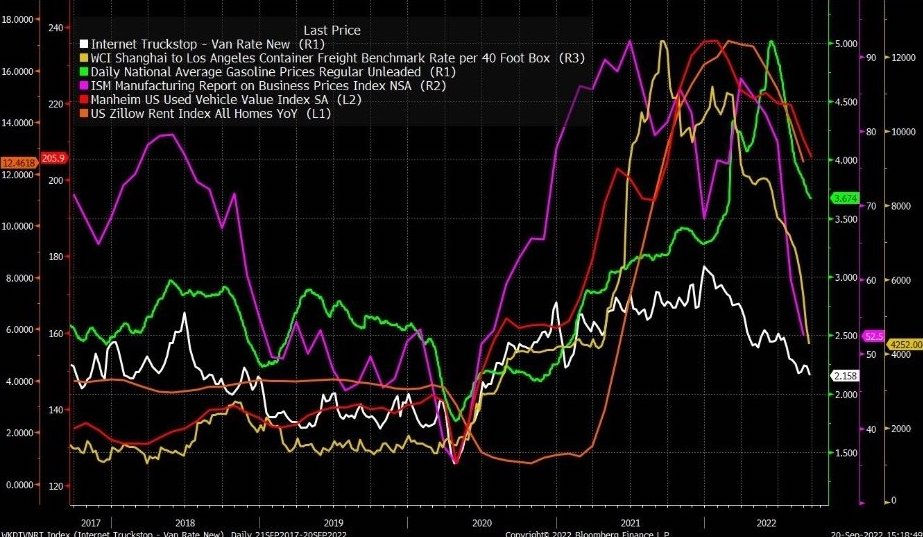
Equity market implied volatility (IVOL) remains subdued and part of the blame rests on the (1) growth of derivatives and …
Graphic: Retrieved from Goldman Sachs Group Inc (NYSE: GS). Reposted by Rob Emrich III.
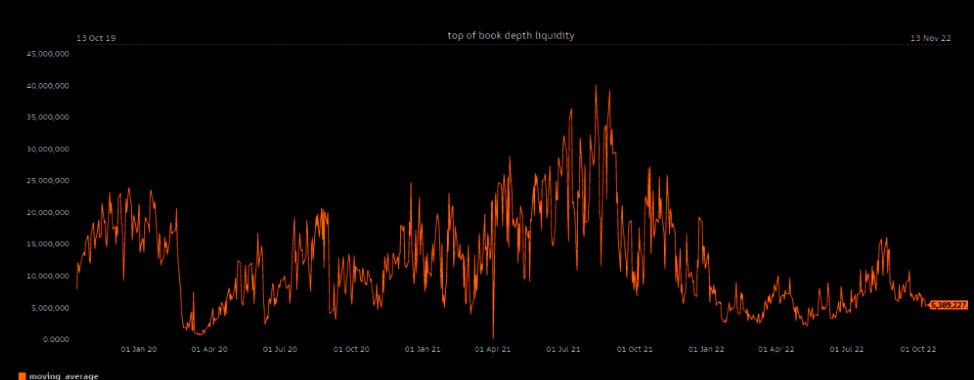
(2) a lower liquidity environment in which the hedging of these derivatives matters more.
Graphic: Retrieved from Goldman Sachs Group Inc (NYSE: GS). Taken from The Market Ear.
To recap, equity IVOL remains subdued, in part, because traders hedged into the 2022 decline.
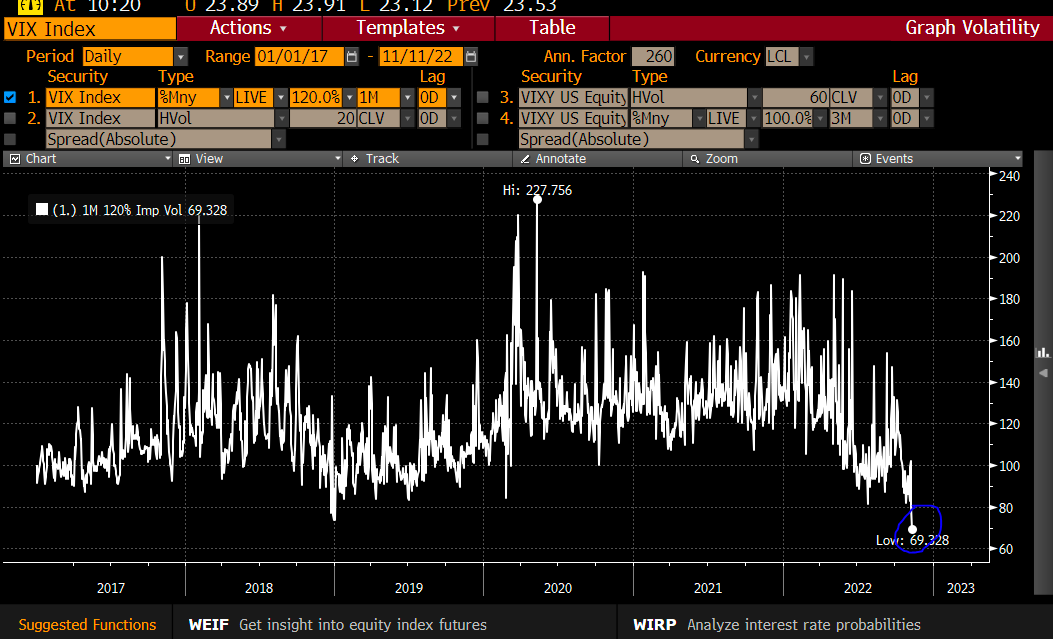
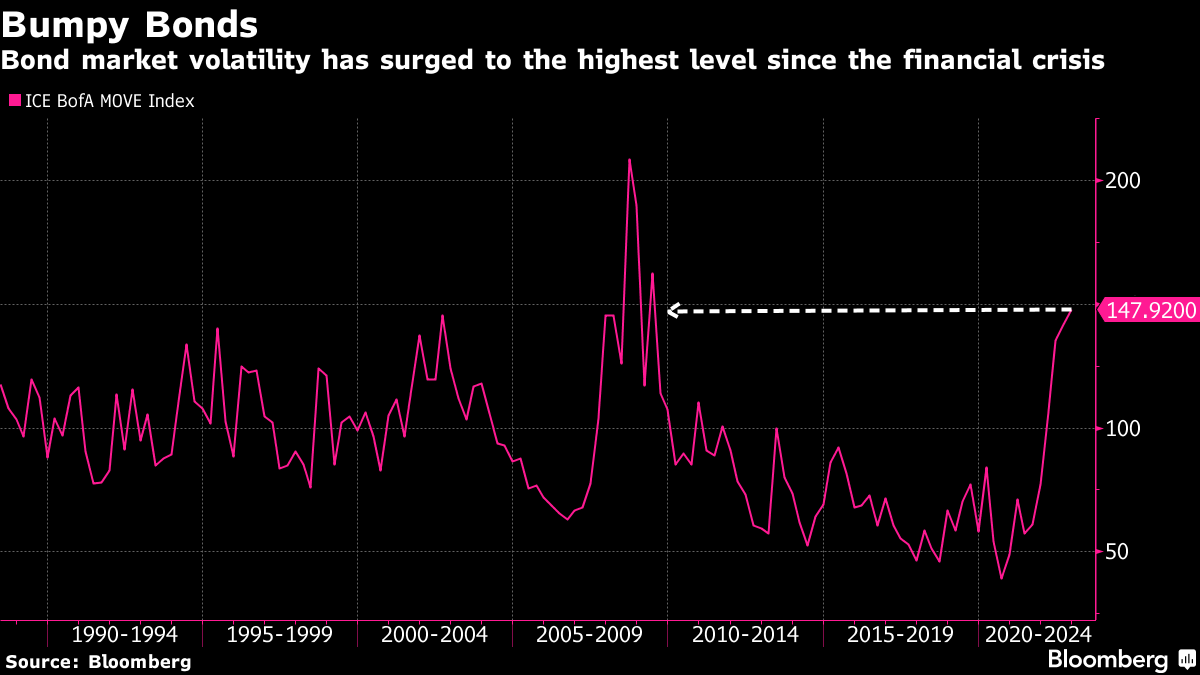
The liquidity providers’ response to the monetization of protection (i.e., trader sell put → liquidity provider buy put and stock and/or futures to hedge), as well as decreases in demand for equity exposure (and new protection), is keeping the Cboe Volatility Index (INDEX: VIX) tame while measures such as the Merrill Lynch Options Volatility Estimate (INDEX: MOVE) are surging.
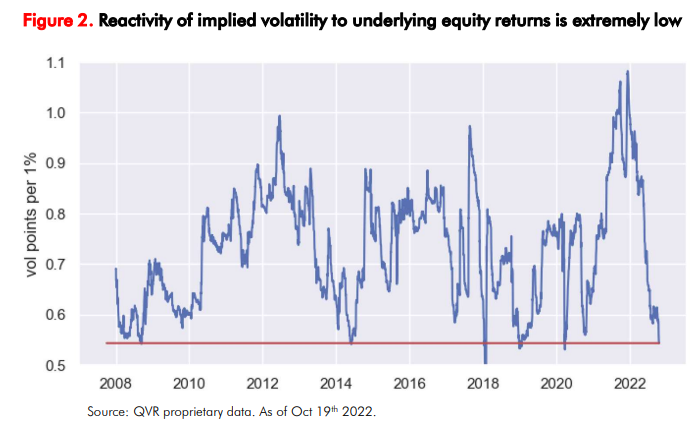
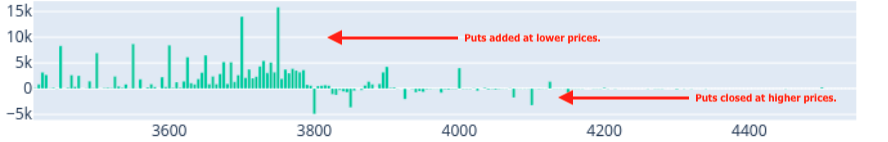
As well put in a recent Bloomberg article quoting QVR Advisors’ Benn Eifert, “[e]veryone was prepared for another jarring market crash, and that, in essence, is why certain categories of protective options have failed to pay off this year.”
Graphic: Retrieved from Bloomberg. Initially created by QVR Advisors. “When shares drop, demand for fresh protection remains subdued given the unusually thin positioning among big money. At the same time, put owners quickly book profits, often leading to a drop in implied vol.
In support, IPS Strategic Capital’s Pat Hennessy puts forth that equity positioning is light and, “[I]f you have little to no equity exposure to hedge, why would you be buying puts?” That is all the while “[t]he last 5 years is still fresh in PMs heads though. This means that they have been quick to buy calls on any sign of a market bounce.”
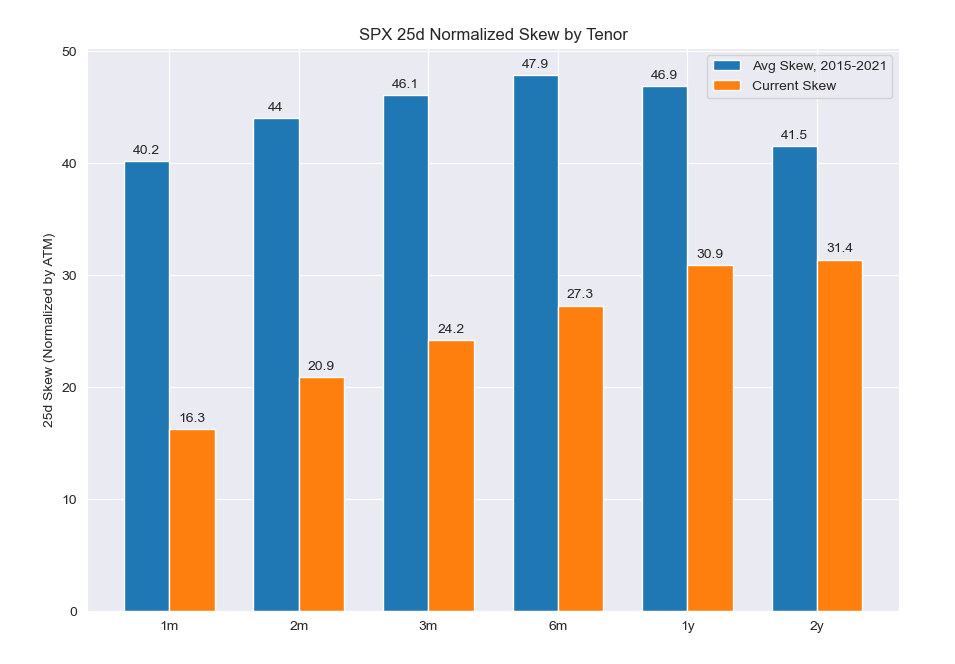
Another takeaway is that with skew at “near all-time lows, … [and] the highest rates we’ve seen in 15 years, [] longer dated collars [are] an attractive trade for those who are worried about the performance of stocks over the next year but do not want to sell or try timing the market.”
Graphic: Retrieved from Pat Hennessy of IPS Strategic Capital.
A last big takeaway includes some loss of structural support from hedging flows.
To explain, often, traders hedge into impactful events such as elections and Fed rate decisions. The demand for protection will pressure markets indirectly. After, however, the decay, as well as the removal of that protection, indirectly supports the market.
Graphic: Retrieved from Bespoke on Twitter. Into Fed days, traders often demand protection. Barring the worst case, traders’ closure of this protection bolsters a price rise, after. The same has been observed after elections (e.g., November 2020 election bottom).
As it sits, traders are hedged into events such as the elections. Per SpotGamma, “[i]f nothing bad happens, and traders close those puts, that would likely bolster a rally.”
This coincides with the market’s entry into a period of lower liquidity (i.e., the holiday season). It’s during this period the effects of decay accelerate and a lack of liquidity, per Karsan, makes markets sensitive to those positive positioning flows.
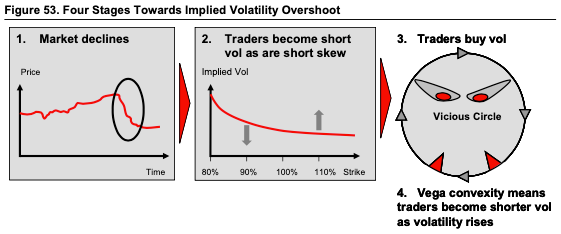
Ultimately, the very poor hedging that’s going on, heading into the next rally, is going to set the stage for a large tail, Karsan adds. Traders, who aren’t as well hedged, will seek protection and this will pressure markets, adding to any macro-type selling.
More explanation in the coming letters.
Technical
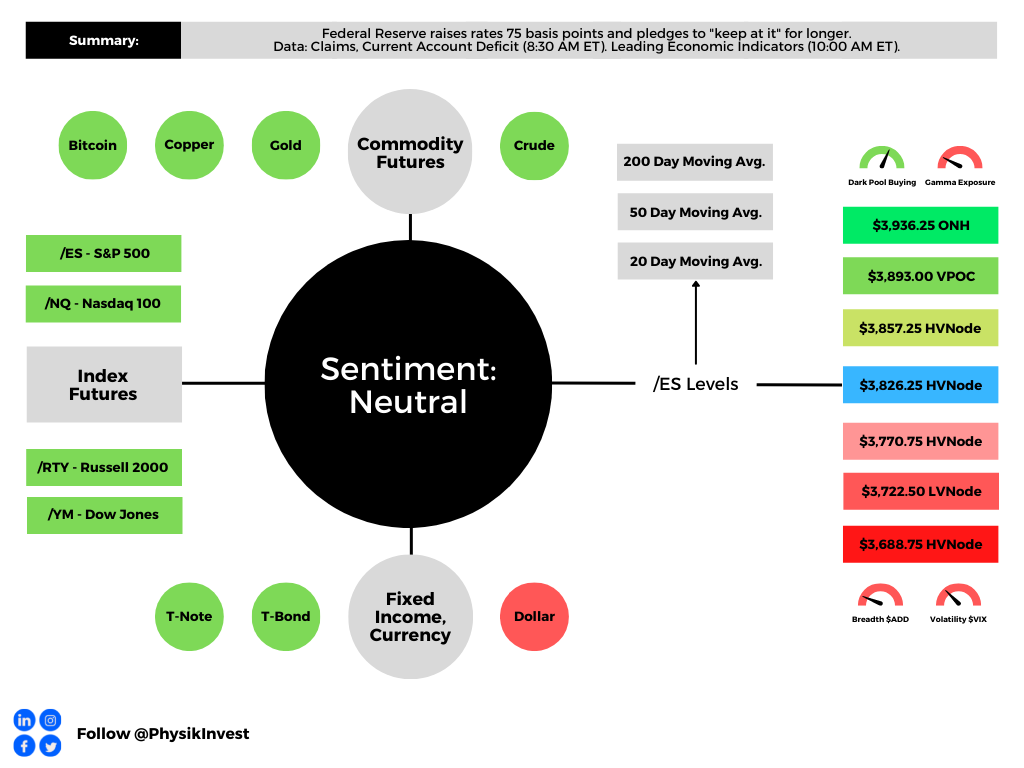
As of 6:30 AM ET, Monday’s regular session (9:30 AM – 4:00 PM ET), in the S&P 500, is likely to open in the upper part of a positively skewed overnight inventory, inside of prior-range and -value, suggesting a limited potential for immediate directional opportunity.
In the best case, the S&P 500 trades higher.
Any activity above the $3,806.25 LVNode puts into play the $3,845.00 VPOC. Initiative trade beyond the VPOC could reach as high as the $3,874.25 HVNode and $3,909.25 MCPOC, or higher.
In the worst case, the S&P 500 trades lower.
Any activity below the $3,806.25 LVNode puts into play the $3,773.00 VPOC. Initiative trade beyond the VPOC could reach as low as the $3,727.00 and $3,685.00 VPOC, or lower.
Click here to load today’s key levels into the web-based TradingView charting platform. Note that all levels are derived using the 65-minute timeframe. New links are produced, daily.
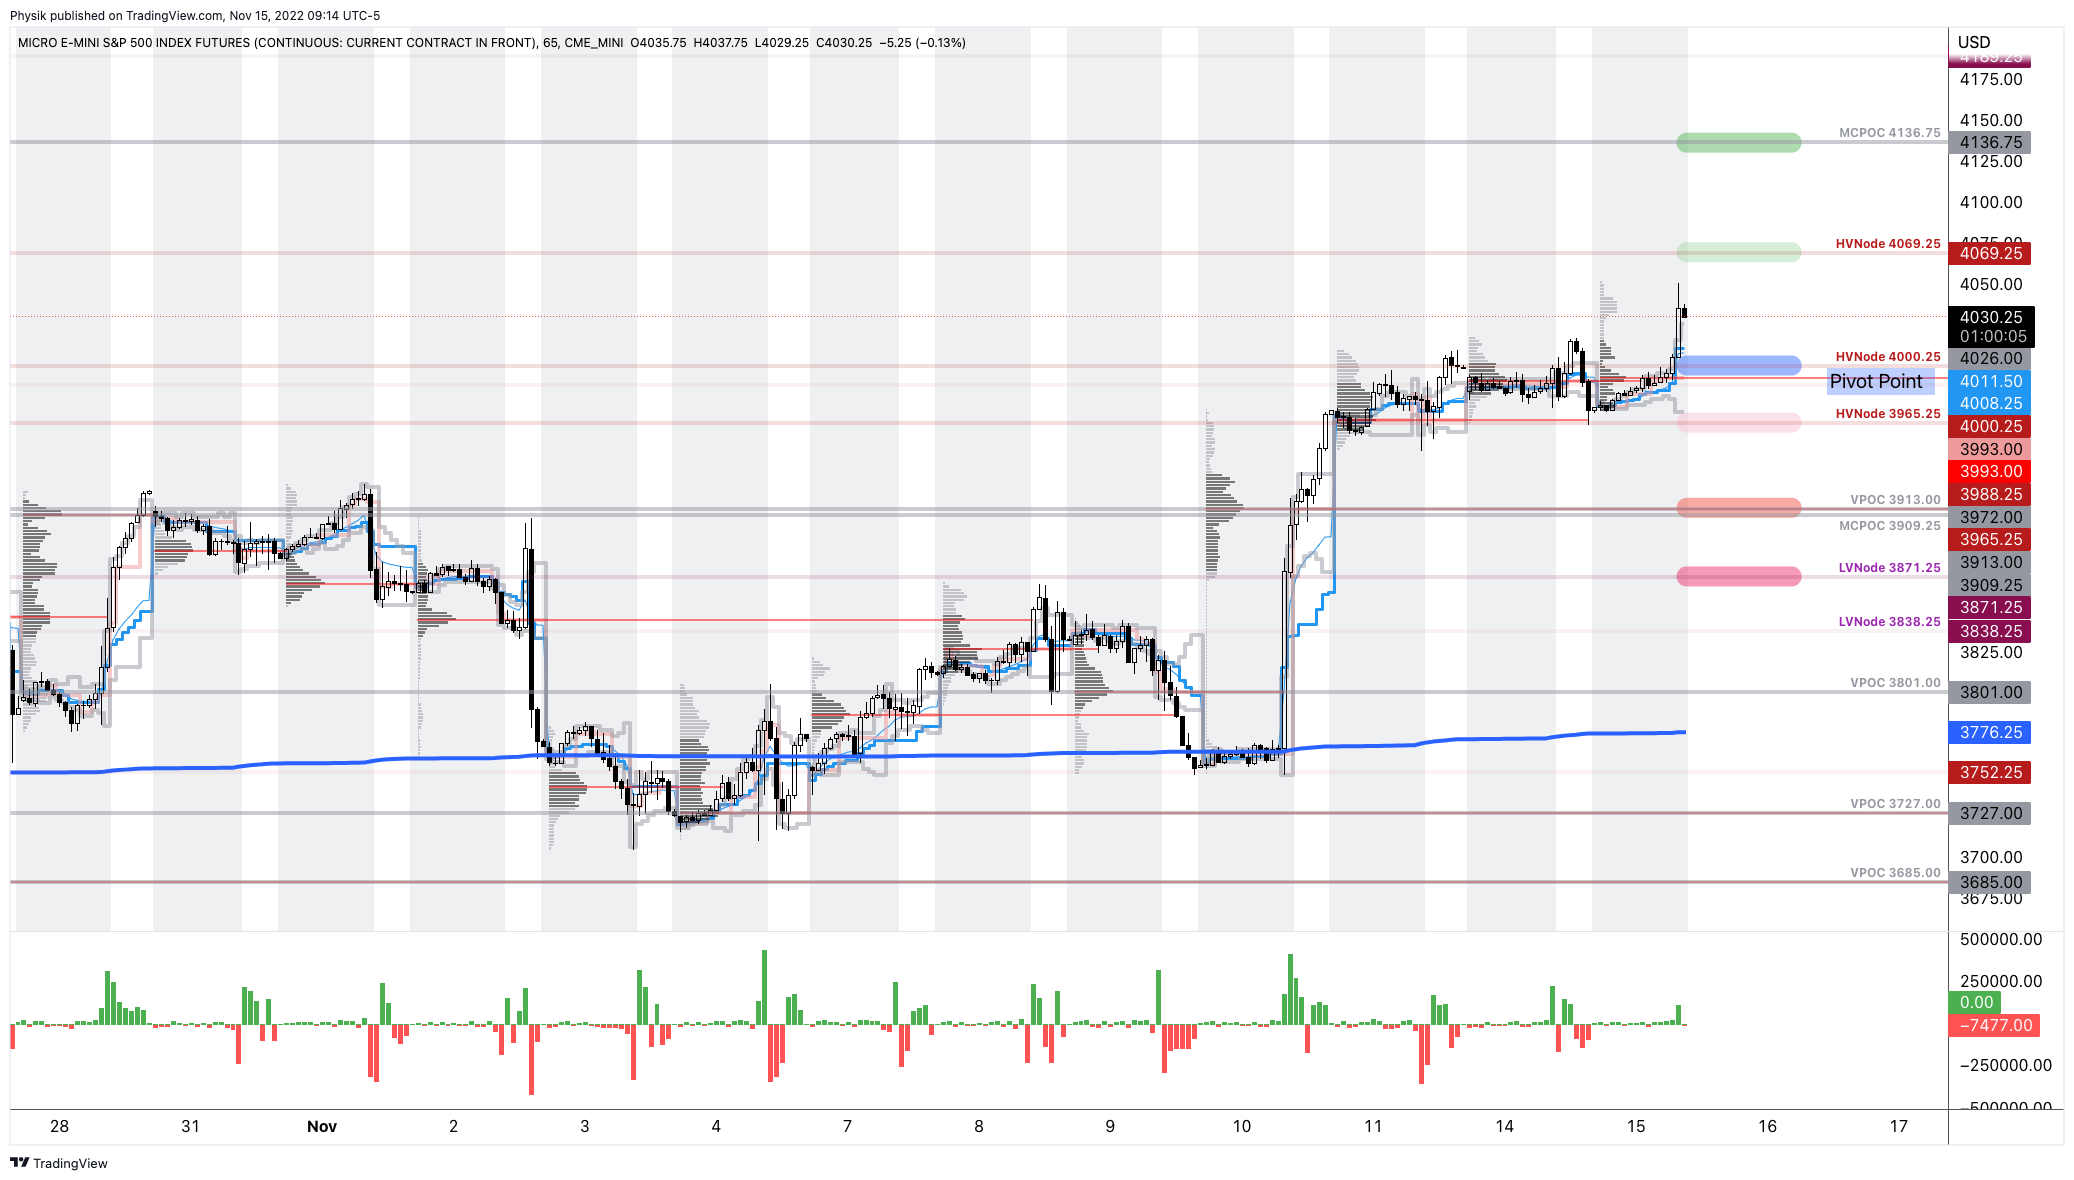
Graphic: 65-minute profile chart of the Micro E-mini S&P 500 Futures.
Considerations: Futures tied to the S&P 500 are trading within close proximity to a blue line in the above graphic. This blue line depicts a volume-weighted average price (VWAP) anchored to price action following the release of consumer price data on September 13, 2022.
The VWAP metric is highly regarded by chief investment officers, among other participants, for the quality of trade. Additionally, liquidity algorithms are benchmarked and programmed to buy and sell around VWAPs.
Should the S&P 500 auction away from this level, and come back to it, a prudent response is to fade. If the price is above the VWAP, and it auctions lower, into the VWAP, traders would buy. On the other hand, if the price is below the VWAP, and it auctions higher, into the VWAP, sell.
At this time, S&P 500 prices are near VWAP offering traders lower (directional) opportunities.
Definitions
Volume Areas: A structurally sound market will build on areas of high volume (HVNodes). Should the market trend for long periods of time, it will lack sound structure, identified as low volume areas (LVNodes). LVNodes denote directional conviction and ought to offer support on any test.
If participants were to auction and find acceptance into areas of prior low volume (LVNodes), then future discovery ought to be volatile and quick as participants look to HVNodes for favorable entry or exit.
POCs: POCs are valuable as they denote areas where two-sided trade was most prevalent in a prior day session. Participants will respond to future tests of value as they offer favorable entry and exit.
MCPOCs: POCs are valuable as they denote areas where two-sided trade was most prevalent over numerous day sessions. Participants will respond to future tests of value as they offer favorable entry and exit.
The daily brief is a free glimpse into the prevailing fundamental and technical drivers of U.S. equity market products. Join the 950+ that read this report daily, below!
Graphic updated 8:00 AM ET. Sentiment Neutral if expected /ES open is inside of the prior day’s range. /ES levels are derived from the profile graphic at the bottom of the following section. Levels may have changed since initially quoted; click here for the latest levels. SqueezeMetrics Dark Pool Index (DIX) and Gamma (GEX) calculations are based on where the prior day’s reading falls with respect to the MAX and MIN of all occurrences available. A higher DIX is bullish. At the same time, the lower the GEX, the more (expected) volatility. Learn the implications of volatility, direction, and moneyness. Breadth reflects a reading of the prior day’s NYSE Advance/Decline indicator. VIX reflects a current reading of the CBOE Volatility Index (INDEX: VIX) from 0-100.
Administrative
An easy read, today. For more complex, see the September 20 and 19 letters. Also, there will not be a letter published for Friday, September 23, 2022. See you next week, team!
Fundamental
Equity markets traded down, yesterday, on the heels of the Federal Reserve’s (Fed) decision to raise interest rates by 0.75% and “keep at it” for longer, eyeing a 1.25% jump, in sum, by 2023.
This puts the current target rate at 3.00-3.25%.
Separately, if the “keep at it” quote sounds familiar, that’s because it is. The Fed Paul Volcker’s memoir is titled “Keeping at It.”
Graphic: CME Group Inc’s (NASDAQ: CME) FedWatch Tool shows higher odds of a 75 to 100 basis point rate hike in November, along the lines of what the futures market was pricing heading into the event.
The Fed Chair Jerome Powell admitted there may be below-trend growth and the potential for unemployment to reach 4.4% next year, up from the current rate of 3.7%. Projected increases, as of yesterday, show interest rates at 4.4% by 2023, and 4.6% in 2023, before moderation in 2024 to 3.9%, as well summarized by Bloomberg.
Moreover, economists suggest that raising rates to 4.5% would cost the economy nearly 1.7 million jobs while rates at 5% would bring that number to 2 million. A higher savings rate and increased funds at the state level would likely cushion the blow, however.
In response, the likes of Ark Invest’s Cathie Wood, who we quoted recently regarding her thoughts on why the Fed needs to lower the pace of tightening and/or cut, said:
“Most disappointing about the Fed’s decision today was its unanimity. None of those voting on the Federal Reserve is focused on the significant price deflation in the pipeline. The Fed seems to be making decisions based on lagging indicators and analogies.”
She adds that the Fed is setting the stage for deflation:
“The Fed is solving supply chain issues by crushing demand and, in my view, unleashing deflation, setting it up for a major pivot.”
Graphic: Initially retrieved from Bloomberg. Taken from Ophir Gottlieb who concludes costs are dropping, as observed via shipping, gasoline, manufacturing, cars, and rent measures.
Moreover, it’s the case that “[a]s rates rise and debt servicing costs increase, ‘many zombie institutions, zombie households, corporates, banks, shadow banks, and zombie countries are going to die,’” said economist Nouriel Roubini, who predicted the 2008 financial crisis.
Prior to the Fed event, Roubini forecasted a 75 basis point hike in September, followed by a 50 basis point hike in November. The market is pricing more than what Roubini thought the Fed would probably do after Wednesday’s Fed meeting.
In his opinion, stay “light on equities and have more cash, … [as] equities and other assets can fall by 10%, 20%, 30%.”
Positioning
In short, unexpected was the post-event response. In recent times, post-Fed moves have been positive, driven by the “rebalancing of dealer inventory,” per Kai Volatility’s Cem Karsan.
That didn’t happen and let’s unpack why.
Basically, into the event, traders demanded protection and bid implied volatility (IVOL). The assumption is that counterparties, who are likely on the other end, have exposure to positive Delta and negative Gamma, which they hedge through negative Delta trades in the underlying.
Should fears have been assuaged, the supply of that protection once demanded, would have decreased IVOL (and options Delta), providing the markets a boost.
That didn’t happen. Instead, traders added protection, as shown by this SpotGamma graphic tracking changes in put open interest on the S&P 500 (INDEX: SPX).
Graphic: Retrieved from SpotGamma.Updated September 22, 2022.
This bid some basic measures of IVOL into the close.
Graphic: Retrieved from VIX Central. Updated September 21, 2022.
That’s as these particular options, which were added at much lower prices, as I explained in a SpotGamma note, recently, “are far more sensitive to changes in direction and IVOL.”
These options can go “from having very little Delta (exposure to direction) to a lot more Delta on the move lower,” quickly. “If we maintain that liquidity providers are short those puts, a positive Delta trade, then those liquidity providers [will sell] futures and stock, a negative Delta trade to stay hedged.”
Notwithstanding, it’s still the case that a “reload on fresh short-dated downside” flows heighten the risk of a “negative Delta squeeze … into month end,” said Nomura Holdings Inc’s (NYSE: NMR) Charlie McElligott.
Therefore, “you have to consider a move up [to] $4,000.00 as part of your distribution of outcomes to the upside,” as that is near where “market makers are ‘long,’” as part of an impactful collar trade many are aware sits.
As an aside, some online conversation was sparked around placing cash into riskless trades for some small, but guaranteed, rates of return. In that conversation, Box Spreads were put forth as a solution to lend cash and earn a competitive interest rate.
For context, “Boxes allow market participants to create a loan structure similar to a Treasury bill. T-bills are ‘discount’ instruments that are purchased at a value less than the stated face value. Upon maturity, bills call for the return of the stated face value.”
“For example, one might buy a $1 million 90-day T-bill for $998,000. Ninety days later, the $1 million face or principal value is returned and the $2,000 discount is earned as interest. One may represent the rate on this transaction as a 0.80% or 80 basis point discount yield [= (360/90) x ($2,000/$1,000,000)]. The effective rate on a box represents a ‘discount yield’ similar to a quoted T-bill rate.”
IPS Strategic Capital’s Pat Hennessy explains that SPX boxes “typically yield[] 20-40 bps above [the] corresponding maturity risk-free rate.” Additionally, there are tax advantages to using the S&P 500’s 1256 contracts.
For easier fills, use the “3K/4K line in an AM settled expiry,” Hennessy noted. “Helps if you know where the broker market is.”
Technical
As of 8:00 AM ET, Thursday’s regular session (9:30 AM – 4:00 PM ET), in the S&P 500, is likely to open in the upper part of a balanced overnight inventory, inside of prior-range and -value, suggesting a limited potential for immediate directional opportunity.
In the best case, the S&P 500 trades higher.
Any activity above the $3,826.25 HVNode puts into play the $3,857.25 HVNode. Initiative trade beyond the latter could reach as high as the $3,893.00 VPOC and $3,936.25 ONH, or higher.
In the worst case, the S&P 500 trades lower.
Any activity below the $3,826.25 HVNode puts into play the $3,770.75 HVNode. Initiative trade beyond the HVNode could reach as low as the $3,722.50 LVNode and $3,688.75 HVNode, or lower.
Click here to load today’s key levels into the web-based TradingView charting platform. Note that all levels are derived using the 65-minute timeframe. New links are produced, daily.
Graphic: 65-minute profile chart of the Micro E-mini S&P 500 Futures.
Definitions
Volume Areas: A structurally sound market will build on areas of high volume (HVNodes). Should the market trend for long periods of time, it will lack sound structure, identified as low volume areas (LVNodes). LVNodes denote directional conviction and ought to offer support on any test.
If participants were to auction and find acceptance into areas of prior low volume (LVNodes), then future discovery ought to be volatile and quick as participants look to HVNodes for favorable entry or exit.
POCs: POCs are valuable as they denote areas where two-sided trade was most prevalent in a prior day session. Participants will respond to future tests of value as they offer favorable entry and exit.
MCPOCs: POCs are valuable as they denote areas where two-sided trade was most prevalent over numerous day sessions. Participants will respond to future tests of value as they offer favorable entry and exit.
About
After years of self-education, strategy development, mentorship, and trial-and-error, Renato Leonard Capelj began trading full-time and founded Physik Invest to detail his methods, research, and performance in the markets.
Capelj also develops insights around impactful options market dynamics at SpotGamma and is a Benzinga reporter.
In no way should the materials herein be construed as advice. Derivatives carry a substantial risk of loss. All content is for informational purposes only.