Welcome to the Daily Brief by Physik Invest, a soon-to-launch research, consulting, trading, and asset management solutions provider. Learn about our origin story here, and consider subscribing for daily updates on the critical contexts that could lend to future market movement.
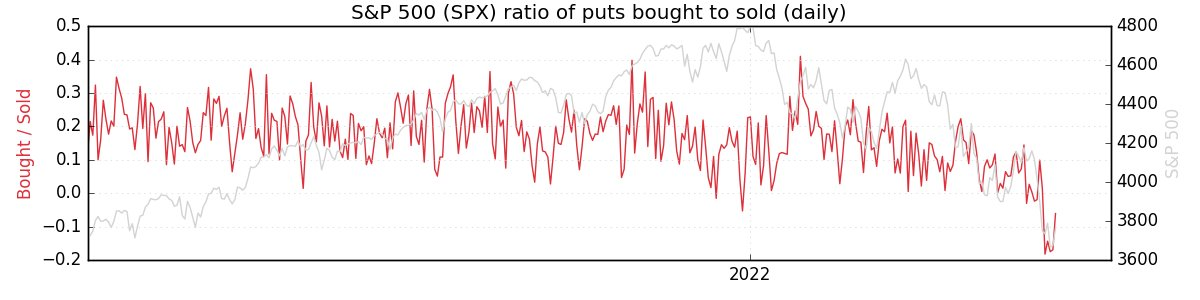
JPMorgan Chase & Co’s (NYSE: JPM) Marko Kolanovic believes the equities rally will falter, with headwinds from bank turbulence, an oil shock, and slowing growth poised to send stocks back toward their 2022 lows over the coming months. Kolanovic says this is “the calm before the storm,” adding that the equity rally is masking weaknesses from recent bank collapses and a decline in corporate profits and growth.
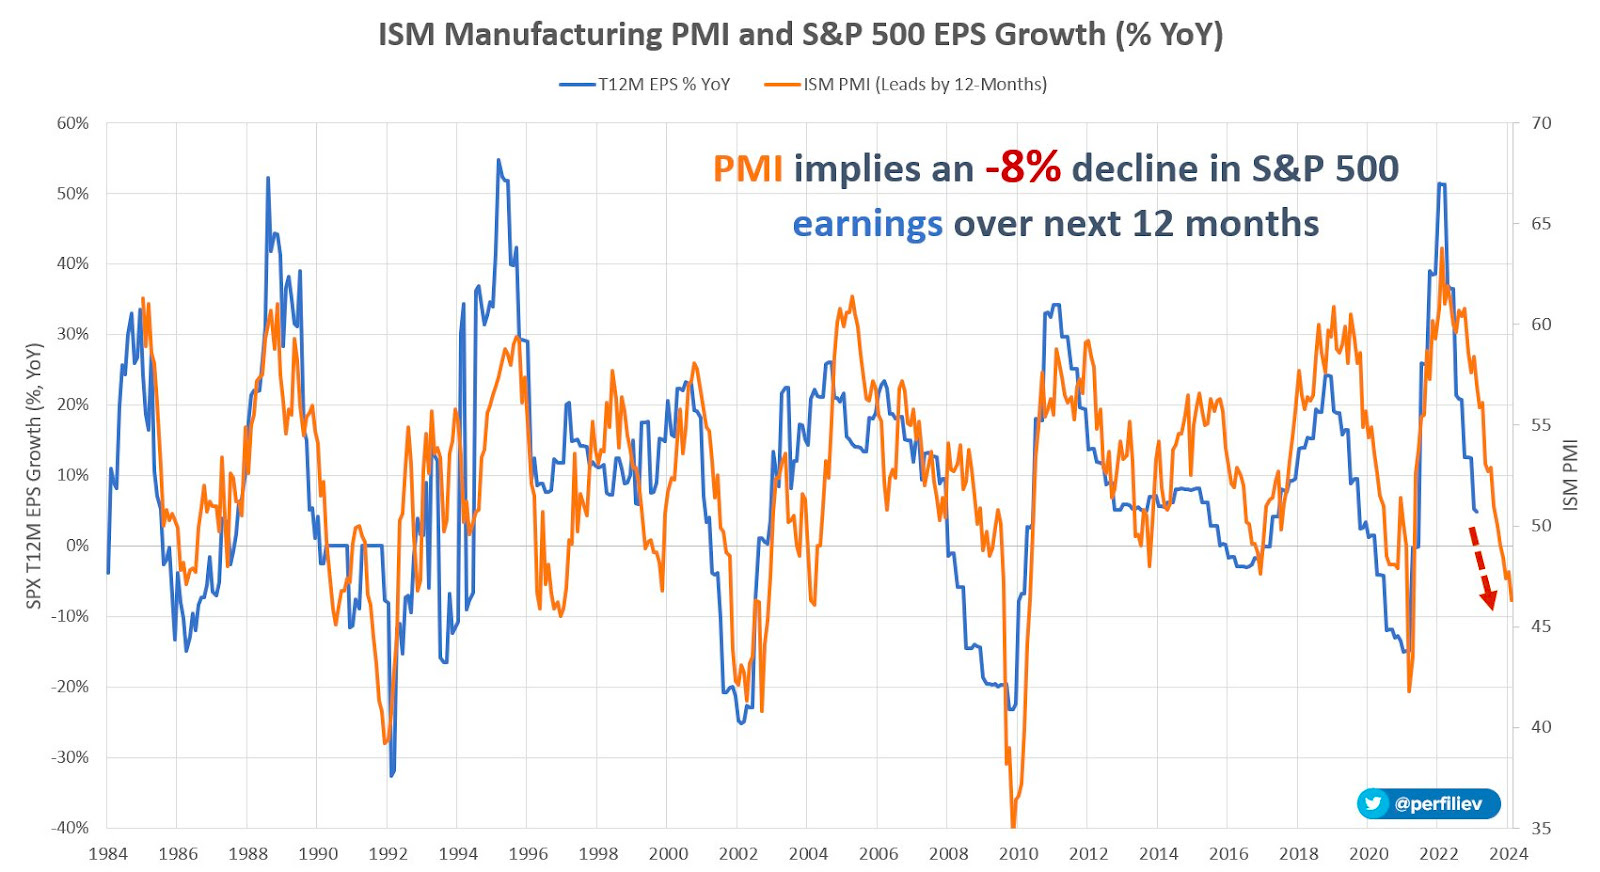
As a validation, we can look to ISM’s inventories exceeding that of new orders, and a dip in cost-push prices, Bloomberg’s John Authers explains. The overall ISM measure is recessionary; the upcoming earnings season may be unforgiving, and companies with weaker EPS are likely to be penalized more due to the prospects of a recession.
Graphic: Retrieved from Sergei Perfiliev. “Based on this relationship, today’s PMI reading of 46.3 implies an earnings contraction of about 8% over the next 12 months or an SPX EPS of 204. Using the current forward PE ratio of 18.7, this leads to an index level of about 3,815. A ‘recessionary’ PE ratio of 15 will see the index at ~3,060, assuming earnings don’t fall further.”
Graphic: Retrieved from @countdraghula. “We aren’t seeing the same thing for out-of-the-money calls on front-end futures. BUYING A CALL on front-end futures is taking a bet on Fed rates collapsing, especially if it is considerably out of the money, as below. Pricing for these is still sky high, despite some calm.”
Over the past weeks, we anticipated the markets trading “spiritedly for far longer,” quoting the likes of Kai Volatility’s Cem Karsan, who said the signs of a combustible situation would emerge when options implied volatility is sticky in a market rally.
Typically, as the market trades higher, volatility levels for fixed-strike options should decrease. If broad implied volatility measures are bid and fixed-strike volatility increases, this may lead to a more combustible situation as options counterparties begin to thin out on volatility, resulting in less support.
We maintain that you can monetize the example call structures we provided and roll some profits into bear put spreads (i.e., buy put and sell another at a lower strike), though you may limit your expectations. Some think there is a greater likelihood of a “crash-less selloff, a grinding de-leveraging.”
Don’t use this free letter as advice; all content is for informational purposes, and derivatives carry a substantial risk of loss. At this time, Capelj and Physik Invest, non-professional advisors, will never solicit others for capital or collect fees and disbursements. Separately, you may view this letter’s content calendar at this link.
The daily brief is a free glimpse into the prevailing fundamental and technical drivers of U.S. equity market products. Join the 300+ that read this report daily, below!
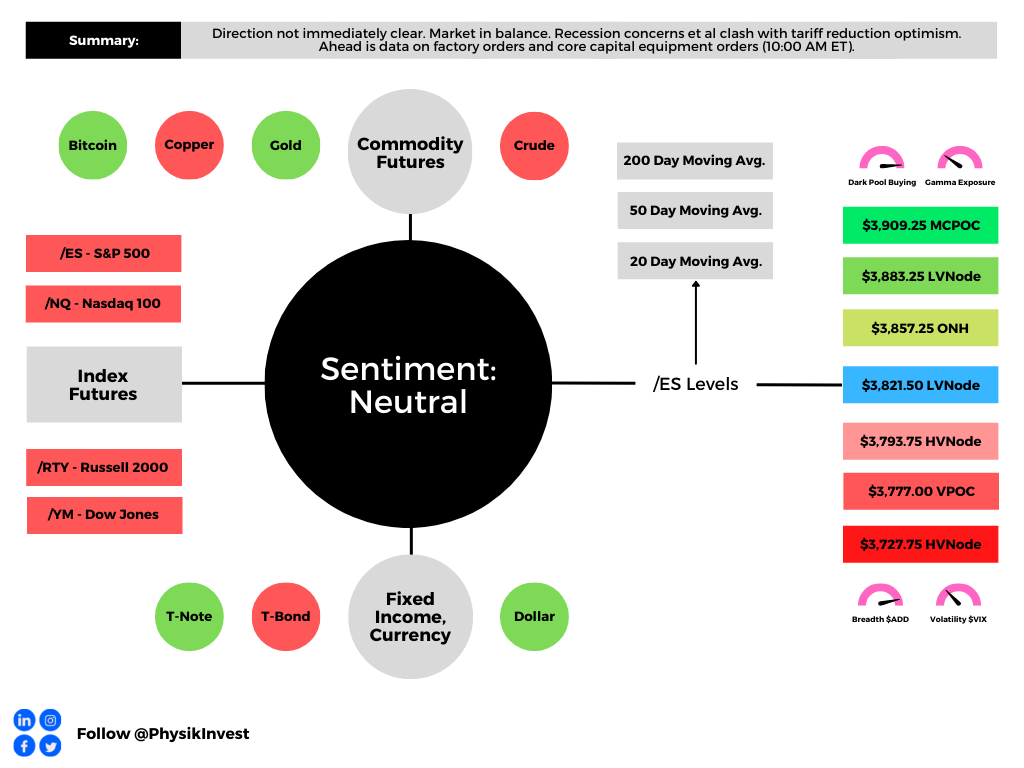
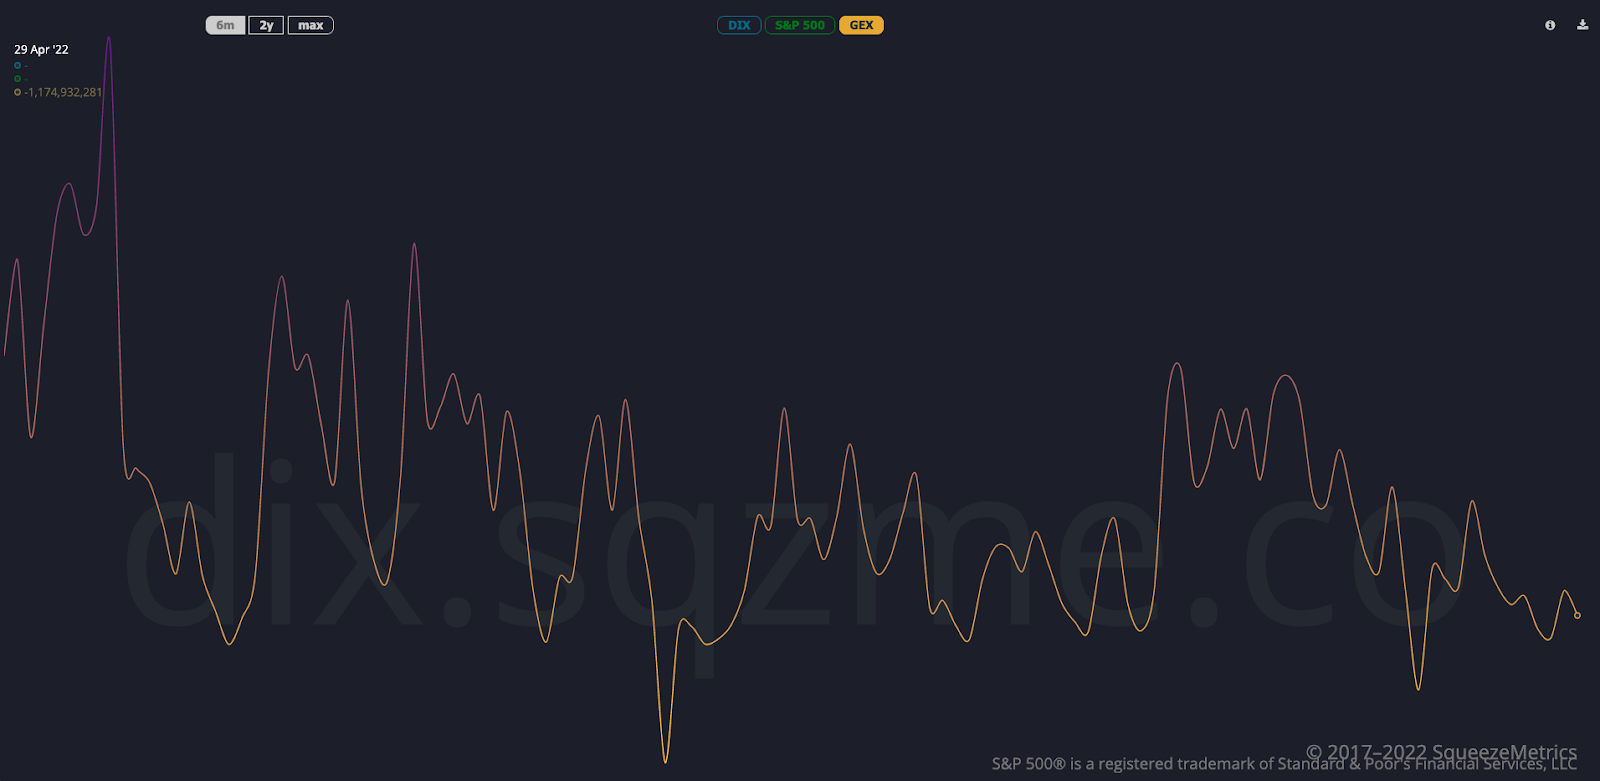
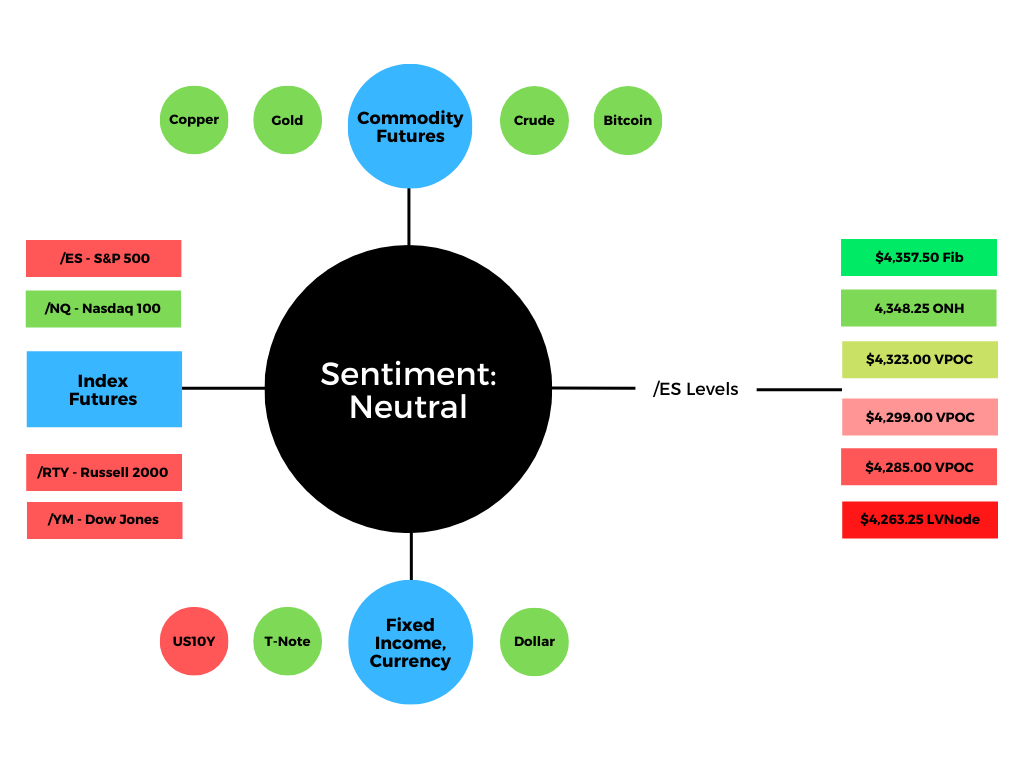
Graphic updated 6:30 AM ET. Sentiment Neutral if expected /ES open is inside of the prior day’s range. /ES levels are derived from the profile graphic at the bottom of the following section. Levels may have changed since initially quoted; click here for the latest levels. SqueezeMetrics Dark Pool Index (DIX) and Gamma (GEX) calculations are based on where the prior day’s reading falls with respect to the MAX and MIN of all occurrences available. A higher DIX is bullish. At the same time, the lower the GEX, the more (expected) volatility. Learn the implications of volatility, direction, and moneyness. SHIFT data used for S&P 500 (INDEX: SPX) options activity. Note that options flow is sorted by the call premium spent; if more positive, then more was spent on call options. Breadth reflects a reading of the prior day’s NYSE Advance/Decline indicator. VIX reflects a current reading of the CBOE Volatility Index (INDEX: VIX) from 0-100.
What To Expect
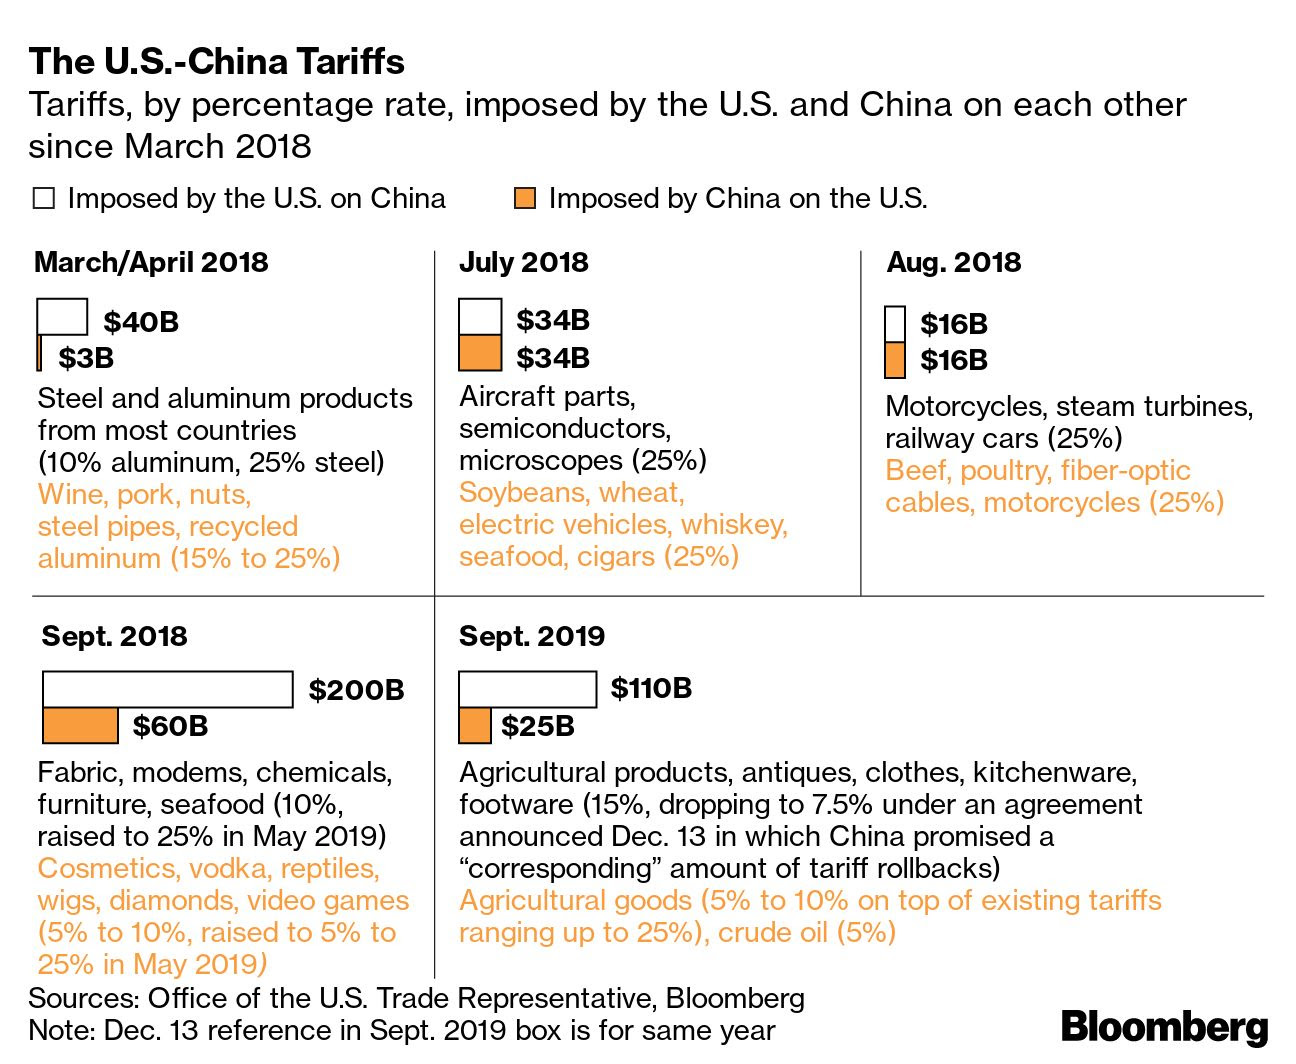
Fundamental: In the headlines were the chip boom’s loss of steam, the Bank of England’s consideration of 50-year mortgages, the potential collapse or rise in oil by year-end, NATO’s resumption of expansion processes, slowing car sales, China tariffs reduction, Germany’s first monthly trade deficit since 1991 on inflation, and more.
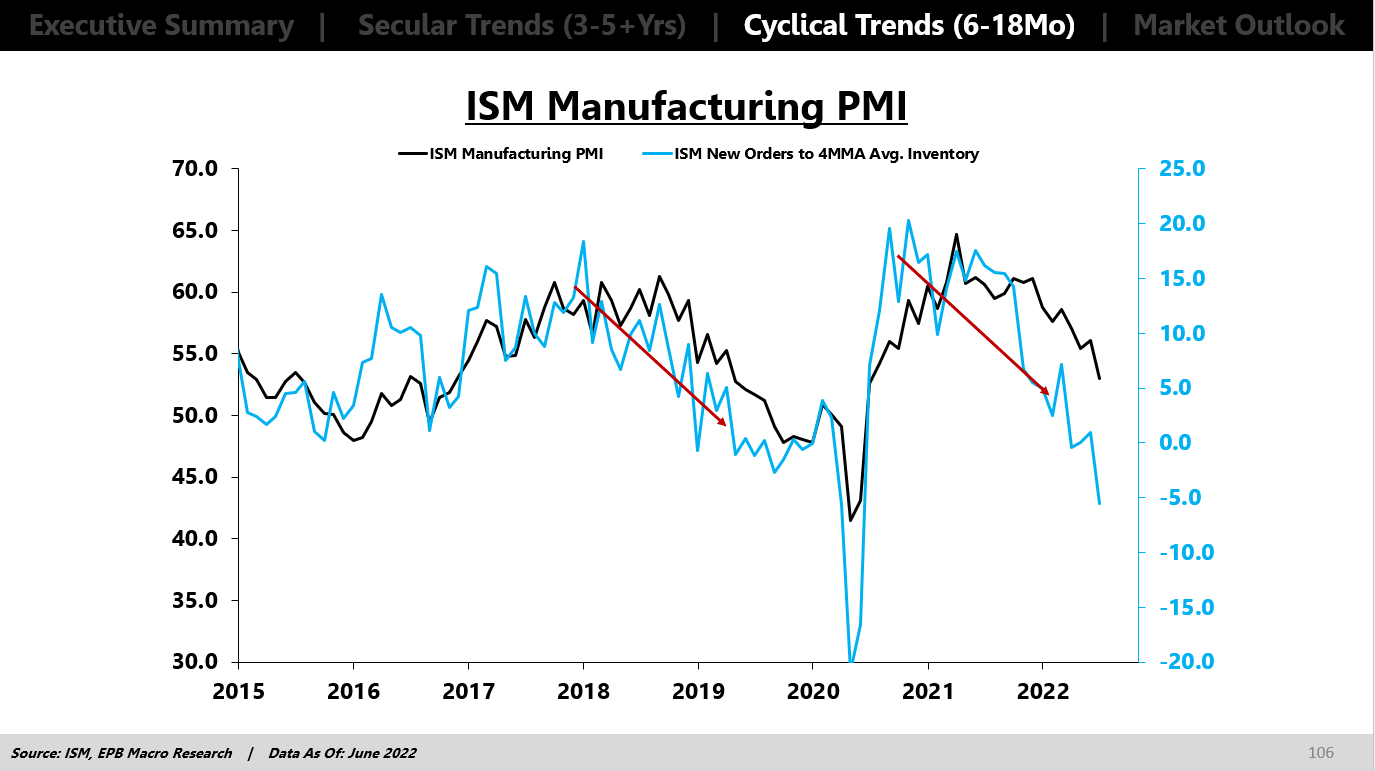
Key in last week’s narratives was U.S. manufacturing’s decline as new orders were below that of inventories.
Bloomberg’s John Authers explains that “[t]he signal grows even more discomforting if the new orders number is below the recessionary cutoff at 50.”
Graphic: Via Eric Basmajian. “Given that the ISM Manufacturing PMI holds a very strong correlation to earnings estimates, credit spreads, and more, the probability that we see further declines should be a warning sign that more turbulence is ahead in cyclical risk assets.”
“If the new story of imminent slowdown and a limited monetary tightening campaign turns out to be true, then the narrative on earnings will have to change. That positivity about earnings is what is keeping stocks from selling off far more,” Authers adds.
“The next couple of weeks will bring critical macro data on inflation and employment; but immediately after that, the earnings numbers will start to flow. It might not be pretty.”
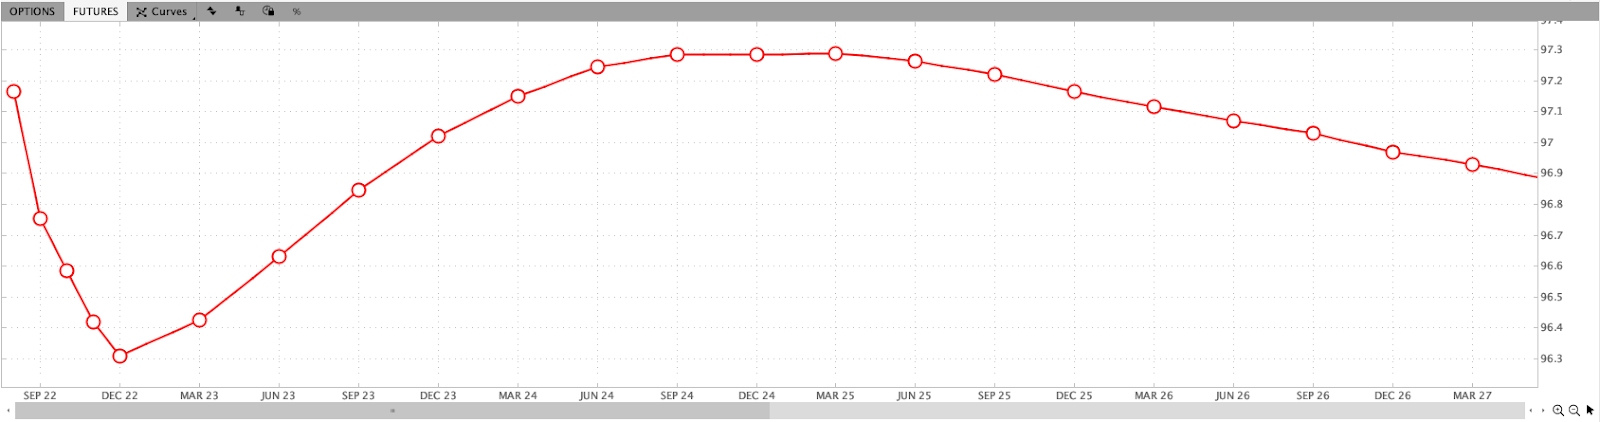
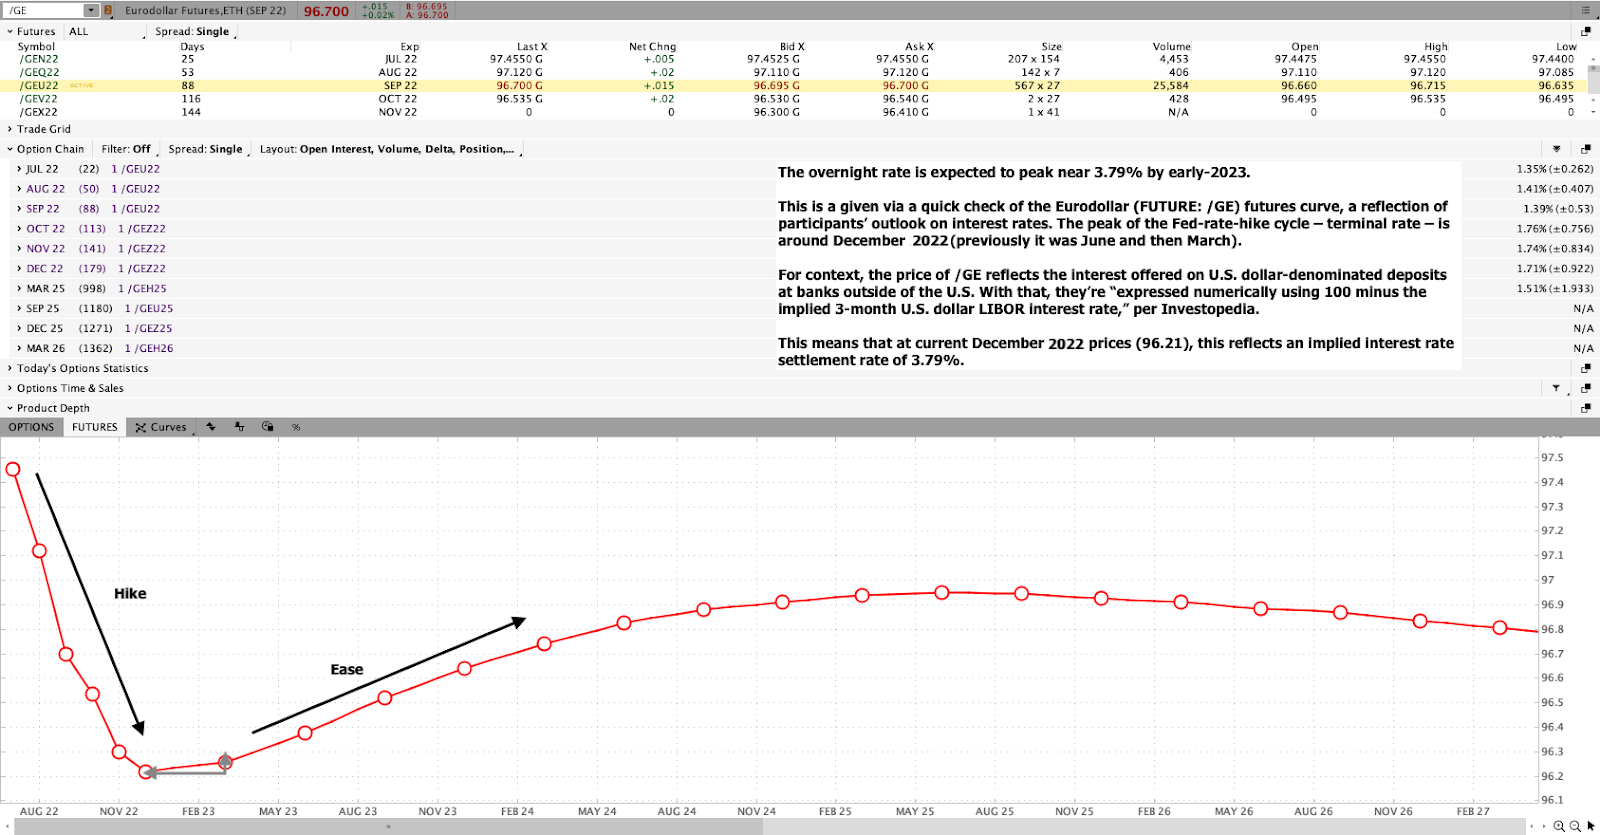
Graphic: Via Charles Schwab Corporation-owned (NYSE: SCHW) TD Ameritrade’s Thinkorswim. The Eurodollar (FUTURE: /GE) futures curve is a reflection of participants’ outlook on interest rates. The peak of the Fed-rate-hike cycle – terminal rate – is around DEC 2022.
Positioning: Data on net gamma exposures points to more volatile ranges.
Given the relationship between realized (RVOL) and implied (IVOL) volatility, as well as naive metrics for skew, it makes sense to not be a seller of volatility, especially in options that are short-dated and farther out.
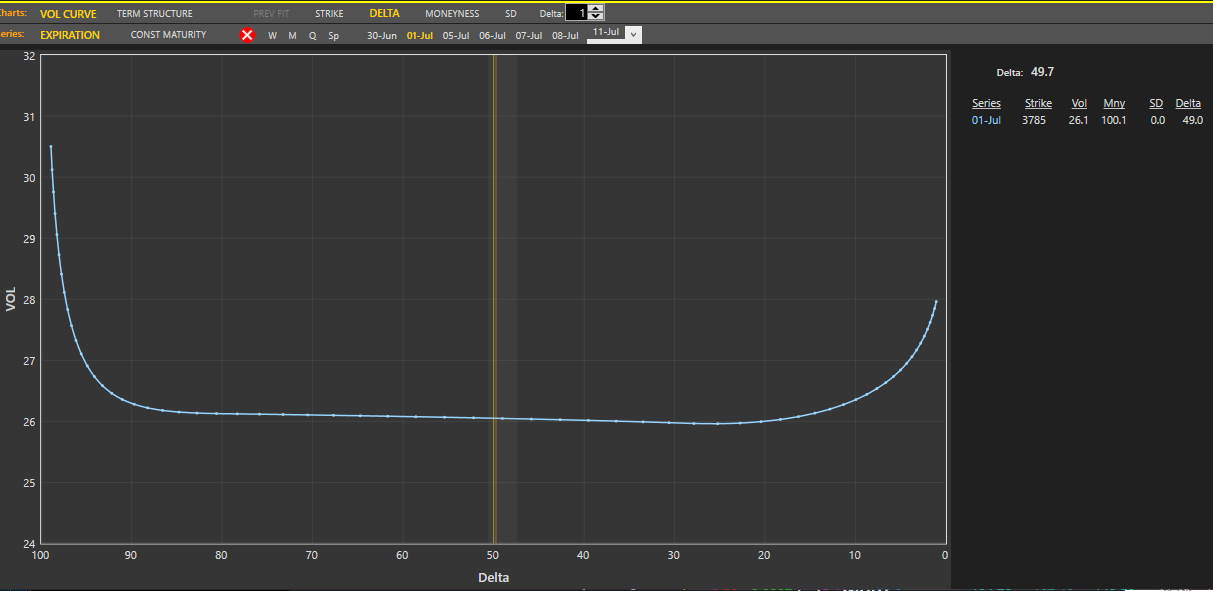
Graphic: Via Pat Hennessy. “Tomorrow’s SPX expo (Jul1) is wildin… 26 vol for any strike with a 37 or 38 handle with a ridiculous curvature in the tails. God speed to all the 1dte theta gang. Selling OTM puts/calls for the same vol as ATM seems… umm… not good.”
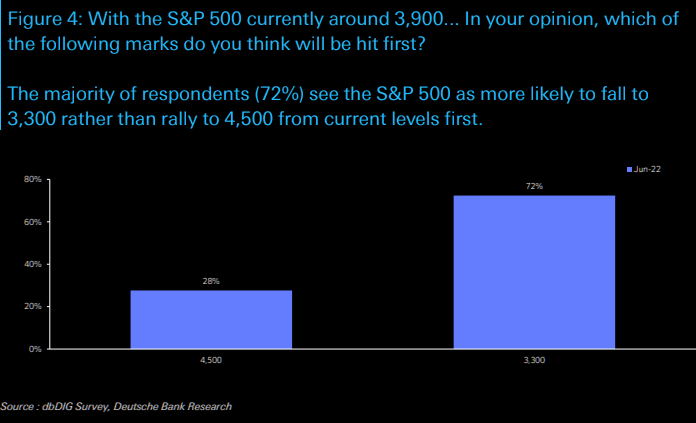
Moreover, participants’ combined view is that markets are likely to head lower, via Deutsche Bank AG (NYSE: DB).
Graphic: Via Deutsche Bank AG (NYSE: DB). Taken from The Market Ear.
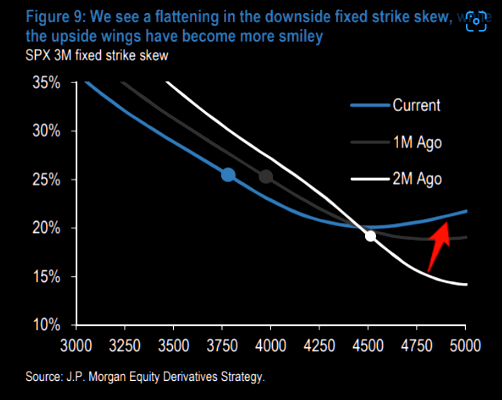
However, as we discussed in sessions prior, their demand for exposure to the upside resulted in “a flattening in the downside strike skew, while the upside wings have become more smiley.”
Graphic: Via JPMorgan Chase & Co (NYSE: JPM). Taken from The Market Ear.
A “higher starting point” in implied volatility (IVOL), and a still-present right-tail (from the positioning for a bear market rally), make it so we may position, for less cost, in short-dated structures with asymmetric payouts, on both sides of the market.
Technical: As of 6:30 AM ET, Tuesday’s regular session (9:30 AM – 4:00 PM ET), in the S&P 500, is likely to open in the middle part of a balanced overnight inventory, inside of prior-range and -value, suggesting a limited potential for immediate directional opportunity.
In the best case, the S&P 500 trades higher.
Any activity above the $3,821.50 LVNode puts into play the $3,857.25 ONH. Initiative trade beyond the ONH could reach as high as the $3,883.25 LVNode and $3,909.25 MCPOC, or higher.
In the worst case, the S&P 500 trades lower.
Any activity below the $3,821.50 LVNode puts into play the $3,793.75 HVNode. Initiative trade beyond the HVNode could reach as low as the $3,777.00 VPOC and $3,727.75 HVNode, or lower.
Click here to load today’s key levels into the web-based TradingView charting platform. Note that all levels are derived using the 65-minute timeframe. New links are produced, daily.
Graphic: 65-minute profile chart of the Micro E-mini S&P 500 Futures.
Definitions
Overnight Rally Highs (Lows): Typically, there is a low historical probability associated with overnight rally-highs (lows) ending the upside (downside) discovery process.
Volume Areas: A structurally sound market will build on areas of high volume (HVNodes). Should the market trend for long periods of time, it will lack sound structure, identified as low volume areas (LVNodes). LVNodes denote directional conviction and ought to offer support on any test.
If participants were to auction and find acceptance into areas of prior low volume (LVNodes), then future discovery ought to be volatile and quick as participants look to HVNodes for favorable entry or exit.
POCs: POCs are valuable as they denote areas where two-sided trade was most prevalent in a prior day session. Participants will respond to future tests of value as they offer favorable entry and exit.
About
After years of self-education, strategy development, mentorship, and trial-and-error, Renato Leonard Capelj began trading full-time and founded Physik Invest to detail his methods, research, and performance in the markets.
Capelj also develops insights around impactful options market dynamics at SpotGamma and is a Benzinga reporter.
In no way should the materials herein be construed as advice. Derivatives carry a substantial risk of loss. All content is for informational purposes only.
The daily brief is a free glimpse into the prevailing fundamental and technical drivers of U.S. equity market products. Join the 300+ that read this report daily, below!
Overnight, equity index futures were sideways to lower. Commodities and bonds were mixed. Implied volatility measures fell. The dollar rose.
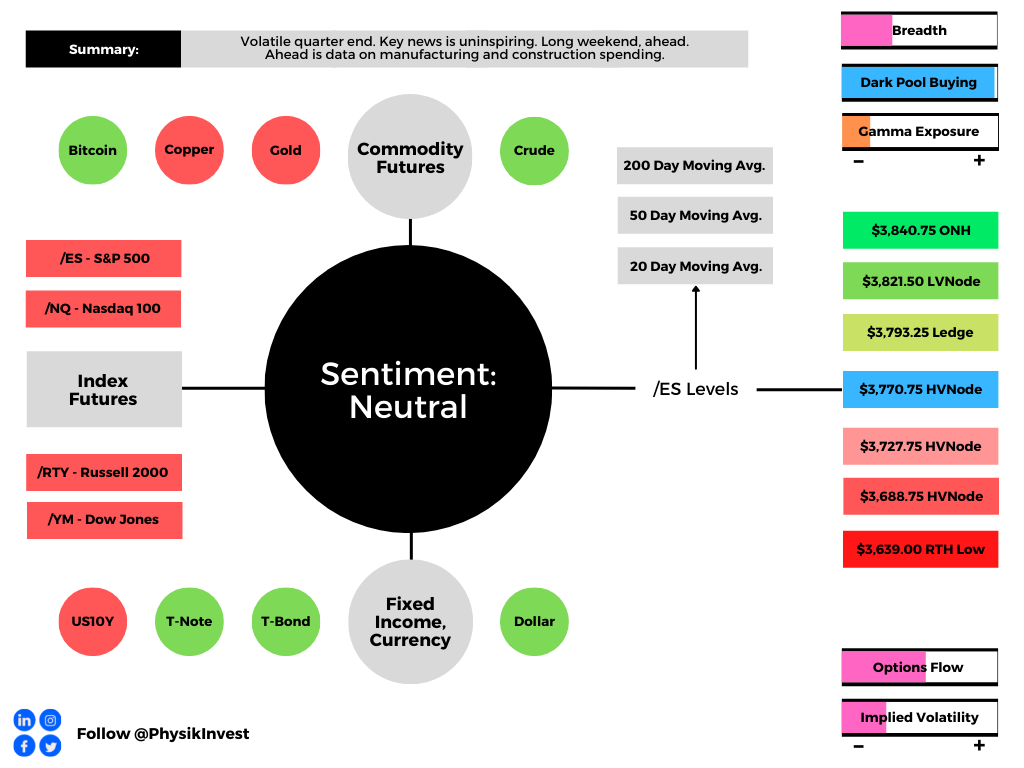
A volatile quarter-end ahead of a long weekend. Noteworthy is the market’s responsiveness to visual levels. For instance, the S&P 500’s (FUTURE: /ES) high of the day printed at $3,821.50 or so, a key level in yesterday’s morning letter.
This points to heightened activity by technically-driven traders with short time horizons. Such traders often lack the wherewithal to defend retests and, additionally, the type of trade may be indicative of the other time frame participants waiting for more information to initiate trades.
Moreover, on an annual basis, core inflation was the lowest since November while consumers’ spending cooled suggesting the economy is on a weaker footing. In Europe, inflation hit a record, boosting calls for more aggressive monetary policy action.
Adding, Goldman Sachs Group Inc (NYSE: GS) strategists see equity valuations falling further “[u]nless bond yields start to decline and buffer rising equity risk premiums.” Michael Burry, the Founder of Scion Asset Management, too, sees declines lasting on “earnings compression.”
Ahead is data on S&P Global Inc’s (NYSE: SPGI) manufacturing PMI (9:45 AM ET), as well as the ISM manufacturing index and construction spending (10:00 AM ET).
Graphic updated 6:45 AM ET. Sentiment Neutral if expected /ES open is inside of the prior day’s range. /ES levels are derived from the profile graphic at the bottom of the following section. Levels may have changed since initially quoted; click here for the latest levels. SqueezeMetrics Dark Pool Index (DIX) and Gamma (GEX) calculations are based on where the prior day’s reading falls with respect to the MAX and MIN of all occurrences available. A higher DIX is bullish. At the same time, the lower the GEX, the more (expected) volatility. Learn the implications of volatility, direction, and moneyness. SHIFT data used for S&P 500 (INDEX: SPX) options activity. Note that options flow is sorted by the call premium spent; if more positive, then more was spent on call options. Breadth reflects a reading of the prior day’s NYSE Advance/Decline indicator. VIX reflects a current reading of the CBOE Volatility Index (INDEX: VIX) from 0-100.
What To Expect
Fundamental: A bit philosophical here, today, as a difficult half-year has passed and I’m low on the time I have to commit to analysis this morning.
Markets are substantially lower from the end of 2021, all the while there are now, in greater quantity and frequency, calls being made that equities have more room to the downside.
That very well may be the case, and the upcoming earnings season is likely to provide investors clarity with respect to corporates’ ability to weather or pass on higher costs, among other things.
Regardless, everything we discuss on a daily basis – fundamental and technical market drivers – will do little for us if we do not have a framework for assessing risk and opportunity.
Before ever taking a position, I ask myself the following: What is it that I have to lose? For me, the answer depends.
At times, it is dependent on a position’s payoff profile. At others, it’s the max pain I’m willing to subject myself to during adverse market conditions or when I have limited mental capital.
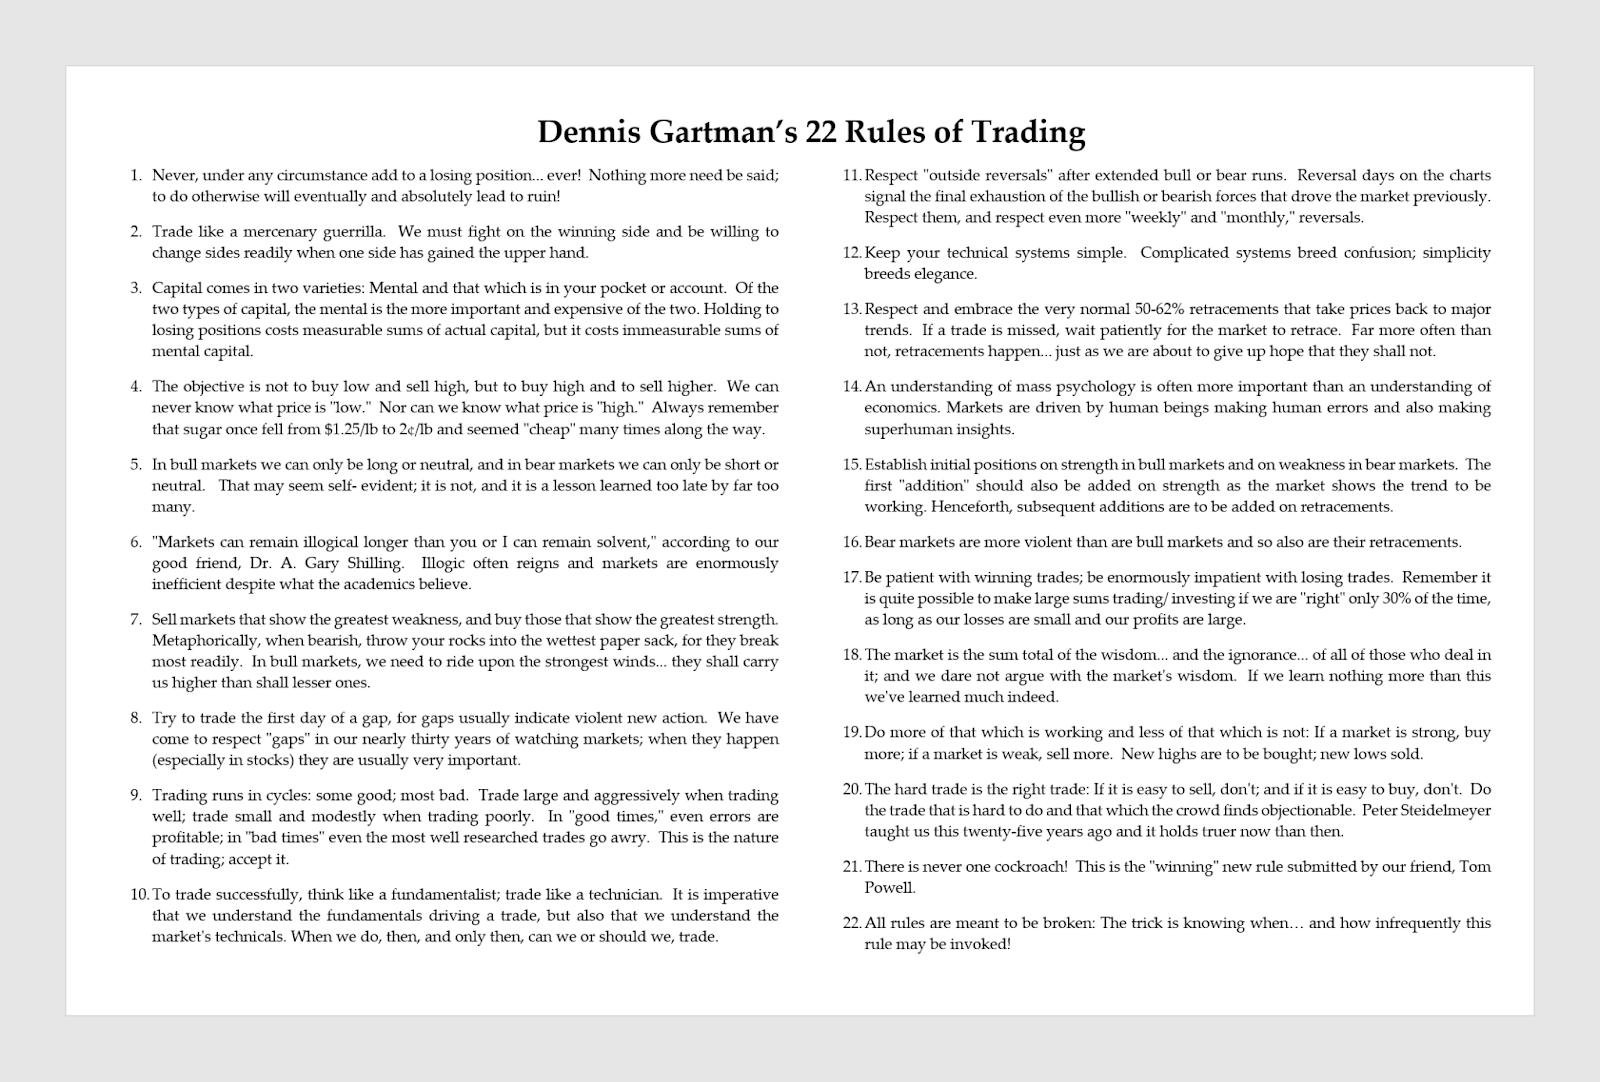
As Dennis Gartman of the Gartman Letter said:
“Capital comes in two varieties: Mental and that which is in your pocket or account.”
“[T]he mental is the more important and expensive of the two. Holding to losing position costs measurable sums of actual capital, but costs immeasurable sums of mental capital.”
And, with that, the other key is that the money is made in not losing it. Fortunately, this law was impressed on me, early. Returning 100%, only to suffer a 50% loss, sets you back to where you were, initially.
These comments are pursuant to traders I’ve had the honor of connecting with over the past year or so. Many made a killing to only have given most, if not all of it, back.
This has an immeasurable effect on one’s mental capital.
Though I’ve not participated in the most recent weaknesses, my mental capital has suffered. I’ve, subsequently, reduced the size of my positions and opted to define my losses, buying into volatility while it is cheap, as I view it, and waiting for the relationship to flip to sell in size.
Returning to the comment on whether the market’s de-rate has played out. I do not know. Can it go further? Probably. There are a host of references converging below current market prices, as pointed to in the Technicals section, below, that probably are taken at some point in the year.
That said, whether long or short, ask what it is that you have to lose?
If it’s a number, define your loss and take the trade. Take (or provide) liquidity when others don’t want to. Buy (or sell) volatility when it is cheap (or expensive). Let the trade work.
It’s a coinflip, probably, at the end of the day. If we know what we have to gain and lose, we’ve moved the expected outcome that much further our way. Have a good long weekend, team.
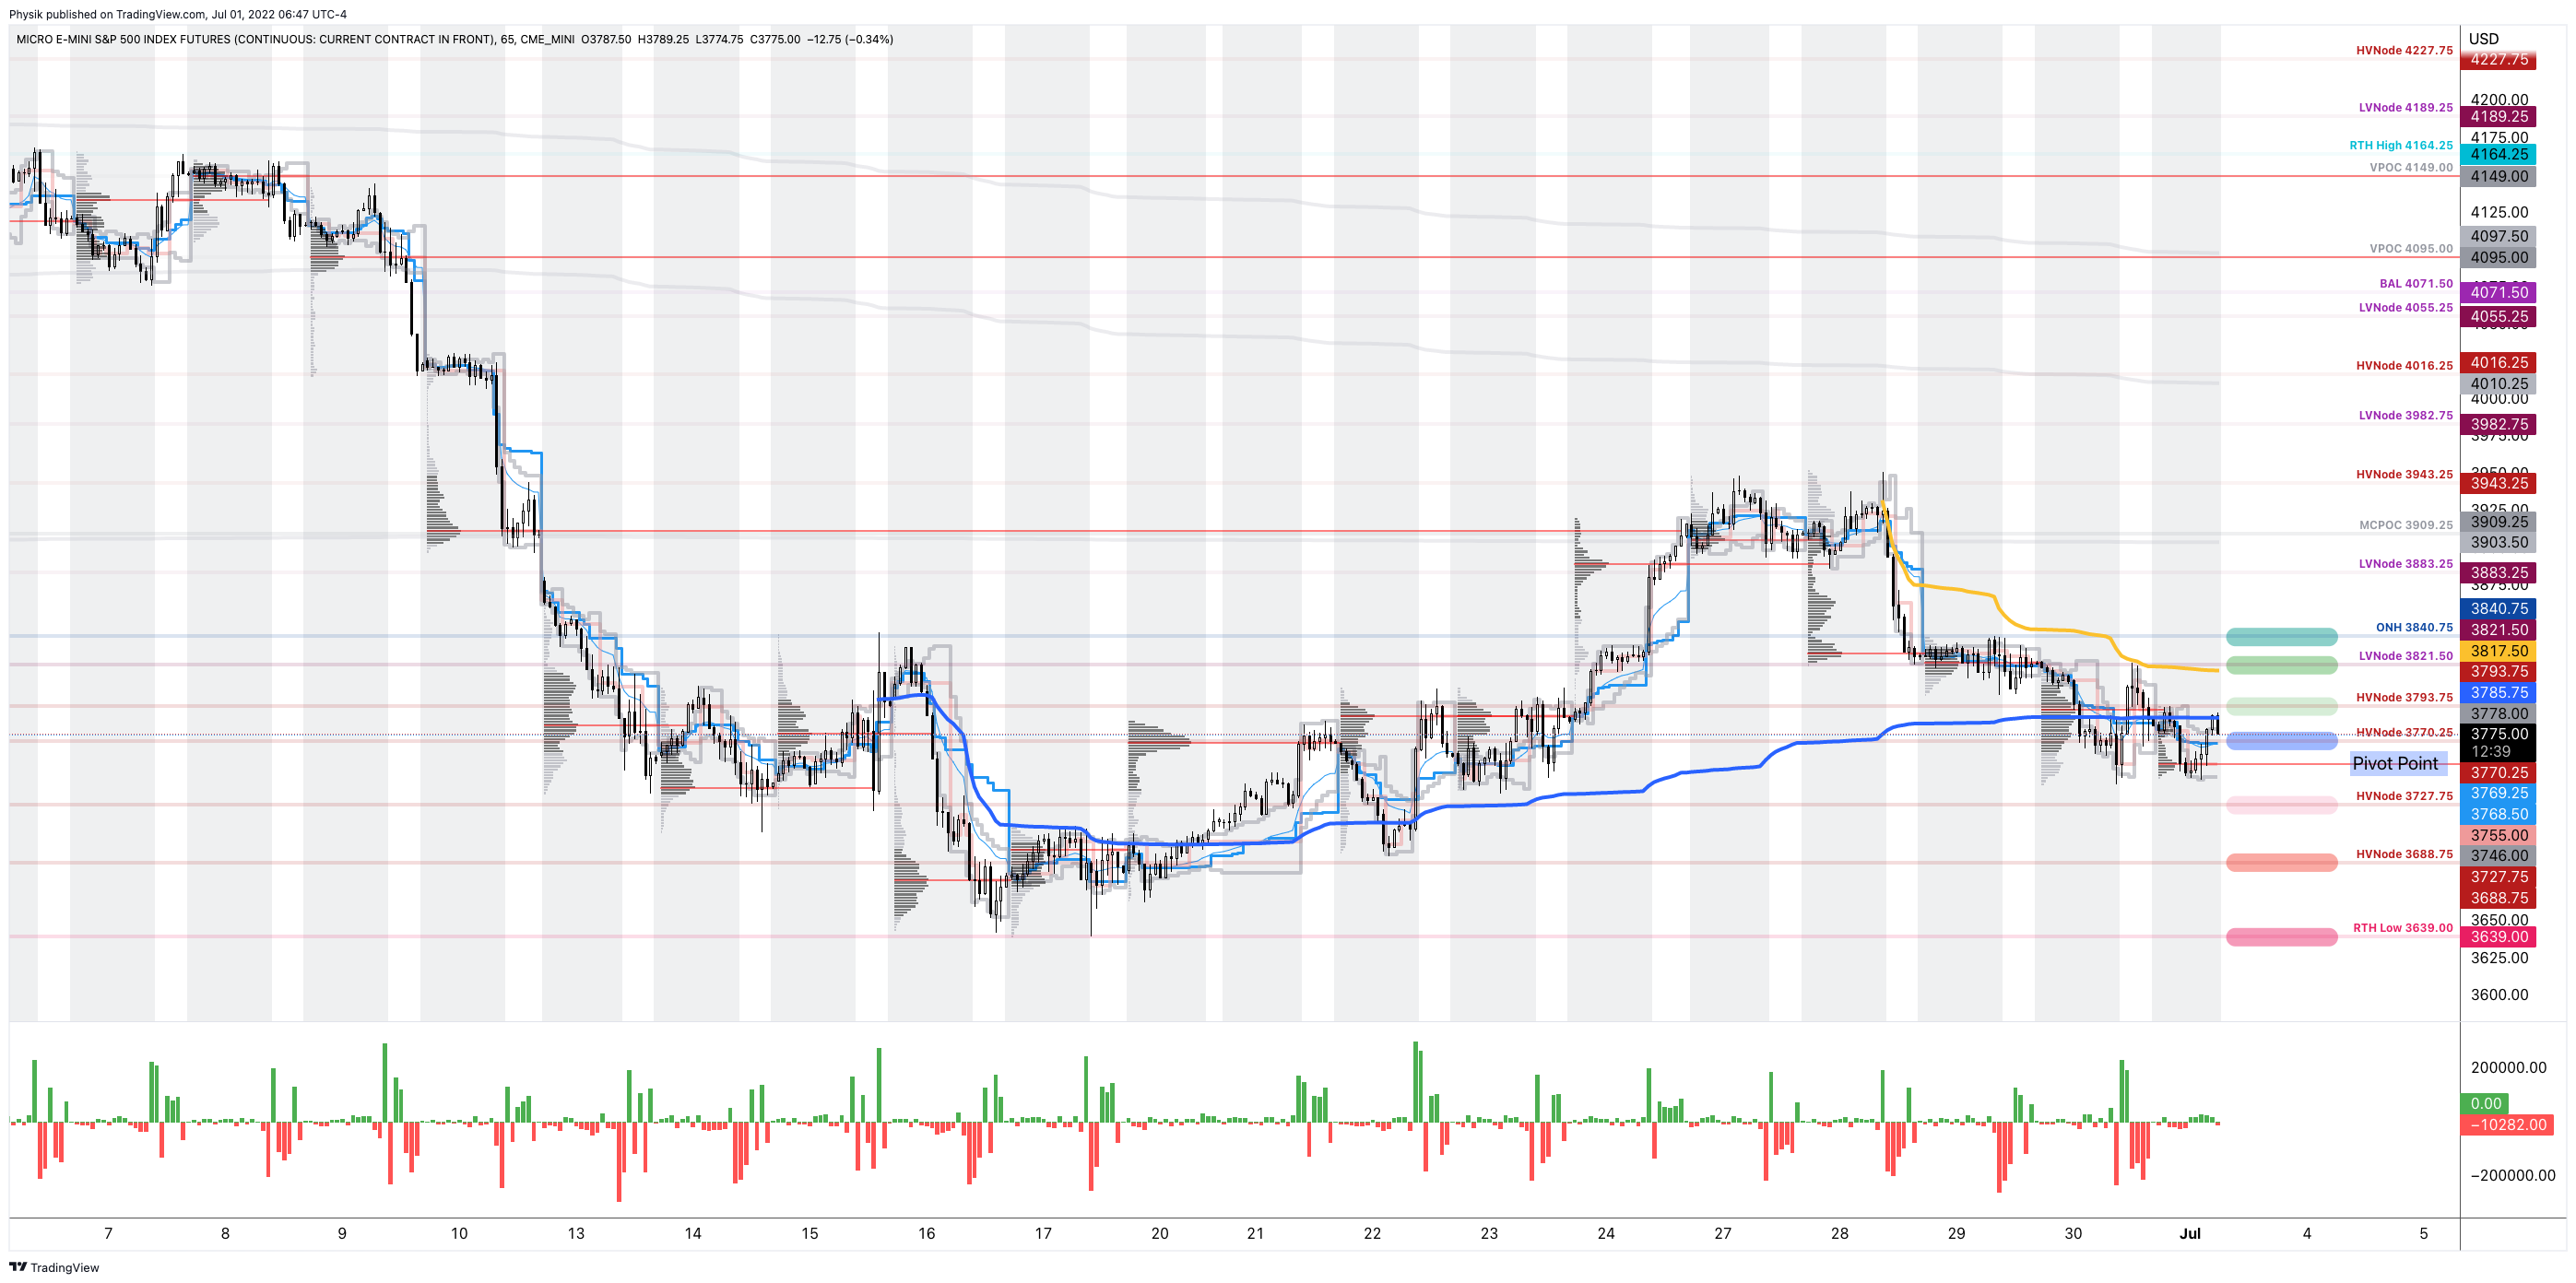
Technical: As of 6:30 AM ET, Friday’s regular session (9:30 AM – 4:00 PM ET), in the S&P 500, will likely open in the middle part of a balanced overnight inventory, inside of prior-range and -value, suggesting a limited potential for immediate directional opportunity.
In the best case, the S&P 500 trades higher; activity above the $3,770.25 HVNode puts in play the $3,793.75 HVNode. Initiative trade beyond the latter HVNode could reach as high as the $3,821.50 LVNode and $3,840.75 ONH, or higher.
In the worst case, the S&P 500 trades lower; activity below the $3,770.25 HVNode puts in play the $3,727.75 HVNode. Initiative trade beyond the latter HVNode could reach as low as the $3,688.75 HVNode and $3,639.00 RTH Low, or lower.
Click here to load today’s key levels into the web-based TradingView charting platform. Note that all levels are derived using the 65-minute timeframe. New links are produced, daily.
Graphic: 65-minute profile chart of the Micro E-mini S&P 500 Futures.
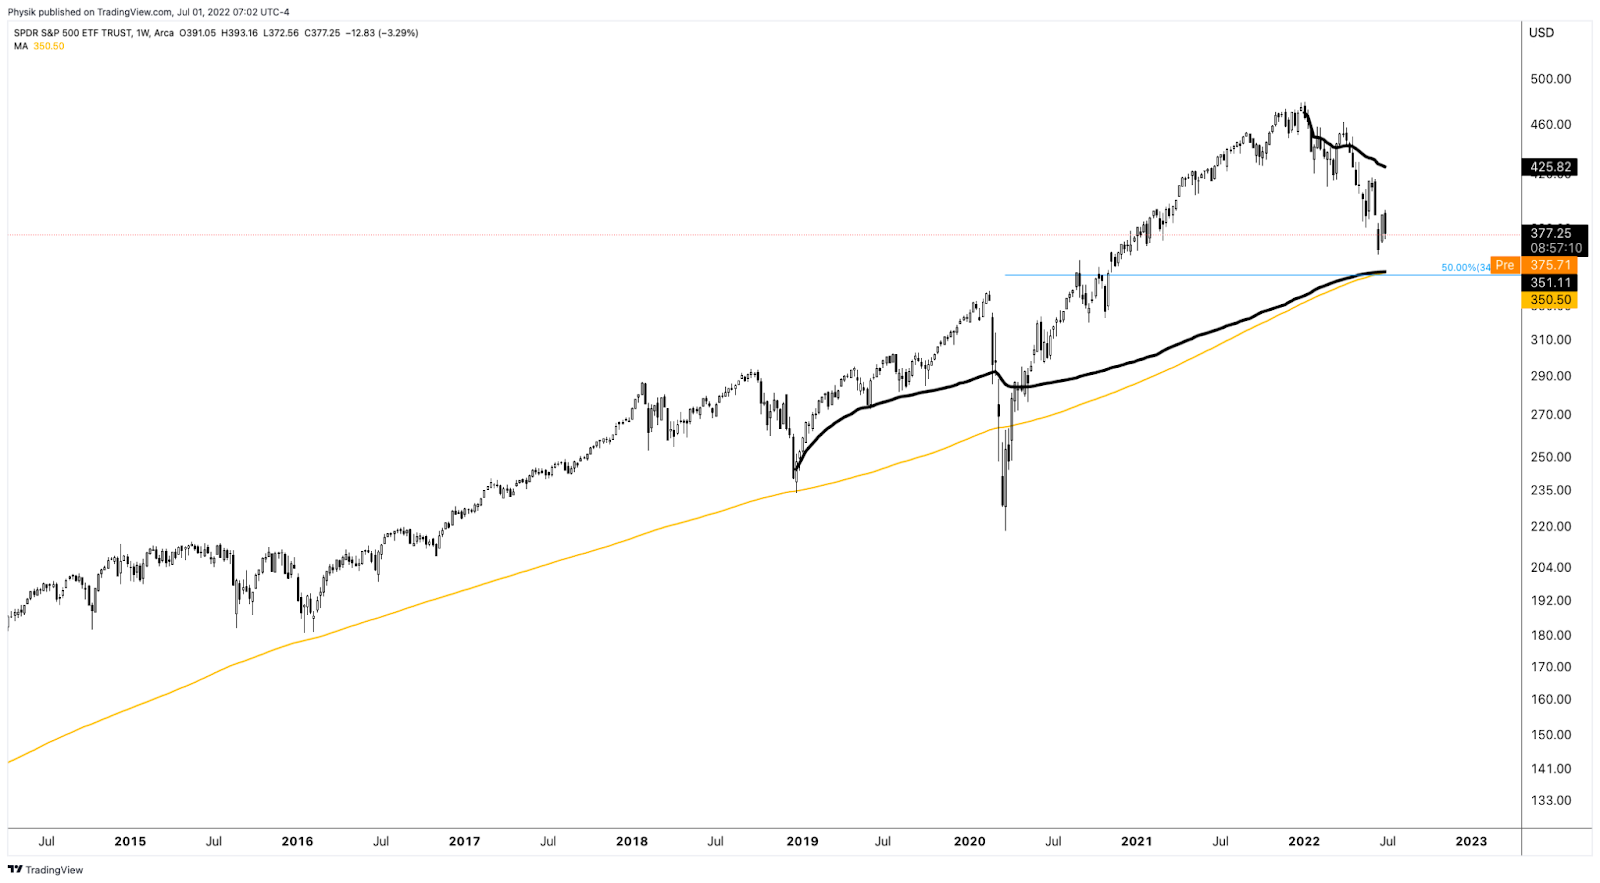
Considerations: At $3,500.00 in the S&P 500 (INDEX: SPX), or $350.00 in the SPDR S&P 500 ETF Trust (NYSE: SPY) is the convergence of multiple visual references.
The 50.00% retracement (COVID-19 low through to 2021 peak), the 200-week moving average, and the volume-weighted average price anchored from the 2018 market bottom all converge at this $3,500.00 ($350.00) high open interest strike.
Graphic: Via TradingView. Taken by Physik Invest. SPDR S&P 500 ETF Trust (NYSE: SPY).
Definitions
Overnight Rally Highs (Lows): Typically, there is a low historical probability associated with overnight rally-highs (lows) ending the upside (downside) discovery process.
Volume Areas: A structurally sound market will build on areas of high volume (HVNodes). Should the market trend for long periods of time, it will lack sound structure, identified as low volume areas (LVNodes). LVNodes denote directional conviction and ought to offer support on any test.
If participants were to auction and find acceptance into areas of prior low volume (LVNodes), then future discovery ought to be volatile and quick as participants look to HVNodes for favorable entry or exit.
About
After years of self-education, strategy development, mentorship, and trial-and-error, Renato Leonard Capelj began trading full-time and founded Physik Invest to detail his methods, research, and performance in the markets.
Capelj also develops insights around impactful options market dynamics at SpotGamma and is a Benzinga reporter.
In no way should the materials herein be construed as advice. Derivatives carry a substantial risk of loss. All content is for informational purposes only.
The daily brief is a free glimpse into the prevailing fundamental and technical drivers of U.S. equity market products. Join the 300+ that read this report daily, below!
Overnight, equity index and commodity futures auctioned lower while bonds, the dollar, and implied volatility metrics were bid at the tail-end of the quarterly rebalancing period.
Pursuant to this letter’s remarks in the days prior, trades biased long volatility are performing well, particularly those structured a standard deviation and beyond prior prices. We’ll unpack why that is, today.
Ahead is data on PCE inflation, disposable income, and consumer spending, as well as jobless claims (8:30 AM ET) and Chicago PMI (9:45 AM ET).
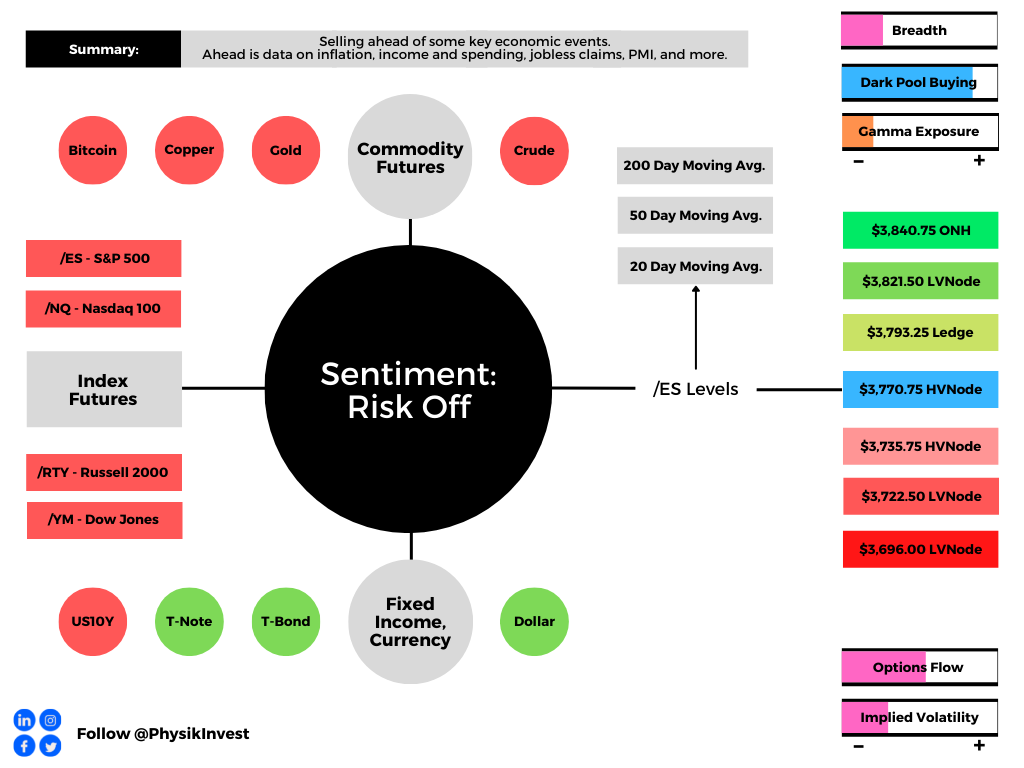
Graphic updated 6:30 AM ET. Sentiment Risk-Off if expected /ES open is below the prior day’s range. /ES levels are derived from the profile graphic at the bottom of the following section. Levels may have changed since initially quoted; click here for the latest levels. SqueezeMetrics Dark Pool Index (DIX) and Gamma (GEX) calculations are based on where the prior day’s reading falls with respect to the MAX and MIN of all occurrences available. A higher DIX is bullish. At the same time, the lower the GEX, the more (expected) volatility. Learn the implications of volatility, direction, and moneyness. SHIFT data used for S&P 500 (INDEX: SPX) options activity. Note that options flow is sorted by the call premium spent; if more positive, then more was spent on call options. Breadth reflects a reading of the prior day’s NYSE Advance/Decline indicator. VIX reflects a current reading of the CBOE Volatility Index (INDEX: VIX) from 0-100.
What To Expect
Fundamental: Discussed in recent letters were the prospects of whether a recession would be necessary for stemming inflation.
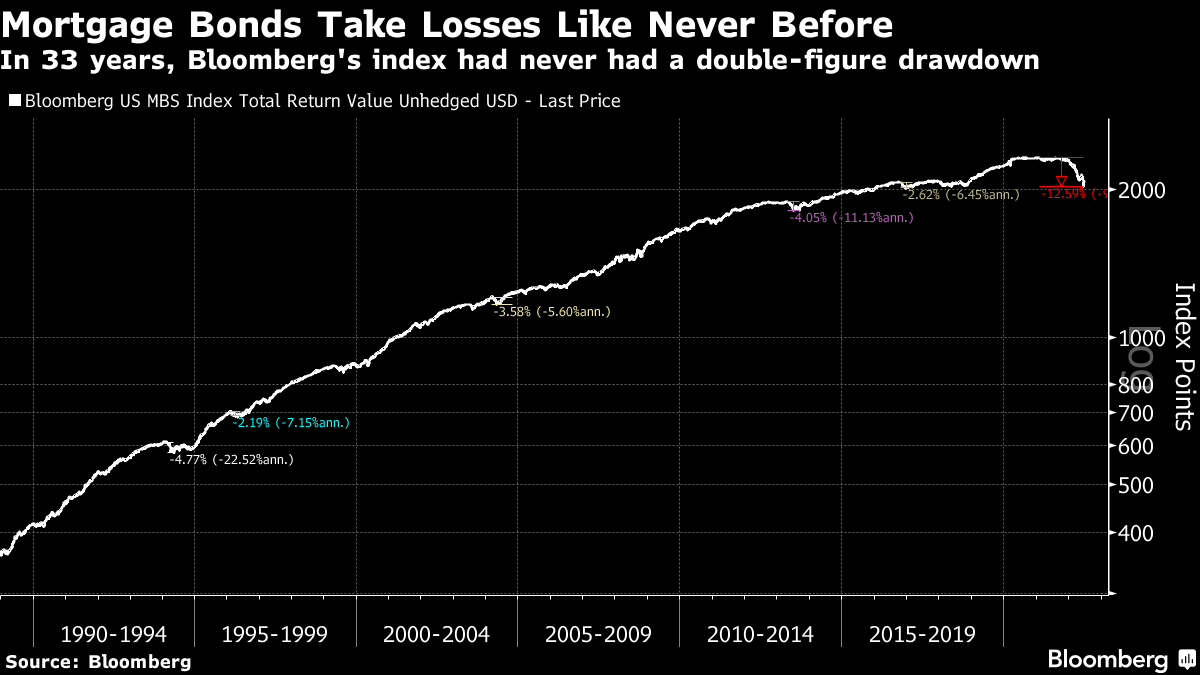
Graphic: Via Bloomberg. “[W]hat’s happened to mortgage-backed bonds this year is a radical departure. Bloomberg’s index dates back to 1988 when the asset class was still in its infancy. This is the first time it has ever withstood a decline that stretches into double figures.”
“That’s the message the market took,” Bloomberg’s John Authers explained. “[T]he most painful surprise over the second half of this year would be for inflation to stay sticky.”
“That would quash the belief in a swift easing campaign in 2023.”
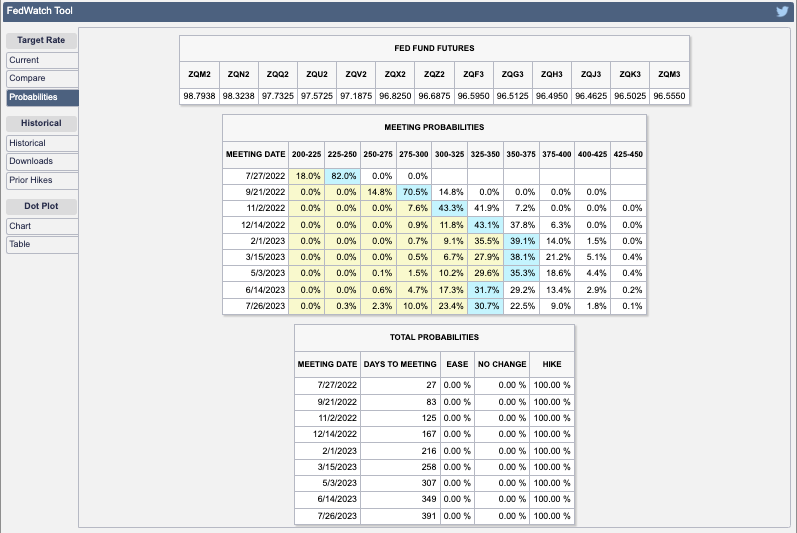
Graphic: CME Group Inc’s (NASDAQ: CME) FedWatch Tool.
Some, like the Federal Reserve’s (Fed) Loretta Mester, suggest that gone are the days to err on the side of being too accommodative.
“It also calls into question the conventional view that monetary policy should always look through supply shocks,” Mester said. “In some circumstances, such shocks could threaten the stability of inflation expectations and would require policy action.”
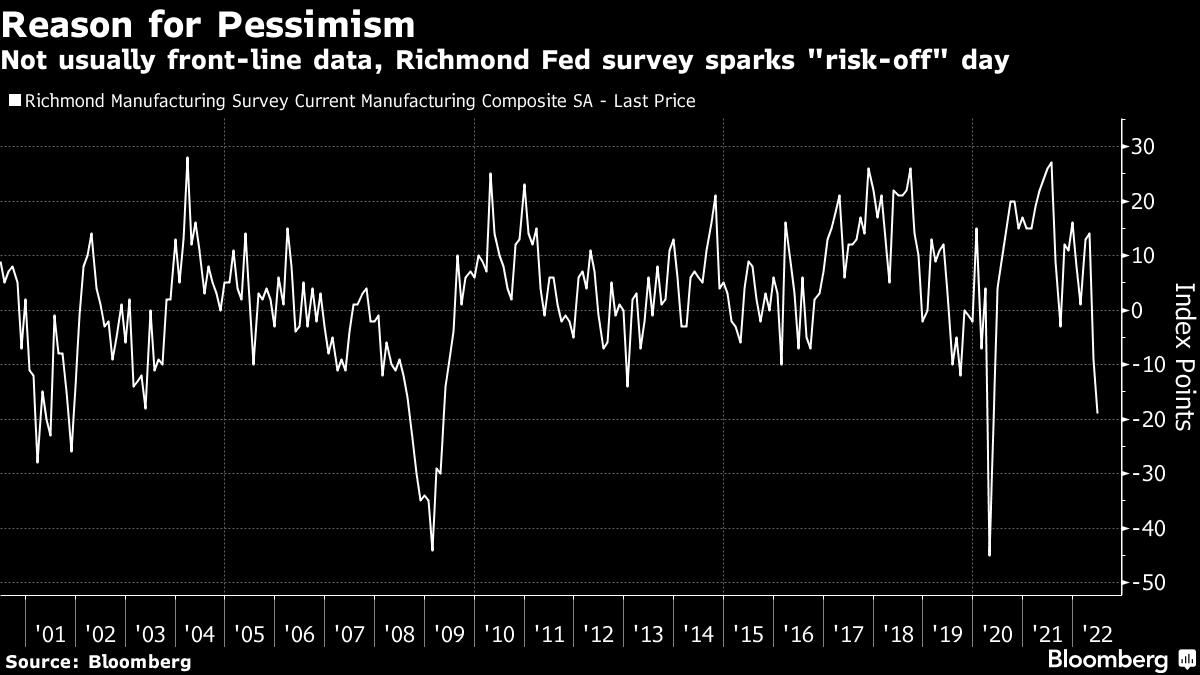
Graphic: Via Bloomberg. “The Richmond Fed’s survey of manufacturing isn’t generally one of the most closely monitored releases, but as this one was the worst since the Great Recession (barring only one month during the Covid shutdown), it garnered more attention than usual.”
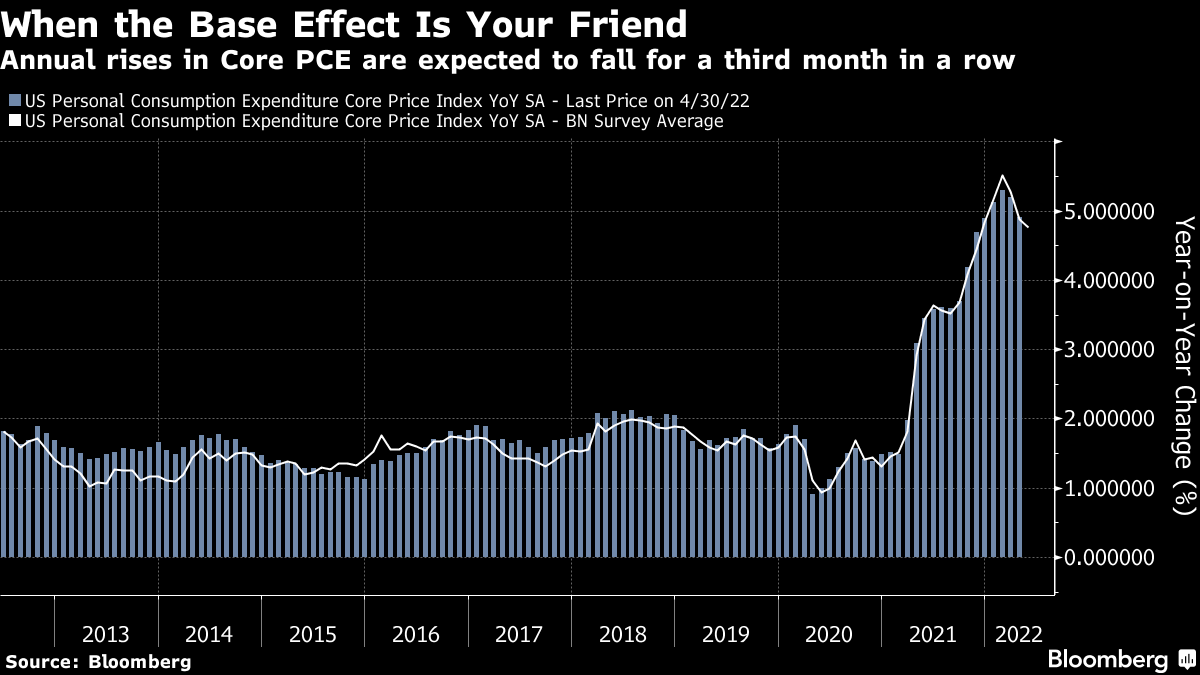
Moreover, the Fed’s preferred inflation measure – the personal consumption expenditure deflator (PCE) – is set to update. The expectation is that core PCE drops, “thanks to base effects from last year,” bolstering the “narrative that inflation will soon be licked.”
Positioning: Discussed, earlier this week, was whether it made sense to lean toward owning volatility, rather than selling it outright.
A “higher starting point” in implied volatility (IVOL), and a still-present right-tail (from the positioning for a bear market rally), made it so we could position, for less cost, in short-dated structures with asymmetric payouts, on both sides of the market.
For instance, S&P 500 (INDEX: SPX) spreads +1 (near-the-money) x -2 (out-of-the-money), in excess of 200 points or so in width and up to 15 days to expiration, are performing well, today, pricing in excess of a 600% gain, only after pricing for little to no cost to enter in the days prior.
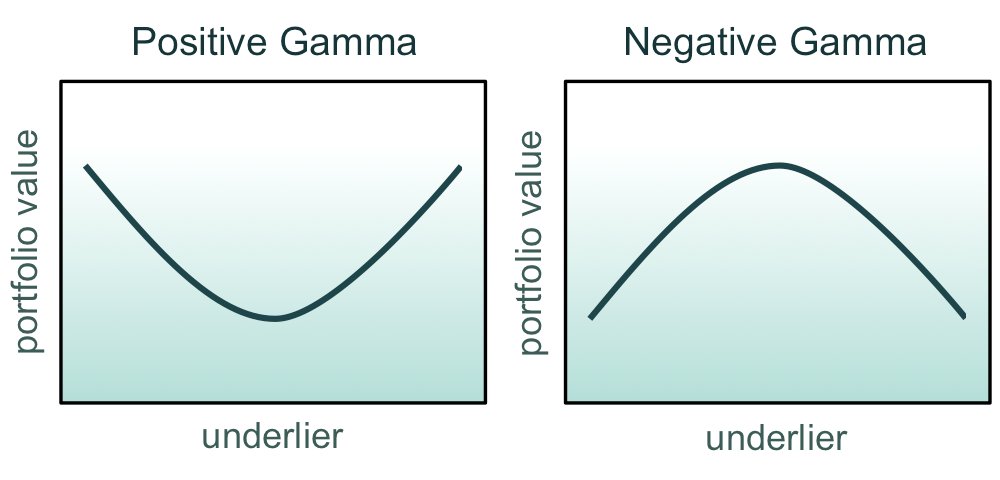
Disclaimer: Have delta in the direction you want the market to move, as well as positive gamma. In our case, we wanted negative delta (short bias) and positive gamma (profits amplified).
Graphic: Via Glyn Holton. “Positive gamma corresponds to curvature that opens upward. Negative gamma corresponds to curvature that opens downward.”
Recent market weaknesses will allow us to monetize and rotate those proceeds into speculative directional bets on the call-side, potentially. After all, the money is made in not losing it. Stay nimble. These are not trade recommendations. Be open-minded.
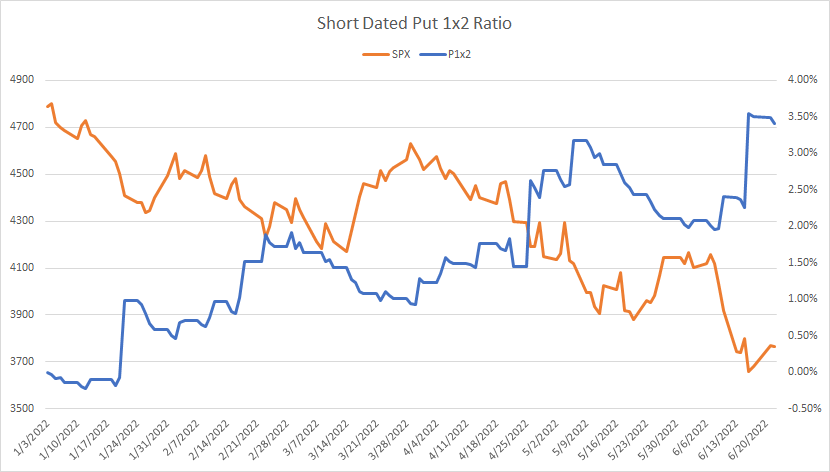
Graphic: Via Pat Hennessy. “[T]he performance of short-dated 1×2 put ratios in SPX this year. Despite being short the tail, the grind lower has been well captured by this trade structure.”
Technical: As of 6:30 AM ET, Thursday’s regular session (9:30 AM – 4:00 PM ET), in the S&P 500, will likely open in the lower part of a negatively skewed overnight inventory, outside of prior-range and -value, suggesting a potential for immediate directional opportunity.
In the best case, the S&P 500 trades higher; activity above the $3,770.75 HVNode puts in play the $3,793.25 Ledge. Initiative trade beyond the Ledge could reach as high as the $3,821.50 LVNode and $3,840.75 ONH, or higher.
In the worst case, the S&P 500 trades lower; activity below the $3,770.75 HVNode puts in play the $3,735.75 HVNode. Initiative trade beyond the HVNode could reach as low as the $3,722.50 LVNode and $3,696.00 LVNode, or lower.
Click here to load today’s key levels into the web-based TradingView charting platform. Note that all levels are derived using the 65-minute timeframe. New links are produced, daily.
Graphic: 65-minute profile chart of the Micro E-mini S&P 500 Futures.
Considerations: Responsiveness near key-technical areas (that are discernable visually on a chart), suggests technically-driven traders with short time horizons are very active.
Such traders often lack the wherewithal to defend retests and, additionally, the type of trade may be indicative of the other time frame participants waiting for more information to initiate trades.
Definitions
Overnight Rally Highs (Lows): Typically, there is a low historical probability associated with overnight rally-highs (lows) ending the upside (downside) discovery process.
Volume Areas: A structurally sound market will build on areas of high volume (HVNodes). Should the market trend for long periods of time, it will lack sound structure, identified as low volume areas (LVNodes). LVNodes denote directional conviction and ought to offer support on any test.
If participants were to auction and find acceptance into areas of prior low volume (LVNodes), then future discovery ought to be volatile and quick as participants look to HVNodes for favorable entry or exit.
About
After years of self-education, strategy development, mentorship, and trial-and-error, Renato Leonard Capelj began trading full-time and founded Physik Invest to detail his methods, research, and performance in the markets.
Capelj also develops insights around impactful options market dynamics at SpotGamma and is a Benzinga reporter.
In no way should the materials herein be construed as advice. Derivatives carry a substantial risk of loss. All content is for informational purposes only.
The daily brief is a free glimpse into the prevailing fundamental and technical drivers of U.S. equity market products. Join the 300+ that read this report daily, below!
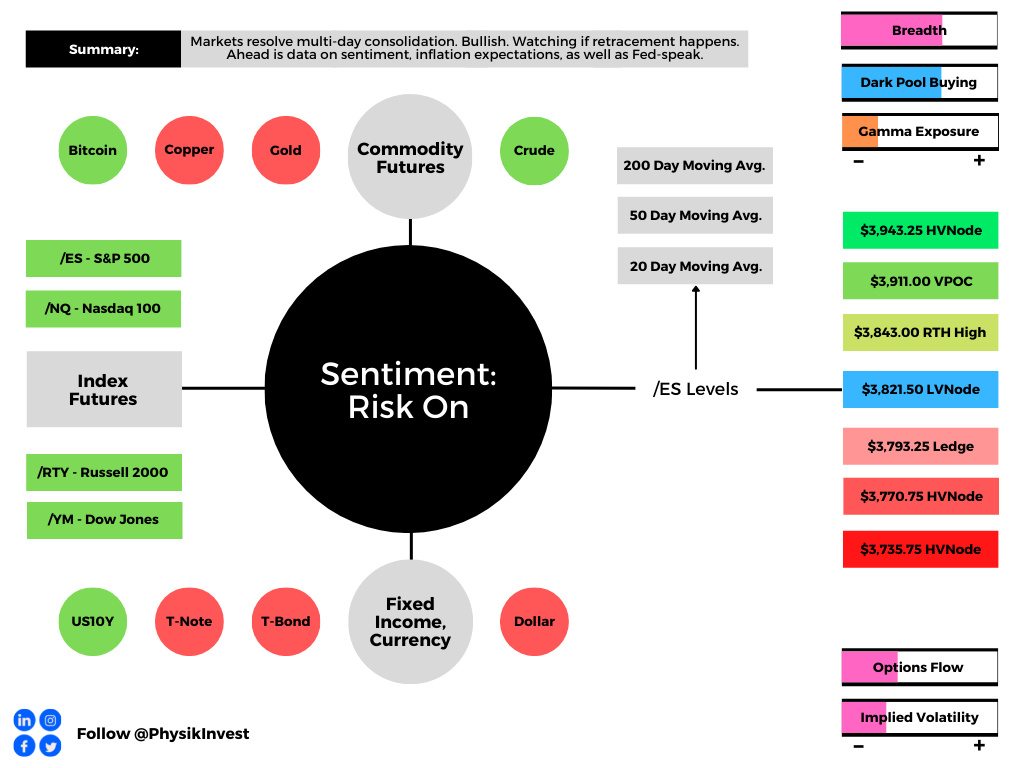
Overnight, equity index futures resolved a multi-day consolidation and auctioned higher, far beyond the prior day’s range. Commodities were mixed while bonds were lower.
The break from consolidation is one of the most bullish happenings in weeks. We’re monitoring whether participants add to their recent short volatility bets against direction, or whether there is repositioning and this bolsters the initiative probe.
Ahead is data on University of Michigan consumer sentiment, inflation expectations, and new home sales (10:00 AM ET), as well as some Fed speak (7:30 AM and 4:00 PM ET).
Graphic updated 6:40 AM ET. Sentiment Risk-On if expected /ES open is above the prior day’s range. /ES levels are derived from the profile graphic at the bottom of the following section. Levels may have changed since initially quoted; click here for the latest levels. SqueezeMetrics Dark Pool Index (DIX) and Gamma (GEX) calculations are based on where the prior day’s reading falls with respect to the MAX and MIN of all occurrences available. A higher DIX is bullish. At the same time, the lower the GEX, the more (expected) volatility. Learn the implications of volatility, direction, and moneyness. SHIFT data used for S&P 500 (INDEX: SPX) options activity. Note that options flow is sorted by the call premium spent; if more positive, then more was spent on call options. Breadth reflects a reading of the prior day’s NYSE Advance/Decline indicator. VIX reflects a current reading of the CBOE Volatility Index (INDEX: VIX) from 0-100.
What To Expect
Fundamental: To start, I want to apologize for any confusion, yesterday, with respect to the /GE Eurodollar quote. This newsletter said the peak of the Fed-rate-hike cycle – terminal rate – sat near December 2023.
That’s wrong. It’s December 2022.
Graphic: Via Charles Schwab Corporation-owned (NYSE: SCHW) TD Ameritrade’s Thinkorswim. The Eurodollar (FUTURE: /GE) futures curve is a reflection of participants’ outlook on interest rates. The peak of the Fed-rate-hike cycle – terminal rate – is around DEC 20[22].
Okay, moving on, now!
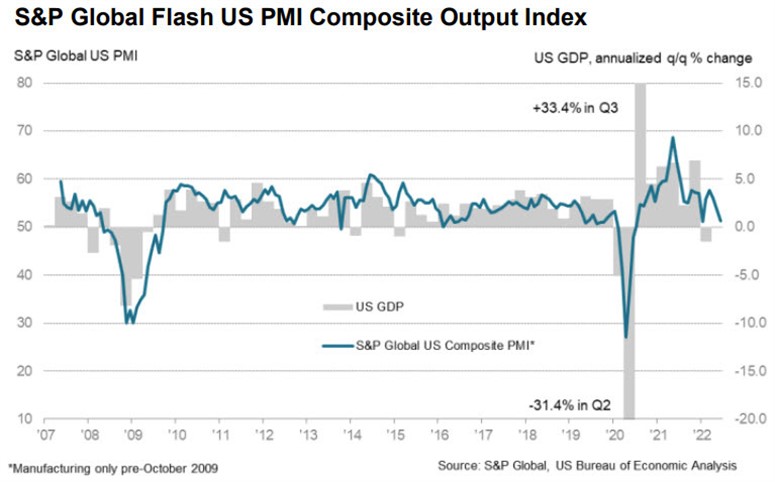
New data is pointing to a “remarkable” drop in demand for goods and services during June, compared to months prior.
“US economic growth has slowed sharply in June, with deteriorating forward-looking indicators setting the scene for an economic contraction in the third quarter,” S&P Global (NYSE: SPGI) Market Intelligence’s Chris Williamson explained.
“The survey data are consistent with the economy expanding at an annualized rate of less than 1% in June, with the goods-producing sector already in decline and the vast service sector slowing sharply.”
Graphic: Via S&P Global Inc. “This is a sizeable miss and evidence of a quick slowdown in demand, though it’s still in positive territory (above 50). This report is consistent with a shifting narrative away from inflation worries and towards growth worries.”
Businesses (particularly in retail) are way “more concerned about the outlook” of costs and demand, as well as the path in monetary policies and deterioration in financial conditions.
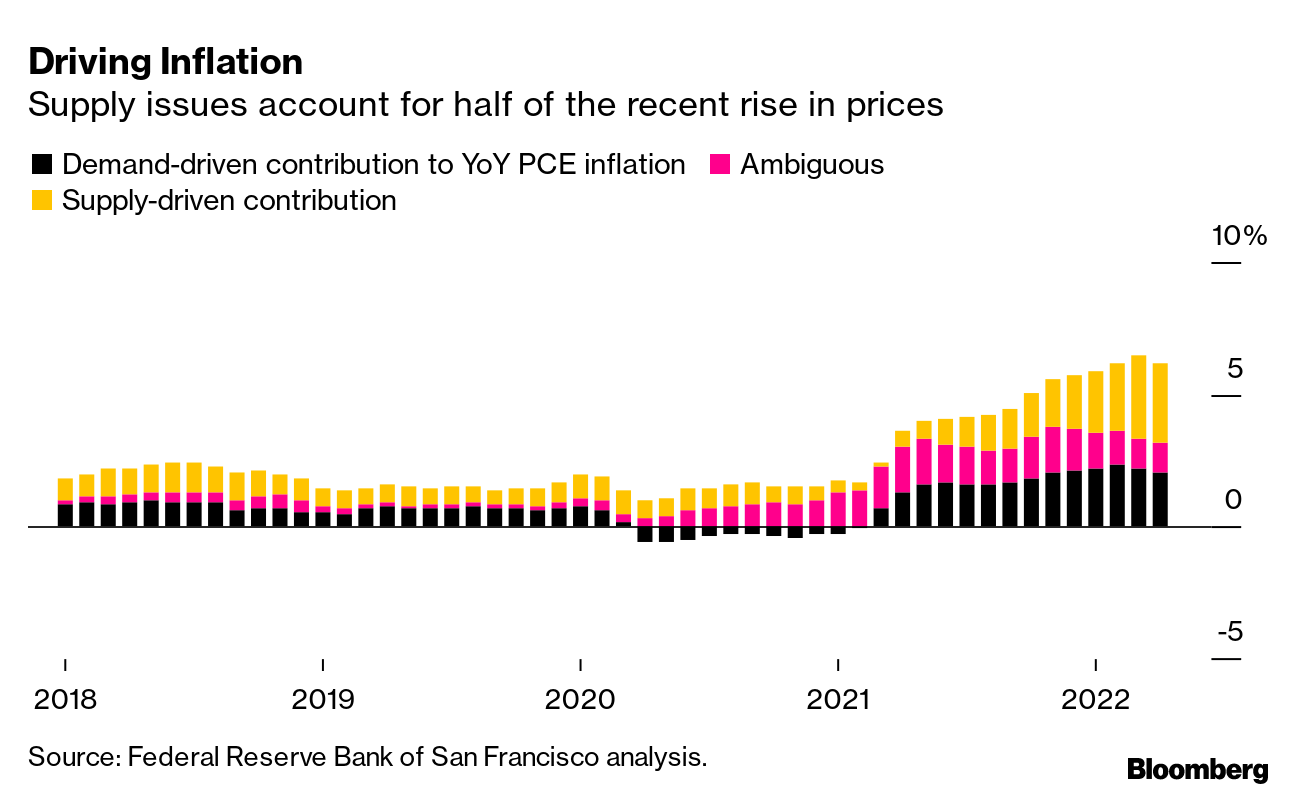
Graphic: Via Bloomberg. “Supply constraints, exacerbated by Russia’s war in Ukraine this year, account for about half of the surge in US inflation, with demand currently making up a third of the increase, according to new research from the Federal Reserve Bank of San Francisco.”
That’s validated by Tesla Inc’s (NASDAQ: TSLA) CEO Elon Musk speaking about the carmaker’s losses from new plants, supply chain problems, and the like.
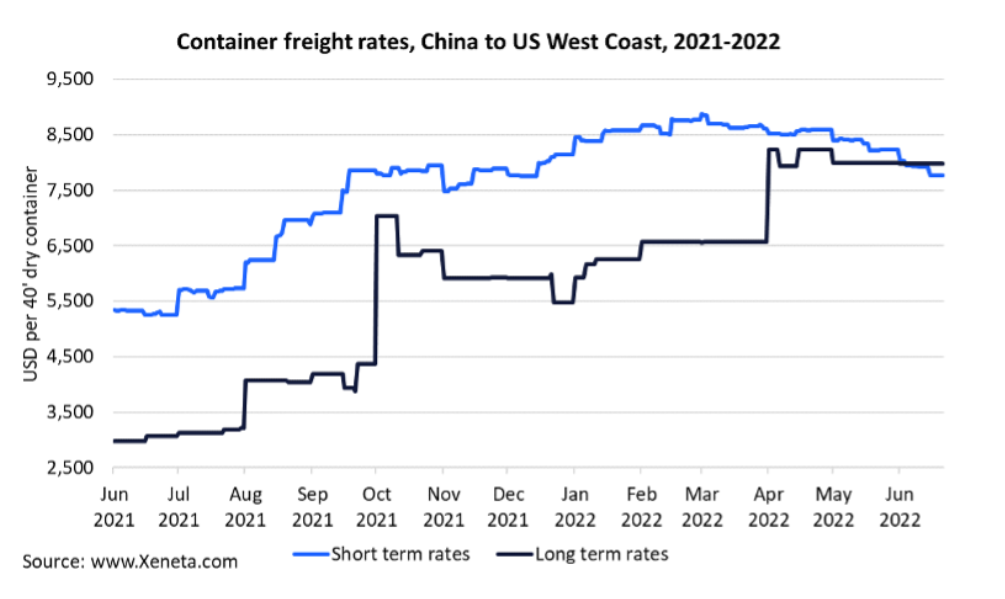
Graphic: Via Bloomberg. “Long-term ocean freight rates between China and the US West Coast are higher than spot prices for the first time since April 2020.”
“The past two years have been an absolute nightmare of supply chain interruptions, one thing after another,” Musk said.
“We’re not out of it yet. That’s overwhelmingly our concern is how do we keep the factories operating so we can pay people and not go bankrupt.”
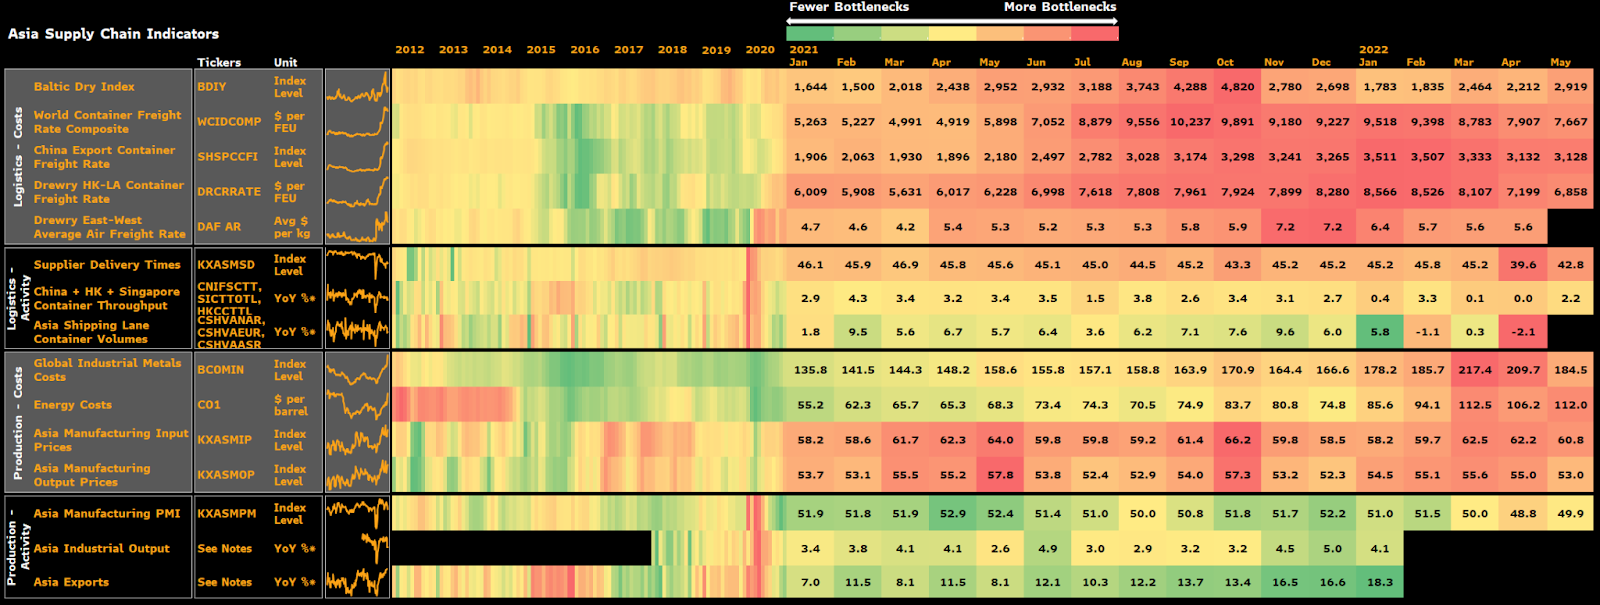
Graphic: Via Bloomberg. “Supply chains in Asia look to be on the mend,” though it will “ take a while for supply and demand to rebalance.”
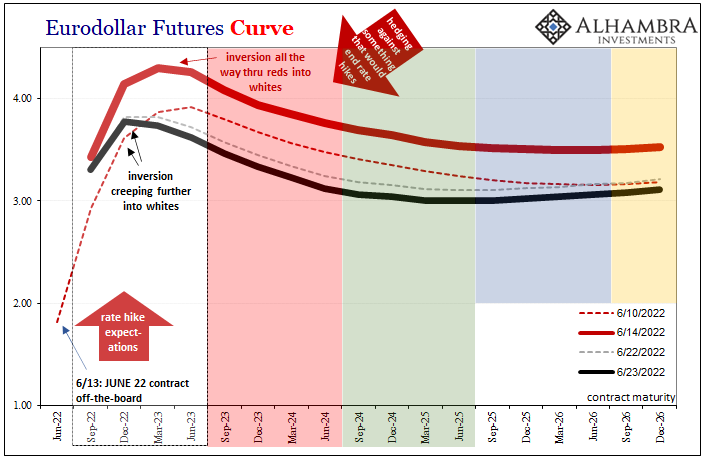
It’s a global move into recession all at once, as Jeffrey Snider of Alhambra Investments says.
“Combine the potential for break in repo collateral with economy heading toward recession, no wonder the Euro[dollar] curve inversion is spreading as rapidly as it has. Possibility of something big going wrong, therefore ending rate hikes, is huge now.”
“Euro[dollar] squeeze, collateral shortage, deflationary potential in money, and now demand destruction in global real economy.”
Graphic: Via Alhambra Investments.
Over the last four decades, monetary policy was a go-to for supporting the economy. Money was sent to capital and that promoted innovation and, by that token, deflation, ultimately creating “unimportance to cash flows,” as well put by Kai Volatility’s Cem Karsan.
Now, there’s a strong commitment to reducing liquidity and credit, all the while there are chokepoints monetary policymakers have little control over.
This has consequences on the real economy and asset prices, accordingly, which rose and kept deflationary pressures at bay. A stock market drop is both a recession and a direct reflection of the unwind of carry. It is the manifestation of a deflationary shock, and today’s poor sentiments and economic data reflects this.
At the same time, “bonds are not acting as a hedge and appear to be becoming less ‘money’ like due persistent declines in price and elevated rate vol,” as Joseph Wang puts it.
Bank deposits are to drain about $1 trillion or so by year-end, prompting investors to “continue to lower their selling prices to compete for the cash they want.”
Retail buyers, who, according to Michael Wang of Prometheus Alternative Investments, “were a significant driver of the inflated valuations we saw in tech and crypto,” are capitulating in stocks, all the while froth in housing markets is soon to abate, likewise.
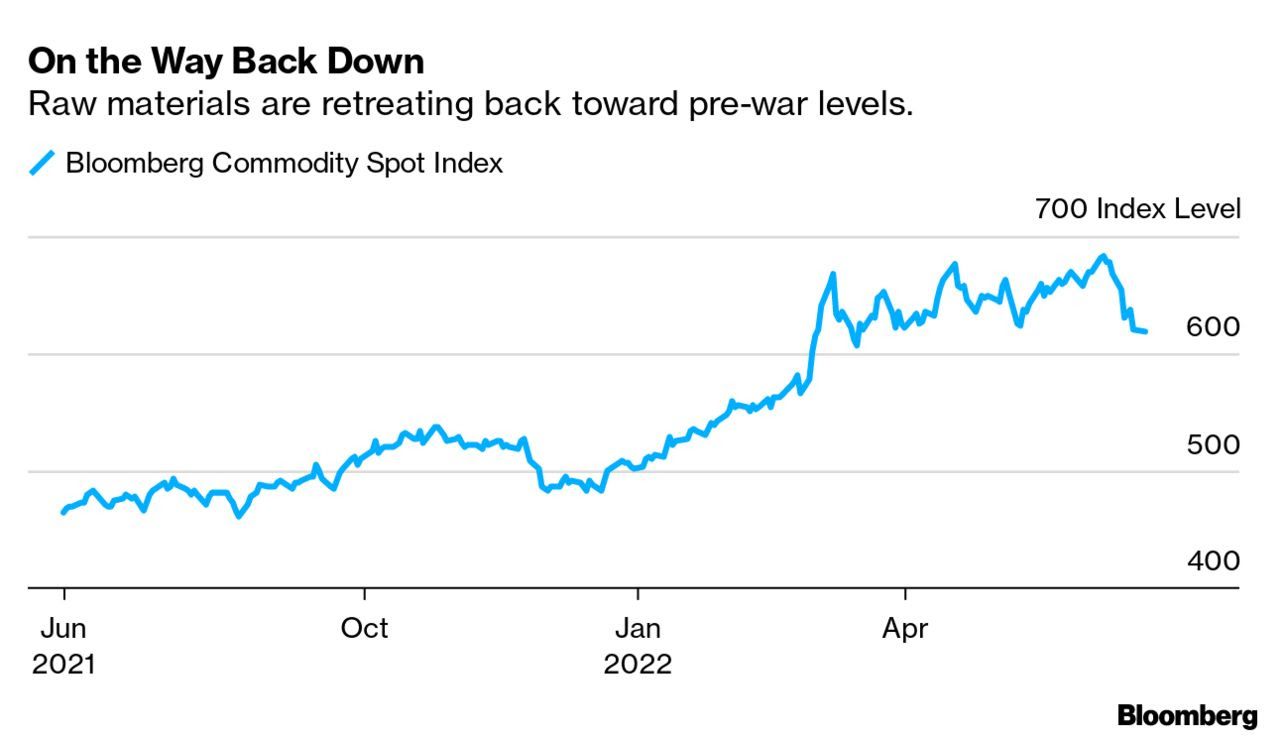
Notwithstanding, Mark Zandi of Moody’s Corporation (NYSE: MCO) does not see “the kind of mortgage defaults and distressed sales that would be necessary for big declines in housing values,” just as prices of raw materials are retreating as inventories are bloating.
As put forth, partially, earlier this week, one has to wonder about the likelihood that inflation is near its high and whether the de-rates have played their course.
Let’s keep an open mind and follow up on this, in detail, next week.
Graphic: Via Bloomberg. “The hot commodities rally is cooling off fast as recession fears again ground and cloud the outlook for demand.”
Positioning: Keeping this section short.
As stated yesterday, a feature of the equity sell-off is the suppression of implied volatility (IVOL) versus that which the market realizes (RVOL) given that participants are hedged and volatility remains in strong supply.
Options data and insights platform SqueezeMetrics explained that this is due in part to lower leverage, too.
“Leveraged long S&P lost favor (understandable), and marginal demand for puts went with it. Creeping into net selling territory is ‘smart’ bear market positioning. Short delta, short skew.”
As I said in SpotGamma’s note, last night, given “the high starting point in IVOL, as well as its place in relation to [RVOL], it makes sense to own structures that benefit either from sharp changes in underlying price or an abrupt repricing in volatility.”
Cutting into the realization of a sharp change in underlying price or a far-reaching rally, however, are short-volatility bets across shorter maturity periods (and the associated hedging), as well as big (and popularized) positions set to roll off at the quarter-end.
Liquidity providers, per SpotGamma, all else equal, will have to sell to re-hedge, and we will talk about this further, next week.
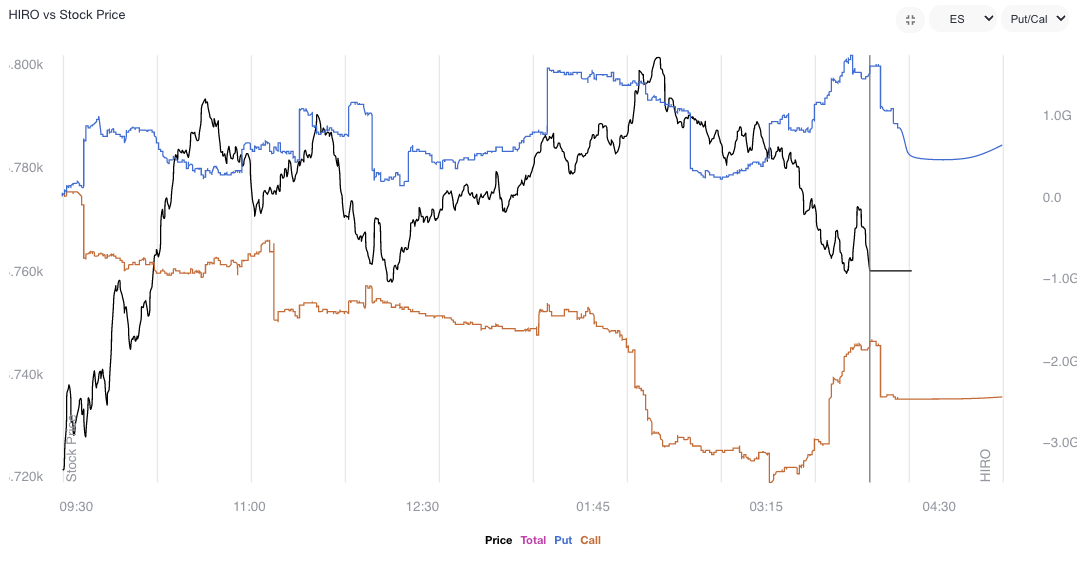
Graphic: Taken 6/22/2022. SpotGamma’s Hedging Impact of Real-Time Options (HIRO) indicator points to selling of put and call options in the S&P 500 (INDEX: SPX) and S&P 500 ETF (SPY). Those liquidity providers, who are on the other side, are more exposed to long volatility, which they hedge by buying (selling) into weakness (strength) underlying.
Technical: As of 6:40 AM ET, Friday’s regular session (9:30 AM – 4:00 PM ET), in the S&P 500, will likely open in the upper part of a positively skewed overnight inventory, outside of prior-range and -value, suggesting a potential for immediate directional opportunity.
In the best case, the S&P 500 trades higher; activity above the $3,821.50 LVNode puts in play the $3,843.00 RTH High. Initiative trade beyond the RTH High could reach as high as the $3,911.00 VPOC and $3,943.25 HVNode, or higher.
In the worst case, the S&P 500 trades lower; activity below the $3,821.50 LVNode puts in play the $3,793.25 ledge. Initiative trade beyond the ledge could reach as low as the $3,770.75 HVNode and $3,735.75 HVNode, or lower.
Click here to load today’s key levels into the web-based TradingView charting platform. Note that all levels are derived using the 65-minute timeframe. New links are produced, daily.
Graphic: 65-minute profile chart of the Micro E-mini S&P 500 Futures.
Considerations: Recent trade has been lackluster and the overnight break is the most bullish happening in weeks. The go-to trade this week was short volatility. Participants responded to tests of key visual areas, and sold options, particularly in shorter maturities.
In the coming session(s), some of those participants will respond to the break in a manner that bolsters the initiative drive. Notwithstanding, the key to watch for is whether participants will use the bump as an opportunity to add to their most recent short volatility bets against the direction.
Ultimately, the more time that is spent outside of the prior consolidation area, the likelihood that the breakout is a signal to look for dips to buy and play rotations to key areas up above.
Definitions
Volume Areas: A structurally sound market will build on areas of high volume (HVNodes). Should the market trend for long periods of time, it will lack sound structure, identified as low volume areas (LVNodes). LVNodes denote directional conviction and ought to offer support on any test.
If participants were to auction and find acceptance into areas of prior low volume (LVNodes), then future discovery ought to be volatile and quick as participants look to HVNodes for favorable entry or exit.
POCs: POCs are valuable as they denote areas where two-sided trade was most prevalent in a prior day session. Participants will respond to future tests of value as they offer favorable entry and exit.
Balance-Break + Gap Scenarios: A change in the market (i.e., the transition from two-time frame trade, or balance, to one-time frame trade, or trend) is occurring.
Monitor for acceptance (i.e., more than 1-hour of trade) outside of the balance area.
Leaving value behind on a gap-fill or failing to fill a gap (i.e., remaining outside of the prior session’s range) is a go-with indicator.
Rejection (i.e., return inside of balance) portends a move to the opposite end of the balance.
About
After years of self-education, strategy development, mentorship, and trial-and-error, Renato Leonard Capelj began trading full-time and founded Physik Invest to detail his methods, research, and performance in the markets.
Capelj also develops insights around impactful options market dynamics at SpotGamma and is a Benzinga reporter.
In no way should the materials herein be construed as advice. Derivatives carry a substantial risk of loss. All content is for informational purposes only.
The Daily Brief is a free glimpse into the prevailing fundamental and technical drivers of U.S. equity market products. Join the 200+ that read this report daily, below!
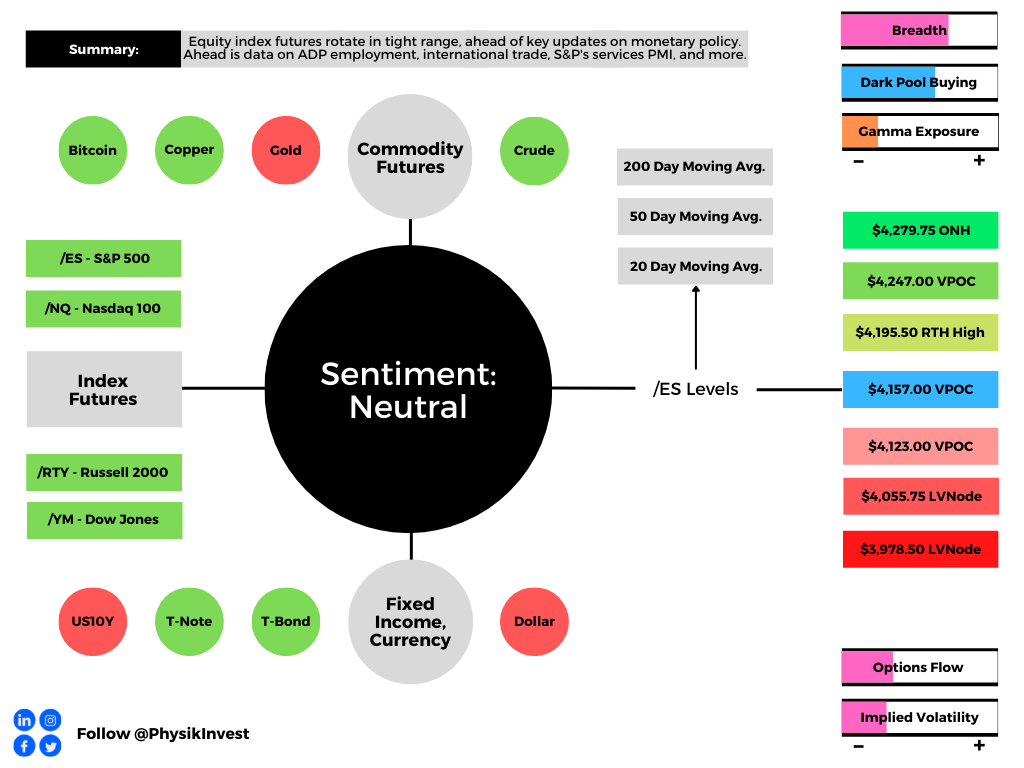
Overnight, equity index futures were quiet, auctioning sideways-to-higher, ahead of updates on monetary policies.
A check on some naive measures suggests we’re in for an expansion of range (i.e., heightened realized volatility) in the coming session(s). Key, today, are Federal Open Market Committee (FOMC) updates (2:00 PM ET) and a news conference (2:30 PM ET).
The expectation is a 50 basis point hike and balance sheet contraction with run-off caps of $95 billion. If the action is in line with expectations (priced in), the reaction is likely to be positive.
Today’s economic calendar includes, also, a release of the Automatic Data Processing Inc’s (NASDAQ: ADP) employment report (8:15 AM ET), international trade balance (8:30 AM ET), S&P Global Inc’s (NYSE: SPGI) U.S. services PMI (9:45 AM ET), and the ISM services index (10:00 AM ET).
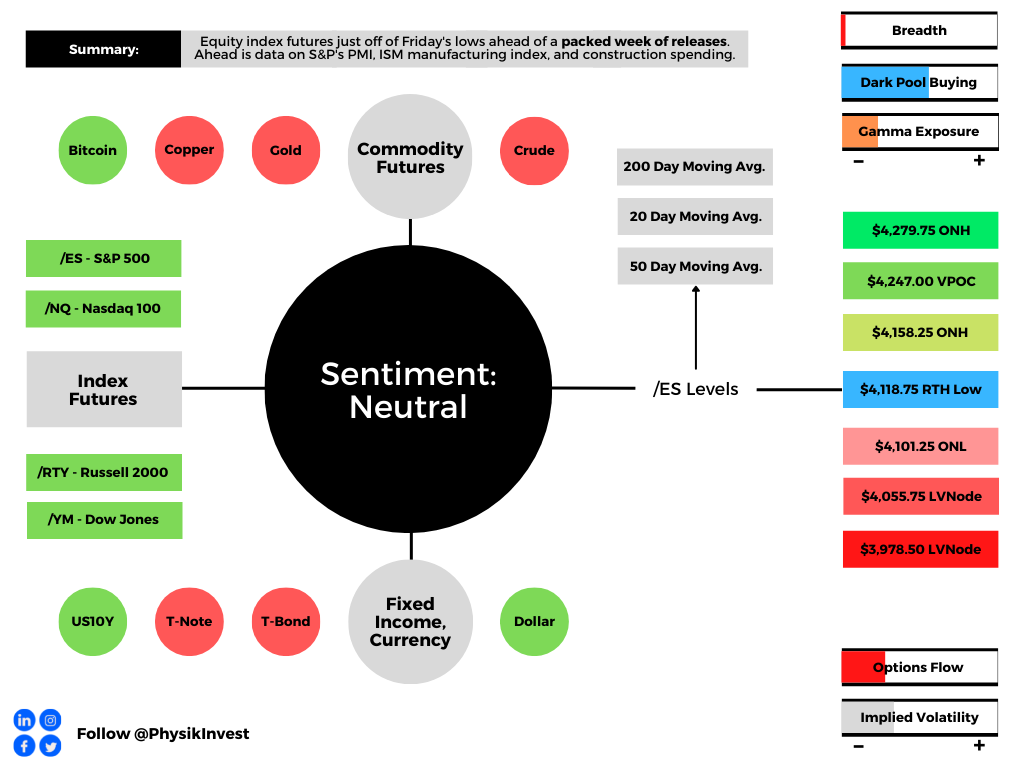
Graphic updated 7:00 AM ET. Sentiment Neutral if expected /ES open is inside of the prior day’s range. /ES levels are derived from the profile graphic at the bottom of the following section. Levels may have changed since initially quoted; click here for the latest levels. SqueezeMetrics Dark Pool Index (DIX) and Gamma (GEX) calculations are based on where the prior day’s reading falls with respect to the MAX and MIN of all occurrences available. A higher DIX is bullish. At the same time, the lower the GEX, the more (expected) volatility. Learn the implications of volatility, direction, and moneyness. SHIFT data used for S&P 500 (INDEX: SPX) options activity. Note that options flow is sorted by the call premium spent; if more positive, then more was spent on call options. Breadth reflects a reading of the prior day’s NYSE Advance/Decline indicator. VIX reflects a current reading of the CBOE Volatility Index (INDEX: VIX) from 0-100.
What To Expect
Fundamental: Expected is front-loaded tightening, by the Federal Reserve (Fed), today.
The consensus is anchored around a 50 basis-point hike in May and no adjustments to the Reverse Repo Rate (RRP) or Interest on Reserve Balances (IORB), says Nordea Bank (OTC: NRDBY) research. The Fed may opt, also, to initiate a 75 basis-point hike in June.
“We believe that after the FOMC hikes by a half-point in May and presents a detailed plan to reduce the Fed balance sheet,” imminently, says Anna Wong, Yelena Shulyatyeva, Andrew Husby, and Eliza Winger of Bloomberg.
“Powell will avoid definitive guidance about the size of future hikes, as policymakers assess how the runoff is affecting the economy in coming months.”
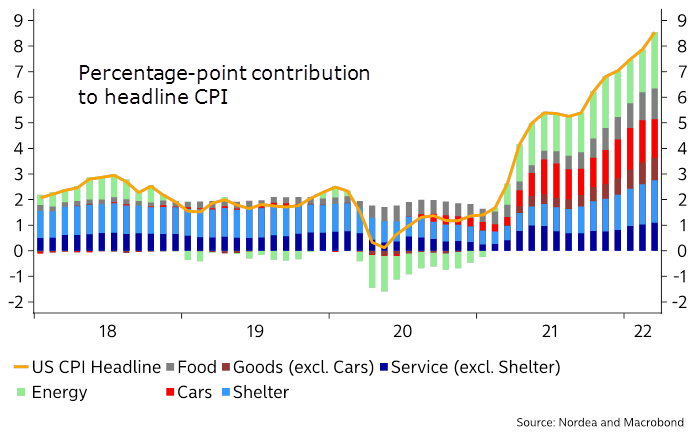
Graphic: Via Nordea research. Heightened inflation, exacerbated by sticky supply pressures and the conflict in Ukraine, and trends in demand have played into a tough talk on monetary policies.
As noted before, the key (risk) is the statements on the Fed’s balance sheet and the (imminent) process to shrink it through quantitative tightening (QT).
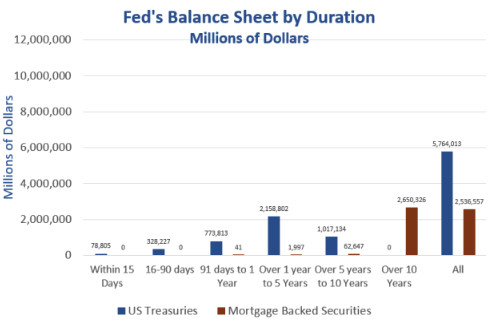
Graphic: Via Mish Talk. “The Fed expanded QE aggressively for years. But nearly all of that expansion was longer-dated securities as the [] chart shows. If the Fed had short-term securities it could reduce its balance sheet simply by runoff. Instead, the Fed will aggressively have to sell securities, especially MBS, if it really wants to reduce its balance sheet as quickly as it has implied.
Per Nordea, QT is likely to consist of a 3-month phase-in period and run-off caps of $95 billion (i.e., $60 billion on U.S. Treasuries [USTs] and $35 billion in mortgage-backed securities [MBSs]), effectively lowering the Fed’s balance sheet by $670 billion by year-end.
Graphic: Via Bloomberg and Mitsubishi UFJ Financial Group Inc (NYSE: MUFG) U.S. Macro Strategy.
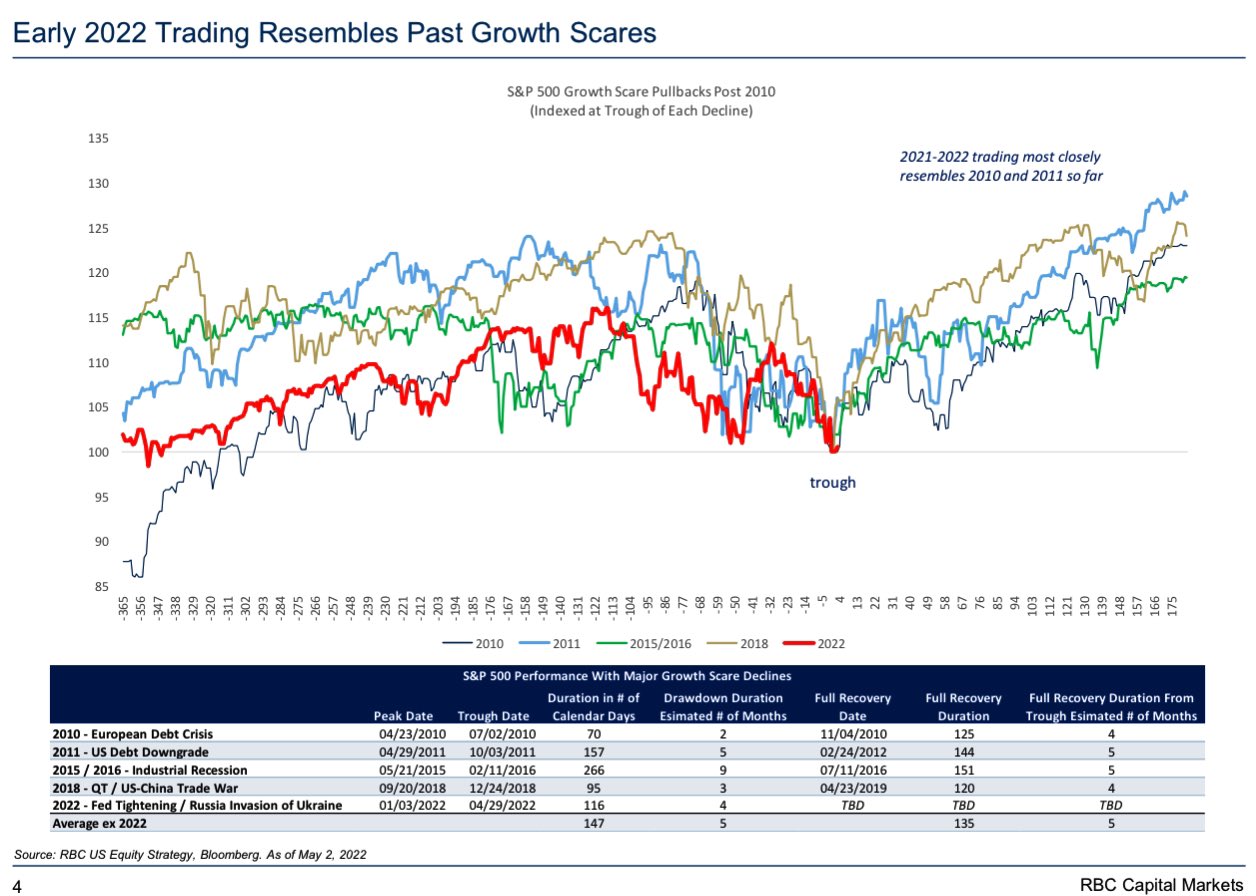
This is alongside the realization that “1Q may be the last good quarter of earnings as higher costs and increased recession risks weigh on future growth,” Morgan Stanley’s (NYSE: MS) Mike Wilson explains.
Graphic: Via Royal Bank of Canada (NYSE: RY) U.S. Equity Strategy and Bloomberg.
Market weakness in the past weeks was the result of “growing evidence that growth is slowing faster than most investors believe,” Wilson adds, and “the market is currently so oversold, any good news [such as Fed action being as expected] could lead to a vicious bear market rally.”
“We can’t rule anything out in the short term but we want to make it clear this bear market is far from complete.”
Happy Fed Day: not all Fed Days are created =, but here’s a little historic data 🤔 pic.twitter.com/WKTVgn8D2m
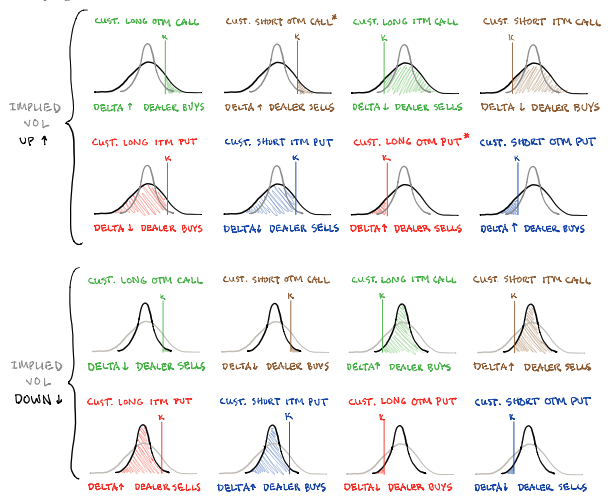
Positioning: Borrowing from yesterday’s letter, as little has changed, bets on the direction are concentrated in negative delta (long puts, short calls). The exposure is short-dated and highly sensitive to changes in implied volatility and direction.
Graphic: SqueezeMetrics on “how IV, direction, and moneyness cause option dealers to buy or sell the underlying.”
This exposure’s roll-off and compression in volatility ought to coincide with liquidity provider support to markets (i.e., relief of pressure from hedges to concentrated options positioning).
Per Kai Volatility’s Cem Karsan, on a Fed day, “the first move tends to be structural. A function of the inevitable rebalancing of dealer inventory post-event. The second move and final resolution, if you wait for it, is usually tied to the incremental effects on liquidity (QE/QT).”
Validation of the latter (move) ought to be confirmed by participants’ new concentration of bets. In other words, if participants start to concentrate their bets at higher prices, further out in time, that confirms (changing sentiment) and (improves) the odds of sustained follow-through.
If not, it’s likely that prices, after a short-term relief, will succumb to fundamental weaknesses.
Technical: As of 7:00 AM ET, Wednesday’s regular session (9:30 AM – 4:00 PM ET), in the S&P 500, will likely open in the upper part of a balanced overnight inventory, just inside of prior-range and -value, suggesting a limited potential for immediate directional opportunity.
In the best case, the S&P 500 trades higher; activity above the $4,157.00 untested point of control (VPOC) puts in play the $4,195.50 regular trade high (RTH High). Initiative trade beyond the RTH High could reach as high as the $4,247.00 VPOC and $4,279.75 overnight high (ONH), or higher.
In the worst case, the S&P 500 trades lower; activity below the $4,157.00 VPOC puts in play the $4,123.00 VPOC. Initiative trade beyond the $4,123.00 VPOC could reach as low as the $4,055.75 and $3,978.50 low volume areas (LVNodes), or lower.
Click here to load today’s key levels into the web-based TradingView charting platform. Note that all levels are derived using the 65-minute timeframe. New links are produced, daily.
Graphic: 65-minute profile chart of the Micro E-mini S&P 500 Futures.
What People Are Saying
1/x It is time to wake up to the fact that the Fed has little to no power to control price inflation…the fact that they are charged w/ price stability in today’s economy is a charade….For 43 yrs the Fed has lowered rates & For 43 yrs the result of this policy has been secular
Overnight Rally Highs (Lows): Typically, there is a low historical probability associated with overnight rally-highs (lows) ending the upside (downside) discovery process.
Volume Areas: A structurally sound market will build on areas of high volume (HVNodes). Should the market trend for long periods of time, it will lack sound structure, identified as low volume areas (LVNodes). LVNodes denote directional conviction and ought to offer support on any test.
If participants were to auction and find acceptance into areas of prior low volume (LVNodes), then future discovery ought to be volatile and quick as participants look to HVNodes for favorable entry or exit.
POCs: POCs are valuable as they denote areas where two-sided trade was most prevalent in a prior day session. Participants will respond to future tests of value as they offer favorable entry and exit.
Volume-Weighted Average Prices (VWAPs): A metric highly regarded by chief investment officers, among other participants, for quality of trade. Additionally, liquidity algorithms are benchmarked and programmed to buy and sell around VWAPs.
About
After years of self-education, strategy development, mentorship, and trial-and-error, Renato Leonard Capelj began trading full-time and founded Physik Invest to detail his methods, research, and performance in the markets.
Capelj also develops insights around impactful options market dynamics at SpotGamma and is a Benzinga reporter.
In no way should the materials herein be construed as advice. Derivatives carry a substantial risk of loss. All content is for informational purposes only.
The Daily Brief is a free glimpse into the prevailing fundamental and technical drivers of U.S. equity market products. Join the 200+ that read this report daily, below!
Overnight, equity index futures auctioned off of Friday’s regular trade lows. Yields, the dollar, and implied volatility metrics were bid.
There were no changes in the newsflow’s tone this weekend; investors remain concerned over the implications of monetary policy shifts and inflation, as well as war, COVID, and the supply pressures associated.
Ahead is data on S&P Global Inc’s (NYSE: SPGI) U.S. manufacturing PMI (9:45 AM ET), as well as the ISM manufacturing index and construction spending (10:00 AM ET).
Graphic updated 6:30 AM ET. Sentiment Neutral if expected /ES open is inside of the prior day’s range. /ES levels are derived from the profile graphic at the bottom of the following section. Levels may have changed since initially quoted; click here for the latest levels. SqueezeMetrics Dark Pool Index (DIX) and Gamma (GEX) calculations are based on where the prior day’s reading falls with respect to the MAX and MIN of all occurrences available. A higher DIX is bullish. At the same time, the lower the GEX, the more (expected) volatility. Learn the implications of volatility, direction, and moneyness. SHIFT data used for S&P 500 (INDEX: SPX) options activity. Note that options flow is sorted by the call premium spent; if more positive, then more was spent on call options. Breadth reflects a reading of the prior day’s NYSE Advance/Decline indicator. VIX reflects a current reading of the CBOE Volatility Index (INDEX: VIX) from 0-100.
What To Expect
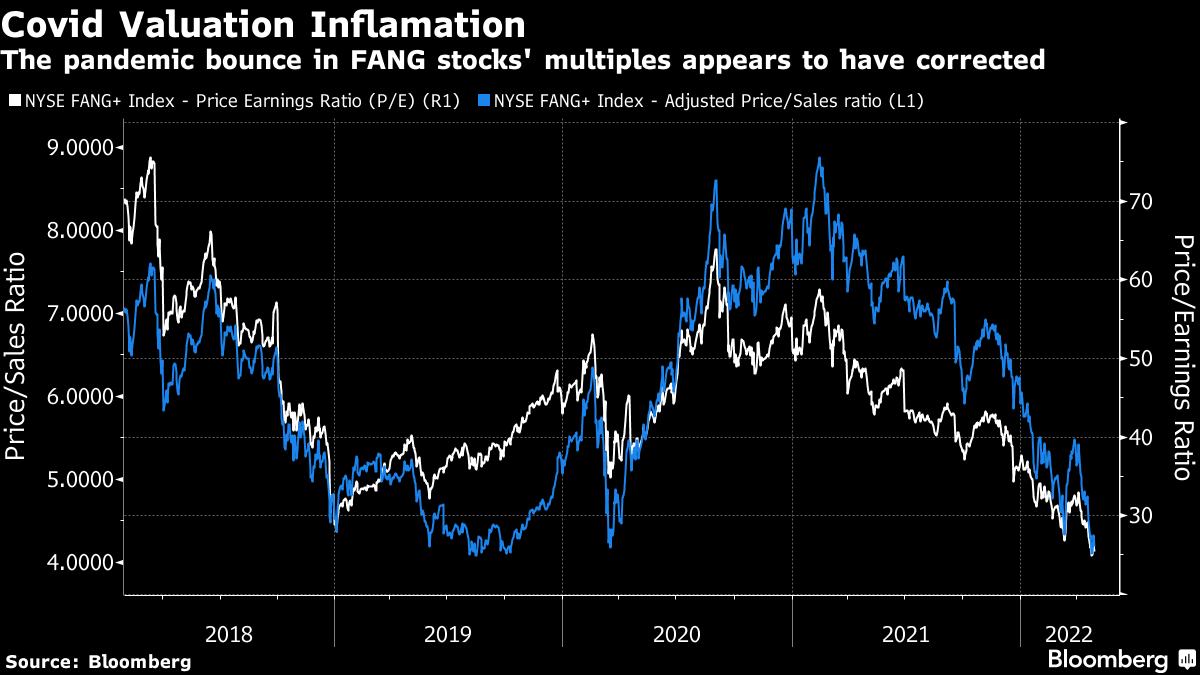
Fundamental: The indexes continue to hold well in the context of severe weaknesses under the hood, so to speak, especially in the high-flying technology and growth of 2020-2021.
Stocks like Zoom Video Communications (NASDAQ: ZM) and Netflix Inc (NASDAQ: NFLX), the beneficiaries of the work-from-home trends, have de-rated substantially since the start of 2022.
In spite of earnings growth (~10% for S&P 500 companies that have reported, per Bloomberg), “the reaction to earnings surprises in April was asymmetric,” and a display of “the outsized role played by outliers.”
For context, “Mega-cap growth (MCG) & Tech earnings are missing by -6.0% at the aggregate level [while] the median company [is] beating by 5.7%.”
This is as inflation, among other factors, continues to bite into the “over-optimistic multiples driven by the assumption that pandemic-era performance could continue in perpetuity.”
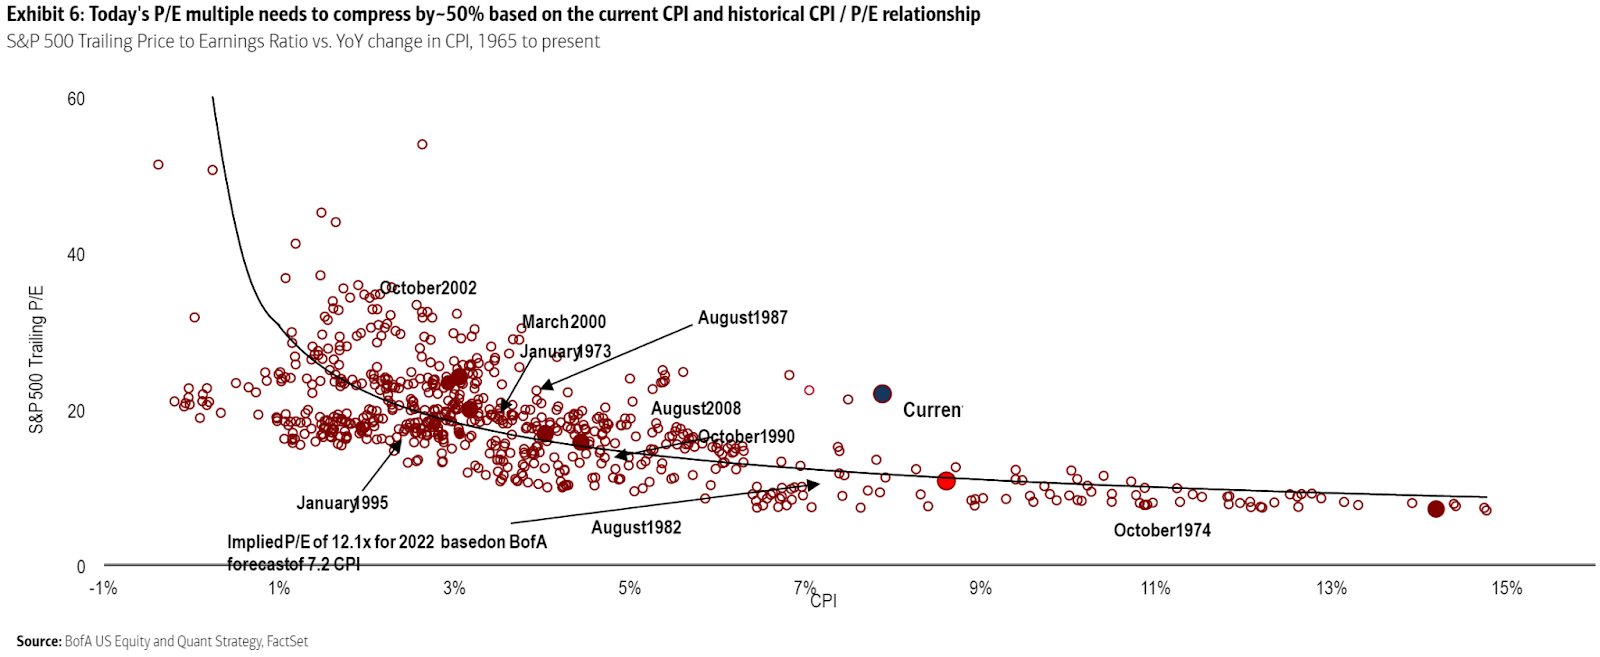
Per Bank of America Corporation (NYSE: BAC), the S&P’s current P/E is way too high, given the current CPI.
Graphic: Via Bank of America Corporation. Taken from Bloomberg. “It’s straightforward common sense that higher inflation would lead to paying a lower multiple of earnings because you expect future earnings to be eaten into by inflation. And common sense is borne out empirically; all else equal, higher inflation does indeed tend to mean lower earnings multiples.”
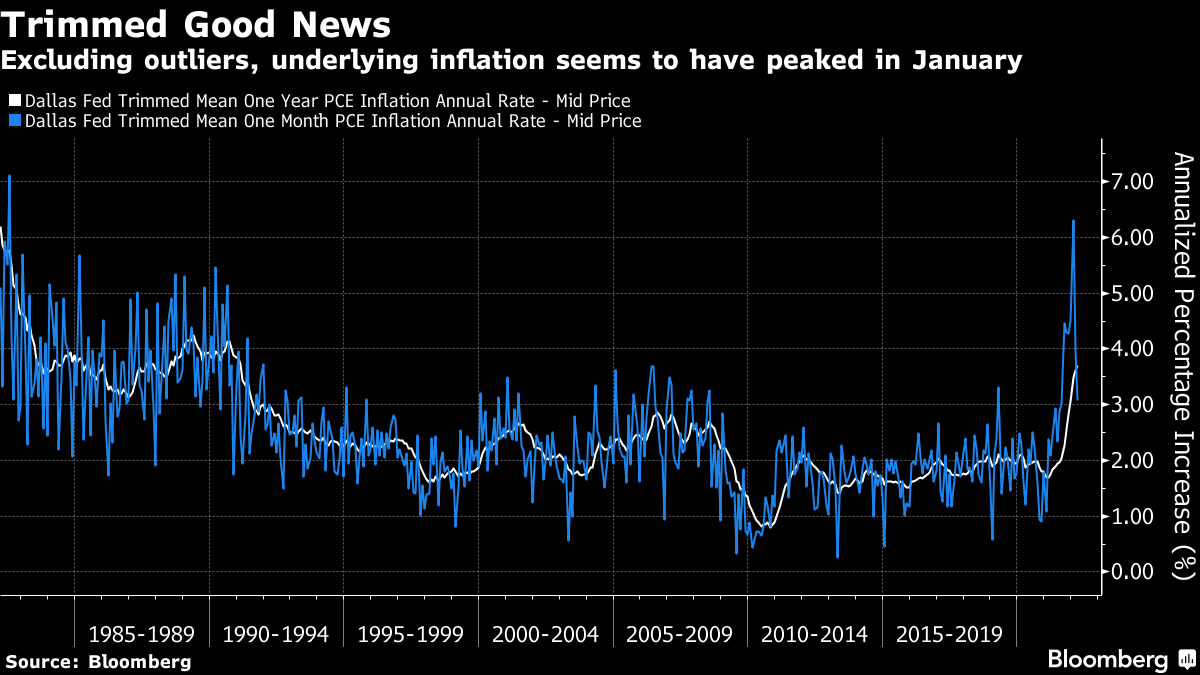
Notwithstanding, trimming outliers, inflation may have peaked and that is a positive for those equity investors who think “inflation is high, but they’re confident that it’s transitory,” therefore current valuations are just.
Per @ConvexityMaven, recession chatter is unwarranted. The economy is expanding and the only worry investors should have is “if the Fed cannot chill nominal GDP.”
That means “rates are going north” and, according to Bank of America Corporation’s Michael Hartnett, “asset prices must reset lower.”
Some investors, like the Japanese, have heeded this message and are offloading billions in Treasuries in anticipation of more attractive levels and “stabilization in long-dated yields.”
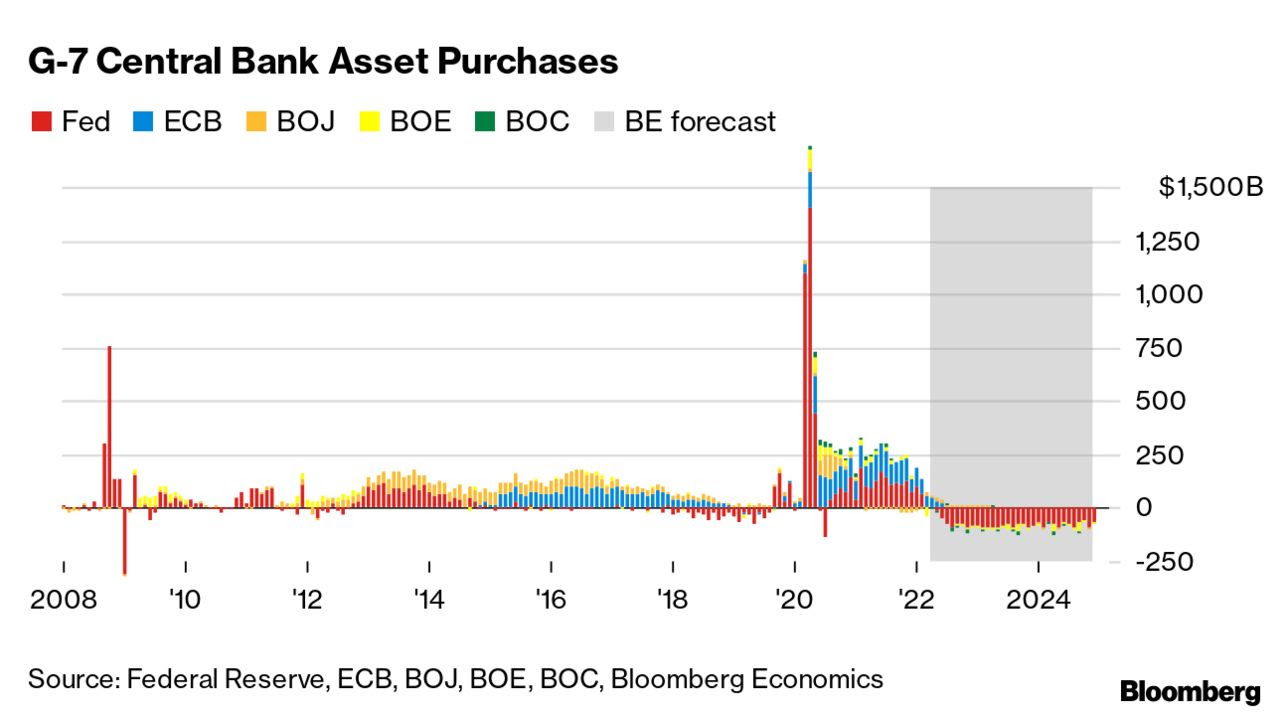
Perspectives: Some, including Credit Suisse Group AG’s (NYSE: CS) Zoltan Pozsar, believe market participants are in for a world of [much more] hurt as “central banks can only deal with nominal, not real chokepoints.”
“Banks’ stock buybacks are lowering SLRs as we speak, and the Fed is about to embark on QT, and these nominal balance sheet and liquidity trends, will at some point clash with the realities of a garden variety of supply chain issues,” as a result of geopolitical chokepoints.
Graphic: Per Bloomberg, “[E]very $1 trillion of QT will equate to a decline of roughly 10% in stocks over the next 12 months or so.”
Given Pozsar’s findings, “The Fed will do QE again by summer 2023.”
Positioning: Recall that the indexes are trading relatively strong, in comparison to constituents, especially those that are smaller technology and growth companies.
Essentially, “we’re two-thirds of the way through a dot-com type collapse,” explains Simplify Asset Management’s Mike Green.
“It’s just happened underneath the surface of the indices which is [that] … dynamic of passive flows supporting the largest stocks within the index, whereas the smaller stocks can be influenced to a greater extent by the behavior of discretionary managers.”
This liquidity supply, apart from passive flows, stems from index-level hedging pressures, also.
Here’s why, as borrowed from our April 27, 2022 commentary.
Participants are well-hedged and use weakness as an opportunity to buy into a less highly valued broader market.
Well-hedged means that customers (i.e., you and I) own protection against long equity exposure. So, that could mean customers own puts and/or are short calls. One of the most dominant flows is the long put, short call.
Such trade offers customers positive, yet asymmetric (gamma), exposure to direction (delta). In other words, negative delta and positive gamma.
The counterparty has exposure to positive delta and negative gamma. If the underlyings trade lower and volatility rises, all else equal, the position will lose. To hedge against these losses, the counterparties will sell underlying into weakness.
If prices reverse and move higher, these counterparties will re-hedge and buy underlying.
Normally, as seen over the bull run of 2020 and 2021, markets are in an uptrend and there’s a strong supply of volatility. Often, customers sell more calls than puts and, in an uptrend, those calls solicit more active hedging than the put options.
Recall that the customer is short the call. That means the counterparty is long the call (a positive delta and gamma trade) and will make money if prices rise, all else equal.
The hedging of this particular exposure (i.e., sell strength, buy weakness), in an uptrend, occurs slower (i.e., counterparts will allow their profits to run), and that’s what can help the market sustain lower volatility trends for longer periods.
When prices reverse and underlyings trade lower, put options solicit increased hedging activity. Given the nature of counterparty exposure to those puts, that hedging happens quickly and can take from market liquidity as to volatility (i.e., buy strength, sell weakness).
Graphic: Via SqueezeMetrics. Equity move lower solicits increased hedging activity of put options. Counterparties have negative gamma exposure to these puts. Therefore, to hedge, they buy strength and sell weakness, adding to realized volatility. This trend is ongoing.
So, what now?
Participants are most concerned (and hedging against) unforeseen monetary policy action and economic chokepoints like a potential Russian default.
Investors will get clarity on some of these issues in the coming sessions.
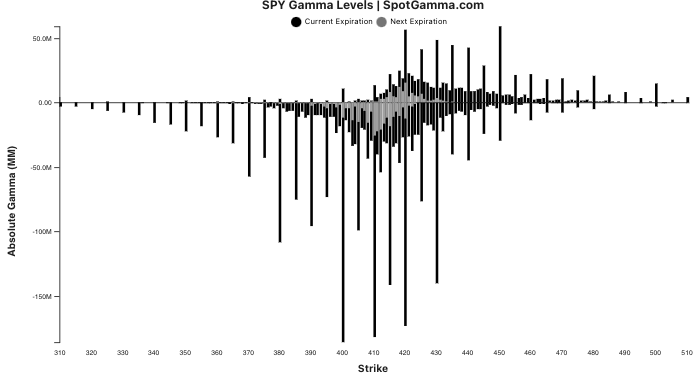
Graphic: Via SpotGamma, the estimated gamma for calls by strike as a positive number and puts as a negative number on the S&P 500 ETF, the SPY. Notice the weight on the put side.
Barring a worst-case scenario, if markets do not perform to the downside (i.e., do not trade lower), those highly-priced (often very short-dated) bets on direction will quickly decay, and hedging flows with respect to time and volatility may bolster sharp rallies.
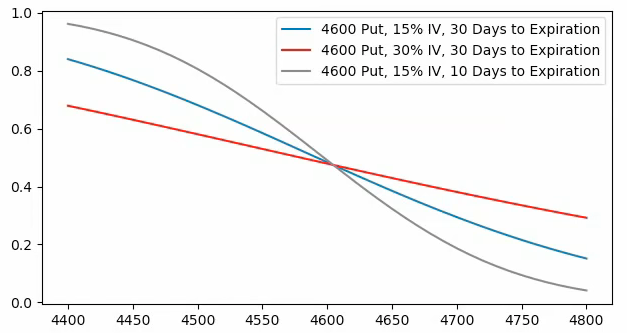
Graphic: Via SpotGamma. “SPX prices X-axis. Option delta Y-axis. When the factors of implied volatility and time change, hedging ratios change. For instance, if SPX is at $4,700.00 and IV jumps 15% (all else equal), the dealer may sell an additional 0.2 deltas to hedge their exposure to the addition of a positive 0.2 delta. The graphic is for illustrational purposes, only.”
Whether those price rises kick off a sustained reversal depends on what the fundamental situation is, then.
Presently, the largest index constituents are starting to succumb to worsening fundamentals and that will, ultimately, feed into the indexes which are pinned due to passive and hedging flows.
In other words, fundamentals will trump this talk of positioning (i.e., it is only in the short-term does this positioning we’ve talked about have greater implications).
Consideration: The returns distribution, based on implied volatility metrics alone, is skewed positive (though there are some large negative outliers pursuant to The Ambrus Group’s Kris Sidial recent explanation that despite negative sentiment, “nobody is truly scared” and “Fixed strike vols continue to underperform, along with the lack of concern in the VX term structure”).
Caution.
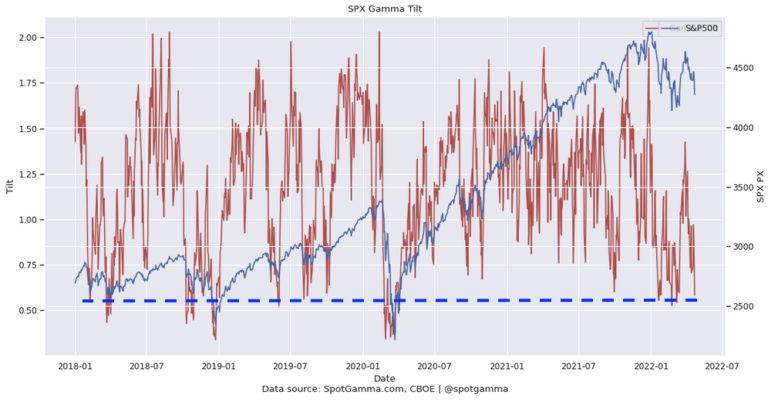
Graphic: Via SpotGamma, “Put vs Call gamma suggests stretched positioning.”
Technical: As of 6:30 AM ET, Monday’s regular session (9:30 AM – 4:00 PM ET), in the S&P 500, will likely open in the middle part of a balanced overnight inventory, inside of prior-range and -value, suggesting a limited potential for immediate directional opportunity.
In the best case, the S&P 500 trades higher; activity above the $4,118.75 regular trade low (RTH Low) puts in play the $4,158.25 overnight high (ONH). Initiative trade beyond the ONH could reach as high as the $4,247.00 untested point of control (VPOC) and $4,279.75 ONH, or higher.
In the worst case, the S&P 500 trades lower; activity below the $4,118.75 RTH Low puts in play the $4,101.25 overnight low (ONL). Initiative trade beyond the ONL could reach as low as the $4,055.75 low volume area (LVNode) and $3,978.50 low volume area (LVNode), or lower.
Click here to load today’s key levels into the web-based TradingView charting platform. Note that all levels are derived using the 65-minute timeframe. New links are produced, daily.
Graphic: 65-minute profile chart of the Micro E-mini S&P 500 Futures.
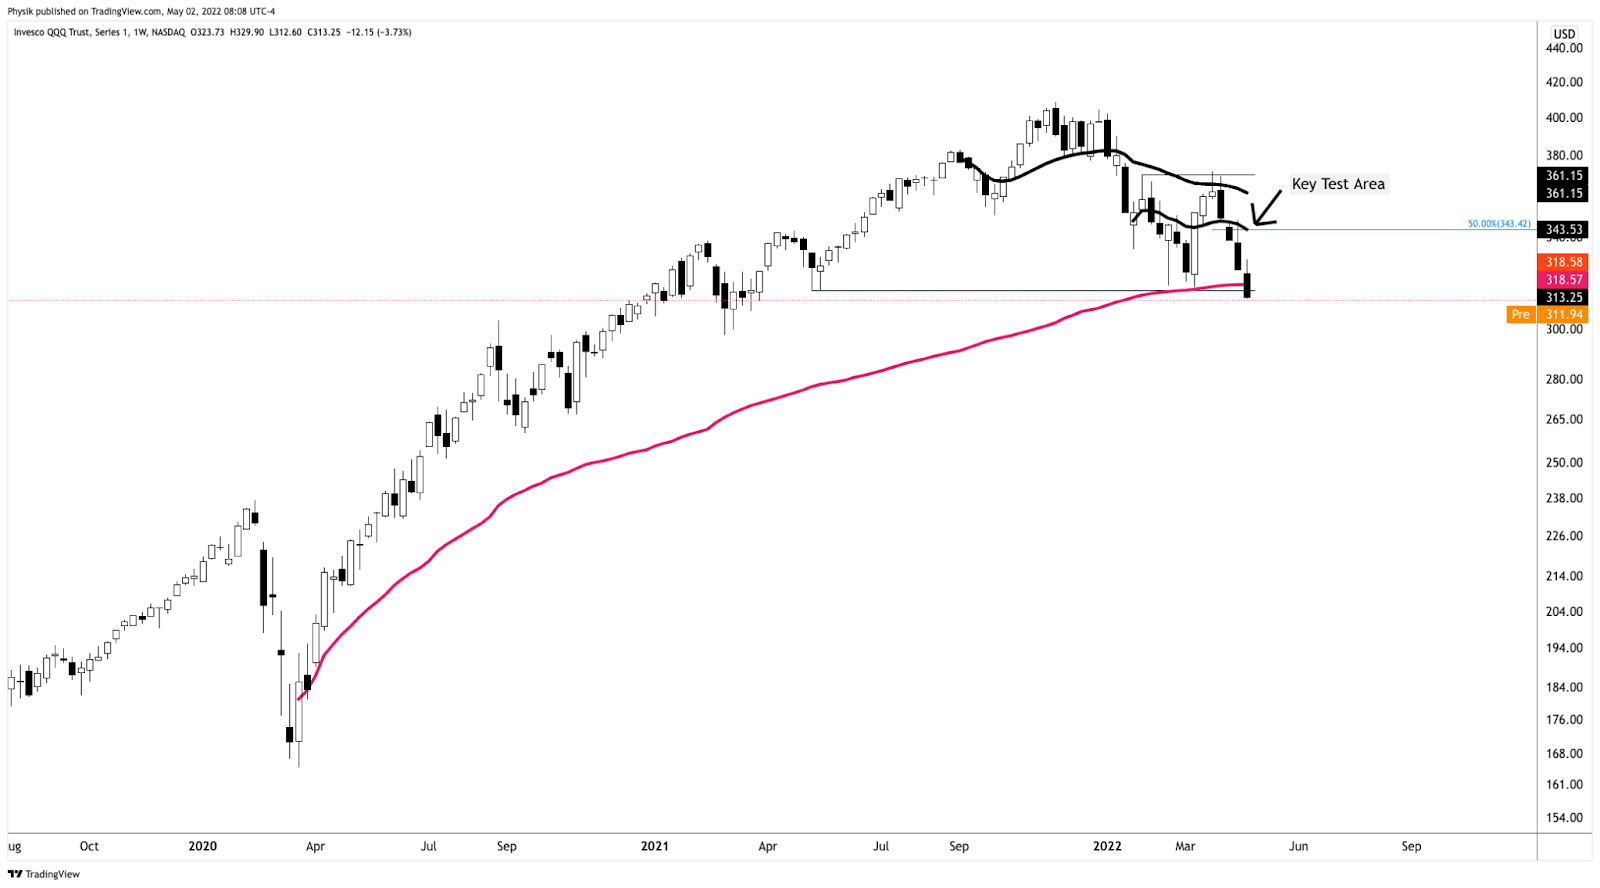
Considerations: Terribly weak price action, last week, with the S&P 500, Nasdaq 100, and Russell 2000 all flirting with early 2022 lows.
The weaker of the bunch – the Invesco QQQ Trust Series 1 (NASDAQ: QQQ) – just broke a major VWAP anchored from the lows of March 2020.
That indicator denotes the level at which the average buyer/seller is in.
In other words, it is the fairest price to pay for Nasdaq 100 exposure (since March 2020) and, instead of being construed as a so-called demand zone, the level ought to be looked at as overhead supply on tests, higher. Caution.
Graphic: Invesco QQQ Trust Series 1 (NASDAQ: QQQ) with anchored VWAPs.
Definitions
Overnight Rally Highs (Lows): Typically, there is a low historical probability associated with overnight rally-highs (lows) ending the upside (downside) discovery process.
Volume Areas: A structurally sound market will build on areas of high volume (HVNodes). Should the market trend for long periods of time, it will lack sound structure, identified as low volume areas (LVNodes). LVNodes denote directional conviction and ought to offer support on any test.
If participants were to auction and find acceptance into areas of prior low volume (LVNodes), then future discovery ought to be volatile and quick as participants look to HVNodes for favorable entry or exit.
POCs: POCs are valuable as they denote areas where two-sided trade was most prevalent in a prior day session. Participants will respond to future tests of value as they offer favorable entry and exit.
Volume-Weighted Average Prices (VWAPs): A metric highly regarded by chief investment officers, among other participants, for quality of trade. Additionally, liquidity algorithms are benchmarked and programmed to buy and sell around VWAPs.
About
After years of self-education, strategy development, mentorship, and trial-and-error, Renato Leonard Capelj began trading full-time and founded Physik Invest to detail his methods, research, and performance in the markets.
Capelj also develops insights around impactful options market dynamics at SpotGamma and is a Benzinga reporter.
In no way should the materials herein be construed as advice. Derivatives carry a substantial risk of loss. All content is for informational purposes only.
Editor’s Note: The Daily Brief is a free glimpse into the prevailing fundamental and technical drivers of U.S. equity market products. Join the 200+ that read this report daily, below!
Overnight, equity index futures auctioned lower in light of an escalation of geopolitical tensions between Russia, Ukraine, and the rest of the world.
Western powers imposed harsh sanctions including the exclusion of some Russian lenders from the SWIFT messaging system “that underpins trillions of dollars worth of transactions,” globally.
As the Russian ruble lost ⅓ of its value and costs of insuring Russian government debt rose, the Bank of Russia (BoR) doubled its key interest rate to 20% and imposed some capital controls to take from the risk of a potential run on banks. Policymakers also banned foreign security sales.
The odds of an aggressive lift-off in interest rates by the Federal Reserve declined, accordingly. The market is now pricing in under six hikes for 2022 as crisis opens room for policy mistakes.
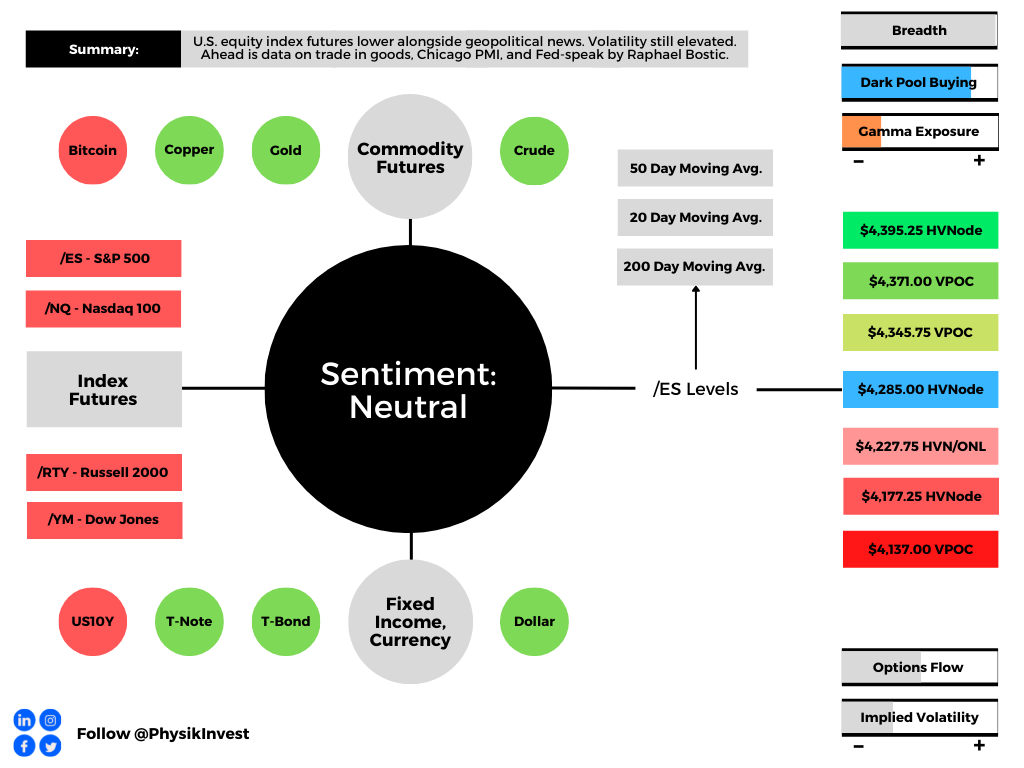
Ahead is data on trade in goods (8:30 AM ET), Chicago PMI (9:45 AM ET), and Fed-speak by Atlanta Fed President Raphael Bostic (10:30 AM ET).
Graphic updated 6:30 AM ET. Sentiment Neutral if expected /ES open is inside of the prior day’s range. /ES levels are derived from the profile graphic at the bottom of the following section. Levels may have changed since initially quoted; click here for the latest levels. SqueezeMetrics Dark Pool Index (DIX) and Gamma (GEX) calculations are based on where the prior day’s reading falls with respect to the MAX and MIN of all occurrences available. A higher DIX is bullish. At the same time, the lower the GEX, the more (expected) volatility. Learn the implications of volatility, direction, and moneyness. SHIFT data used for S&P 500 (INDEX: SPX) options activity. Note that options flow is sorted by the call premium spent; if more positive, then more was spent on call options. Breadth reflects a reading of the prior day’s NYSE Advance/Decline indicator. VIX reflects a current reading of the CBOE Volatility Index (INDEX: VIX) from 0-100.
What To Expect
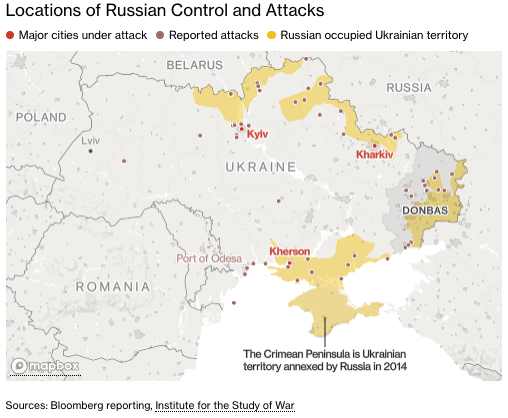
Fundamental: As of February 27, 2022, there are reports that with its invasion of Ukraine, “Moscow was frustrated by the slow progress caused by an unexpectedly strong Ukrainian defense and failure to achieve complete air dominance.”
Graphic: Via Bloomberg, locations of Russian controls and attacks.
At present, Russia has only committed 50% of its available firepower to the war and solicited the involvement of neighboring allies. Still, even at 50%, it’s rough.
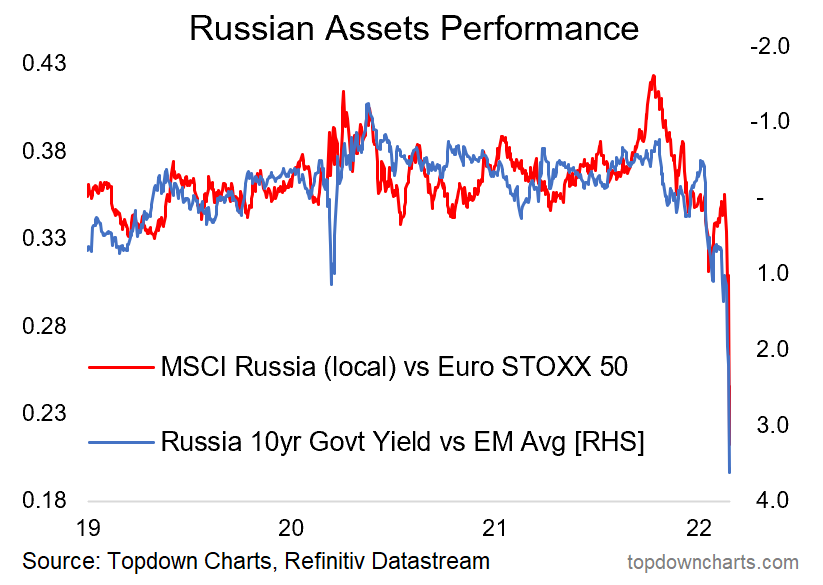
Russian markets, to put it simply, are in turmoil as a result of this conflict. Its policymakers, to stem the bleed, have banned foreigners from selling assets.
Graphic: Via Topdown Charts, Russian assets are imploding.
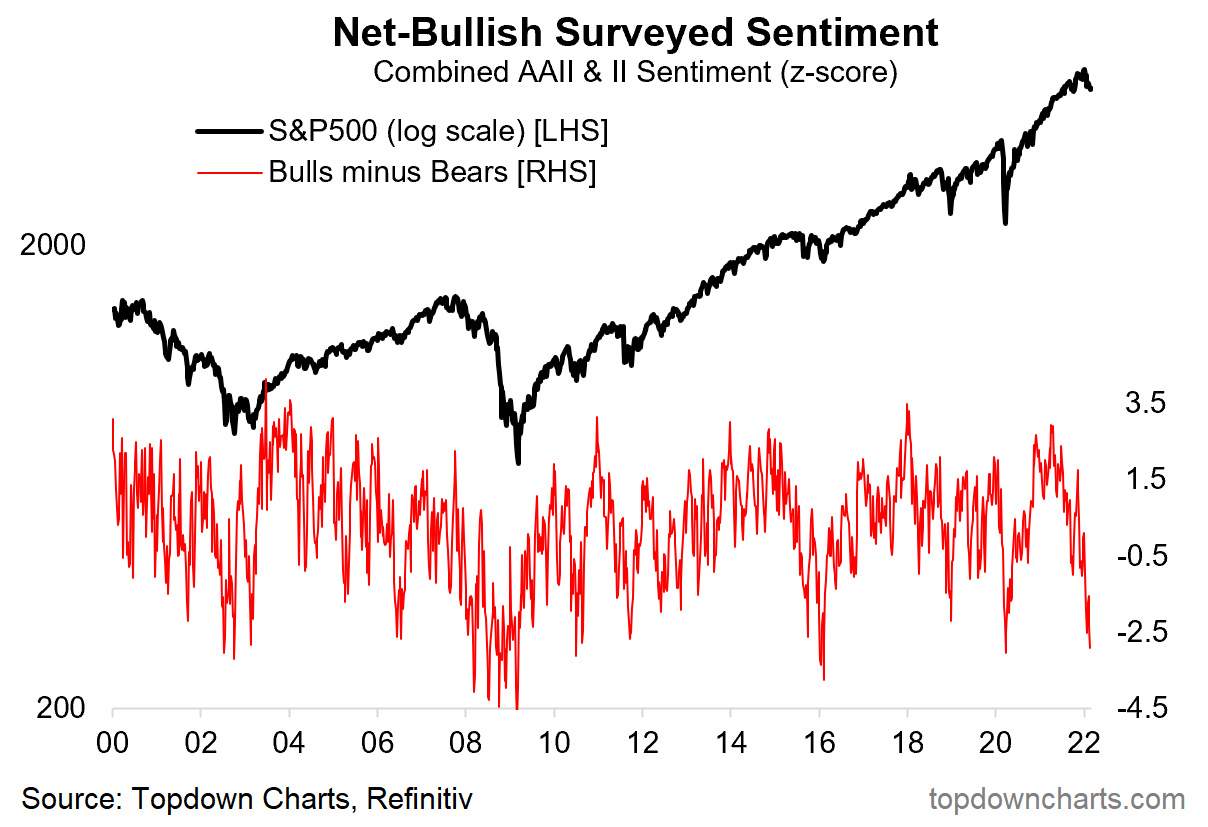
Accordingly, sentiment is as bad as it was in 2020, 2016, the period spanning 2008-2009, as well as the period just after the topping of the tech-and-telecom bubble.
Graphic: Via Topdown Charts, “sentiment basically as bad as the COVID crash.”
In light of the world’s response to this conflict, Russia, too, has heightened its nuclear readiness.
Russian state TV has reportedly said:
“Our submarines alone can launch more than 500 nuclear warheads, which guarantees the destruction of the US and NATO for good measure. The principle is: why do we need the world if Russia won’t be in it?”
Moreover, over the weekend, Credit Suisse Group AG’s (NYSE: CS) Zoltan Pozsar, in gauging the implications of conflict and sanctions, explained that excluding Russia from SWIFT may lead to missed payments and overdrafts similar to that experienced during March of 2020.
“Banks’ inability to make payments due to their exclusion from SWIFT is the same as Lehman’s inability to make payments due to its clearing bank’s unwillingness to send payments on its behalf,” he noted.
“The consequence of excluding banks from SWIFT is real, and so is the need for central banks to re-activate daily U.S. dollar funds supplying operations.”
In light of this, some have advanced a narrative around a potential run on Russian banks.
The Moscow bank run: a queue for a Tinkoff ATM in the Liga shopping center in Khimki. There are about 70 people in line. Eyewitnesses say the money in the ATM runs out within 40 minutes. @bazabazonpic.twitter.com/MTMkEiCRHJ
However, former BoR official Sergey Aleksashenko, in an alarmed yet less pessimistic take on CNBC, suggested a “low likelihood” of a run on the ruble.
Further, in light of the deceleration at home in the U.S., Pozsar concludes that “the Fed’s balance sheet might expand again before it contracts via QT (quantitative tightening).”
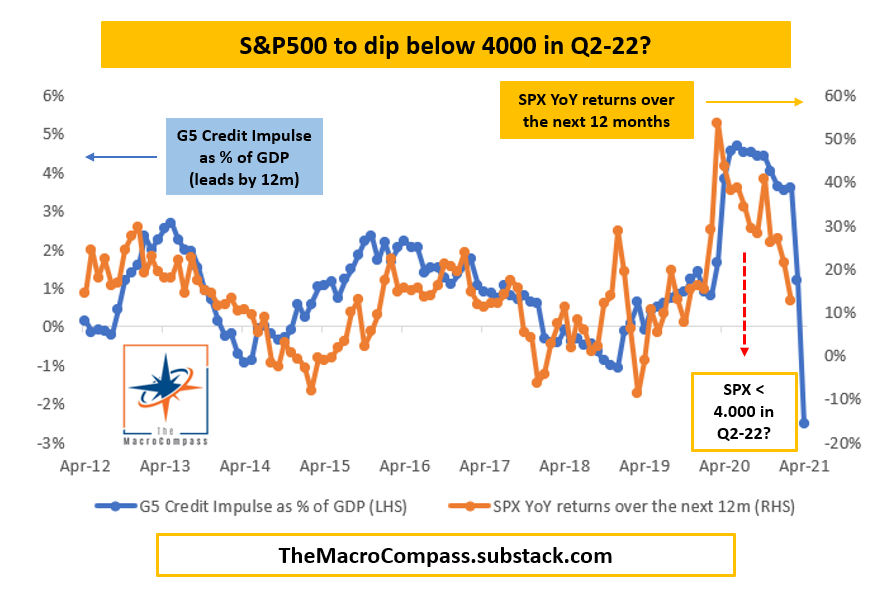
Graphic: Alfonso Peccatiello of The Macro Compass. He says “YTD: 2022 hikes priced in up from 3 to 6-7. Curves big-time flatter. Inflation expectations 10 bps lower. Real yields higher 40-50 bps. Credit spreads wider. Cyclical growth impulse fading away. Not a risk-on environment.”
Interactive Brokers Group Inc’s (NASDAQ: IBKR) Chief Strategist Steve Sosnick adds: “The tide of money is still positive, and it should provide a cushion for nervous markets as long as that remains the case. But when we consider that monetary conditions are supposed to be changing, volatility should persist if the monetary tide actually ebbs as expected.”
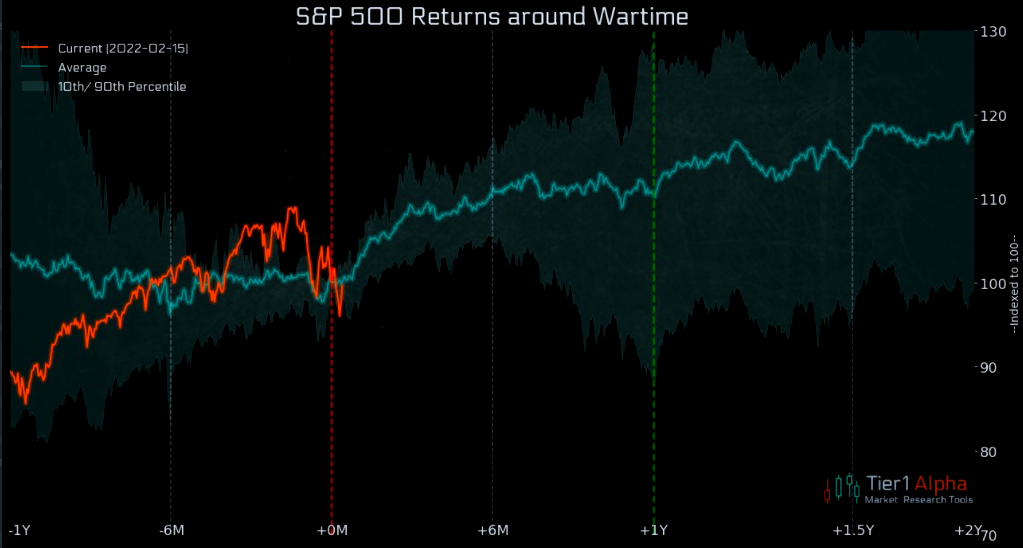
Perspectives: “Geopolitical catastrophes tend to be worse than believed in the short term but less than believed in the long term,” Ophir Gottlieb of Capital Market Laboratories notes.
Similarly, JPMorgan Chase & Co’s (NYSE: JPM) head of global equity strategy Mislav Matejka says that “If one is selling on the back of the latest geopolitical developments now, the risk is of getting whipsawed.”
“Historically, [the] vast majority of military conflicts, especially if localized, did not tend to hurt investor confidence for too long, and would end up as buying opportunities.”
Adding, in light of the liquidation into last Thursday’s open (after which there was a large reversal), the VIX futures term structure, though in backwardation, was not as steep as in past moments of true panic.
IBKR’s Sosnick explains that “Even though VIX futures [were higher on Thursday morning] across the board and the curve has further steepened, neither the spot level nor the curve are yet demonstrating panic.”
“I interpret the message of the market to be that we should continue to expect volatility – remember that volatility encompasses moves in both directions – but not to expect that a major bottom was put into place in recent sessions.”
With realized volatility is heightened and implied volatility not performing, so to speak, @darjohn25 explains, try to avoid “any short gamma on all short-dated tenors—you want to own the short term stuff for the foreseeable future.”
Technical: As of 6:30 AM ET, Monday’s regular session (9:30 AM – 4:00 PM ET), in the S&P 500, will likely open in the middle part of a negatively skewed overnight inventory, inside of prior-range and -value, suggesting a limited potential for immediate directional opportunity.
Gap Scenarios Potentially In Play: Gaps ought to fill quickly. Should they not, that’s a signal of strength; do not fade. Leaving value behind on a gap-fill or failing to fill a gap (i.e., remaining outside of the prior session’s range) is a go-with indicator.

Auctioning and spending at least 1-hour of trade back in the prior range suggests a lack of conviction; in such a case, do not follow the direction of the most recent initiative activity.
In the best case, the S&P 500 trades higher; activity above the $4,285.50 high volume area (HVNode) puts in play the $4,345.75 untested point of control (VPOC). Initiative trade beyond the VPOC could reach as high as the $4,371.00 VPOC and $4,395.25 HVNode, or higher.
In the worst case, the S&P 500 trades lower; activity below the $4,285.50 HVNode puts in play the $4,227.75 HVNode and overnight low (ONL) area. Initiative trade beyond the HVNode/ONL could reach as low as the $4,177.25 HVNode and $4,137.00 VPOC, or lower.
Click here to load today’s key levels into the web-based TradingView charting platform. Note that all levels are derived using the 65-minute timeframe. New links are produced, daily.
Graphic: 65-minute profile chart of the Micro E-mini S&P 500 Futures.
What People Are Saying
As a young market maker in the Eurodollar Options pit, I remember going into my first shit show like this and my boss advising me.
Overnight Rally Highs (Lows): Typically, there is a low historical probability associated with overnight rally-highs (lows) ending the upside (downside) discovery process.
Volume Areas: A structurally sound market will build on areas of high volume (HVNodes). Should the market trend for long periods of time, it will lack sound structure, identified as low volume areas (LVNodes). LVNodes denote directional conviction and ought to offer support on any test.
If participants were to auction and find acceptance into areas of prior low volume (LVNodes), then future discovery ought to be volatile and quick as participants look to HVNodes for favorable entry or exit.
POCs: POCs are valuable as they denote areas where two-sided trade was most prevalent in a prior day session. Participants will respond to future tests of value as they offer favorable entry and exit.
Excess: A proper end to price discovery; the market travels too far while advertising prices. Responsive, other-timeframe (OTF) participants aggressively enter the market, leaving tails or gaps which denote unfair prices.
Volume-Weighted Average Prices (VWAPs): A metric highly regarded by chief investment officers, among other participants, for quality of trade. Additionally, liquidity algorithms are benchmarked and programmed to buy and sell around VWAPs.
About
After years of self-education, strategy development, mentorship, and trial-and-error, Renato Leonard Capelj began trading full-time and founded Physik Invest to detail his methods, research, and performance in the markets.
Capelj is also a Benzinga finance and technology reporter interviewing the likes of Shark Tank’s Kevin O’Leary, JC2 Ventures’ John Chambers, FTX’s Sam Bankman-Fried, and ARK Invest’s Catherine Wood, as well as a SpotGamma contributor developing insights around impactful options market dynamics.
Disclaimer
Physik Invest does not carry the right to provide advice.
In no way should the materials herein be construed as advice. Derivatives carry a substantial risk of loss. All content is for informational purposes only.
Editor’s Note: Due to travel commitments, the Daily Brief will not be sent 10/25-10/27.
Apologies and have a great weekend!
Market Commentary
Out of sync with bonds, equity index futures were mostly sideways to higher. Commodities were higher. Volatility compressed.
Ahead is manufacturing, services PMI.
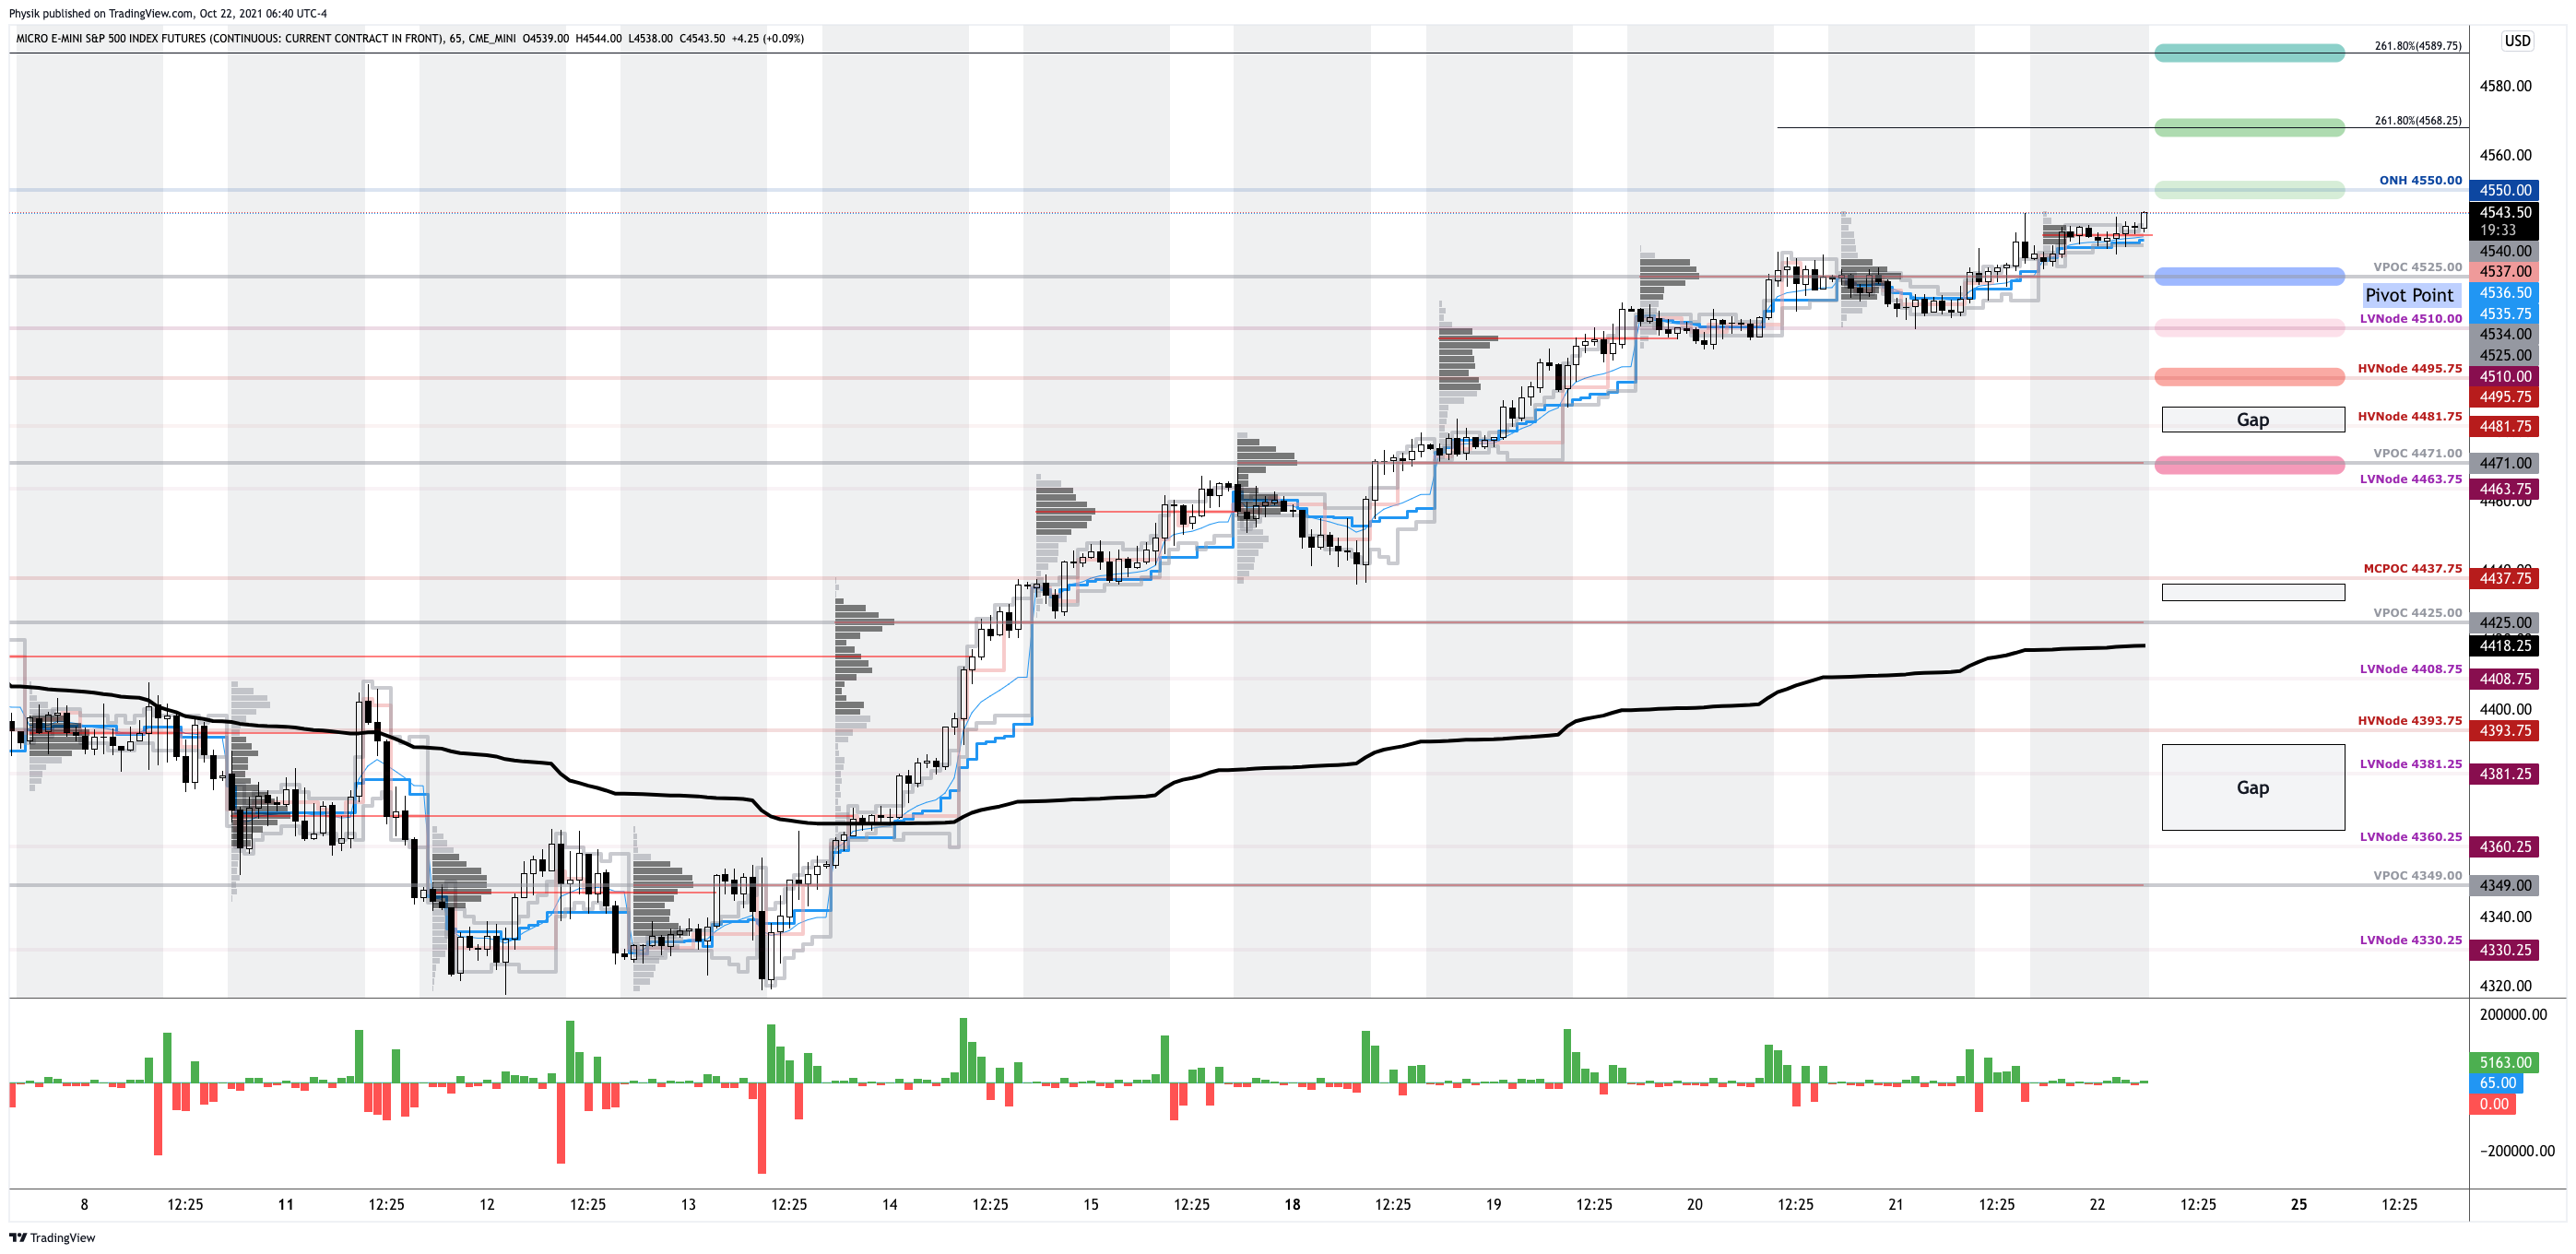
Participants discover uncharted prices.
Options positioning presented tailwind.
What Happened: U.S. stock index futures, less the Nasdaq 100, auctioned sideways to higher overnight as participants looked to discover new prices.
Ahead is data on manufacturing and services PMI (9:45 AM ET), as well as Fed-speak (10:00 and 11:00 AM ET).
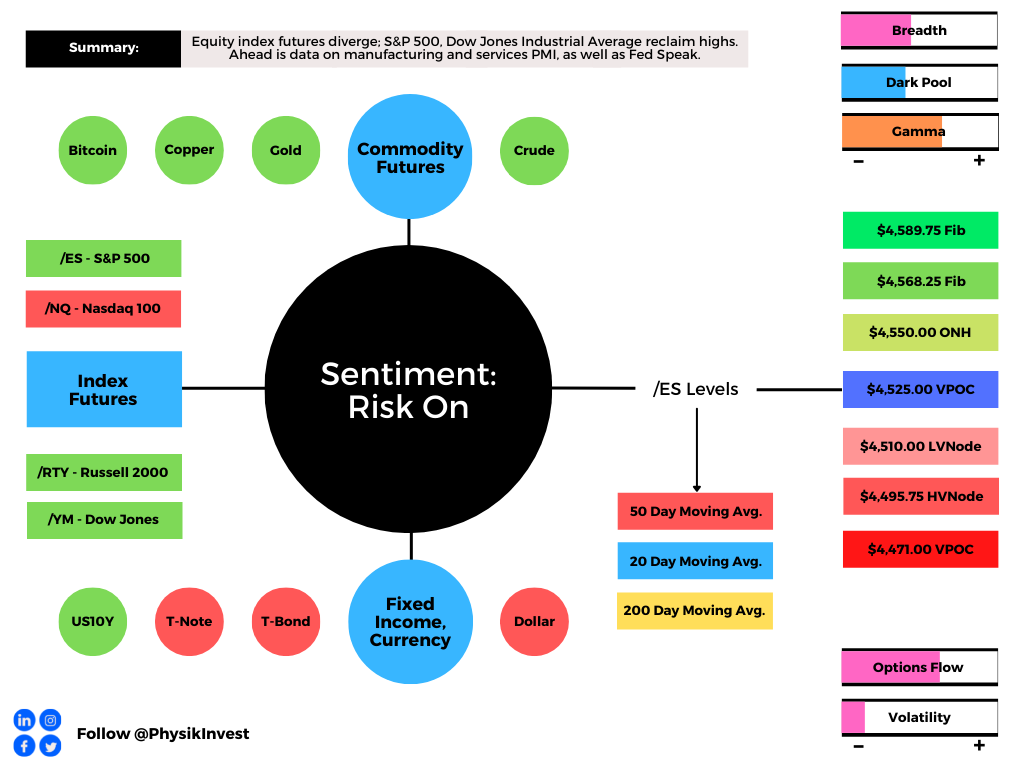
Graphic updated 6:40 AM ET. Sentiment Risk-On if expected /ES open is above the prior day’s range. /ES levels are derived from the profile graphic at the bottom of the following section. Levels may have changed since initially quoted; click here for the latest levels. SqueezeMetrics Dark Pool Index (DIX) and Gamma (GEX) calculations are based on where the prior day’s reading falls with respect to the MAX and MIN of all occurrences available. A higher DIX is bullish. At the same time, the lower the GEX, the more (expected) volatility. SHIFT data used for S&P 500 (INDEX: SPX) options activity. Note that options flow is sorted by the call premium spent; if more positive then more was spent on call options. Breadth reflects a reading of the prior day’s NYSE Advance/Decline indicator. VIX reflects a current reading of the CBOE Volatility Index (INDEX: VIX) from 0-100.
What To Expect: As of 6:30 AM ET, Friday’s regular session (9:30 AM – 4:00 PM EST) in the S&P 500 will likely open on a small gap, just outside of prior-range and -value, suggesting a potential for immediate directional opportunity.
Gap Scenarios: Gaps ought to fill quickly. Should they not, that’s a signal of strength; do not fade. Leaving value behind on a gap-fill or failing to fill a gap (i.e., remaining outside of the prior session’s range) is a go-with indicator.

Auctioning and spending at least 1-hour of trade back in the prior range suggests a lack of conviction; in such a case, do not follow the direction of the most recent initiative activity.
During the prior day’s regular trade, on light volume, nonparticipatory intraday breadth, and supportive market liquidity metrics, the best case outcome occurred, evidenced by upside resolve, above flattened day timeframe profile structures, or ledges.
This activity comes after prior sessions left behind numerous gaps and emotional, multiple-distribution profile structures.
Further, Thursday’s overnight gap in range, below value, set indices up for what is called the cave-fill process (characterized by repair and strengthening of low volume areas).
The day timeframe activity rejected lower prices; participants auctioned to new highs in both regular and overnight trade, putting in play a recovery of the un-adjusted overnight high (ONH) at $4,550.00.
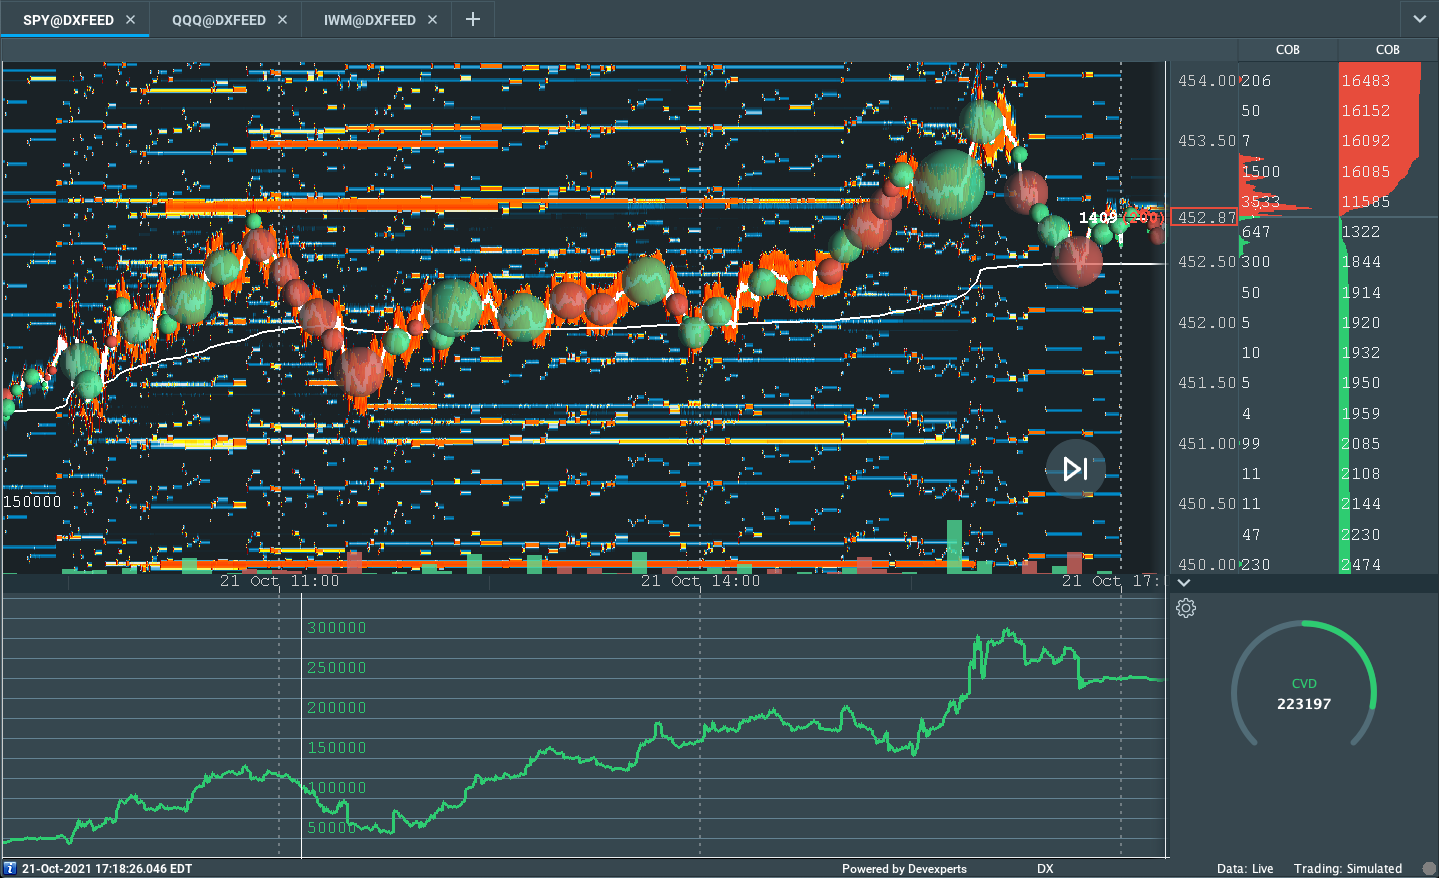
Graphic: Supportive delta (i.e., committed buying as measured by volume delta or buying and selling power as calculated by the difference in volume traded at the bid and offer) in SPDR S&P 500 ETF Trust (NYSE: SPY), one of the largest ETFs that track the S&P 500 index, via Bookmap. The readings are supportive of initiative trade.
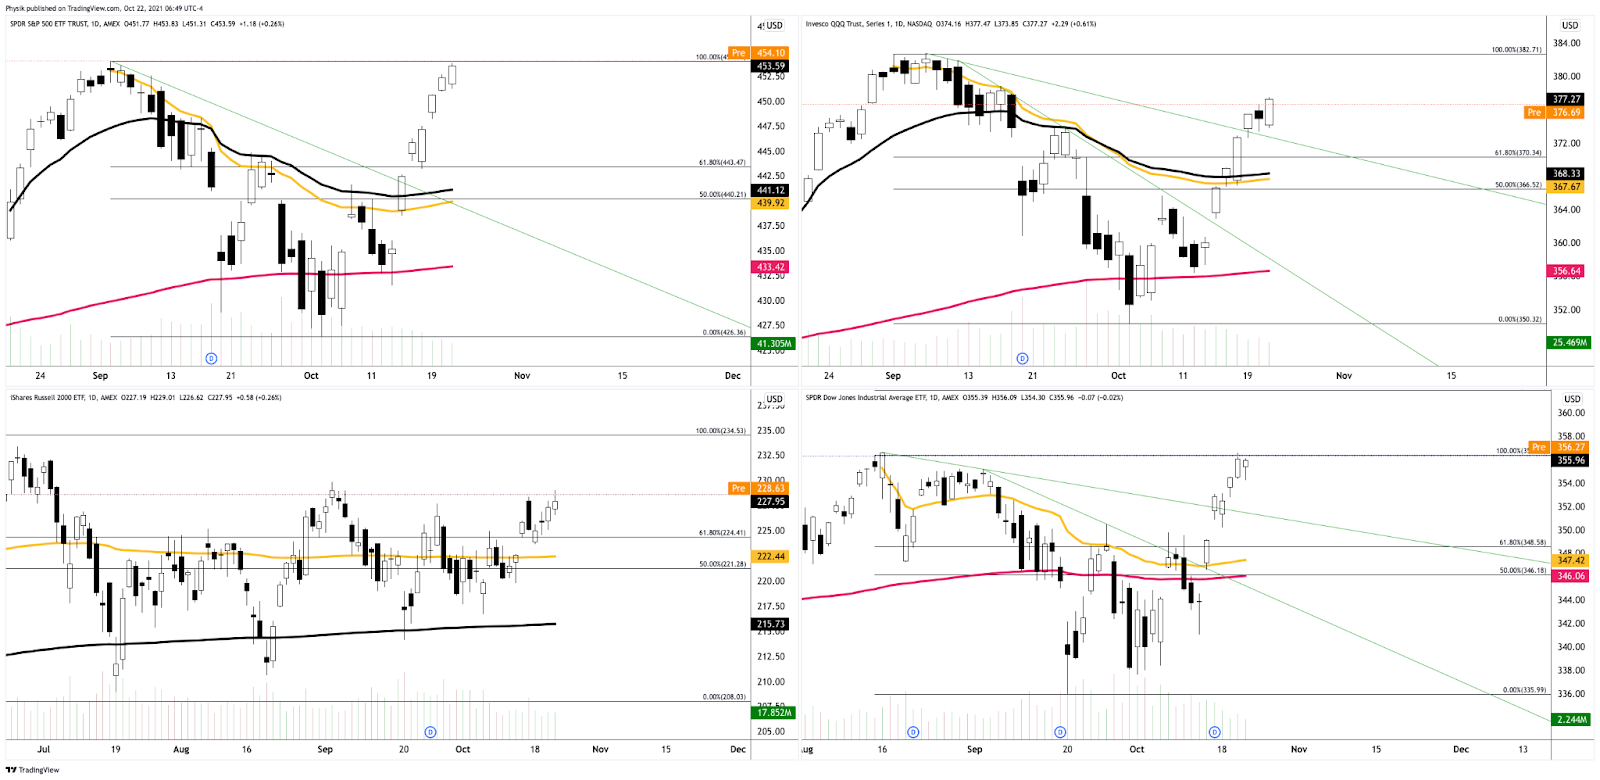
Zooming out, we see that though the Nasdaq 100 firmed this week, it did not recover as much ground as its peers, the S&P 500 and Dow Jones Industrial Average, both of which are trading at or above their all-time high figures.
Graphic: SPDR S&P 500 ETF (NYSE: SPY) top left, Invesco QQQ Trust Series 1 (NASDAQ: QQQ) top right, iShares Russell 2000 ETF (NYSE: IWM) bottom left, SPDR Dow Jones Industrial Average ETF Trust (NYSE: DIA) bottom right.
This recovery has been swift and built on relatively poor – low volume – structures that ought to offer minimal support; what this simply means is that higher prices need validation.
Note: Value is defined by where 70% of the day’s trade happened, the bulk of where volume is.

Think of the absence of high volume structures, on the way up, leaving no value to base off of. If prices are followed by value, that means that they are supported. If there is an open above (below) value, a market will auction lower (higher) in search of buyers (sellers). After auctioning too far from value, the response by higher timeframe participants will introduce single-print buying and selling tails as those participants look to take advantage of higher (lower) prices to sell (buy).

Please read this excerpt from Mind Over Markets, for additional context.
Further, the aforementioned trade is happening in the context of improving breadth amidst a seasonally bullish cycle of contributions, rebalancing, and earnings, as well as the risks associated with a taper in asset purchases and a hike in rates.
In terms of positioning, the CBOE Volatility Index (INDEX: VIX) was lower, while the VIX futures term structure settled in contango; supply at the front end of the curve, alongside the long-gamma environment, signals a potential for near-term equity market stability.
According to SpotGamma analyses, this is where the so-called vanna (i.e., inflows as a result of options sliding down their term structure) dynamic comes to dominate. Adding, we look for increased interest in options strikes that are higher in price and further out in time.
Moreover, for today, participants may make use of the following frameworks.
In the best case, the S&P 500 trades sideways or higher; activity above the $4,525.00 untested point of control (VPOC) puts in play the $4,550.00 overnight high (ONH). Initiative trade beyond the ONH could reach as high as the $4,568.25 and $4,589.75 Fibonacci extensions, or higher.
In the worst case, the S&P 500 trades lower; activity below the $4,525.00 VPOC puts in play the $4,510.00 low volume area (LVNode). Initiative trade beyond the LVNode could reach as low as the $4,495.75 high volume area (HVNode) and $4,471.00 VPOC, or lower.
Click here to load today’s updated real-time key levels into the web-based TradingView charting platform. Please note that all levels are derived using the 65-minute timeframe.
Graphic: 65-minute profile chart of the Micro E-mini S&P 500 Futures updated 6:30 AM ET.
Definitions
Cave-Fill Process: Widened the area deemed favorable to transact at by an increased share of participants. This is a good development.
Overnight Rally Highs (Lows): Typically, there is a low historical probability associated with overnight rally-highs (lows) ending the upside (downside) discovery process.
Volume Areas: A structurally sound market will build on areas of high volume (HVNodes). Should the market trend for long periods of time, it will lack sound structure, identified as low volume areas (LVNodes). LVNodes denote directional conviction and ought to offer support on any test.
If participants were to auction and find acceptance into areas of prior low volume (LVNodes), then future discovery ought to be volatile and quick as participants look to HVNodes for favorable entry or exit.
POCs: POCs are valuable as they denote areas where two-sided trade was most prevalent in a prior day session. Participants will respond to future tests of value as they offer favorable entry and exit.
Excess: A proper end to price discovery; the market travels too far while advertising prices. Responsive, other-timeframe (OTF) participants aggressively enter the market, leaving tails or gaps which denote unfair prices.
Ledges: Flattened area on the profile which suggests responsive participants are in control, or initiative participants lack the confidence to continue the discovery process. The ledge will either hold and force participants to liquidate (cover) their positions, or crack and offer support (resistance).
Volume-Weighted Average Prices (VWAPs): A metric highly regarded by chief investment officers, among other participants, for quality of trade. Additionally, liquidity algorithms are benchmarked and programmed to buy and sell around VWAPs.
In case you read too many newsletters by permabear grifters and my tweet scares you…
Over the last 20 years, anytime the VIX made a new low in the last 60 days, SPX was higher 70% of the time the following 60 days with an average return of 2.72% in that period. https://t.co/7nlTCdQ38epic.twitter.com/zH2BGnclAi
After years of self-education, strategy development, and trial-and-error, Renato Leonard Capelj began trading full-time and founded Physik Invest to detail his methods, research, and performance in the markets.
Additionally, Capelj is a finance and technology reporter. Some of his biggest works include interviews with leaders such as John Chambers, founder and CEO, JC2 Ventures, Kevin O’Leary, businessman and Shark Tank host, Catherine Wood, CEO and CIO, ARK Invest, among others.
Disclaimer
At this time, Physik Invest does not manage outside capital and is not licensed. In no way should the materials herein be construed as advice. Derivatives carry a substantial risk of loss. All content is for informational purposes only.
What Happened: U.S. stock index futures diverged overnight.
Participants explored higher prices in both the S&P 500 and Nasdaq 100. The Dow Jones Industrial Average and Russell 2000 traded weak, within prior range.
Today, participants will receive PMI, employment trend, and ISM non-manufacturing data.
Graphic updated 7:05 AM ET.
What To Expect: Tuesday’s regular session (9:30 AM – 4:00 PM EST) in the S&P 500 will likely open just inside of prior-range and -value, suggesting a limited potential for immediate directional opportunity.
Adding, during the prior day’s regular trade, the best case outcome occurred, evidenced by initiative activity above the $4,311.50 high volume area (HVNode), up to $4,337.75, a Fibonacci-derived price target.
Initiative Buying: Buying within or above the previous day’s value area.

Volume Areas: A structurally sound market will build on past areas of high volume. Should the market trend for long periods of time, it will lack sound structure (identified as a low volume area which denotes directional conviction and ought to offer support on any test).

If participants were to auction and find acceptance into areas of prior low volume, then future discovery ought to be volatile and quick as participants look to areas of high volume for favorable entry or exit.
Sideways trade overnight comes after a rapid move higher on narrowing breadth and tapering volumes.
Graphic: Breadth metrics from JPMorgan Chase & Co (NYSE: JPM), via The Market Ear.
With that, strategists at JPMorgan Chase & Co (NYSE: JPM) suggest stretched sentiment, positioning, and technical conditions have normalized with economic activity projected to stay significantly above trend. Goldman Sachs Group Inc (NYSE: GS) takes a bit of a less optimistic view; “Expectations of higher interest rates and higher corporate tax rates by year-end are the primary reasons we forecast that the S&P 500 will trade sideways during the next six months,” said David Kostin, chief US equity strategist for Goldman Sachs.
Goldman’s year-end price target for the S&P 500 sits at $4,300.00, a tad lower than where the index is today. To note, however, earnings estimates, the inventory positioning of participants, as well as early July seasonality metrics support the strong near-term performance.
Graphic: Earnings estimates from Jefferies, via The Market Ear.
Given that big picture context, for today, participants can trade from the following frameworks.
In the best case, the S&P 500 trades sideways or higher; activity above the $4,323.00 Point of Control (POC) puts in play the developing ledge at $4,348.25, an overnight high (ONH). Initiative trade beyond the ONH could reach as high as the $4,357.50 Fibonacci-derived price target.
POCs: POCs are valuable as they denote areas where two-sided trade was most prevalent. Participants will respond to future tests of value as they offer favorable entry and exit.

Overnight Rally Highs (Lows): Typically, there is a low historical probability associated with overnight rally-highs (lows) ending the upside (downside) discovery process.

Ledges: Flattened area on the profile which suggests responsive participants are in control, or initiative participants lack the confidence to continue the discovery process. The ledge will either hold and force participants to liquidate (cover) their positions, or crack and offer support (resistance).
In the worst case, the S&P 500 trades lower; activity below $4,323.00 puts in play the $4,299.00 POC. Initiative trade beyond the POC could reach as low as the $4,285.00 micro-composite POC and $4,263.25 low volume area (LVNode).
Graphic: 65-minute profile chart of the Micro E-mini S&P 500 Futures.Graphic: SHIFT search suggests participants were committing the most capital to call strikes at and below current prices in the cash-settled S&P 500 Index (INDEX: SPX) and Nasdaq 100 (INDEX: NDX), last week. This activity may denote (1) stock replacement, (2) hedges for underlying short positions, or (3) speculation on the upside. Also, there was a meaningful bid in longer-dated puts on the S&P 500 and Nasdaq 100. This dynamic suggests participants, despite their commitment to higher prices, are hedging against near-term risks, like the Jackson Hole Economic Symposium.
Markets | Stocks surge, comfort grows as the market fear gauge falls. (S&P)
Energy | Three scenarios for OPEC+, and the likely ones are bearish. (REU)
Markets | Chinese ride-hailing app Didi forced off of app stores in China. (REU)
COVID | Pfizer vaccine less effective against Delta variant, study finds. (FT)
Politics | Biden declares success in beating pandemic in July 4 speech. (BBG)
Politics | Global corporate tax overhaul faces rocky road to completion. (REU)
Markets | June jobs report was exactly what the markets wanted to get. (Axios)
What People Are Saying
On EP18 of "In The Know," watch as @CathieDWood talks about the bond market rally, inventories, employment report, consumer spending, the bull market strength, policy, cyclical deflation, Tesla, and more!
1/x It’s time for the final blows of the Summer of George until 7/12. Gonna keep it short & sweet. Vol has already started to increase into the rally… talking 🦍’s 🍌’s away. The price action front ran this week, & now that we’re here, The call squeeze is likely to continue https://t.co/q2vf9QIELapic.twitter.com/U9wpZfRhUy
FinTech | Turkish broker takes shot at financial titans with product focus. (BZ)
Economy | MMT economist on why China should boost fiscal spending. (BBG)
FinTech | Booking.com announces creation of new internal fintech unit. (Finextra)
M&A | JPMorgan’s big buying spree is Jamie Dimon’s busiest in years. (FT)
FinTech | Fidelity and BlackRock lead fintech startup’s $600M funding. (BBG)
Crypto | BIS finds that crypto investment doesn’t require special policy. (Block)
About
Renato founded Physik Invest after going through years of self-education, strategy development, and trial-and-error. His work reporting in the finance and technology space, interviewing leaders such as John Chambers, founder, and CEO, JC2 Ventures, Kevin O’Leary, businessman and Shark Tank host, Catherine Wood, CEO and CIO, ARK Invest, among others, afforded him the perspective and know-how very few come by.
Having worked in engineering and majored in economics, Renato is very detailed and analytical. His approach to the markets isn’t built on hope or guessing. Instead, he leverages the unique dynamics of time and volatility to efficiently act on opportunity.
Disclaimer
At this time, Physik Invest does not manage outside capital and is not licensed. In no way should the materials herein be construed as advice. Derivatives carry a substantial risk of loss. All content is for informational purposes only.