Physik Invest’s Daily Brief is read by thousands of subscribers. You, too, can join this community to learn about the fundamental and technical drivers of markets.
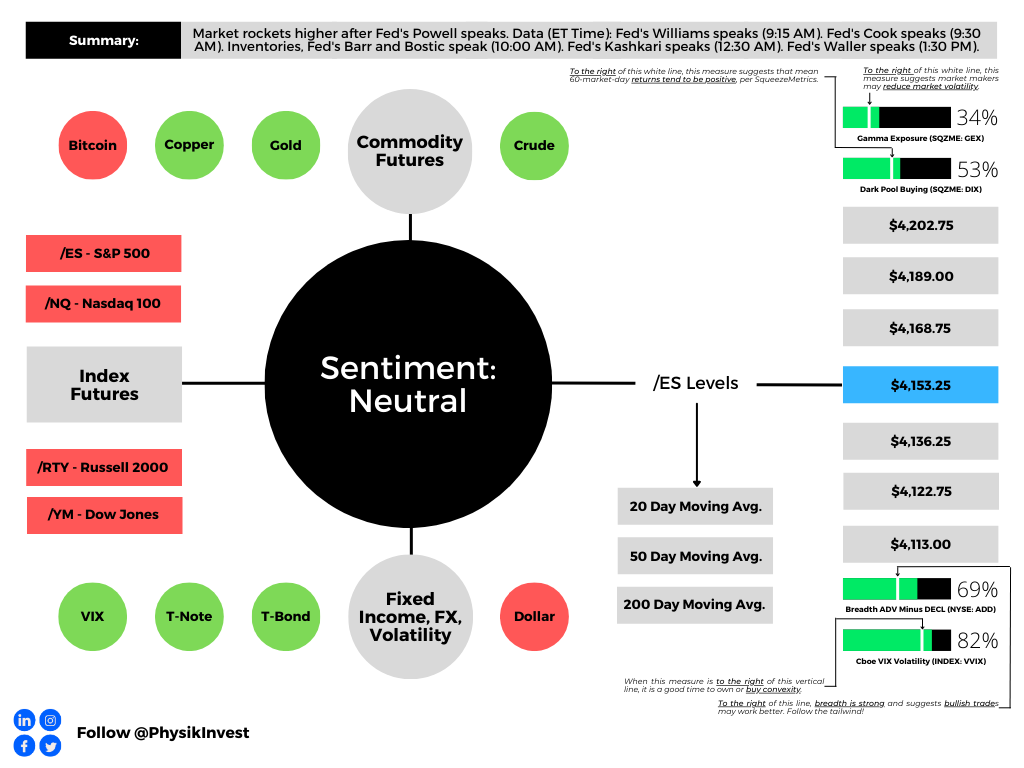
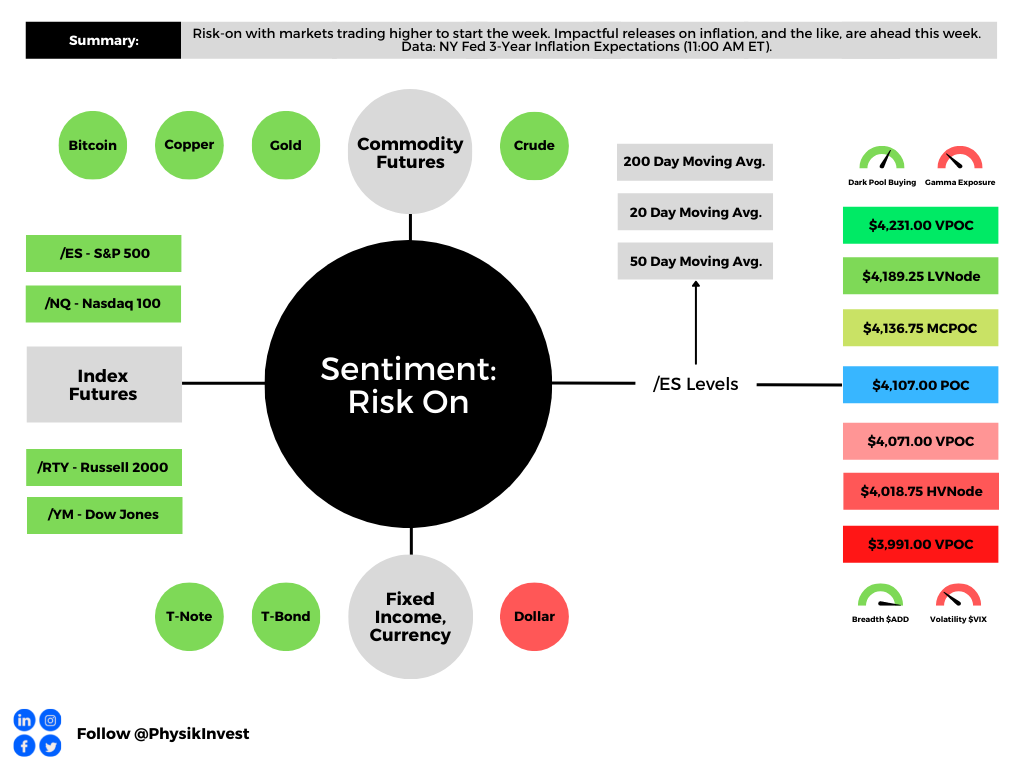
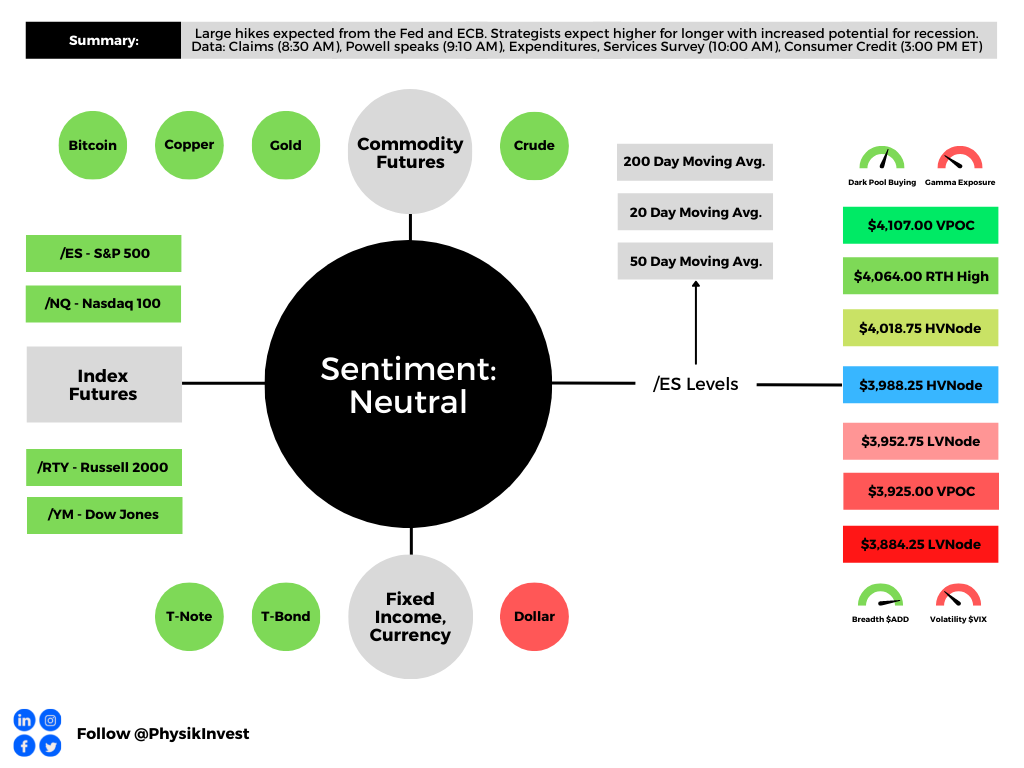
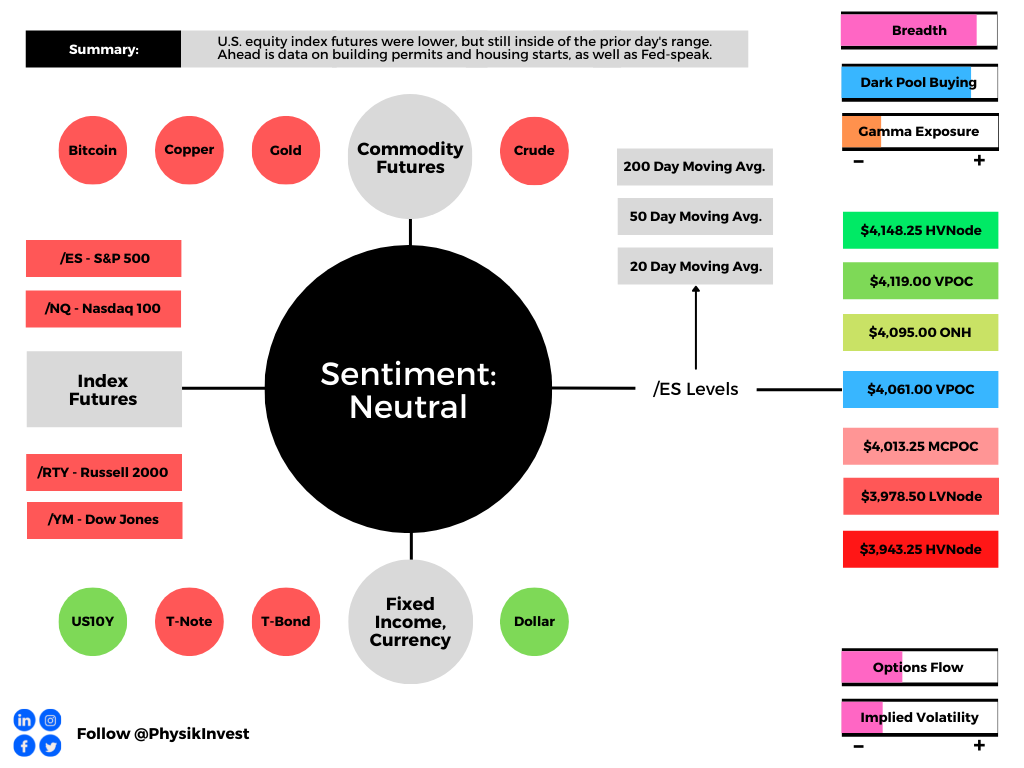
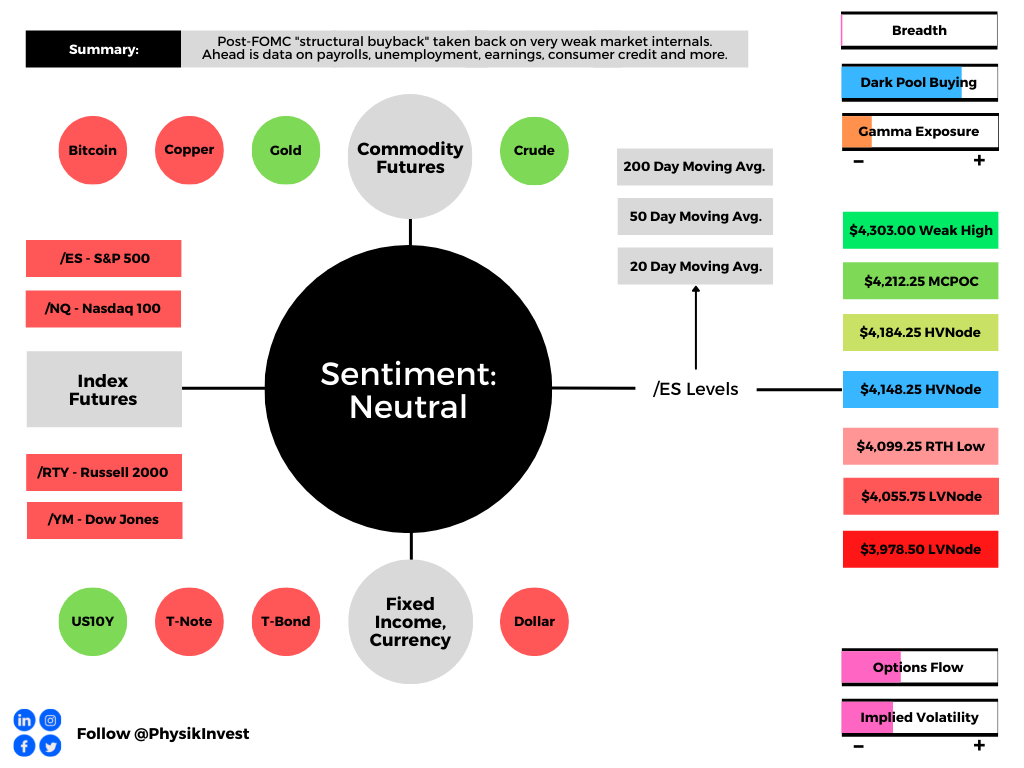
Graphic updated 6:50 AM ET. Sentiment Neutral if expected /ES open is inside of the prior day’s range. /ES levels are derived from the profile graphic at the bottom of this letter. Click here for the latest levels. SqueezeMetrics Dark Pool Index (DIX) and Gamma (GEX) with the latter calculated based on where the prior day’s reading falls with respect to the MAX and MIN of all occurrences available. A higher DIX is bullish. At the same time, the lower the GEX, the more (expected) volatility. Click to learn the implications of volatility, direction, and moneyness. Breadth reflects a reading of the prior day’s NYSE Advance/Decline indicator. The CBOE VIX Volatility Index (INDEX: VVIX) reflects the attractiveness of owning volatility. Backed by popular demand, mortgage rates are rising; 30 Yr. Fixed ~6.45%.
Positioning
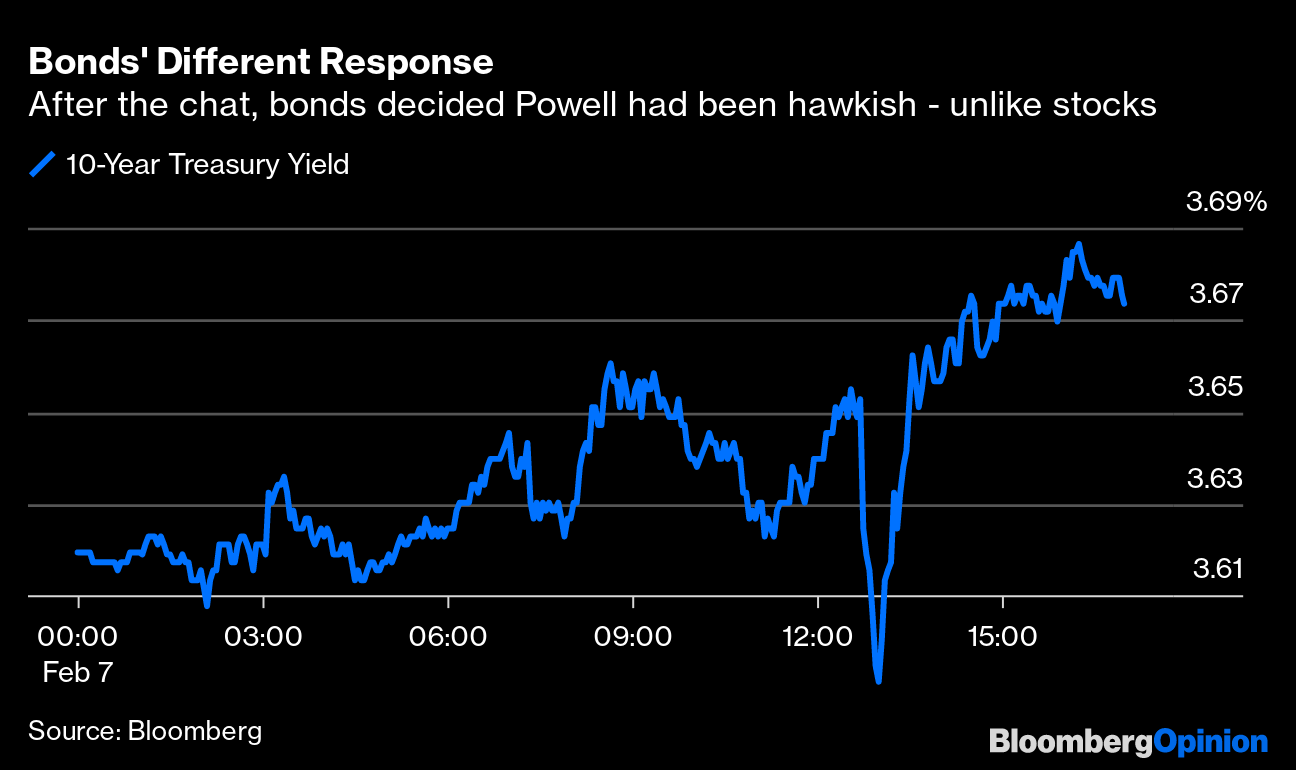
The S&P 500 (INDEX: SPX) closed higher yesterday despite the Federal Reserve’s (Fed) Jerome Powell warning rates would stay higher for longer.
According to an analysis by Interactive Brokers Group Inc’s (NASDAQ: IBKR), “it was clear that there were algos programmed to buy if [Powell] mentioned ‘disinflation.’ When [Powell] said the secret word, off we went.”
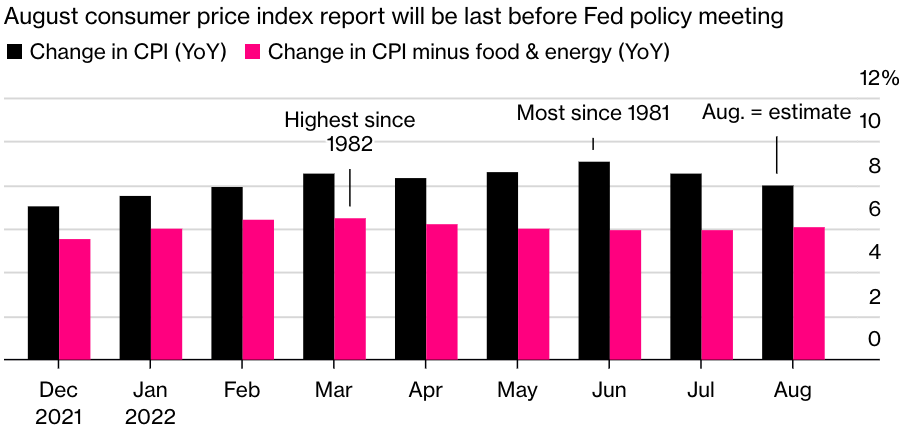
Graphic: Retrieved from Bloomberg. According to Bloomberg Economics’ Anna Wong, “The jobs surprise confirmed his message from the post-FOMC presser message that disinflation has barely begun and there’s still a long way to go. It seems clear he hasn’t shifted his views based on that gangbuster report alone.”
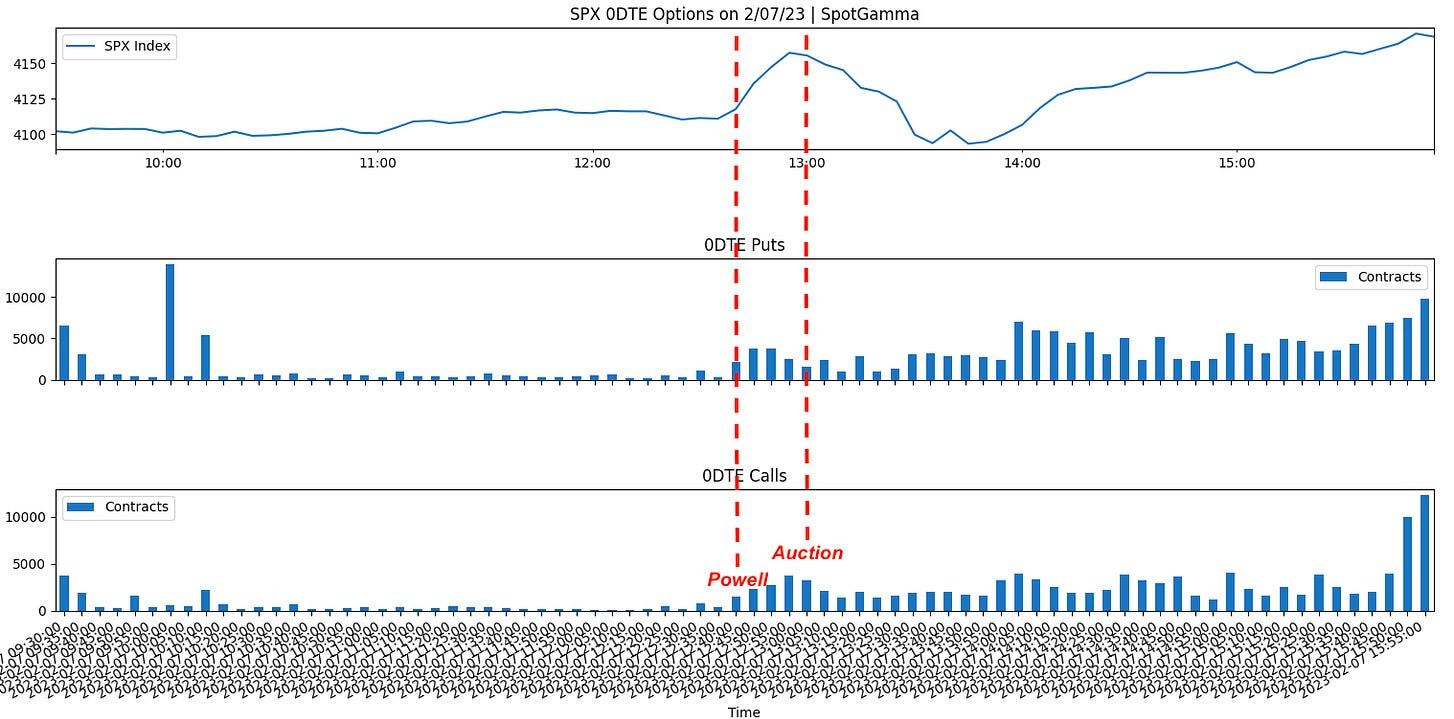
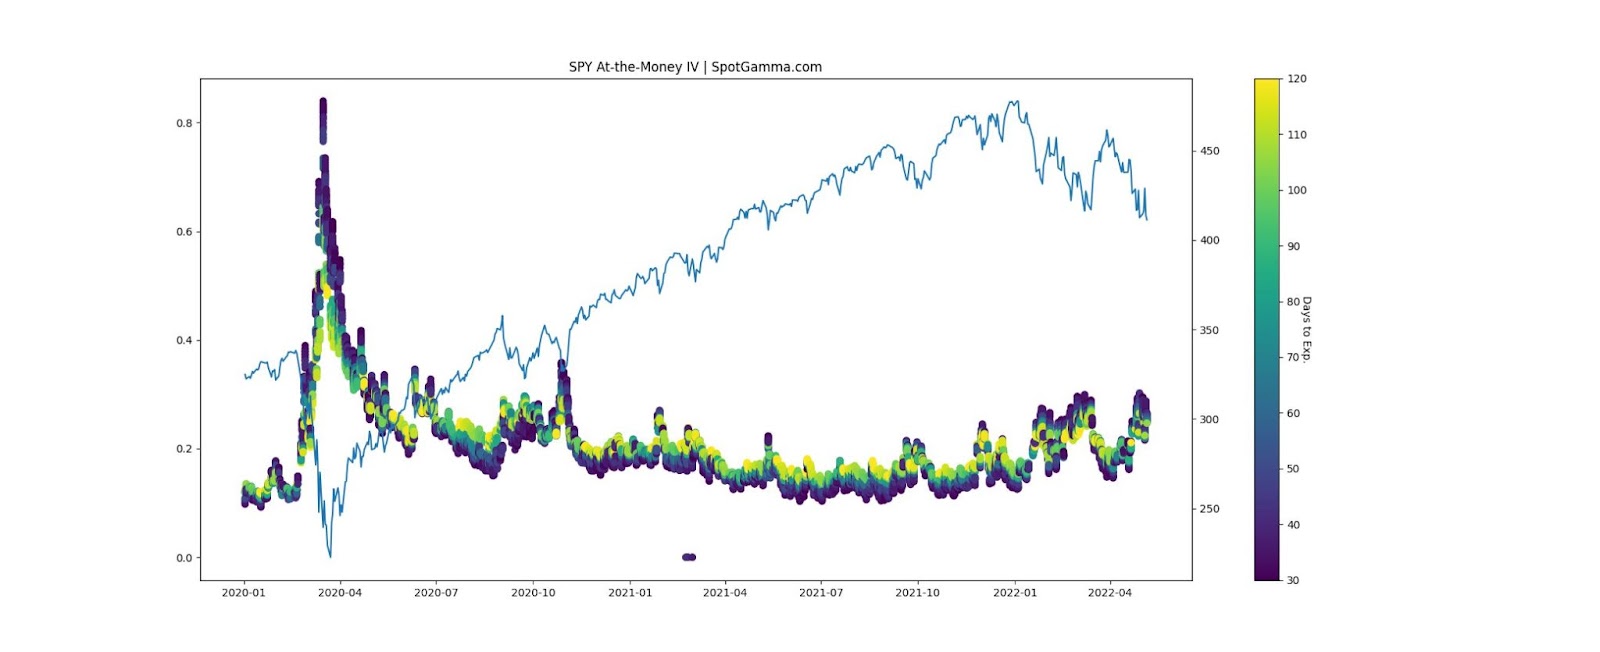
Implied volatility (IVOL) compression, as evidenced by shifts lower in the IVOL term structure and measures like the Cboe Volatility Index (INDEX: VIX) declining, was a booster, as was the trade of ultra-short-dated call options.
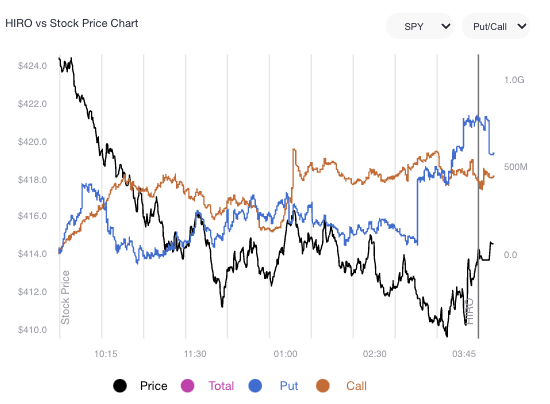
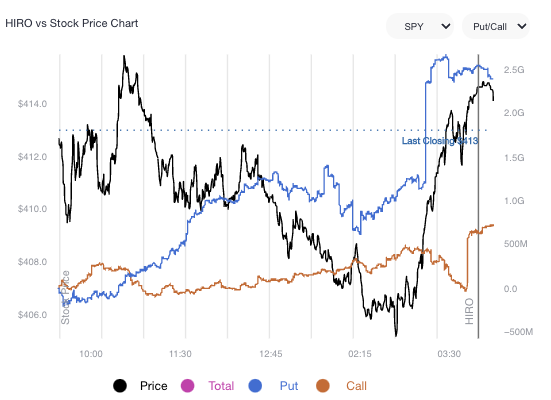
Graphic: Retrieved from SpotGamma on 2/7/2023. “[T]raders hit the bid after Powells “punt”. Stocks then violently flipped at 4165 (SPY 415) with heavy selling after a bad 1pm ET treasury action, only to go aggressively bid off of 4100 into end of day.”
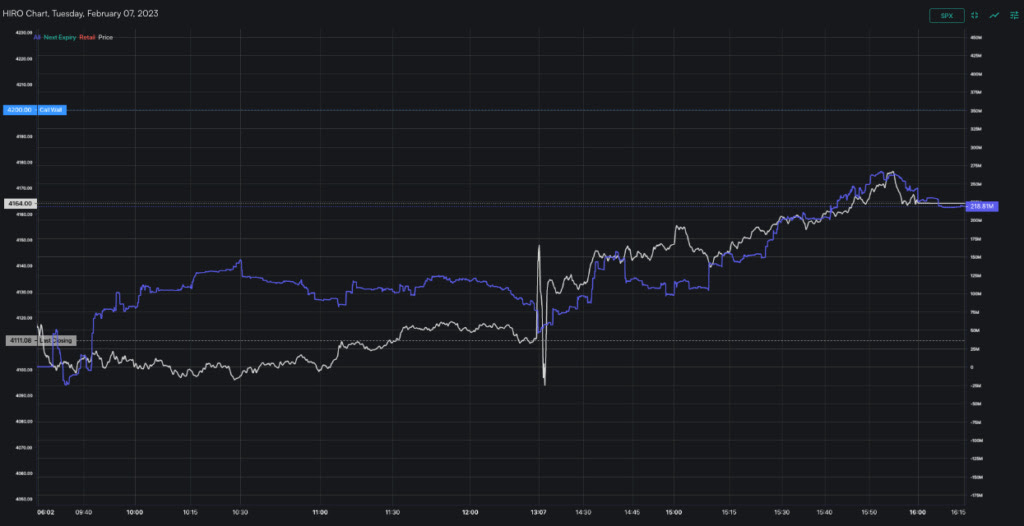
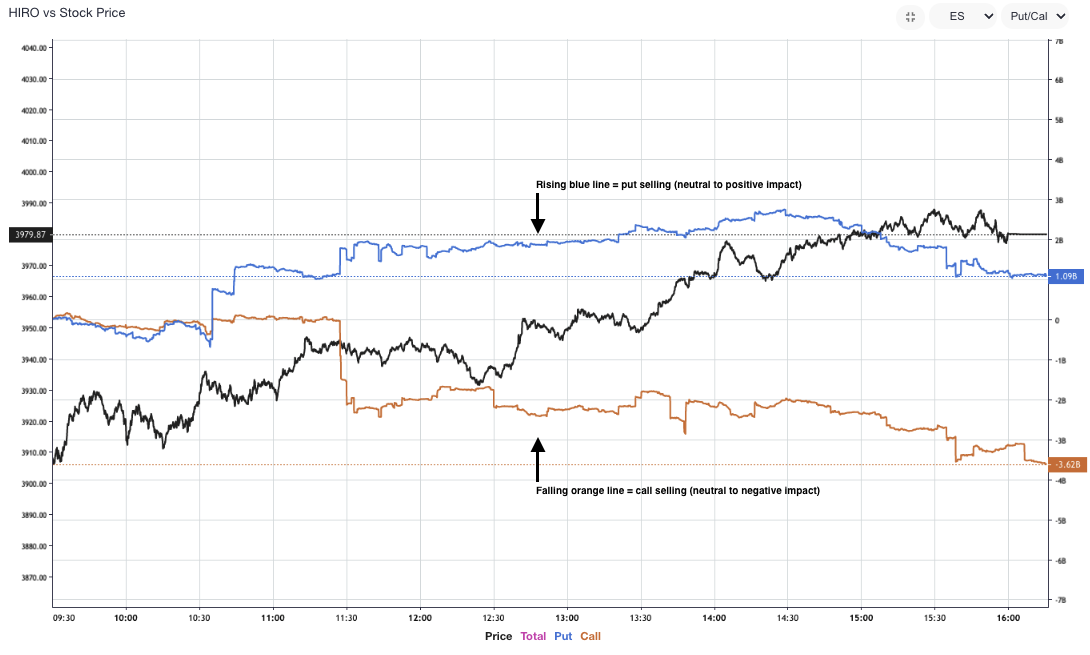
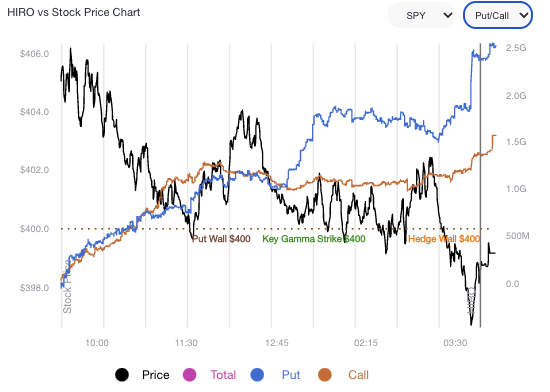
SpotGamma’s HIRO indicator showed positive delta call buying and put selling. This indicator validates the belief that IVOL compression catalyzed a rally and that follow-on strength came from traders’ demand for call options. In instances of put selling and call buying, counterparties hedge by buying underlying stocks and futures.
One way to think about what’s going on is to recall that for options to keep their value, something unexpected has to happen. When nothing unexpected happens, from a trader’s perspective, what’s the value-add of continuing to own put options, for instance? So, you sell and pressure IVOL. Consequently, dealers, who are short puts declining in value, buy back some of their short stock and/or futures hedges, and this is supportive for the market.
Graphic: Retrieved from SpotGamma’s HIRO for the S&P 500 (INDEX: SPX) on 2/7/2023.
The bullish impact of this options activity, taken alone, is not long-lasting.
In the Daily Brief for February 3, 2023, we discussed the impact of this activity, all else equal; as time passes and/or volatility falls, the counterparties’ reaction to long call options, for example, declining in value is to sell some of the stock and futures they own as hedges. This can resist traders’ attempts to explore higher prices.
To close, it continues to make sense to position in structures that take advantage of still low longer-dated S&P 500 (INDEX: SPX) IVOL. For instance, traders can consider selling rich call verticals to finance put verticals expiring months from now.
In our recent commentaries, we reasoned why such structures are priced the way they are. Should market pressures surface, that’s a simple way to protect profits.
Technical
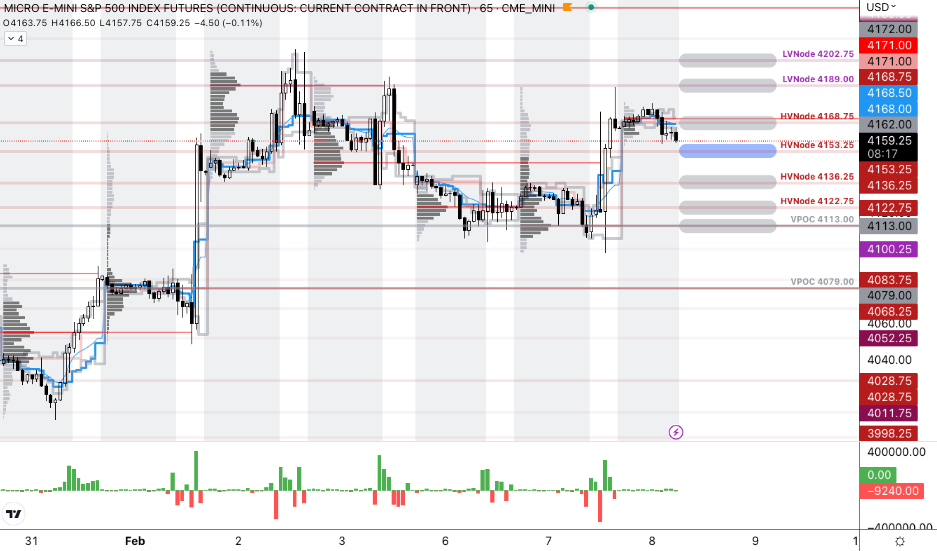
As of 6:50 AM ET, Wednesday’s regular session (9:30 AM – 4:00 PM ET), in the S&P 500, is likely to open in the lower part of a balanced overnight inventory, inside of the prior day’s range, suggesting a limited potential for immediate directional opportunity.
The S&P 500 pivot for today is $4,153.25.
Key levels to the upside include $4,168.75, $4,189.00, and $4,202.75.
Key levels to the downside include $4,136.25, $4,122.75, and $4,113.00.
Disclaimer: Click here to load the updated key levels via the web-based TradingView platform. New links are produced daily. Quoted levels likely hold barring an exogenous development.
Graphic: 65-minute profile chart of the Micro E-mini S&P 500 Futures.
Definitions
Volume Areas: Markets will build on areas of high-volume (HVNodes). Should the market trend for a period of time, this will be identified by a low-volume area (LVNodes). The LVNodes denote directional conviction and ought to offer support on any test.
If participants auction and find acceptance in an area of a prior LVNode, then future discovery ought to be volatile and quick as participants look to the nearest HVNodes for more favorable entry or exit.
POCs: Areas where two-sided trade was most prevalent in a prior day session. Participants will respond to future tests of value as they offer favorable entry and exit.
About
The author, Renato Leonard Capelj, works in finance and journalism.
Capelj spends the bulk of his time at Physik Invest, an entity through which he invests and publishes free daily analyses to thousands of subscribers. The analyses offer him and his subscribers a way to stay on the right side of the market. Separately, Capelj is an options analyst at SpotGamma and an accredited journalist.
The daily brief is a free glimpse into the prevailing fundamental and technical drivers of U.S. equity market products. Join the 900+ that read this report daily, below!
Graphic updated 7:30 AM ET. Sentiment Risk-On if expected /ES open is above the prior day’s range. /ES levels are derived from the profile graphic at the bottom of the following section. Levels may have changed since initially quoted; click here for the latest levels. SqueezeMetrics Dark Pool Index (DIX) and Gamma (GEX) calculations are based on where the prior day’s reading falls with respect to the MAX and MIN of all occurrences available. A higher DIX is bullish. At the same time, the lower the GEX, the more (expected) volatility. Learn the implications of volatility, direction, and moneyness. Breadth reflects a reading of the prior day’s NYSE Advance/Decline indicator. VIX reflects a current reading of the CBOE Volatility Index (INDEX: VIX) from 0-100.
Administrative
Hey team, before we get started, let’s address the mismatch some observed last week with this letter’s levels and S&P quotes, versus what they saw at home.
It is basically the case that our charting platform rolled over to the December S&P 500 Index futures contract on September 9, 2022. This was about 1-week ahead of the expiry of the old contract on September 16, 2022.
Going forward, unless otherwise noted, 6-days prior to the expiration of a quoted contract, the levels and prices in this letter may reflect that of the new, father-dated contract.
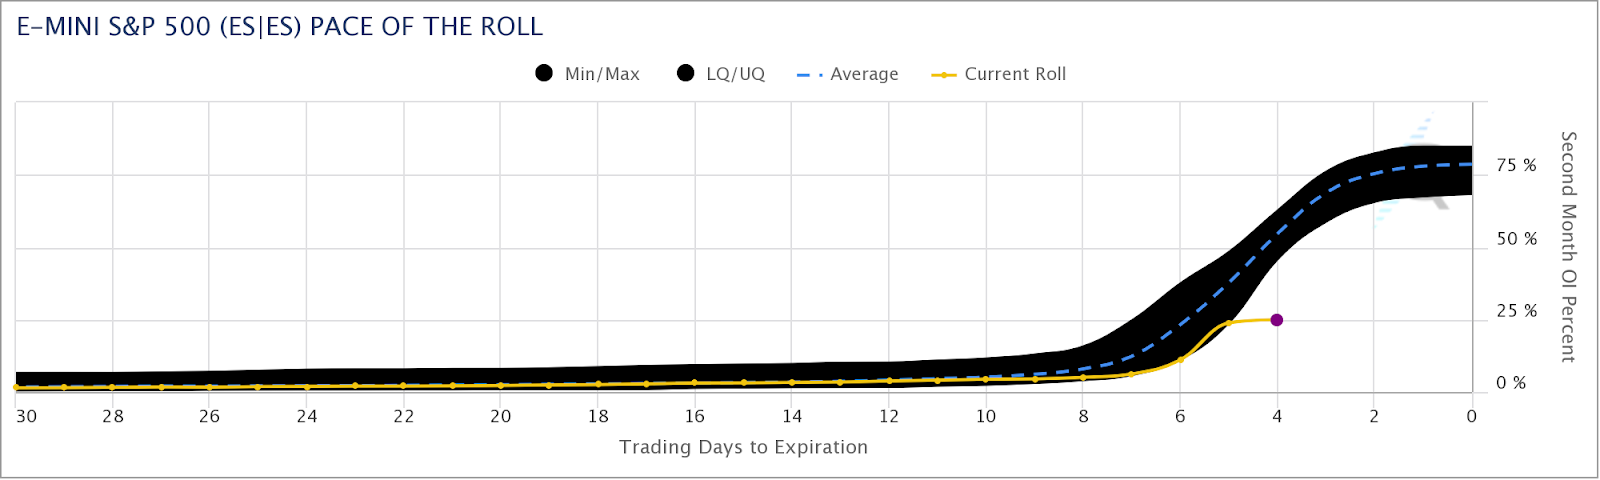
As an aside, based on CME Group Inc’s (NASDAQ: CME) Equity Quarterly Roll Analyzer Tool, the pace of the E-mini S&P 500 (FUTURE: /ES) roll is far off of what it has historically been at this stage of the roll period.
This roll, too, caught your letter’s writer by surprise. Sorry!
Graphic: Retrieved from CME Group Inc (NASDAQ: CME).
Moving on, coverage this week may be sporadic due to some uncertain travel commitments. It is seeming very likely that there may not be a letter published on September 13 and 14, 2022.
Fundamental
Let’s get into it.
At its core, there’s a lot of stuff happening on the monetary and fiscal front. Guiding some of this action, on those fronts, are (geo)political happenings, the rising tide of populism, and beyond.
On the political fronts, Ukrainians “broke through weakened Russian lines, seizing the strategic railway hub of Kupiansk and the key staging area of Izyum,” Noah Smith explained in his letter.
A timelapse of the progress over the first 4 days of Ukraine's Kharkiv offensive. pic.twitter.com/qicoHEEKPD
Recent happenings illustrate “some important principles about the broader conflict unfolding across our world between liberalism and illiberalism,” as well as what a “successful defense of Ukraine” would do to hurt “the dawn of a new age of imperial expansionism,” something we’ve talked a lot about in past letters, alongside the growing deglobalization pulse.
The go-to on the implications of these conflicts, as well as the “burgeoning monetary order,” dubbed Bretton Woods III, has been Credit Suisse Group AG’s (NYSE: CS) Zoltan Pozsar who thinks the dollar “is entering a new and rockier phase” and what “matters more than access to dollars is access to commodities and actual things.”
From hereon, Pozsar thinks “commodity prices can go much higher, … and a dollar can get devalued in terms of commodities.”
In the face of geopolitical and supply chokepoints (further bolstered by such things as railroad strikes), as well as the fragmentation of “the physical world,” it’s no “longer appropriate to think about the world as a unified whole,” Pozsar explains.
Potentially at hand is a “self-reinforcing ‘dollar doom loop,’” Jon Turek of JST Advisors adds in the earlier quoted article. That’s big since, as we once explained, the dollar is the dominant currency for carry due to the easy monetary policies that removed the risk of a strong dollar.
“Non-US entities make dollar-based loans and transactions … because it’s considered more trustworthy than native fiat,” Bankless explained. “When there’s a disruption in global cash flows, there’s effectively a short squeeze on the dollar.”
Therefore, while efforts to stem inflation bolstered by supply chokepoints continue, “the stronger the dollar gets in comparison, the less tenable it becomes as a global reserve.”
That is pressure on the long-term trajectory of the dollar.
Ultimately, through the earlier mentioned developments, “breaking the dollar’s dominance could arguably help some countries avoid a tightening of financial conditions,” Bloomberg explains.
Accordingly, with “the dollar’s peak [] already in the rearview mirror,” concerns are amped in regard to how this impacts U.S. markets. It’s the case that U.S. market liquidity, as well as the dollar’s strong role as a reserve, put the S&P 500 at the center of the global carry regime.
Thus, an unwinding of carry may compound a market drop affecting nearly all risk assets, even housing, and prompting recession, something we shall unpack further in coming letters.
Graphic: Retrieved from The Market Ear. Via Morgan Stanley (NYSE: MS). “MS Research thinks the lows for this bear market will likely arrive in the fourth quarter with 3,400 the minimum downside and 3,000 the low if a recession arrives.”
To round out this section, a bull case is likely characterized by less outsized interest rate hikes here, in the US, with quantitative tightening (QT) ramping “to its maximal caps” with no increase in “vol or yields,” said JPMorgan Chase & Co (NYSE: JPM) market intelligence.
However, if inflation remains hot – 8% and 9% – and supply disruptions remain sticky, the Fed may continue on its path of higher for longer. That means an “outsized rate hike cadence in Nov/Dec, bringing Fed Funds above 4.0% … and QT put[ting] upward pressure on yields.”
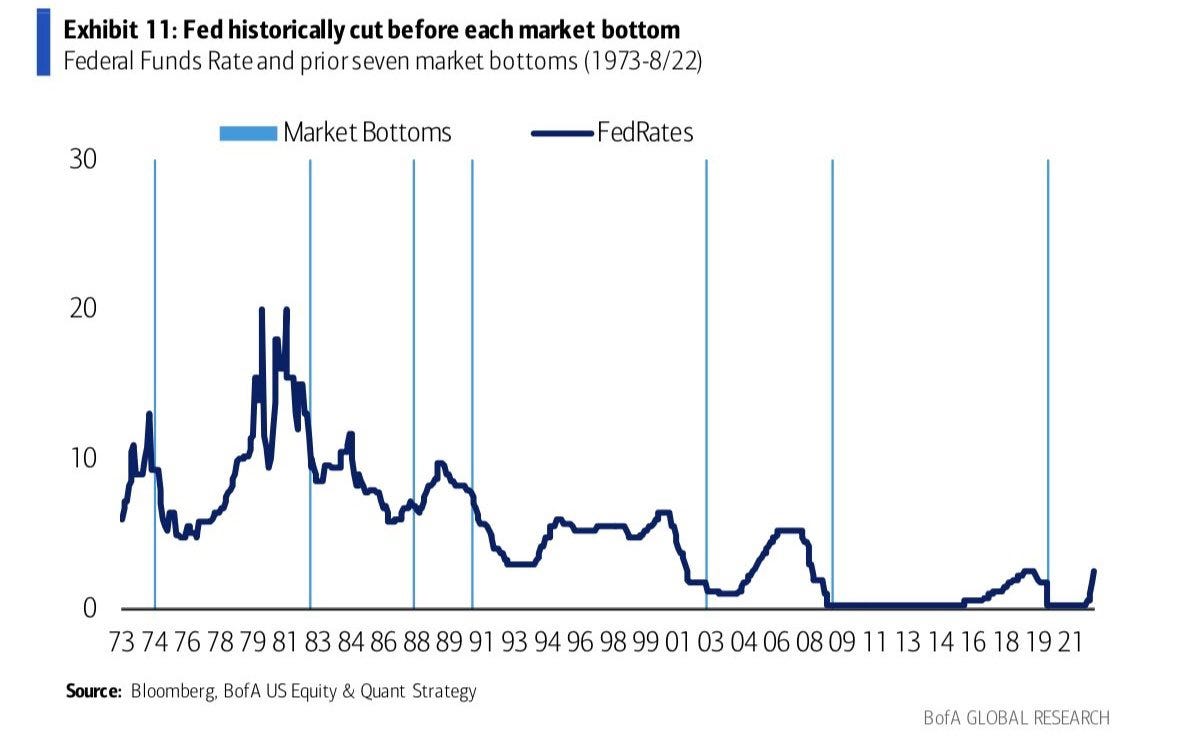
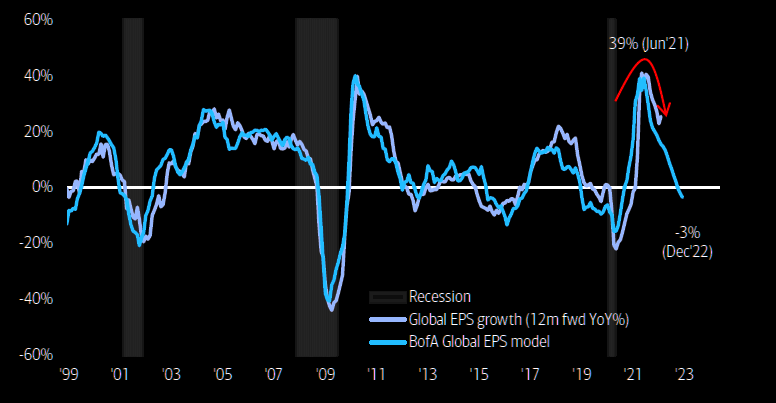
Graphic: Retrieved from Callum Thomas. Via Bank of America Corporation (NYSE: BAC). Market bottoms often appear when the Federal Reserve (Fed) begins cutting interest rates.
Positioning
Demand for protection and re-entry into shorts was the context for selling that culminated in an S&P 500 (INDEX: SPX) low at $3,900.00 last week.
It’s at this level, “where the demand for put options was concentrated,” analysis providers like SpotGamma saw “support” and, “absent an exogenous catalyst,” S&P 500 stability.
From thereon, into the end of the week, SpotGamma adds that “positive delta hedging flows” bolstered a “market move away from the $3,900.00 support.” Tools like SpotGamma’s HIRO showed volatility selling and this validated a SpotGamma call for “follow-on bullishness.”
Graphic: Retrieved from SpotGamma. Updated September 7, 2022.
Nonetheless, in light of the above fundamental and positioning contexts, after derivatives expiries this month, the stage is likely set for larger two-way ranges.
Technical
As of 7:20 AM ET, Monday’s regular session (9:30 AM – 4:00 PM ET), in the S&P 500, is likely to open in the upper part of a balanced overnight inventory, outside of prior-range and -value, suggesting a potential for immediate directional opportunity.
In the best case, the S&P 500 trades higher.
Any activity above the $4,107.00 POC puts into play the $4,136.75 MCPOC. Initiative trade beyond the MCPOC could reach as high as the $4,189.25 LVNode and $4,231.00 VPOC, or higher.
In the worst case, the S&P 500 trades lower.
Any activity below the $4,107.00 POC puts into play the $4,071.00 VPOC. Initiative trade beyond the VPOC could reach as low as the $4,018.75 HVNode and $3,991.00 VPOC, or lower.
Click here to load today’s key levels into the web-based TradingView charting platform. Note that all levels are derived using the 65-minute timeframe. New links are produced, daily.
Graphic: 65-minute profile chart of the Micro E-mini S&P 500 Futures.
Definitions
Volume Areas: A structurally sound market will build on areas of high volume (HVNodes). Should the market trend for long periods of time, it will lack sound structure, identified as low volume areas (LVNodes). LVNodes denote directional conviction and ought to offer support on any test.
If participants were to auction and find acceptance into areas of prior low volume (LVNodes), then future discovery ought to be volatile and quick as participants look to HVNodes for favorable entry or exit.
POCs: POCs are valuable as they denote areas where two-sided trade was most prevalent in a prior day session. Participants will respond to future tests of value as they offer favorable entry and exit.
MCPOCs: POCs are valuable as they denote areas where two-sided trade was most prevalent over numerous day sessions. Participants will respond to future tests of value as they offer favorable entry and exit.
About
After years of self-education, strategy development, mentorship, and trial-and-error, Renato Leonard Capelj began trading full-time and founded Physik Invest to detail his methods, research, and performance in the markets.
Capelj also develops insights around impactful options market dynamics at SpotGamma and is a Benzinga reporter.
In no way should the materials herein be construed as advice. Derivatives carry a substantial risk of loss. All content is for informational purposes only.
The daily brief is a free glimpse into the prevailing fundamental and technical drivers of U.S. equity market products. Join the 850+ that read this report daily, below!
Graphic updated 7:15 AM ET. Sentiment Neutral if expected /ES open is inside of the prior day’s range. /ES levels are derived from the profile graphic at the bottom of the following section. Levels may have changed since initially quoted; click here for the latest levels. SqueezeMetrics Dark Pool Index (DIX) and Gamma (GEX) calculations are based on where the prior day’s reading falls with respect to the MAX and MIN of all occurrences available. A higher DIX is bullish. At the same time, the lower the GEX, the more (expected) volatility. Learn the implications of volatility, direction, and moneyness. Breadth reflects a reading of the prior day’s NYSE Advance/Decline indicator. VIX reflects a current reading of the CBOE Volatility Index (INDEX: VIX) from 0-100.
Fundamental
Please pardon the light letter, team.
The Federal Reserve (Fed) Chair Jerome Powell will speak on monetary policy today at 9:10 AM ET. He is likely to embolden the tone set forth yesterday by the Fed’s Lael Brainard who said that higher rates for far longer seem necessary at this juncture.
The base case calls for a 75 basis point hike to interest rates this month, followed by 50 basis points in November, according to Goldman Sachs Group Inc (NYSE: GS) forecasts.
A quick check of the Eurodollar – which reflects the interest offered on U.S. dollar-denominated deposits held at banks outside of the U.S. (i.e., participants’ outlook on interest rates) – shows a peak in the overnight rate at 4.155% in February of 2023. From thereon, rate cuts are implied.
Graphic: Via Charles Schwab Corporation-owned (NYSE: SCHW) TD Ameritrade’s Thinkorswim.
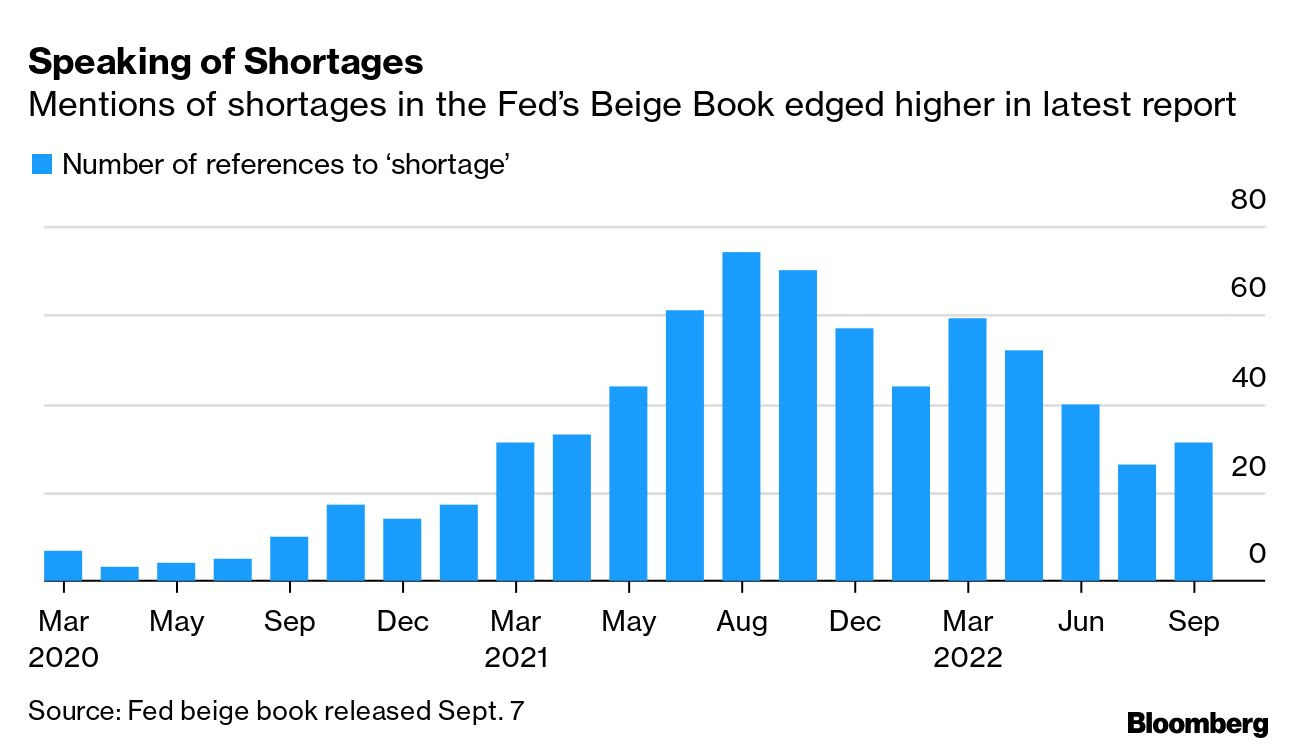
It’s the case that monetary policies implemented resulted in too many dollars (still) chasing too few goods. We spoke on supply side dislocations last week and put forth that, from a monetary perspective, the Fed, among its peers like the ECB, can only and will tighten to stem inflationary pressures that are (to remain) structural.
Graphic: Retrieved from Bloomberg. “The number of references to the word ‘shortage’ in the Fed’s latest Beige Book report edged higher after declining for three straight reports, according to a Bloomberg tally. Job markets remained tight and labor shortages weighed on several sectors. That plus continued supply-chain snarls hampered manufacturing, the Fed said.”
It is the case that the economy is on a path that is “L”-shaped (i.e., vertical drop in activity via recession, and flatline for a period of time as rates remain higher for longer to prevent a sharp rise in inflation, again).
Zoltan Pozsar of Credit Suisse Group AG (NYSE: CS) puts forth that policymakers now have to “generate a round of negative wealth effects to lower demand such that it becomes more in line with the new realities of supply.”
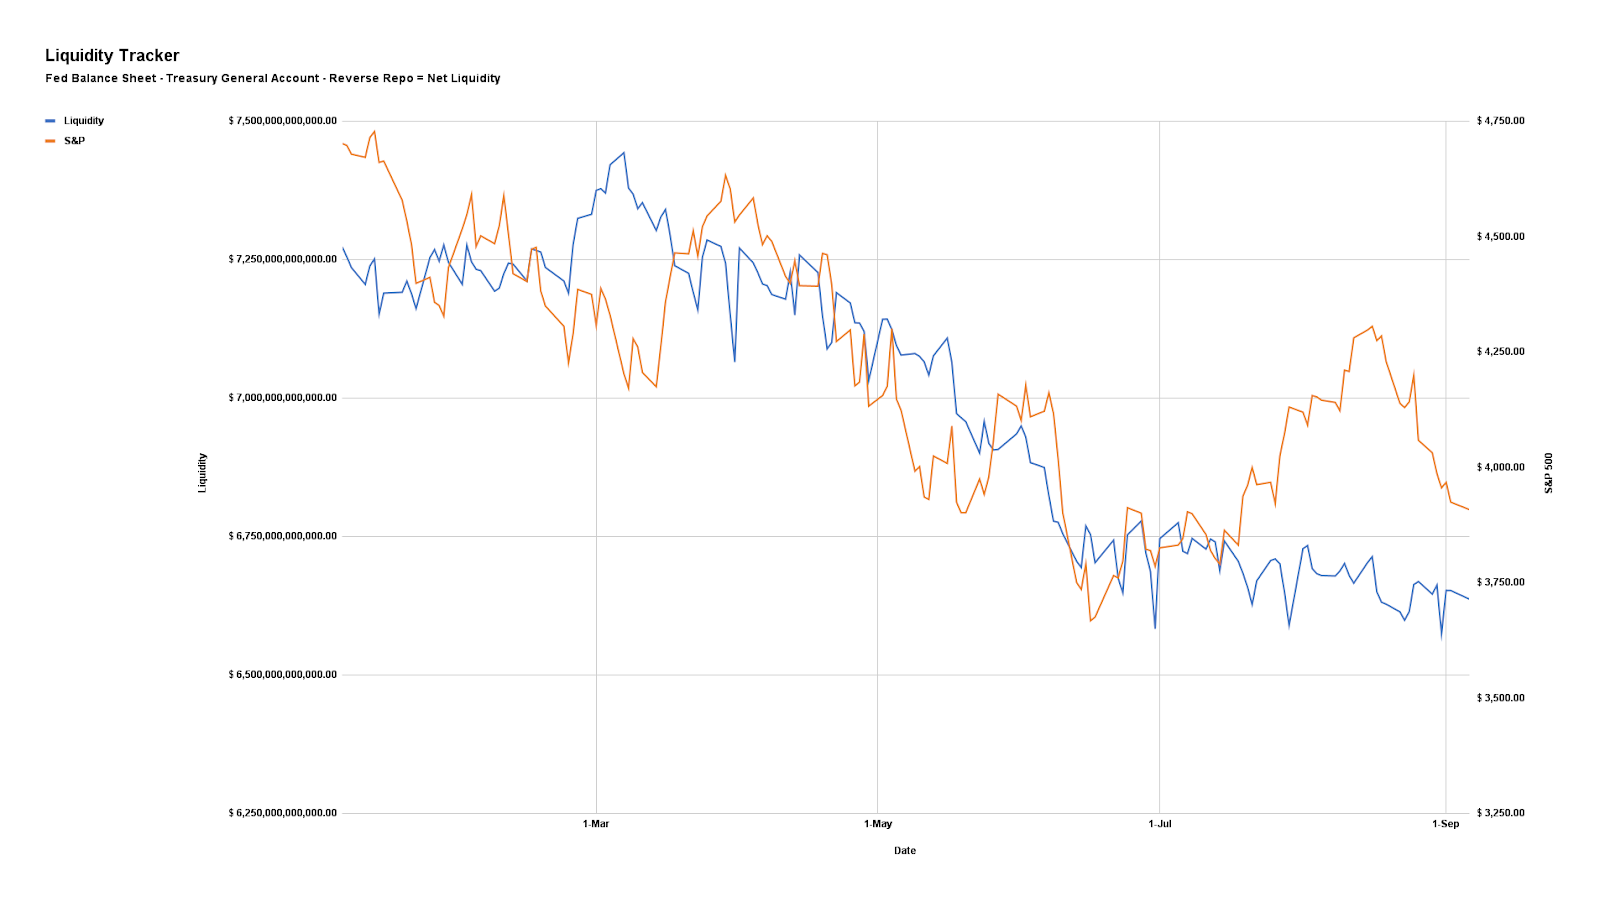
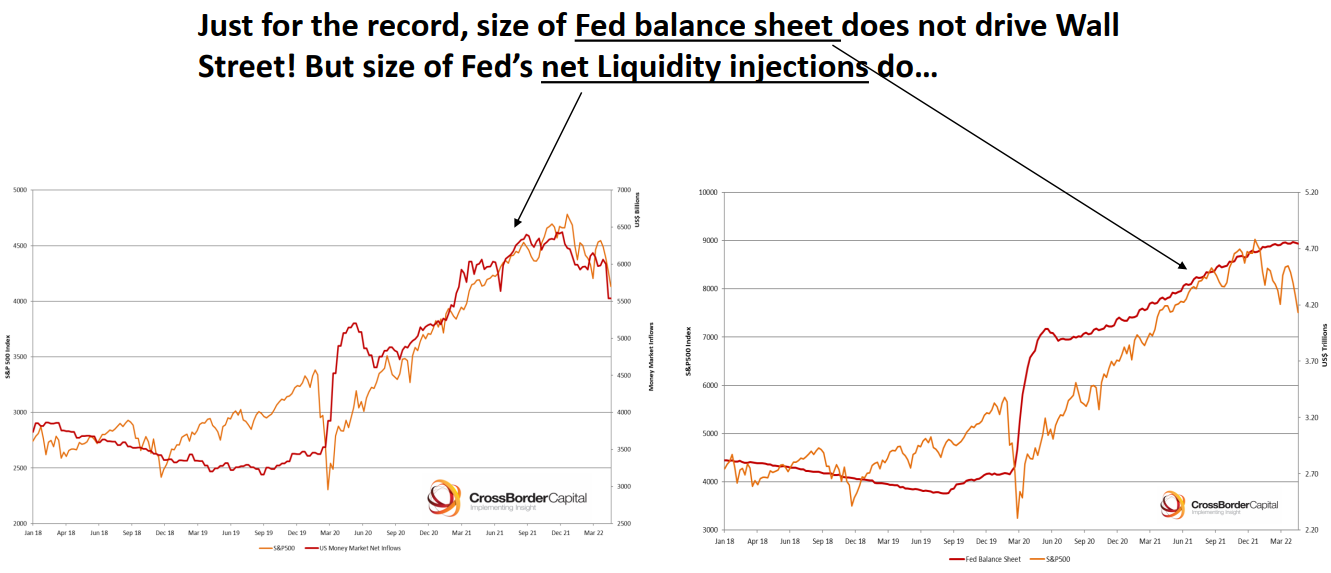
Graphic: Via Physik Invest. Data compiled by @jkonopas623. Fed Balance Sheet data, here. Treasury General Account Data, here. Reverse Repo data, here. NL = BS – TGA – RRP.
Technical
Implied volatility (IVOL) is wound and markets are in an environment characterized by two-way ranges that are larger. Yesterday, we unpacked one way traders could have played the entry into this environment.
Further, as SpotGamma puts it well, a positive response to Powell’s remarks, into and through events such as the next update on consumer prices and the Federal Open Market Committee (FOMC) meeting, opens the door to IVOL compression and this would be “a boost for equities.”
That’s because the Delta risk counterparties are exposed to by holding short put options, for instance, reduces with falling IVOL. Accordingly, since the short puts carry less positive Delta, the counterparty reduces its negative Delta exposure via the underlying future or stock, which can support markets.
Graphic: Retrieved via SpotGamma’s Hedging Impact of Real-Time Options (HIRO) indicator. S&P 500 volatility selling coincides with a drop in IVOL and a price rise in the underlying.
Technical
As of 7:15 AM ET, Thursday’s regular session (9:30 AM – 4:00 PM ET), in the S&P 500, is likely to open in the middle part of a balanced overnight inventory, inside of prior-range and -value, suggesting a limited potential for immediate directional opportunity.
In the best case, the S&P 500 trades higher.
Any activity above the $3,988.25 HVNode puts into play the $4,018.75 HVNode. Initiative trade beyond the latter could reach as high as the $4,064.00 RTH High and $4,107.00 VPOC, or higher.
In the worst case, the S&P 500 trades lower.
Any activity below the $3,988.25 HVNode puts into play the $3,952.75 LVNode. Initiative trade beyond the LVNode could reach as low as the $3,925.00 VPOC and $3,884.25 LVNode, or lower.
Click here to load today’s key levels into the web-based TradingView charting platform. Note that all levels are derived using the 65-minute timeframe. New links are produced, daily.
Graphic: 65-minute profile chart of the Micro E-mini S&P 500 Futures.
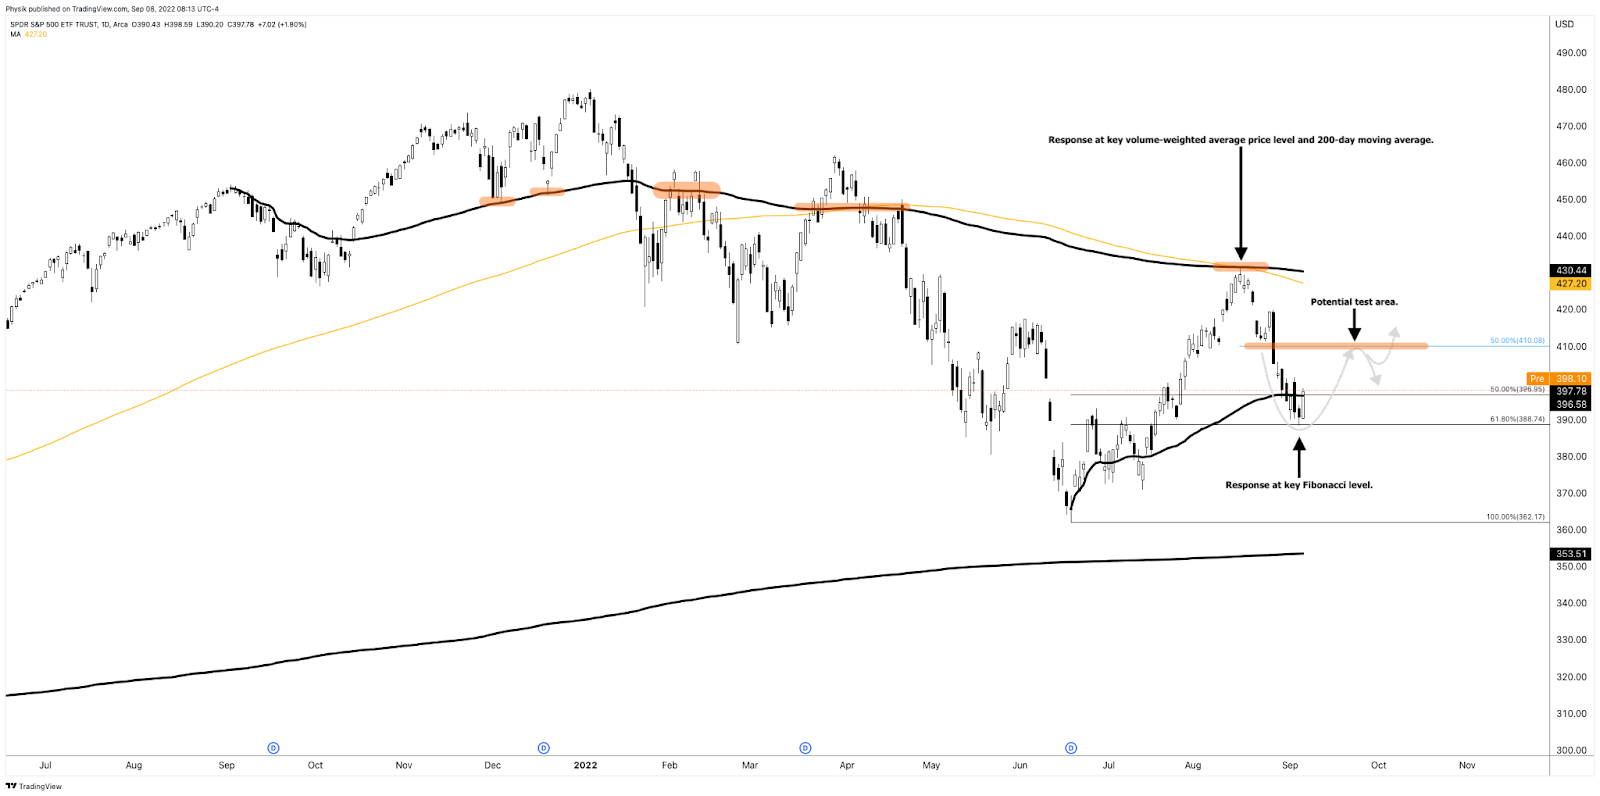
Considerations: Responsiveness near key-technical areas (that are discernable visually on a chart), suggests technically-driven traders with short time horizons are very active.
Such traders often lack the wherewithal to defend retests and, additionally, the type of trade may be indicative of the other time frame participants waiting for more information to initiate trades.
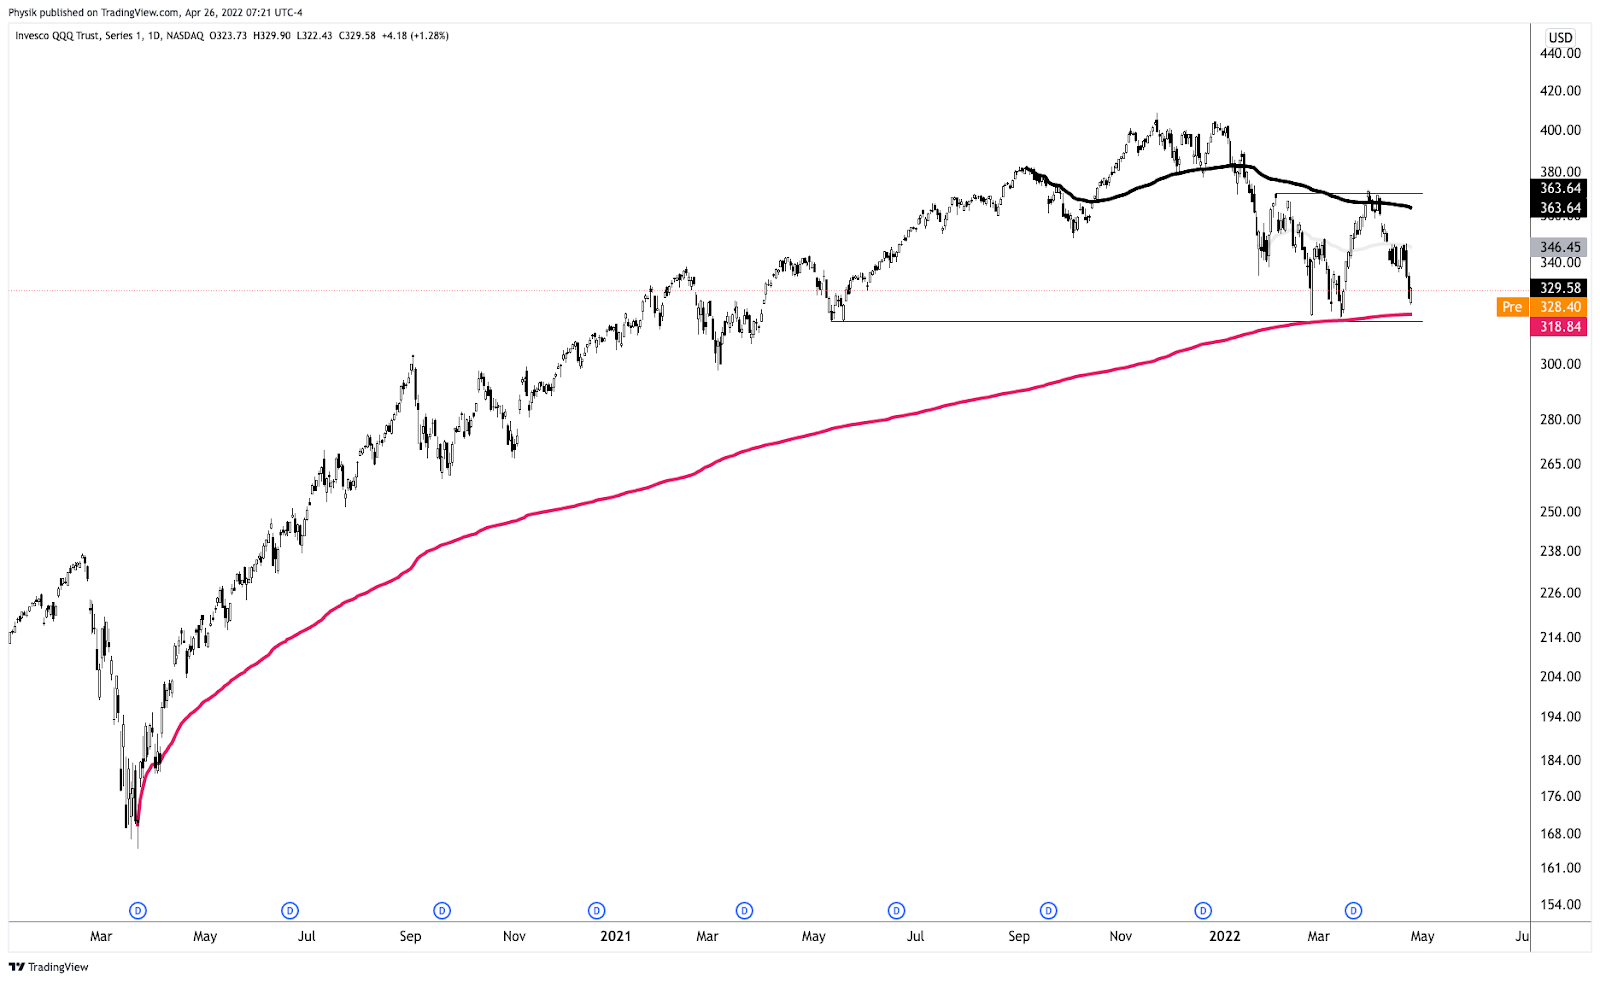
Graphic: Daily chart of the SPDR S&P 500 ETF Trust (NYSE: SPY).
Definitions
Volume Areas: A structurally sound market will build on areas of high volume (HVNodes). Should the market trend for long periods of time, it will lack sound structure, identified as low volume areas (LVNodes). LVNodes denote directional conviction and ought to offer support on any test.
If participants were to auction and find acceptance into areas of prior low volume (LVNodes), then future discovery ought to be volatile and quick as participants look to HVNodes for favorable entry or exit.
POCs: POCs are valuable as they denote areas where two-sided trade was most prevalent in a prior day session. Participants will respond to future tests of value as they offer favorable entry and exit.
MCPOCs: POCs are valuable as they denote areas where two-sided trade was most prevalent over numerous day sessions. Participants will respond to future tests of value as they offer favorable entry and exit.
Volume-Weighted Average Prices (VWAPs): A metric highly regarded by chief investment officers, among other participants, for quality of trade. Additionally, liquidity algorithms are benchmarked and programmed to buy and sell around VWAPs.
About
After years of self-education, strategy development, mentorship, and trial-and-error, Renato Leonard Capelj began trading full-time and founded Physik Invest to detail his methods, research, and performance in the markets.
Capelj also develops insights around impactful options market dynamics at SpotGamma and is a Benzinga reporter.
In no way should the materials herein be construed as advice. Derivatives carry a substantial risk of loss. All content is for informational purposes only.
The daily brief is a free glimpse into the prevailing fundamental and technical drivers of U.S. equity market products. Join the 300+ that read this report daily, below!
Update: Technicals section now reflects the proper overnight inventory stat.
After a week-long or so de-rate to reflect the impact of higher inflation and harsher monetary policies, equity index futures are trading in a responsive fashion.
The S&P 500, in particular, lies pinned against the $3,700.00 high options open interest strike. The large June monthly options expiration has implications on the expansion of the range, as noted in prior letters.
The newsflow remains depressing. Taken alone, you’d think the Federal Reserve (Fed) would be “soft[ly] landing” us into a depression, just in time for WWIII to help us get out of it.
Kidding. The utmost sympathy for those negatively affected by war and economic hardship.
The distinction between the economy and the market is blurred and the drop is the recession. The equity markets are a mechanism pricing the implications of all the points we talk about, in real-time, months (6-12) in advance.
Given that, there are better measures to assess whether a de-rate has played out, fully. In the last session, information, generated by the market – internals, volatility measures, and the like – suggested to us that more selling was in store, all the while there was a definite change in tone in the non-linear strength of volatility and skew with respect to linear changes in price of assets.
Should you care for the narratives in news, then here it is:
The Bank of England (BOE) pointed to the potential for a more aggressive rate hike schedule if data were to reflect a wage spiral. The Swiss National Bank (SNB) upped rates an unexpected 50 basis points. The White House weighed fuel-export limits. Both residential permitting and housing starts plummeted with the 30-year fixed-rate breaching 6.00%.
Adding, U.S. junk bond spreads topped 500 basis points for the first time since 2020, and China, also, launched its third most modern aircraft carrier.
Ahead, Fed Chair Jerome Powell speaks at 8:45 AM ET. Then updates on industrial production and capacity utilization (9:15 AM ET), as well as leading economic indicators (10:00 AM ET).
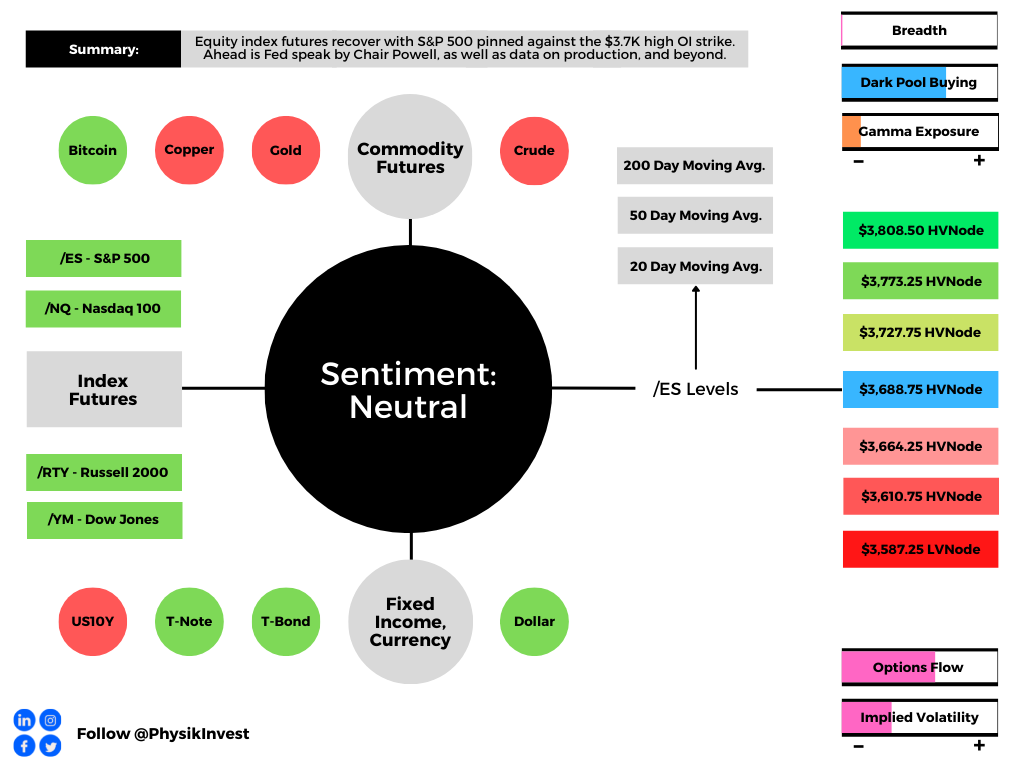
Graphic updated 6:30 AM ET. Sentiment Neutral if expected /ES open is inside of the prior day’s range. /ES levels are derived from the profile graphic at the bottom of the following section. Levels may have changed since initially quoted; click here for the latest levels. SqueezeMetrics Dark Pool Index (DIX) and Gamma (GEX) calculations are based on where the prior day’s reading falls with respect to the MAX and MIN of all occurrences available. A higher DIX is bullish. At the same time, the lower the GEX, the more (expected) volatility. Learn the implications of volatility, direction, and moneyness. SHIFT data used for S&P 500 (INDEX: SPX) options activity. Note that options flow is sorted by the call premium spent; if more positive, then more was spent on call options. Breadth reflects a reading of the prior day’s NYSE Advance/Decline indicator. VIX reflects a current reading of the CBOE Volatility Index (INDEX: VIX) from 0-100.
What To Expect
Team. We’re going to have to keep it a bit shorter, today, and leave out the fundamentals section. Sorry!
In a nutshell, and this is borrowing from a past post-Federal Open Market Committee (FOMC) event letter, as well put forth by Kai Volatility’s Cem Karsan, on a Fed day, “the first move tends to be structural. A function of the inevitable rebalancing of dealer inventory post-event.”
Graphic: Via SpotGamma’s Hedging Impact of Real-Time Options (HIRO) indicator alluded to counterparty buyback of static short delta hedges to positive delta options exposures.
“The second move and final resolution, if you wait for it, is usually tied to the incremental effects on liquidity (QE/QT).”
Essentially, the baseline bear trend held because, essentially, the Fed is, indeed, expected to continue raising rates and withdrawing liquidity. This will prompt a continued de-rate with QT being “a direct flow of capital to capital markets.”
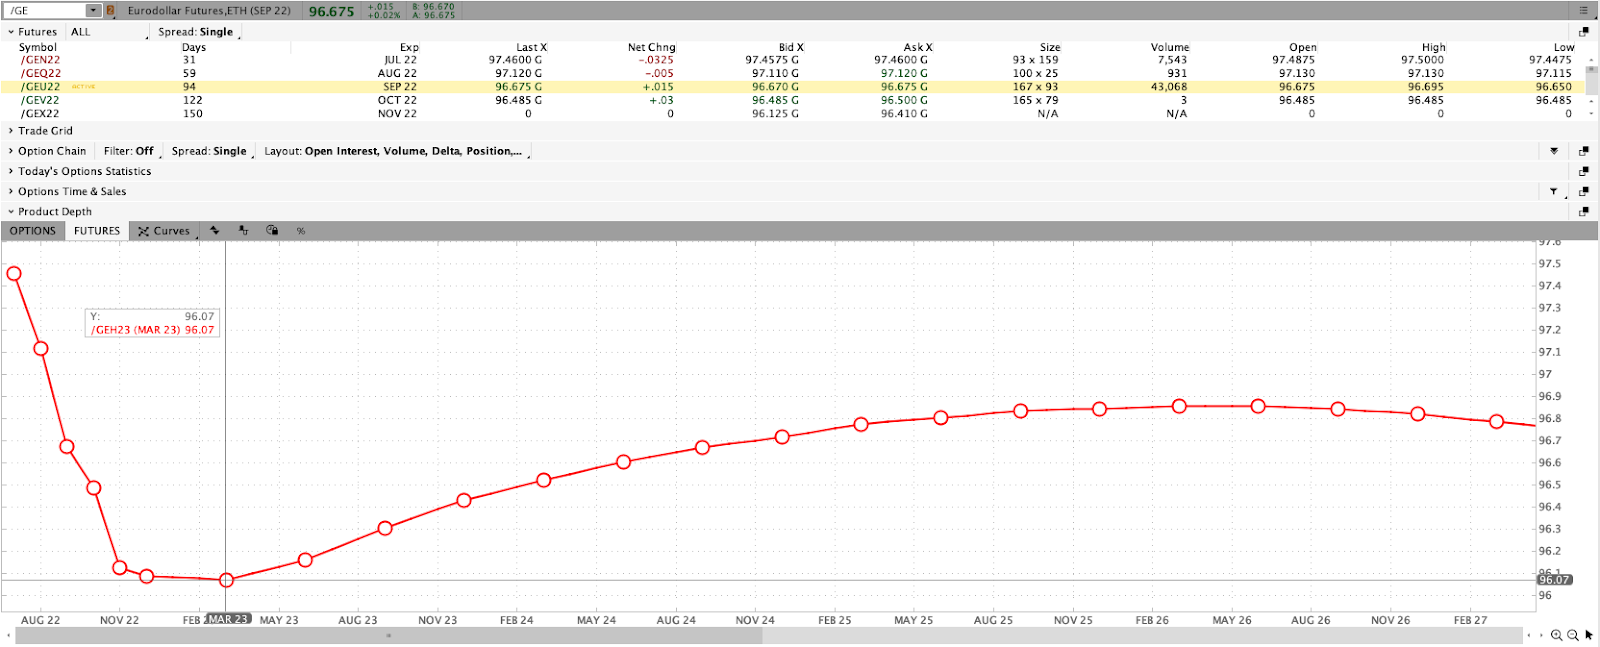
Graphic: Via Charles Schwab Corporation-owned (NYSE: SCHW) TD Ameritrade’s Thinkorswim. The Eurodollar (FUTURE: /GE) futures curve is a reflection of participants’ outlook on interest rates. The peak of the Fed-rate-hike cycle – terminal rate – is around March 2023.
Great, moving on. What’s next?
Essentially, with the June monthly options expiration (OPEX), expected is a roll-off of a large amount of customer negative delta exposure (via put options they own). Taken in a vacuum, with expiration, liquidity providers (who are short put options and short underlying to hedge) will re-hedge (buyback static short-delta, among other things), and this is taken as bullish.
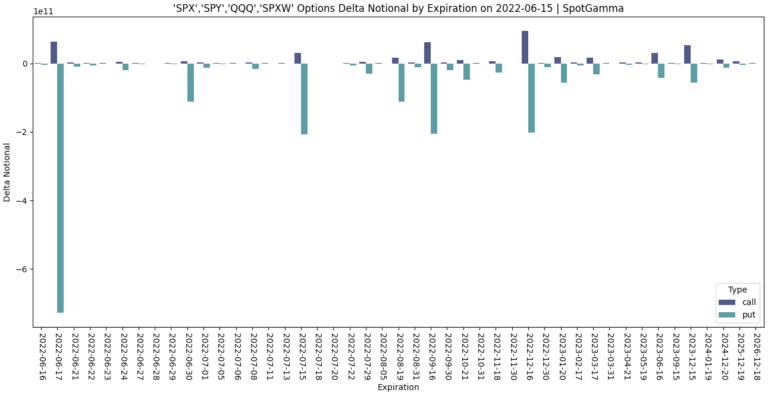
Graphic: Via SpotGamma. “While many of these put positions could be paired off with other offsetting positions (i.e. netting out some of this delta), we remain of the opinion that a lot of these put positions are investor short hedges which will be rolled out and down on OPEX. This means that large ITM puts will be exchanged for OTM puts, which creates a short delta hedge imbalance for dealers (i.e. they need to cover short futures). This is what may drive the OPEX-related rally.
However, this is definitely discounting the impact on delta from participants rolling forward their bets on direction.
Graphic: Via Shift Search. Participants, mainly sell to close their short-dated bets on the downside while buying to open those that are further out in time and lower in price.
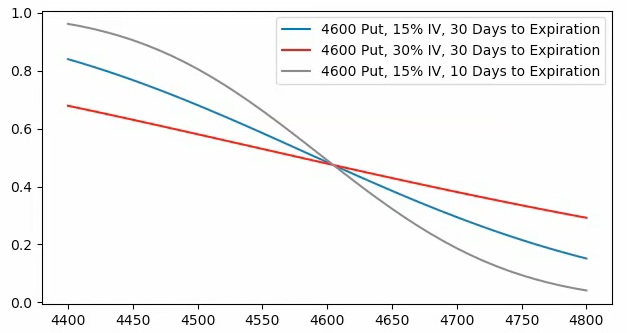
As talked about yesterday, we were to gauge the delta impact by how far below the high open interest strikes the equity indexes were to travel. As stated, these options, have little time to expiry and, thus, their gamma (the sensitivity of the option to change indirection) grows rather large, at near-the-money strikes.
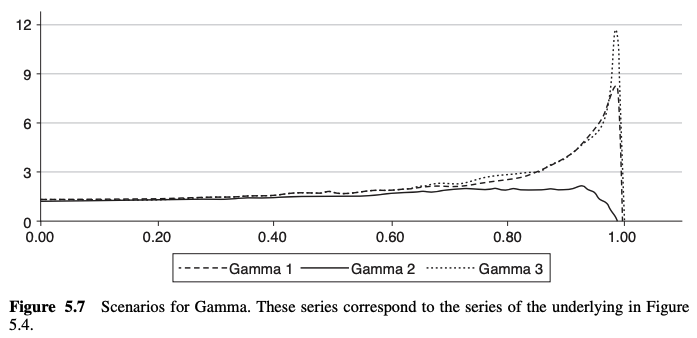
Graphic: Text taken from Exotic Options and Hybrids: A Guide to Structuring, Pricing and Trading.
As the time to expiry narrows, above the strike in question delta decays, and counterparts buy back their static delta hedges.
As the time to expiry narrows, below the strike in question delta expands and counterparts sell more static delta to hedge.
Graphic: Text taken from Exotic Options and Hybrids: A Guide to Structuring, Pricing and Trading.
This means that if far below these high-interest strikes, associated hedging, less any new reach for protection would keep markets pressured. If above, hedging, less new sales of protection, would bolster markets higher.
Graphic: Via SpotGamma. “SPX prices X-axis. Option delta Y-axis. When the factors of implied volatility and time change, hedging ratios change. For instance, if SPX is at $4,700.00 and IV jumps 15% (all else equal), the dealer may sell an additional 0.2 deltas to hedge their exposure to the addition of a positive 0.2 delta. The graphic is for illustrational purposes, only.”
Ultimately, if lower, all else equal, the June 17 OPEX will coincide with the removal of the in-the-money options exposures in question. Negating the rollover of exposures and leaving the door open to some delta imbalance (need to buy to re-hedge exposure) suggests that after this expiration, markets may have less pressure to rally against.
“The SPX index quarterly option notional is higher than usual, but the market is below the concentration of risk given the recent selloff,” Tanvir Sandhu, chief global derivatives strategist at Bloomberg Intelligence, wrote in a note. “Price action will reflect the economic context, but flows from expiring in-the-money hedges may support the market.”
What do you do with this information?
Well, recall that we’ve talked ad nauseam about the supply and demand of volatility, as well as how that impacted the volatility realized (RVOL) and implied (IVOL) by the market.
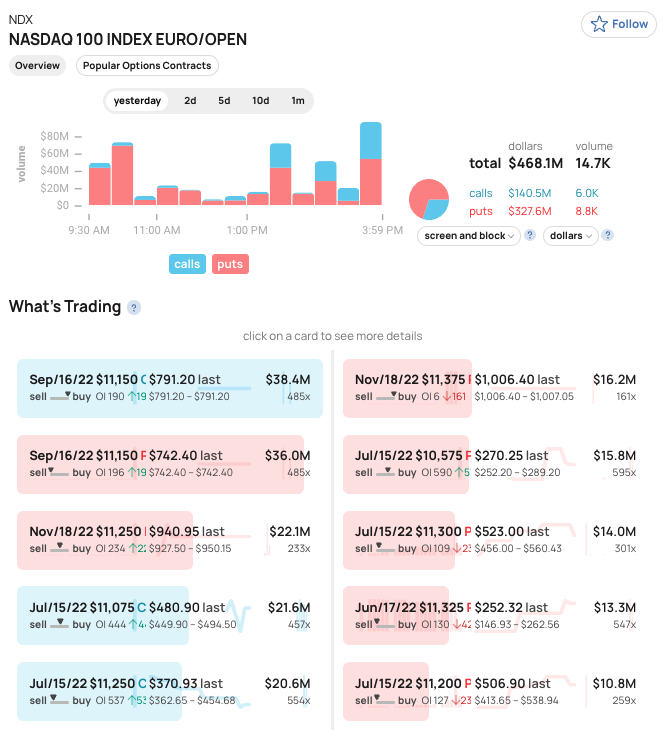
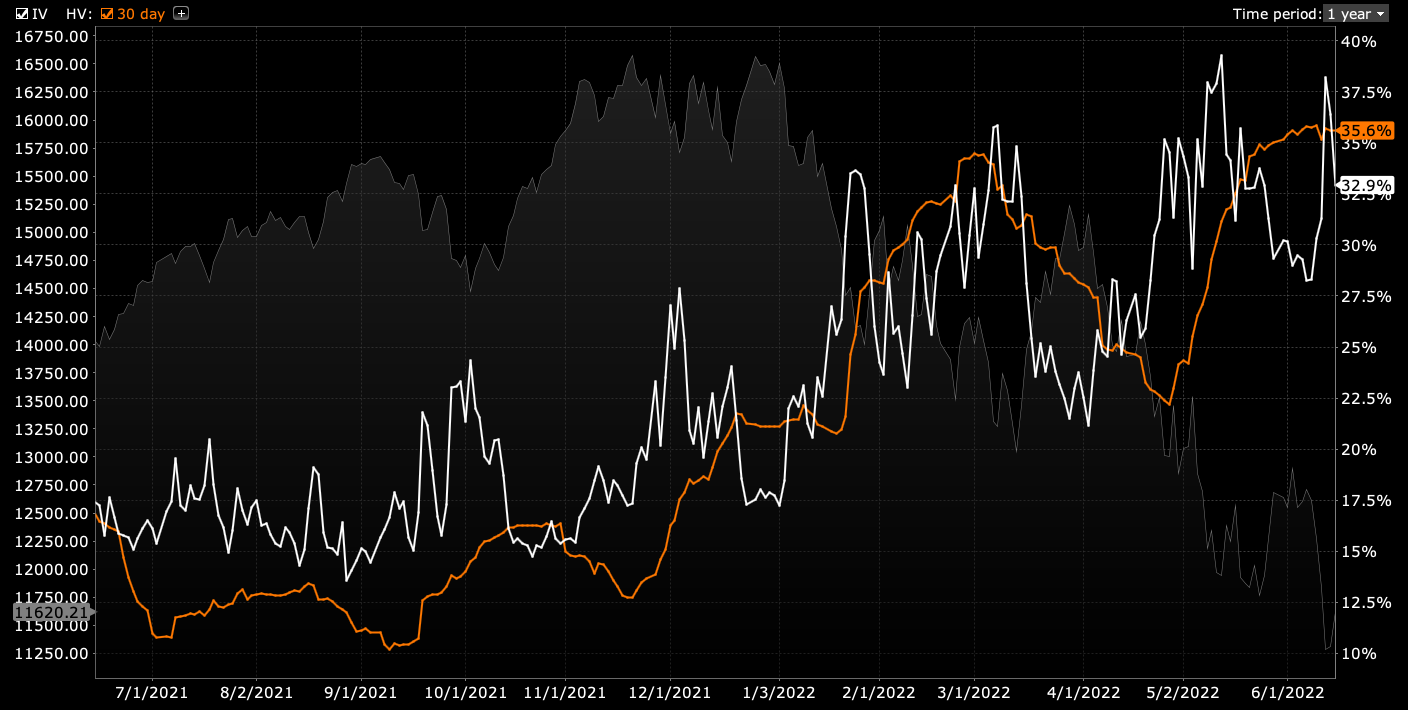
Graphic: Taken by Physik Invest from Interactive Brokers Group Inc (NASDAQ: IBKR). The divergence in volatility implied (IVOL) by participants’ options activity, versus that which the market realizes (RVOL) resurfaced on June 15, 2022, in the Nasdaq 100 (INDEX: NDX).
Essentially there was an “absolute slamming” (i.e., sale of options), particularly in shorter-dated tenors and this played into the generally poor performance in skew, hence our comments on the benefit to buying into implied skew convexity should volatility reprice.
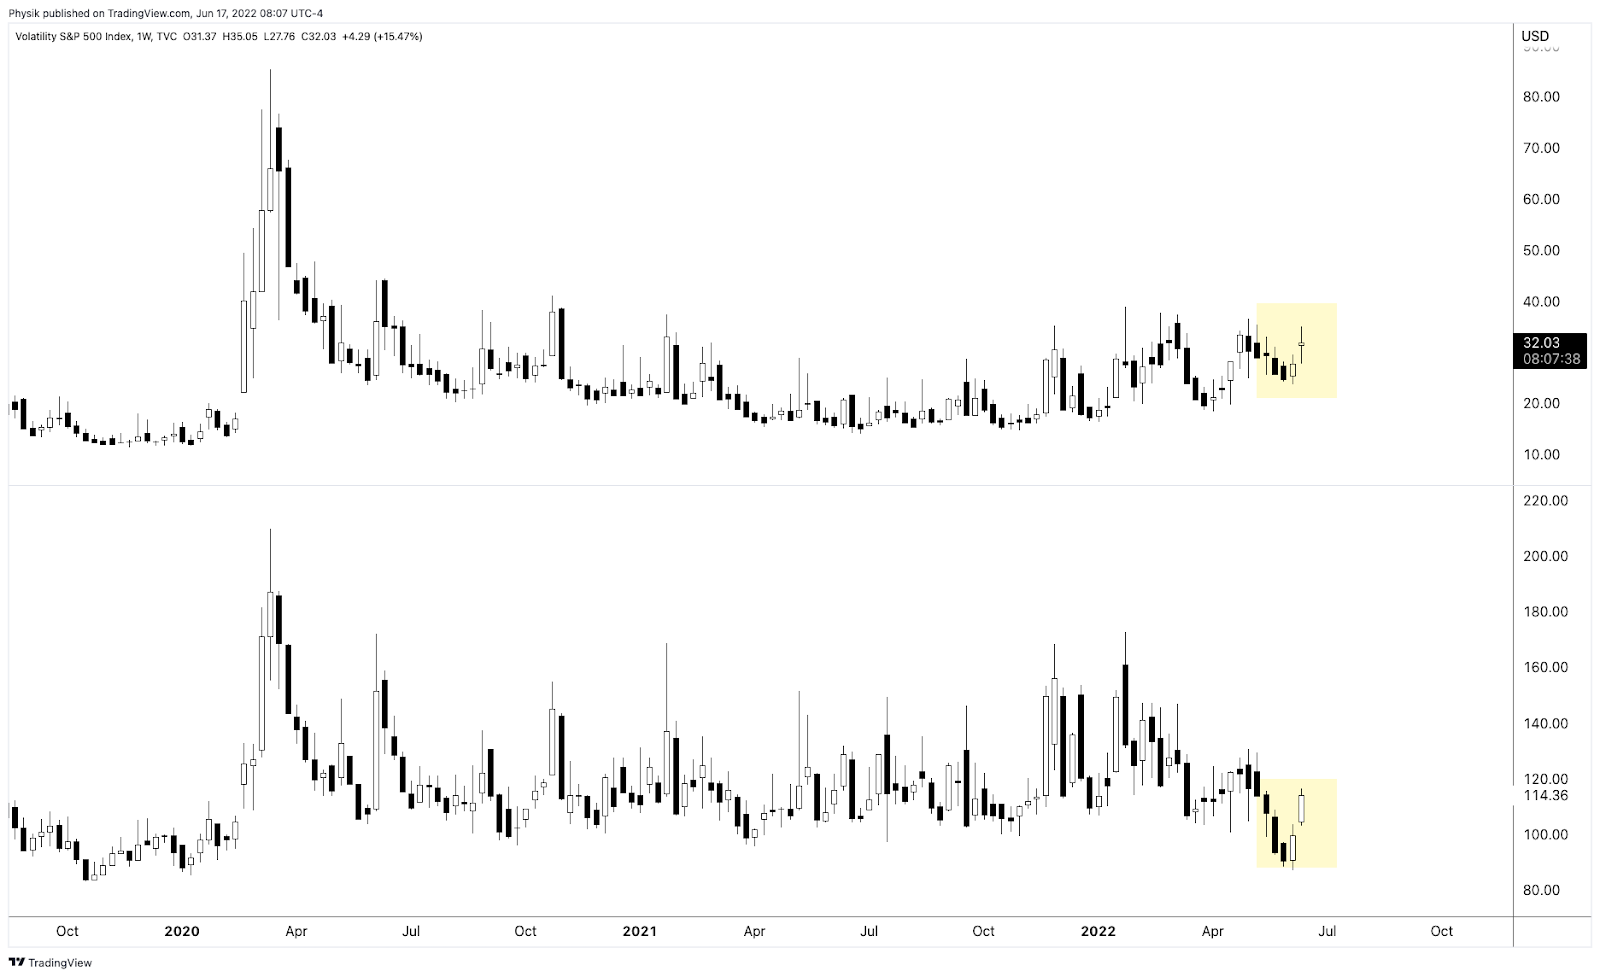
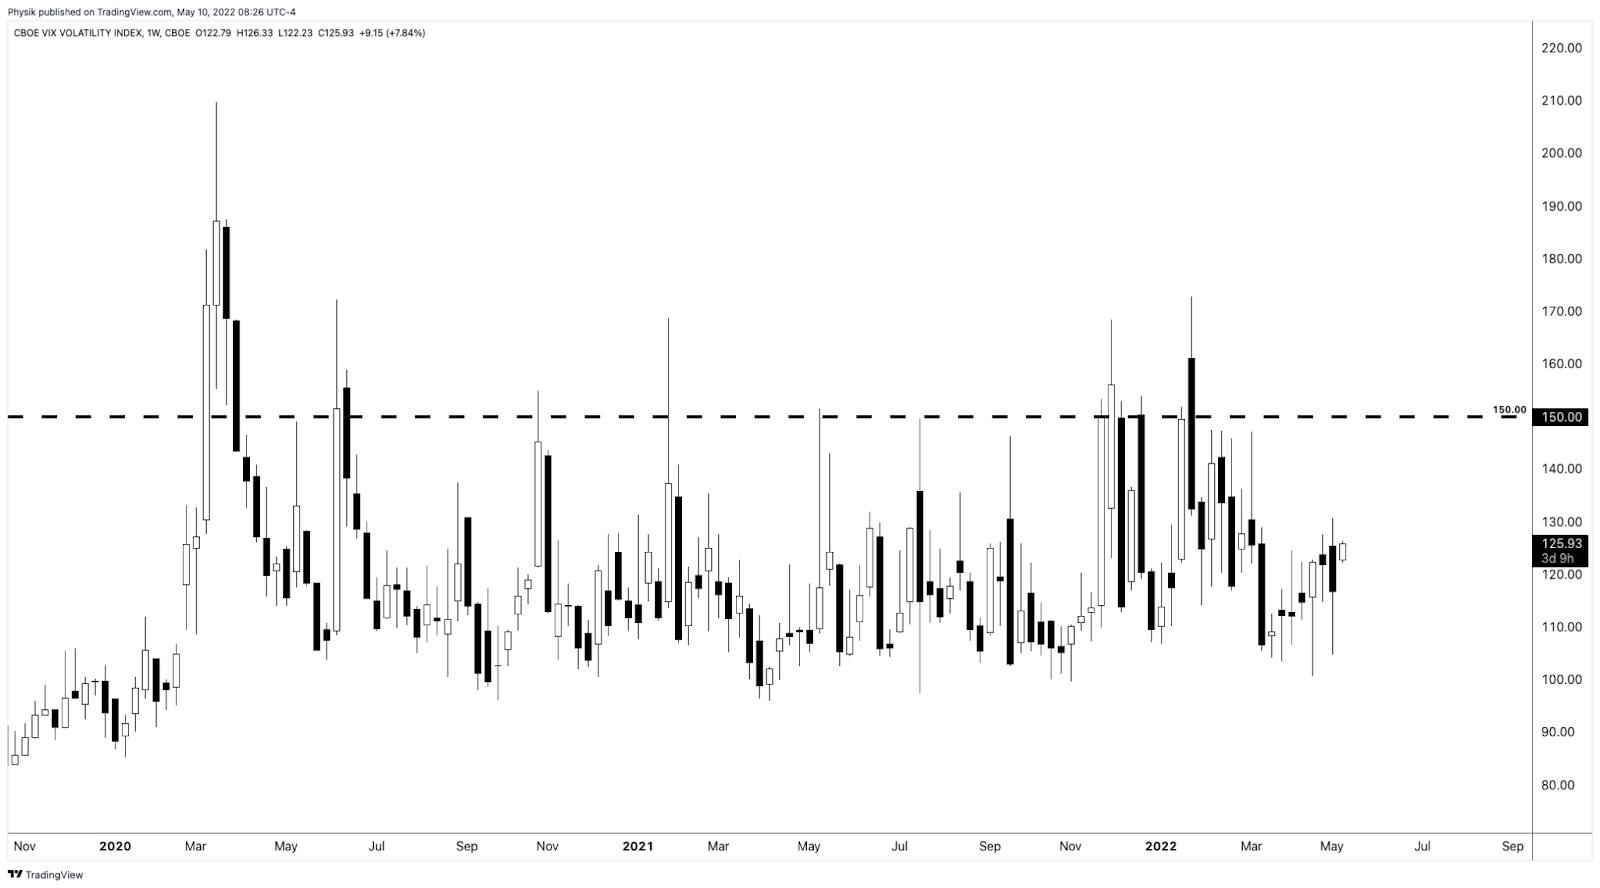
Graphic: Via TradingView. Taken by Physik Invest. The Cboe VVIX Index (INDEX: VVIX), the expected volatility of the 30-day forward price of the VIX, or the volatility of volatility (a naive but useful measure of skew), was very depressed, too, in comparison to the VIX, itself.
Basically, participants are hedged and volatility remains well-supplied.
To hedge or capitalize on a potential reach for protection, amid forced selling or demand for protection by a greater share of the market in ways not recently seen, then the repricing in those structures would be a boon to those that own them.
Graphic: Taken by Physik Invest from Interactive Brokers Group Inc (NASDAQ: IBKR).
To quote Benn Eifert of QVR Advisors: “Skew goes up if vol outperforms the skew curve a lot on a selloff.”
Graphic: Via Banco Santander SA (NYSE: SAN) research.
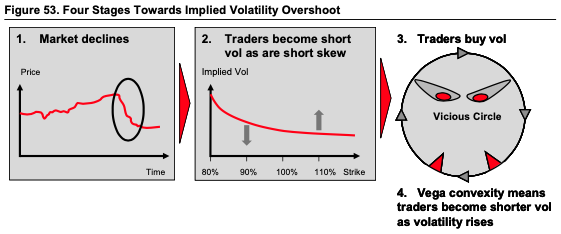
And, as touched on in this morning’s introduction, there was a definite change in tone in the non-linear strength of volatility and skew with respect to linear changes in the price of assets.
Personally, I, along with a partner who I trade closely with, saw increases in the prices of ratio structures (long or short one option near-the-money, short or long two or more further out-of-the-money) by hundreds of percent for only a few basis points of change in the indexes.
As Karsan explained online, there was “a spike in short-dated -sticky skew, [the] first we’ve seen since [the] secular decline began and it hints [at] a potentially critical change in dealer positioning [and] the distribution of underlying outcomes.”
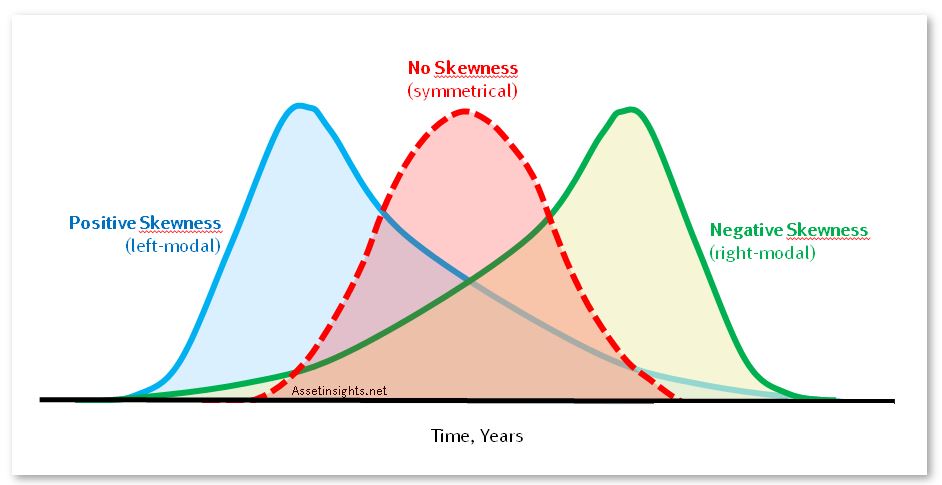
“We’re transitioning to a fat left tail, right-based distribution.”
Graphic: Via English Stack Exchange. Visualizing the transition to a fat left tail and right-based distribution that is skewed negative (i.e., the green distribution).
So why does any of this matter?
This is a validation of our perspectives on how one should position, given what the supply and demand of volatility looked like prior.
Options have a “non-zero second-order price sensitivity (or convexity) to a change in volatility,” as Mohamed Bouzoubaa et al explain well in the book Exotic Options and Hybrids.
“ATM vanillas are [not] convex in the underlying’s price, … but OTM vanillas do have vega convexity … [so], when the holder of an option is long vega convexity, we say she is long vol-of-vol.”
In other words, by owning that protection, you are positioned to monetize on a continued non-linear repricing of volatility. However, doing this in a manner that cuts decay (when nothing happens) is the difficult part.
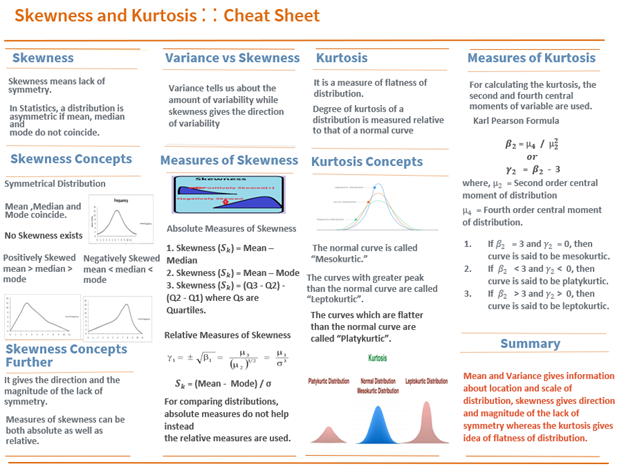
Graphic: Sourced via Towards AI. Skewness and kurtosis cheat sheet.
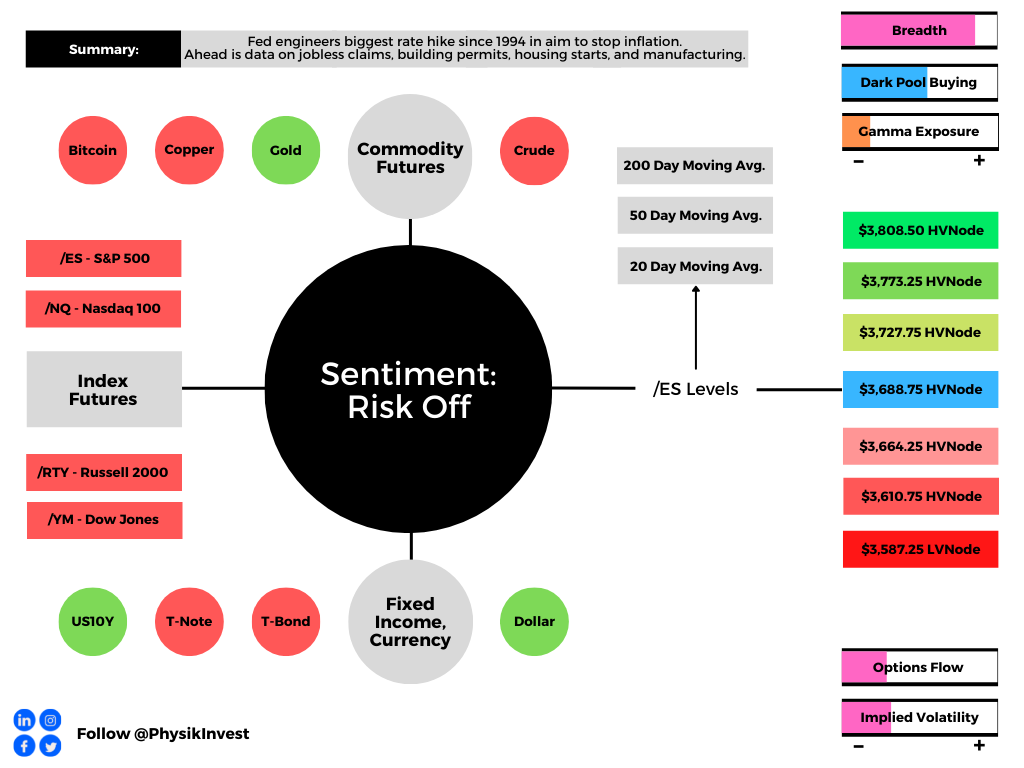
Technical: As of 6:30 AM ET, Friday’s regular session (9:30 AM – 4:00 PM ET), in the S&P 500, will likely open in the lower part of a positively skewed overnight inventory, inside of prior-range and -value, suggesting a potential for immediate directional opportunity.
In the best case, the S&P 500 trades higher; activity above the $3,688.75 HVNode puts in play the $3,727.75 HVNode. Initiative trade beyond the $3,727.75 HVNode could reach as high as the $3,773.25 HVNode and $3,808.50 HVNode, or higher.
In the worst case, the S&P 500 trades lower; activity below the $3,688.75 HVNode puts in play the $3,664.25 HVNode. Initiative trade beyond the $3,664.25 HVNode could reach as low as the $3,610.75 HVNode and $3,587.25 LVNode, or lower.
Click here to load today’s key levels into the web-based TradingView charting platform. Note that all levels are derived using the 65-minute timeframe. New links are produced, daily.
Graphic: 65-minute profile chart of the Micro E-mini S&P 500 Futures.
Definitions
Should the market trend for long periods of time, it will lack sound structure, identified as low volume areas (LVNodes). LVNodes denote directional conviction and ought to offer support on any test.
If participants were to auction and find acceptance into areas of prior low volume (LVNodes), then future discovery ought to be volatile and quick as participants look to HVNodes for favorable entry or exit.
About
After years of self-education, strategy development, mentorship, and trial-and-error, Renato Leonard Capelj began trading full-time and founded Physik Invest to detail his methods, research, and performance in the markets.
Capelj also develops insights around impactful options market dynamics at SpotGamma and is a Benzinga reporter.
In no way should the materials herein be construed as advice. Derivatives carry a substantial risk of loss. All content is for informational purposes only.
The daily brief is a free glimpse into the prevailing fundamental and technical drivers of U.S. equity market products. Join the 300+ that read this report daily, below!
Overnight, equity index futures took back the post-Federal Open Market Committee (FOMC) bump. Bonds and most commodity products (less gold) followed suit.
The Federal Reserve (Fed) admitted to run-away prices and committed to slaying inflation via tougher action. Accordingly, the central bank upped interest rates by 75 basis points. This was the largest increase since 1994 and, as the Fed commented, another 75 basis point hike may be in store at the next meeting in July.
In other news, the Celsius Network (CRYPTO: CEL), a crypto favorite that amassed in excess of $20 billion in assets, froze withdrawals to stop what some say was a potential bank run. Private equity is facing a so-called “crisis of value” given over inflated prices in that market.
We shall unpack the latter, below, a bit.
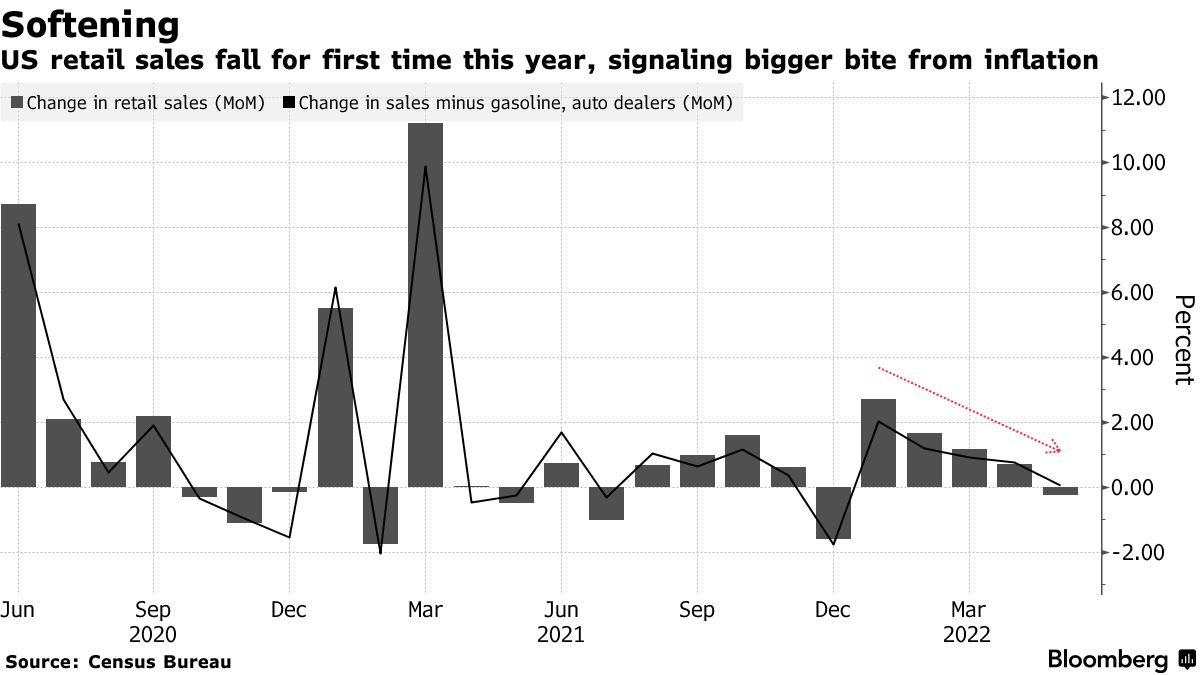
Also, U.S. retail sales posted their first drop in five months, the Bank of England raised its rates along with the Swiss central bank which surprised with its first hike since 2007.
This is all the while Goldman Sachs Group Inc’s (NYSE: GS) buyback desk was flooded with volumes about 3 times last year’s daily average. This could be construed as companies viewing the latest selloff as an “opportunity to repurchase shares rather than retrenching.”
Ahead is data on jobless claims, building permits, housing starts, as well as the Philadelphia Fed’s manufacturing index (8:30 AM ET).
Graphic updated 6:30 AM ET. Sentiment Risk-Off if expected /ES open is below the prior day’s range. /ES levels are derived from the profile graphic at the bottom of the following section. Levels may have changed since initially quoted; click here for the latest levels. SqueezeMetrics Dark Pool Index (DIX) and Gamma (GEX) calculations are based on where the prior day’s reading falls with respect to the MAX and MIN of all occurrences available. A higher DIX is bullish. At the same time, the lower the GEX, the more (expected) volatility. Learn the implications of volatility, direction, and moneyness. SHIFT data used for S&P 500 (INDEX: SPX) options activity. Note that options flow is sorted by the call premium spent; if more positive, then more was spent on call options. Breadth reflects a reading of the prior day’s NYSE Advance/Decline indicator. VIX reflects a current reading of the CBOE Volatility Index (INDEX: VIX) from 0-100.
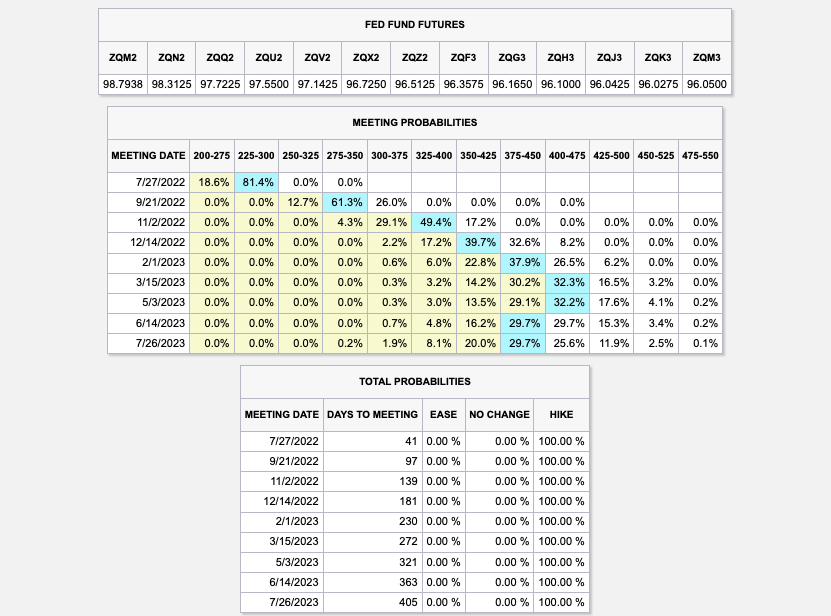
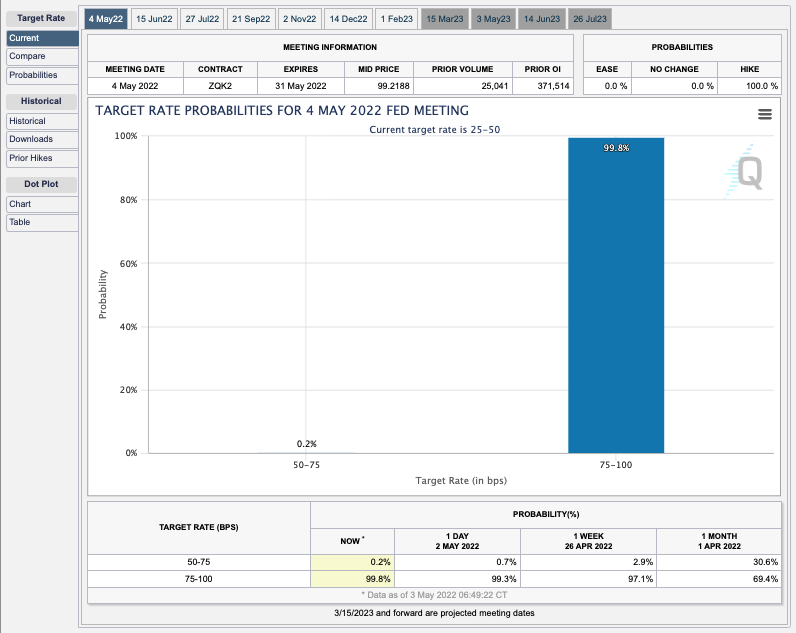
Now, it appears the rate will surpass 3% after the FOMC affirmed its commitment “to returning inflation to its 2% objective.” Participants reacted, pricing in the potential for a rate peak in the range of 4.00-4.75% early-to-mid 2023, after which the easing cycle is to likely take place.
Graphic: Via CME Group Inc’s (NASDAQ: CME) FedWatch Tool.
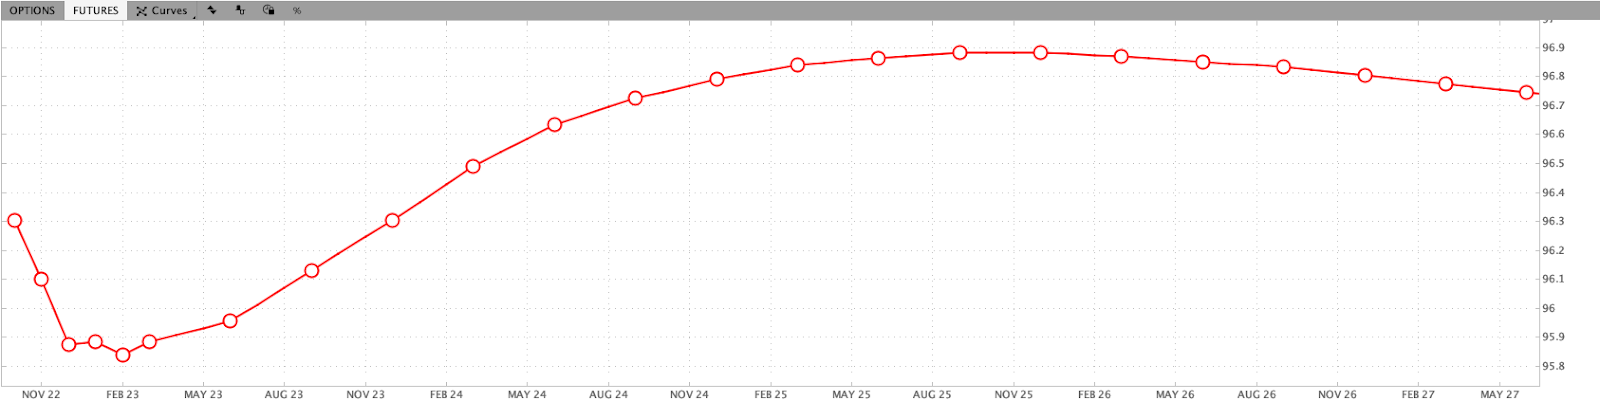
The overnight rate is expected to peak near 4.23% by mid-2023. This is a given via a quick check of the Eurodollar (FUTURE: /GE) futures curve, a reflection of participants’ outlook on interest rates. The peak of the Fed-rate-hike cycle – terminal rate – is around March 2023 (previously it was June).
For context, the price of /GE reflects the interest offered on U.S. dollar-denominated deposits at banks outside of the U.S. With that, they’re “expressed numerically using 100 minus the implied 3-month U.S. dollar LIBOR interest rate,” per Investopedia. This means that at current March 2023 prices (95.775), this reflects an implied interest rate settlement rate of 4.225%.
As stated in this morning’s introduction (above), these policy adjustments are inflicting damage on some inflated areas of the market like crypto and private equity.
Recall that prevailing monetary policies made it easier to borrow and make longer-duration bets on ideas with a lot of promise in the future. Central banks, too, underwrote losses of this regime and encouraged continued growth. This had consequences on the real economy and asset prices which rose and kept deflationary pressures at bay.
Credit default swaps seem to be corroborating Jamie’s “hurricane” and Elon’s “super bad feeling” about the economy. As measured by Markit, they have nearly doubled this year, surpassing their Q4’18 highs and heading toward COVID-crisis levels, a deflationary signal.
As well put forth in our May 18, 2022 commentary, the recent market rout is a recession and the direct reflection of the unwind of carry. Capital was “misallocated” and the Fed’s move to control price stability is “completely unreasonable” as they’re not in a position to do it “without bringing down the markets,” per Kai Volatility’s Cem Karsan.
As Lyn Alden of Lyn Alden Investment Strategy put forth, “unfortunately for the Fed, the U.S. economic growth rate is already decelerating” and, to cut inflation, it must reduce demand for goods. Indeed, this is recessionary and is already reflected by slowing retail sales.
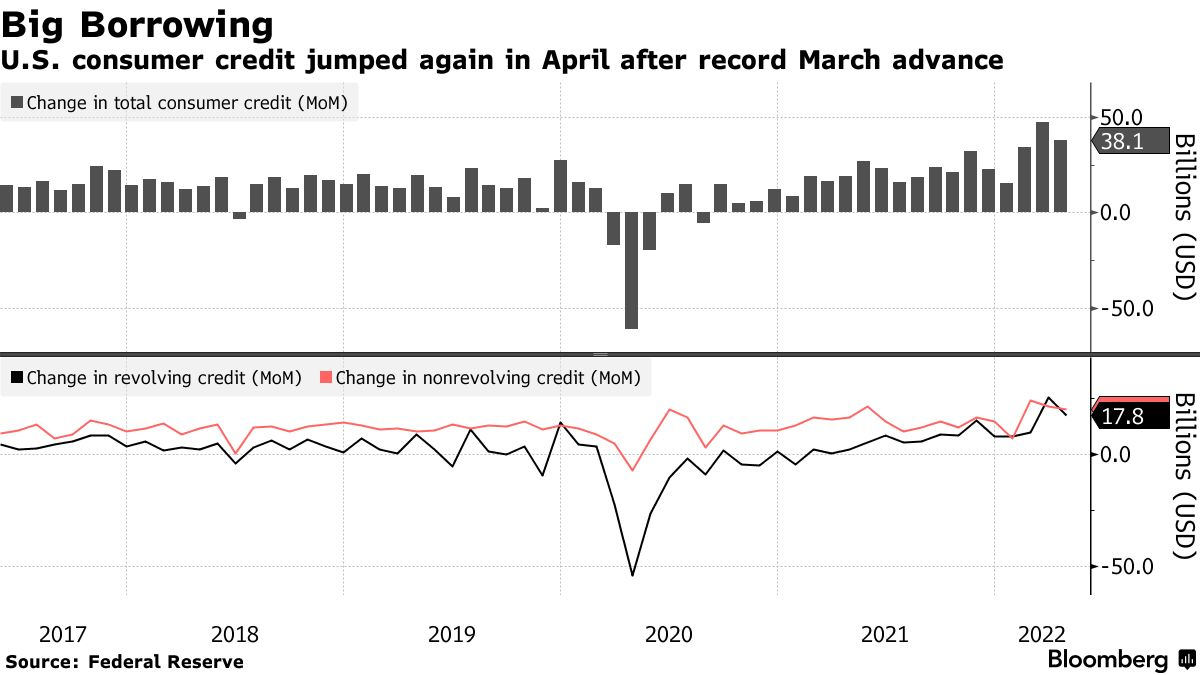
Graphic: Via Bloomberg. “As price pressures become more entrenched in the economy, spending will likely ebb either due to higher prices, higher interest rates, or both.”
As Bloomberg explains, spending has shifted and is supported by consumers spending down their savings and leveraging credit cards.
Graphic: Via Bloomberg. This “could be concerning if Americans fail to keep up on payments. That could ultimately mean a slowdown in the pace of inflation-adjusted consumption.”
“If this credit bubble ever pops, it’s going to be the most catastrophic market failure that anyone has ever read about — but let’s hope that doesn’t happen,” Mark Spitznagel, Miami-based Universa’s CIO, said in early June. “We’ve gotten ourselves into a tough spot.”
Perspectives: “The move in markets prices in more than enough recession risk, and we believe a near-term recession will ultimately be avoided thanks to consumer strength, Covid reopening/recovery, and policy stimulus in China,” JPMorgan Chase & Co’s (NYSE: JPM) Marko Kolanovic and his team said.
Positioning: Measures of implied volatility had come in, yesterday, and that was significant in that participants have a lot of exposure to put options.
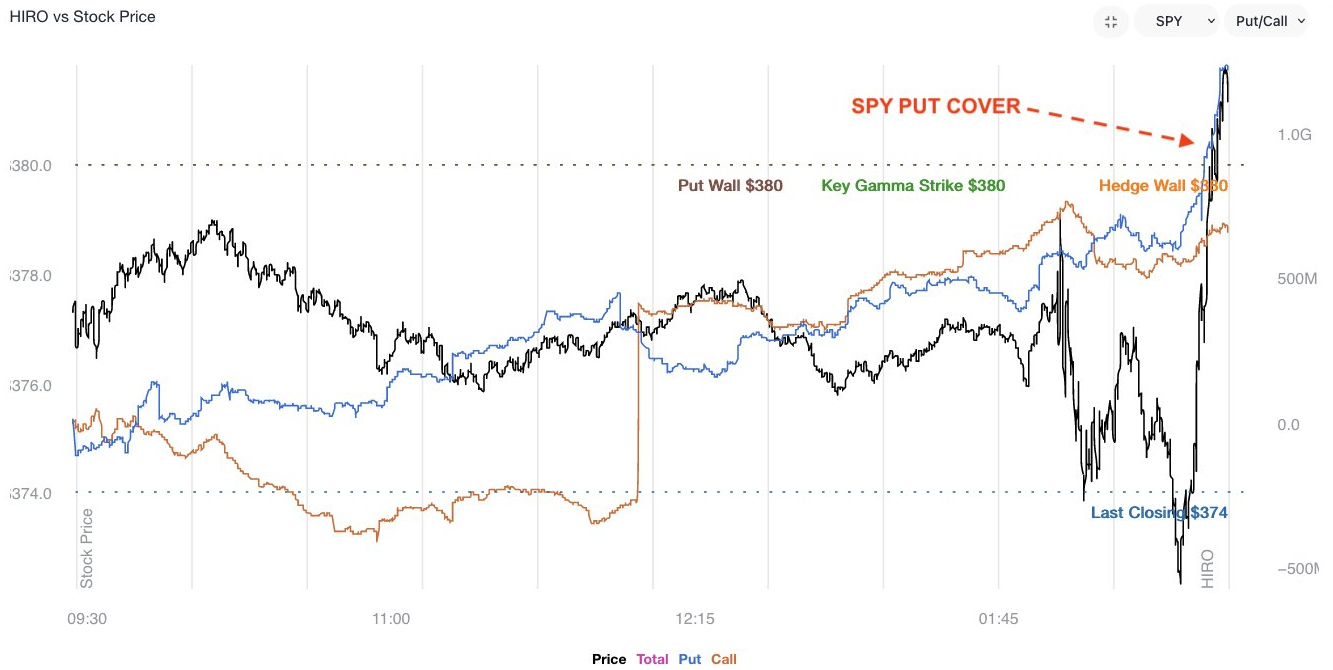
Graphic: Via SpotGamma’s Hedging Impact of Real-Time Options (HIRO) indicator.
Further, (naively) we see it as liquidity providers being short those puts. As volatility continues to come in, the exposure of those options to direction (delta) compresses.
As a result, liquidity providers cut some of their negative (static) delta hedges to that positive delta put position.
Graphic: Via SpotGamma. “SPX prices X-axis. Option delta Y-axis. When the factors of implied volatility and time change, hedging ratios change. For instance, if SPX is at $4,700.00 and IV jumps 15% (all else equal), the dealer may sell an additional 0.2 deltas to hedge their exposure to the addition of a positive 0.2 delta. The graphic is for illustrational purposes, only.”
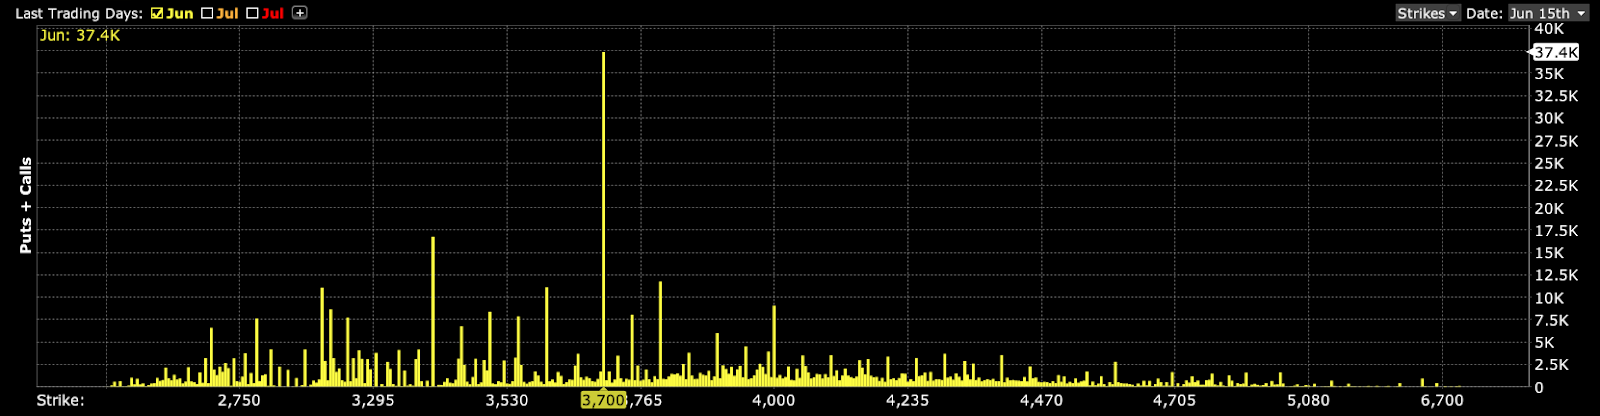
This means that the potential options expiration (OPEX) related bullishness, so to speak, was pulled forward and, now, markets, being markedly lower than they were immediately after the FOMC event, are at risk of trading into (and below) the sizeable interest down below.
Graphic: Taken by Physik Invest from Interactive Brokers Group Inc (NASDAQ: IBKR). Updated 6/15/2022.
As stated, yesterday, these options, down below, have little time to expiry and, thus, their gamma (options sensitivity to direction) grows rather large, at near-the-money strikes.
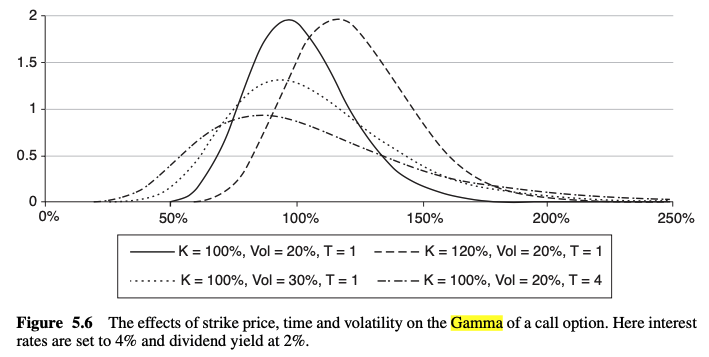
Graphic: Text taken from Exotic Options and Hybrids: A Guide to Structuring, Pricing and Trading.
As the time to expiry narrows, above the strike in question delta decays, and counterparts buy back their static delta hedges.
As the time to expiry narrows, below the strike in question delta expands and counterparts sell more static delta to hedge.
Graphic: Text taken from Exotic Options and Hybrids: A Guide to Structuring, Pricing and Trading.
This means that if below these high-interest strikes, associated hedging, less any new reach for protection would pressure markets lower. If above, hedging, less new sales of protection, would bolster markets higher.
Ultimately, if lower, all else equal, the June 17 OPEX will coincide with the removal of the in-the-money options exposures in question. This opens a window during which markets may have less pressure to rally against.
Bonus: As SpotGamma explains, “[g]iven the supply and demand of volatility, as well as divergences in the volatility that the market realizes and implies from options activity, there’s a case to be made for maintaining positive exposure to direction via long volatility.”
Graphic: Taken by Physik Invest from Interactive Brokers Group Inc (NASDAQ: IBKR). The divergence in volatility implied (IVOL) by participants’ options activity, versus that which the market realizes (RVOL) resurfaced on June 15, 2022, in the Nasdaq 100 (INDEX: NDX).
Technical: As of 6:30 AM ET, Thursday’s regular session (9:30 AM – 4:00 PM ET), in the S&P 500, will likely open in the lower part of a negatively skewed overnight inventory, outside of prior-range and -value, suggesting a potential for immediate directional opportunity.
In the best case, the S&P 500 trades higher; activity above the $3,688.75 HVNode puts in play the $3,727.75 HVNode. Initiative trade beyond the $3,727.75 HVNode could reach as high as the $3,773.25 HVNode and $3,808.50 HVNode, or higher.
In the worst case, the S&P 500 trades lower; activity below the $3,688.75 HVNode puts in play the $3,664.25 HVNode. Initiative trade beyond the $3,664.25 HVNode could reach as low as the $3,610.75 HVNode and $3,587.25 LVNode, or lower.
Click here to load today’s key levels into the web-based TradingView charting platform. Note that all levels are derived using the 65-minute timeframe. New links are produced, daily.
Graphic: 65-minute profile chart of the Micro E-mini S&P 500 Futures.
Should the market trend for long periods of time, it will lack sound structure, identified as low volume areas (LVNodes). LVNodes denote directional conviction and ought to offer support on any test.
If participants were to auction and find acceptance into areas of prior low volume (LVNodes), then future discovery ought to be volatile and quick as participants look to HVNodes for favorable entry or exit.
About
After years of self-education, strategy development, mentorship, and trial-and-error, Renato Leonard Capelj began trading full-time and founded Physik Invest to detail his methods, research, and performance in the markets.
Capelj also develops insights around impactful options market dynamics at SpotGamma and is a Benzinga reporter.
In no way should the materials herein be construed as advice. Derivatives carry a substantial risk of loss. All content is for informational purposes only.
The daily brief is a free glimpse into the prevailing fundamental and technical drivers of U.S. equity market products. Join the 300+ that read this report daily, below!
Overnight, equity indices auctioned lower alongside commodities and bonds. The Cboe Volatility Index (INDEX: VIX) caught a bid ahead of its large expiration this morning.
Fundamentally, the context is the same. To note, Federal Reserve Chair Jerome Powell was at a conference, yesterday, and said the central bank would continue raising rates until there is evidence that inflation is in retreat.
Until that evidence appears, the Fed could move “more aggressively.” That was hawkish.
Today we receive updates on building permits and housing starts (8:30 AM ET). Later, Philadelphia Fed President Patrick Harker speaks (4:00 PM ET).
Graphic updated 6:45 AM ET. Sentiment Neutral if expected /ES open is inside of the prior day’s range. /ES levels are derived from the profile graphic at the bottom of the following section. Levels may have changed since initially quoted; click here for the latest levels. SqueezeMetrics Dark Pool Index (DIX) and Gamma (GEX) calculations are based on where the prior day’s reading falls with respect to the MAX and MIN of all occurrences available. A higher DIX is bullish. At the same time, the lower the GEX, the more (expected) volatility. Learn the implications of volatility, direction, and moneyness. SHIFT data used for S&P 500 (INDEX: SPX) options activity. Note that options flow is sorted by the call premium spent; if more positive, then more was spent on call options. Breadth reflects a reading of the prior day’s NYSE Advance/Decline indicator. VIX reflects a current reading of the CBOE Volatility Index (INDEX: VIX) from 0-100.
What To Expect
Fundamental: If you have not already, check out Tuesday’s letter which discussed, in-depth, some of the implications of changing monetary policies, and their impact on markets.
Today’s letter will add to our narrative.
Over the course of a month or so, markets traded marginally lower while research houses have upped their calls for a slowing in the economy or, even, the prospect of a global recession.
So, in the span of a month, the tone changed to “[w]e’re on the brink of global recession.”
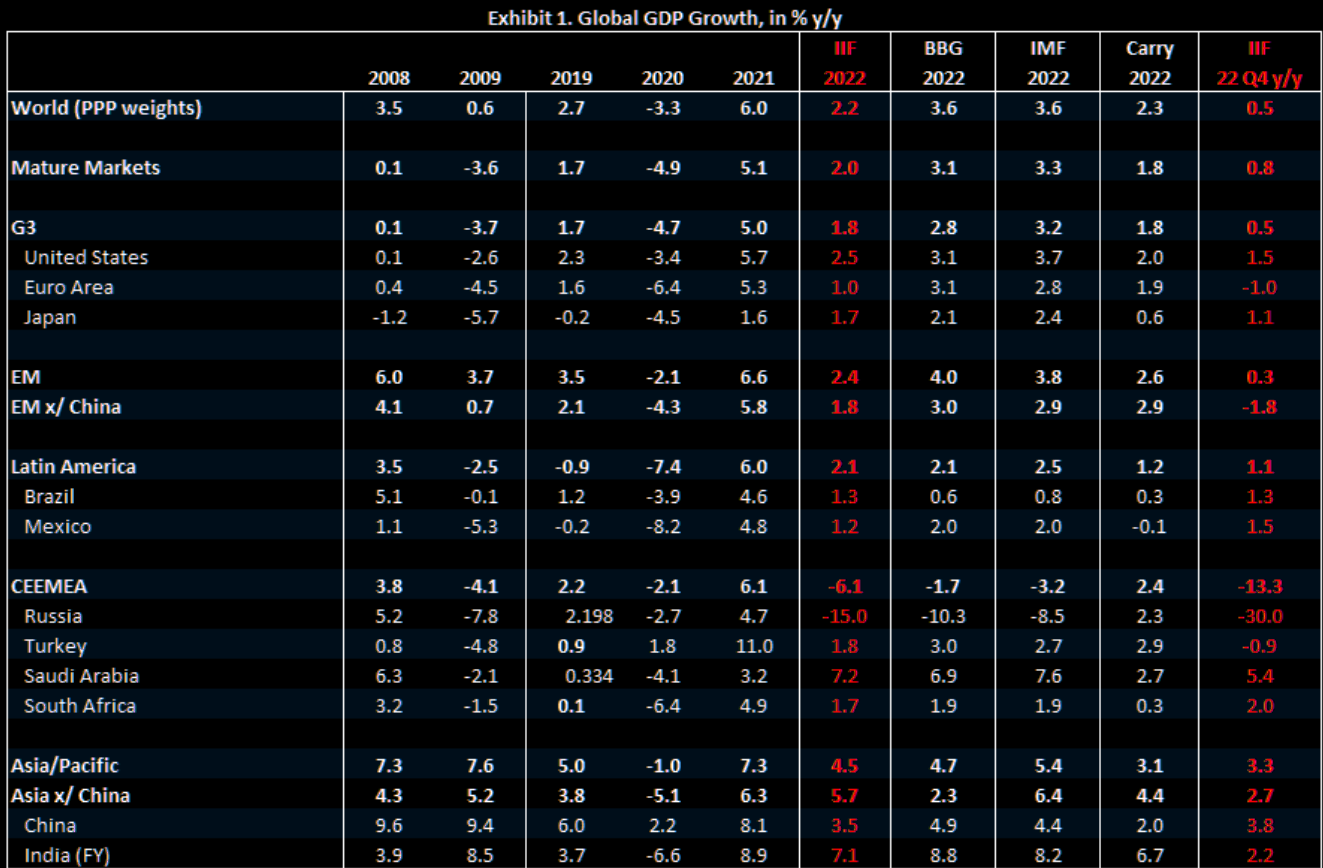
Graphic: Via Robin Brooks. Taken from The Market Ear. “Global GDP is flatlining.”
Let’s try to work through some narrative and theory, here.
On March 31, 2022, we unpacked what carry trades are (i.e., the act of borrowing at low rates and investing where there are higher rates to make money so long as nothing [bad] happens), and the implications of their unwind.
Such strategies are characterized by a sawtooth wave returns pattern (i.e., steady positive returns followed by sharp drops).
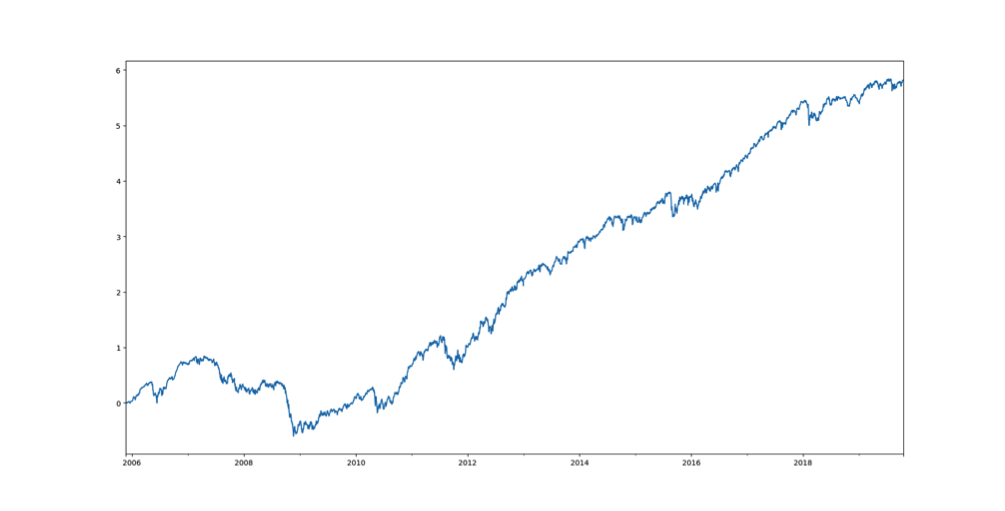
Graphic: Via Risky Finance. “Cumulative log returns from shorting the VIX future, a common carry strategy. Notice the poor returns in 2008 and other market crises.”
A great book on this – “The Rise of Carry: The Dangerous Consequences of Volatility Suppression and the New Financial Order of Decay Growth and Recurring Crisis – discusses many of the different forms of carry, their attractiveness, and the implications of their failure.
Further discussed is global monetary policy feeding into the growth and the reinforcement of carry, which has become embedded (or a core force of financial conditions).
Let’s elaborate.
Carry trades often involve leverage and, to avoid losses, these strategies force traders to close positions when positions move against them, buying strength and selling weakness.
By that token, expansion of carry plays into increased liquidity, which is related to the ease with which credit is obtained and available in the economy, a driver of economic growth and what we talked about yesterday – Planet Palo Alto – over recent business cycles.
Moreover, over the last four decades, monetary policy was a go-to for supporting the economy. Money was sent to capital and that promoted innovation and, by that token, deflation, ultimately creating “a disinterest and unimportance to cash flows.”
In other words, prevailing monetary policies made it easier to borrow and make longer duration bets on ideas with a lot of promise in the future. Central banks underwrote losses of this regime (e.g., post-1998 easing after widening of credit spreads), encouraging continued growth (and innovation).
Now, there’s a strong commitment to reducing liquidity and credit.
This has consequences on the real economy and asset prices, accordingly, which rose and kept deflationary pressures at bay.
What we’re getting to basically is the distinction between the economy and financial markets.
This distinction has blurred.
As the book explains, U.S. market liquidity, as well as the U.S. dollar’s role as a global reserve currency, makes the U.S. markets and S&P 500 at the center of the global carry regime.
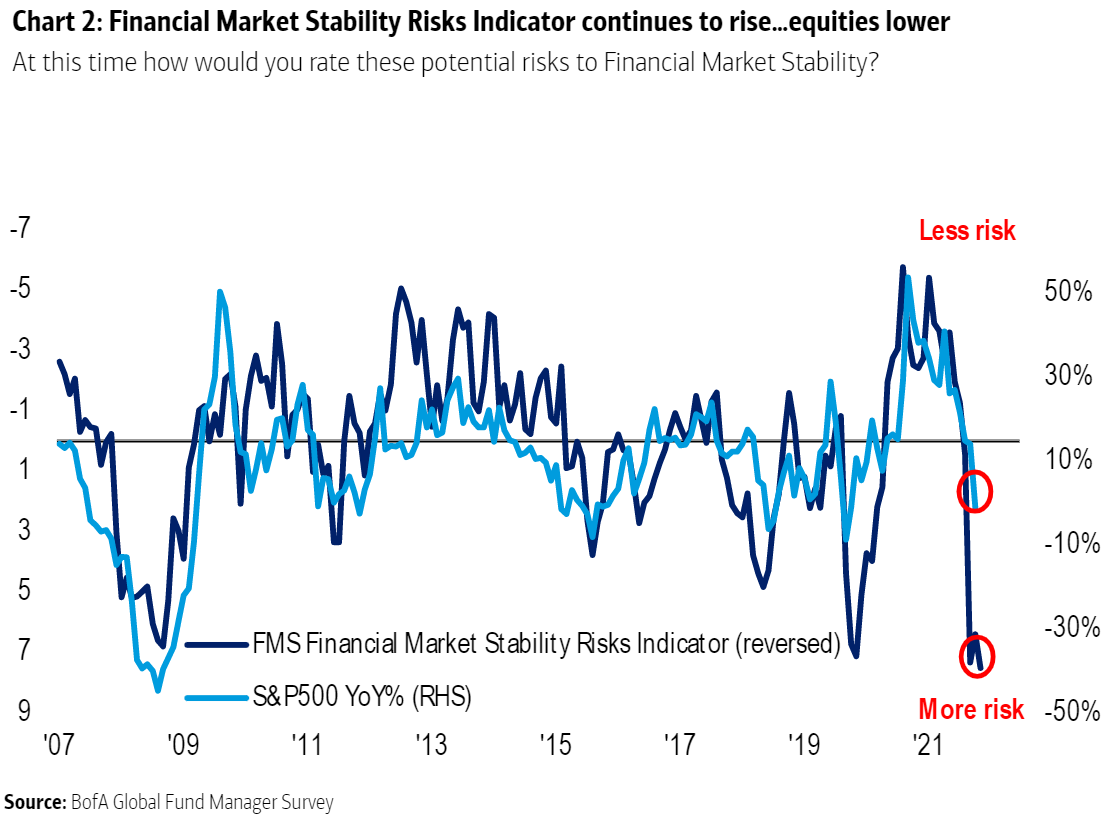
A stock market drop is both a recession and a direct reflection of the unwind of carry. It is the manifestation of a deflationary shock, and today’s sentiment reflects this.
Graphic: Via Bloomberg. “[M]ore fund managers are worried about systemic financial risks than at any previous time in the survey’s history — which stretches back to before the GFC.”
So, what?
Yesterday, we quoted Elon Musk saying the U.S. was facing a tough recession. This is on the heels of a large “misallocation of capital,” he says, by the government printing “a zillion amount of more money than it had,” which ultimately played into price instabilities we’re seeing today.
“The Fed has a mandate, which is completely unreasonable — to control price stability,” Kai Volatility’s Cem Karsan explains.
“With supply-side economics, the only way that they can control this ultimately is to pull back. And slow capital markets decrease via the wealth effect. Ultimately, there’s a significant lag, so they are not in a position to ultimately control inflation without bringing down markets.”
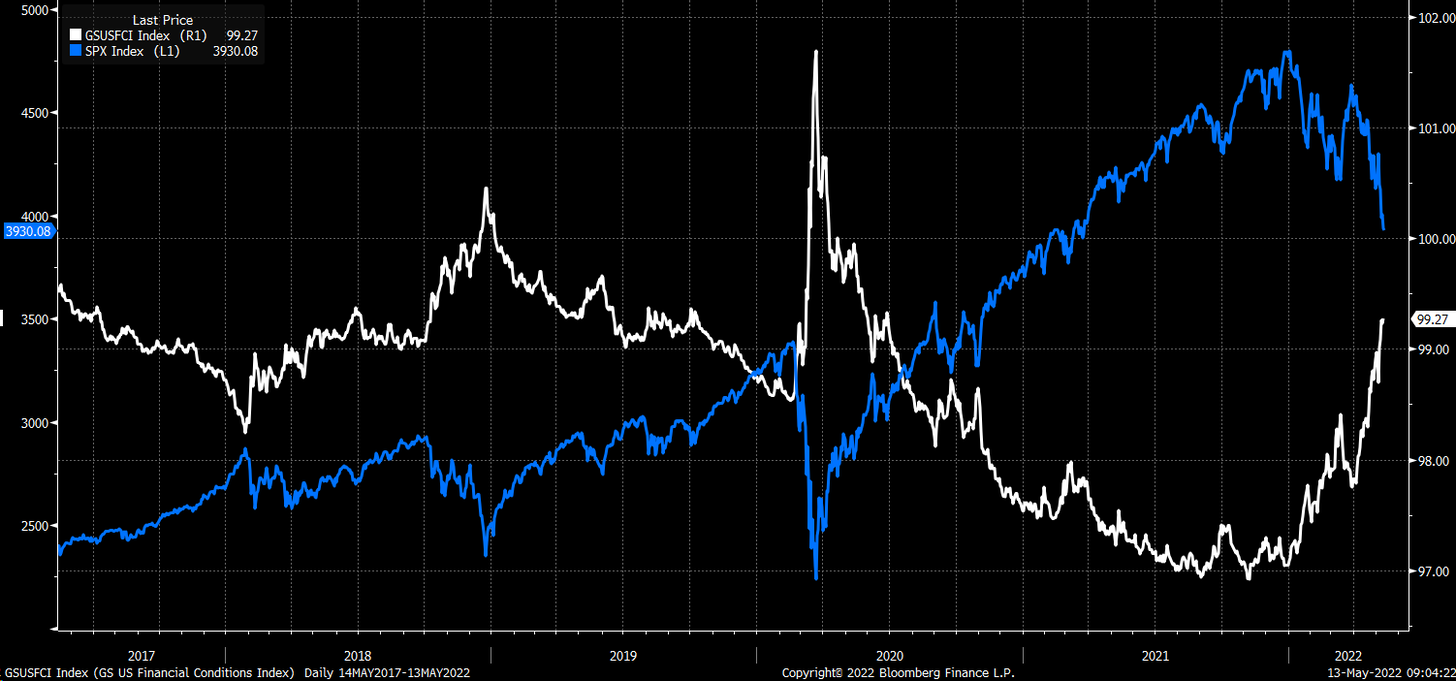
Graphic: Via Bloomberg. Taken from the Weekly S&P 500 ChartStorm. “Financial conditions are rapidly and drastically tightening (= bad [for] stocks).”
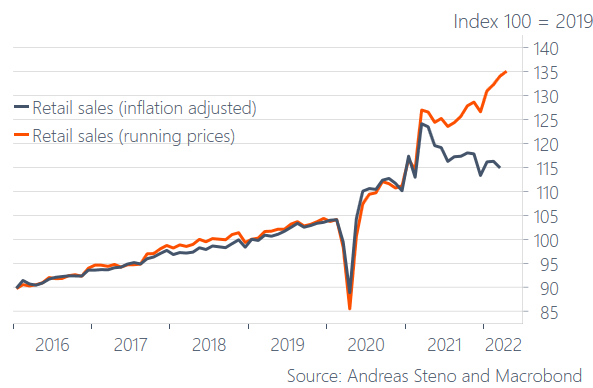
“Unfortunately for the Fed, the U.S. economic growth rate is already decelerating,” Lyn Alden of Lyn Alden Investment Strategy adds. To cut inflation, the Fed must reduce demand for goods, and this is recessionary (just as “Walmart Inc [NYSE: WMT] and Target Corporation [NYSE: TGT] are feeling the effect of the stretched consumer,” per Bloomberg).
Graphic: Via Andreas Steno Larsen. “Demand destruction in one chart. Retail sales before and after inflation adjustments.”
Positioning: Participants legged into protective put options.
As talked about before, with this stretched positioning, liquidity providers had a lot of synthetic exposure to the upside (positive delta) and asymmetric losses to the downside (negative gamma). To hedge, underlyings were sold.
Graphic: Via SpotGamma. Total call delta to put delta for all expirations. Participants are concentrated in puts.
As markets rise, and that particular options exposure decays, the pressure these liquidity providers must add, softens. That’s what we’ve been seeing over the past few sessions.
Graphic: Via SpotGamma’s Hedging Impact of Real-Time Options (HIRO) indicator for the SPDR S&P 500 ETF Trust (NYSE: SPY) reveals strong put selling and light call selling. This plays into a reduction in the liquidity providers’ negative gamma exposure and is a positive.
If participants were to continue trading in this manner, that may offer markets additional support. Notwithstanding, this activity likely does little to disrupt the balance of trade heading into and around the May 2022 options expiration (OPEX).
Into that event, we expect delta hedging flows with respect to changes in time (charm), mainly, and volatility (vanna) to provide an added boost. However, with volatility coming in from lower levels, SpotGamma says, there’s not as much “stored energy to catalyze a rally.”
Instead, SpotGamma adds, “[o]ur fear, here, is that, fundamentally, markets are weak and the May OPEX opens the door for lower lows as some of the ‘max put’ positioning is cleared and markets succumb to the remaining negative gamma positioning.”
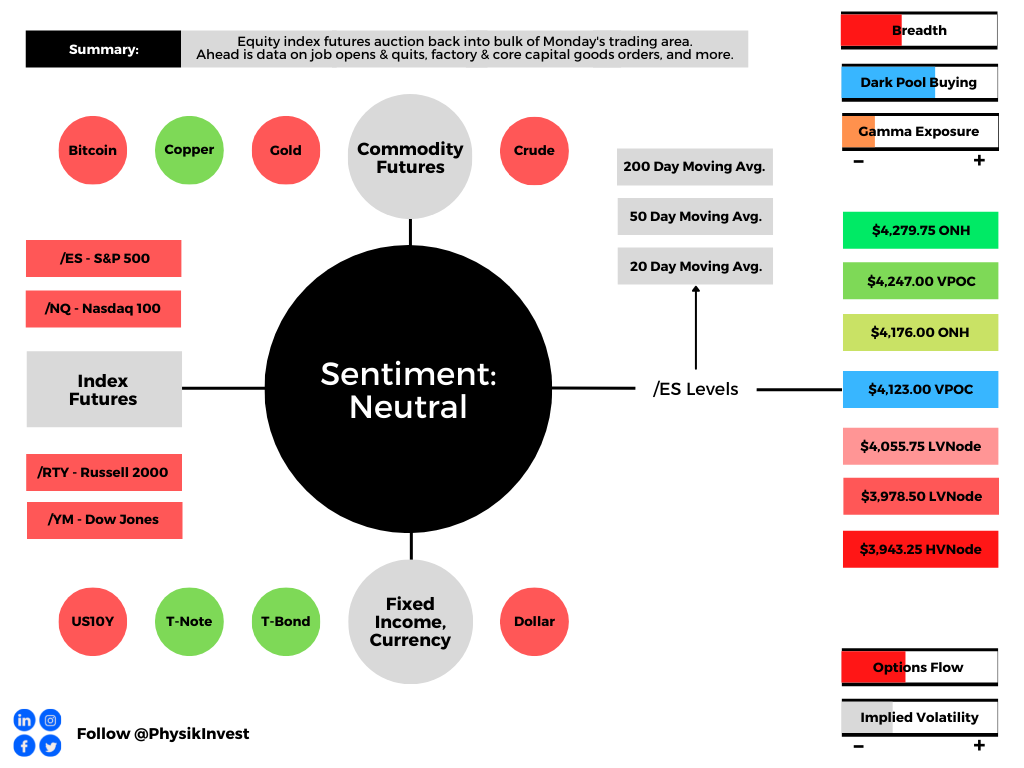
Technical: As of 6:30 AM ET, Wednesday’s regular session (9:30 AM – 4:00 PM ET), in the S&P 500, will likely open in the lower part of a negatively skewed overnight inventory, inside of prior-range and -value, suggesting a limited potential for immediate directional opportunity.
In the best case, the S&P 500 trades higher; activity above the $4,061.00 untested point of control (VPOC) puts in play the $4,095.00 overnight high (ONH). Initiative trade beyond the ONH could reach as high as the $4,119.00 VPOC and $4,148.25 high volume area (HVNode), or higher.
In the worst case, the S&P 500 trades lower; activity below the $4,061.00 VPOC puts in play the $4,013.25 micro composite point of control (MCPOC). Initiative trade beyond the MCPOC could reach as low as the $3,978.50 low volume area (LVNode) and $3,943.25 HVNode, or lower.
Click here to load today’s key levels into the web-based TradingView charting platform. Note that all levels are derived using the 65-minute timeframe. New links are produced, daily.
Graphic: 65-minute profile chart of the Micro E-mini S&P 500 Futures.
Definitions
Overnight Rally Highs (Lows): Typically, there is a low historical probability associated with overnight rally-highs (lows) ending the upside (downside) discovery process.
Volume Areas: A structurally sound market will build on areas of high volume (HVNodes). Should the market trend for long periods of time, it will lack sound structure, identified as low volume areas (LVNodes). LVNodes denote directional conviction and ought to offer support on any test.
If participants were to auction and find acceptance into areas of prior low volume (LVNodes), then future discovery ought to be volatile and quick as participants look to HVNodes for favorable entry or exit.
POCs: POCs are valuable as they denote areas where two-sided trade was most prevalent in a prior day session. Participants will respond to future tests of value as they offer favorable entry and exit.
MCPOCs: POCs are valuable as they denote areas where two-sided trade was most prevalent over numerous day sessions. Participants will respond to future tests of value as they offer favorable entry and exit.
About
After years of self-education, strategy development, mentorship, and trial-and-error, Renato Leonard Capelj began trading full-time and founded Physik Invest to detail his methods, research, and performance in the markets.
Capelj also develops insights around impactful options market dynamics at SpotGamma and is a Benzinga reporter.
In no way should the materials herein be construed as advice. Derivatives carry a substantial risk of loss. All content is for informational purposes only.
The Daily Brief is a free glimpse into the prevailing fundamental and technical drivers of U.S. equity market products. Join the 200+ that read this report daily, below!
Overnight, equity index futures auctioned sideways to higher, inside of the prior day’s range. Most other commodity and bond futures were bid while implied volatility metrics came in a bit.
Notable was the depth and breadth of Monday’s decline. Though the indexes were tame, some of which is attributable to suppressive hedging, single stocks expanded their ranges, greatly, to the downside, and this points to potential capitulation.
On the news front, a U.S. central bank report found that “the risk of a sudden significant deterioration [in liquidity] appears higher than normal” and stablecoin use to meet margin requirements in crypto trades makes them “vulnerable to runs.”
This is just as some algorithmic stablecoins have lost their peg (e.g., UST/USD ~$0.60).
Additionally, the report found elevated inflation, as well as the reaction to that “could negatively affect domestic economic activity, asset prices, credit quality, and financial conditions.”
Ahead is data on real household debt (11:00 AM ET).
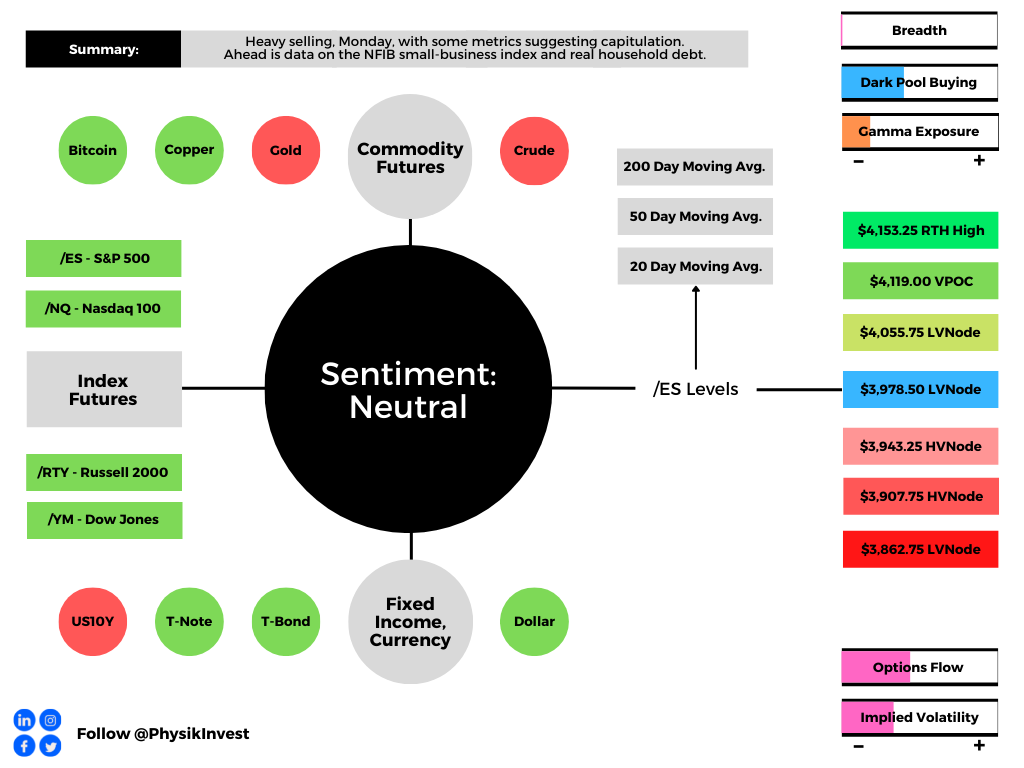
Graphic updated 6:25 AM ET. Sentiment Neutral if expected /ES open is inside of the prior day’s range. /ES levels are derived from the profile graphic at the bottom of the following section. Levels may have changed since initially quoted; click here for the latest levels. SqueezeMetrics Dark Pool Index (DIX) and Gamma (GEX) calculations are based on where the prior day’s reading falls with respect to the MAX and MIN of all occurrences available. A higher DIX is bullish. At the same time, the lower the GEX, the more (expected) volatility. Learn the implications of volatility, direction, and moneyness. SHIFT data used for S&P 500 (INDEX: SPX) options activity. Note that options flow is sorted by the call premium spent; if more positive, then more was spent on call options. Breadth reflects a reading of the prior day’s NYSE Advance/Decline indicator. VIX reflects a current reading of the CBOE Volatility Index (INDEX: VIX) from 0-100.
What To Expect
Context: We continue to build out the narrative.
A market-wide drop, Monday, pointed to signs of capitulation as “small-time investors offloaded a net of about $1 billion in equities, the most aggressive selling in 14 months,” per JPMorgan Chase & Co (NYSE: JPM).
Graphic: Via @TaviCosta. “Nasdaq has already declined almost as much as it did during the March 2020 crash. Back then, the Fed was all about saving the stock market and the economy. Today, it’s all about how much more they are going to hike rates.“
Notwithstanding, the volatility divergences this letter has pointed to, in the face of pronounced realized volatility, continue.
Graphic: Via Topdown Charts. Wednesday (FOMC) price rise (right) versus Thursday (post-FOMC) liquidation.
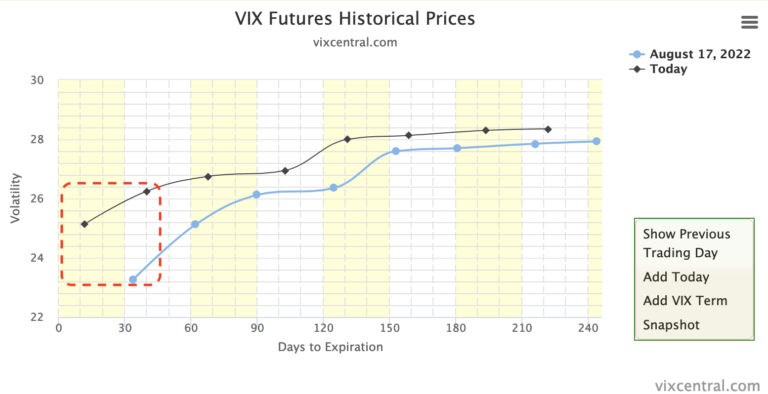
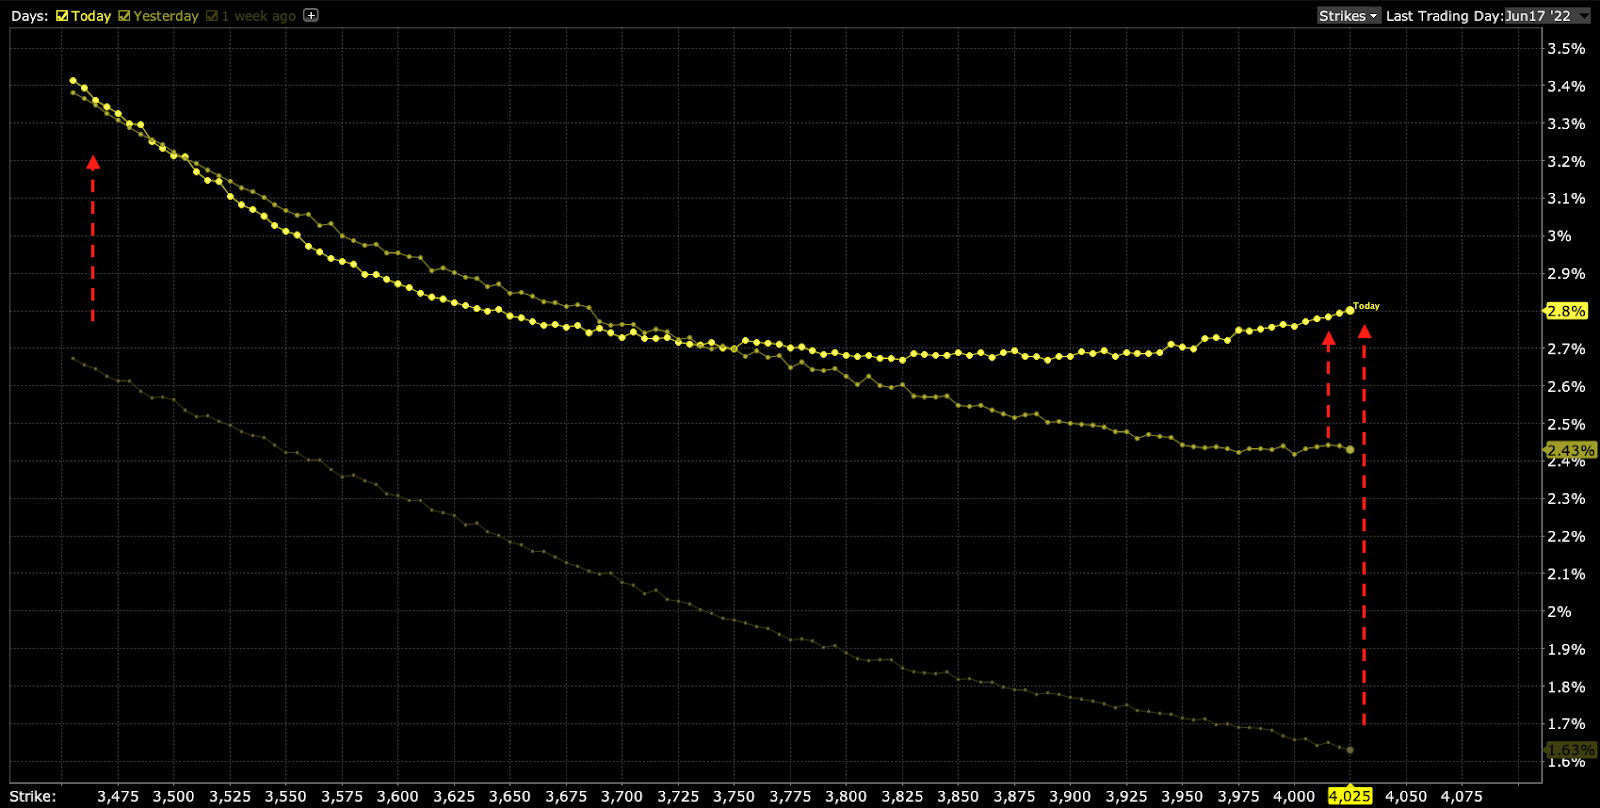
As Pat Hennessy of IPS Strategic Capital explains, at-the-money implied volatility is high and term structure is in backwardation, which are reflections of uncertainty and demand for hedges.
Graphic: Via SpotGamma. At-the-money implied volatility is backwardated given the heightened demand for shorter-dated protection, relative to that which is longer-dated.
“It’s just rare to see wingy short-dated puts like this so cheap relative to ATM.”
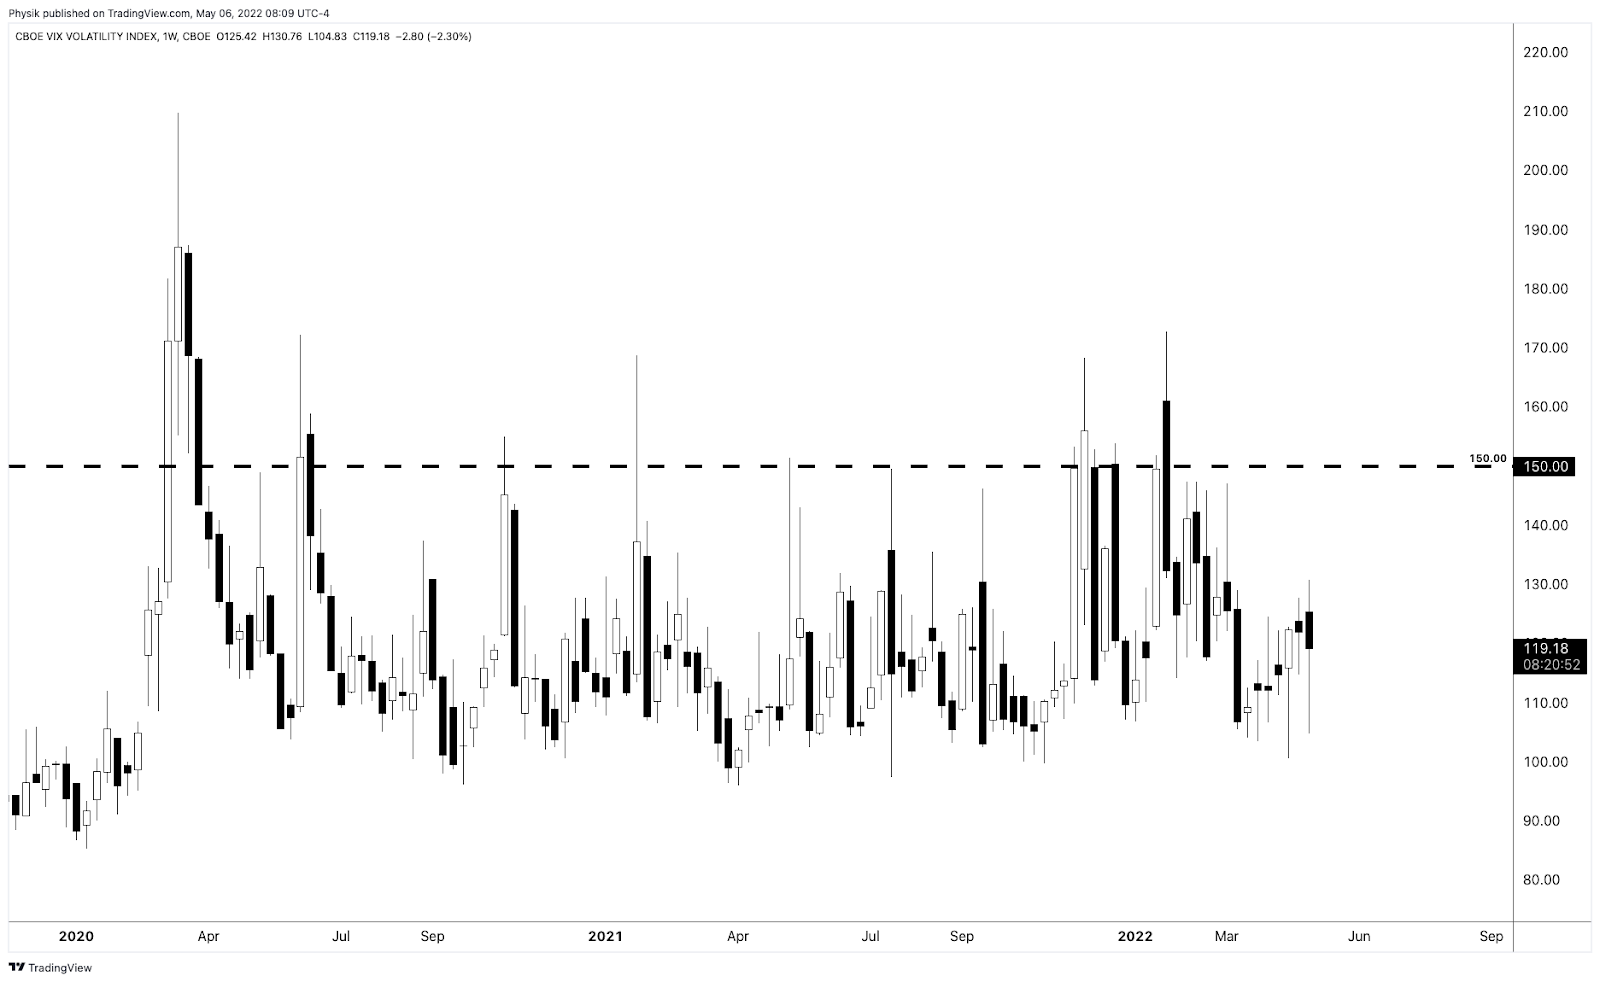
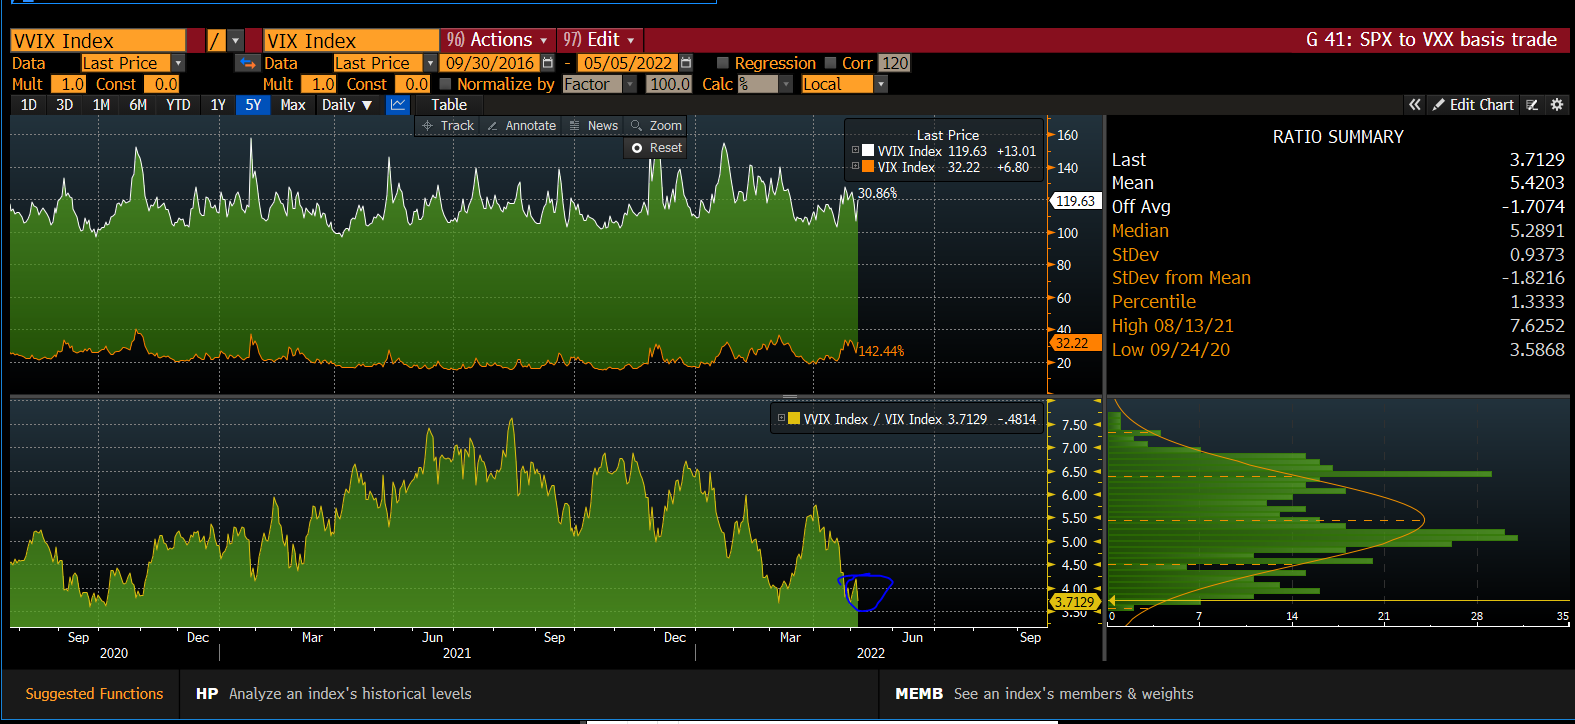
As explained in Monday’s letter (and in greater detail, Friday), a measure like the Cboe VVIX Index (INDEX: VVIX), or the volatility of volatility, has a mean below 100 and a high correlation with the Cboe Volatility Index (INDEX: VIX) during times of stress.
When realized volatility is as high as it is, today, the VVIX typically trades closer to 150.
To quote Benn Eifert of QVR Advisors: “Skew goes up if vol outperforms the skew curve a lot on a selloff.”
Graphic: Updated May 9, 2022. The VVIX via Physik Invest.
What’s going on?
There is really negative sentiment and emotion, both of which are playing into market weaknesses and realized volatility. However, that realized volatility is not priced in.
There are “plenty of put-buyers, but nearly as many sellers,” SqueezeMetrics explains.
You “don’t have to protect what you don’t own. Some investors de-grossed. Short momo (e.g., CTA) wants to bet on a bleed (a la 2000), but not on a crash. Put underwriting! No carry trades elsewhere. Sell SPX vol!”
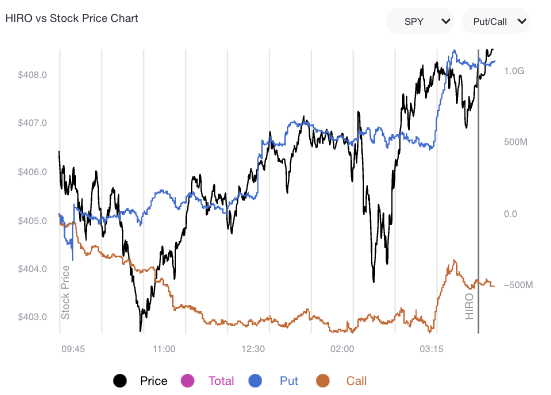
Graphic: Via SpotGamma’s Hedging Impact of Real-Time Options (HIRO) indicator, the SPDR S&P 500 ETF Trust (NYSE: SPY) was a recipient of heavy put selling and call buying on 5/9/22.
Why does this matter?
When you think there is to be an outsized move in the underlying, relative to what is priced, you buy options (positive exposure to gamma) so that you may have gains that are potentially amplified in case of directional movement.
When you think there is to be an outsized move in the implied volatility, relative to what is priced, you buy options (positive exposure to volga) so that you may have gains that are potentially amplified in case of implied volatility repricing.
So, in all, it is a question of whether the reward is worth the risk (see below “How To Play”).
Based on stretched positioning, equity markets are positioned for upside. Notwithstanding, the potential for large negative outliers, remains. In the case of an outlier, the consequent repricing of volatility may increase the reward, relative to the risk, for selling options, particularly puts.
With an S&P 500 below $4,000.00, “I would expect more of an aggressive reach for hedges … that spot- vol correlation break (weakness) would not be as present.”
“Spot- vol correlation has sucked recently, but vol relative strength should kick in.”
How I’m Playing: Borrowing from May 3’s letter, here.
Presently, the market is stretched to the downside and, as SpotGamma says, “traders are underpricing right-tail risk,” which opens the window for unique ways to play a returns distribution that continues to be skewed positive (albeit with large negative outliers).
This letter’s author is concentrated on zero- and low-cost bets ($0.00-$1.00 debit to open) that deliver asymmetric payouts (sometimes in excess of $10.00 credit to close) in case of violent and short-lived reversals.
This letter’s author is structured positive delta and gamma in the Nasdaq 100 (INDEX: NDX) via ratios spread (1×2) and butterfly (1x2x1) structures.
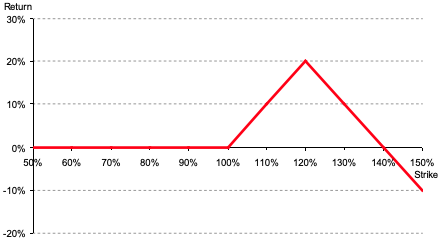
Graphic: Via Banco Santander SA (NYSE: SAN) research, the return profile, at expiry, of a classic 1×2 (long 1, short 2 further away) ratio spread.
The concern with these strategies is the width and time to expiry. Should either of those be wrong, then spreads initially positive gamma turn negative, meaning losses are amplified.
For instance, in the Nasdaq 100, to put in short, 500-1000 points wide ratio spreads (buy the closer leg, sell two of the farther legs) expiring in ten to fifteen days work well.
For those spreads that are not zero cost, debits can be offset with credit sales (on the put side) in products that have shown relative strength like the S&P 500 (INDEX: SPX). This, inherently, carries more risk, and, as explained, the risk has yet to meet the reward.
Read more about these strategies, here. The above is NOT a trade recommendation or advice.
Technical: As of 6:30 AM ET, Tuesday’s regular session (9:30 AM – 4:00 PM ET), in the S&P 500, will likely open in the middle part of a balanced overnight inventory, inside of prior-range and -value, suggesting a limited potential for immediate directional opportunity.
In the best case, the S&P 500 trades higher; activity above the $3,978.50 low volume area (LVNode/gap boundary) puts in play the $4,055.75 LVNode/gap boundary. Initiative trade beyond the $4,055.75 could reach as high as the $4,119.00 untested point of control (VPOC) and $4,153.25 regular trade high (RTH High), or higher.
In the worst case, the S&P 500 trades lower; activity below the $3,978.50 LVNode/gap boundary puts in play the $3,943.25 high volume area (HVNode). Initiative trade beyond the $3,943.25 could reach as low as the $3,907.75 HVNode and $3,862.75 LVNode, or lower.
Click here to load today’s key levels into the web-based TradingView charting platform. Note that all levels are derived using the 65-minute timeframe. New links are produced, daily.
Graphic: 65-minute profile chart of the Micro E-mini S&P 500 Futures.
Definitions
Cave-Fill Process: Widened the area deemed favorable to transact at by an increased share of participants. This is a good development.
Volume Areas: A structurally sound market will build on areas of high volume (HVNodes). Should the market trend for long periods of time, it will lack sound structure, identified as low volume areas (LVNodes). LVNodes denote directional conviction and ought to offer support on any test.
If participants were to auction and find acceptance into areas of prior low volume (LVNodes), then future discovery ought to be volatile and quick as participants look to HVNodes for favorable entry or exit.
Gamma: Gamma is the sensitivity of an option to changes in the underlying price.
Vanna: The rate at which the delta of an option changes with respect to volatility.
Charm: The rate at which the delta of an option changes with respect to time.
Options: If an option buyer was short (long) stock, he or she would buy a call (put) to hedge upside (downside) exposure. Option buyers can also use options as an efficient way to gain directional exposure.
POCs: POCs are valuable as they denote areas where two-sided trade was most prevalent in a prior day session. Participants will respond to future tests of value as they offer favorable entry and exit.
MCPOCs: POCs are valuable as they denote areas where two-sided trade was most prevalent over numerous day sessions. Participants will respond to future tests of value as they offer favorable entry and exit.
Options Expiration (OPEX): Reduction of dealer gamma exposure.
Volume-Weighted Average Prices (VWAPs): A metric highly regarded by chief investment officers, among other participants, for quality of trade. Additionally, liquidity algorithms are benchmarked and programmed to buy and sell around VWAPs.
About
After years of self-education, strategy development, mentorship, and trial-and-error, Renato Leonard Capelj began trading full-time and founded Physik Invest to detail his methods, research, and performance in the markets.
Capelj also develops insights around impactful options market dynamics at SpotGamma and is a Benzinga reporter.
In no way should the materials herein be construed as advice. Derivatives carry a substantial risk of loss. All content is for informational purposes only.
The Daily Brief is a free glimpse into the prevailing fundamental and technical drivers of U.S. equity market products. Join the 200+ that read this report daily, below!
Overnight, equity index futures auctioned weak, inside of the prior day’s large trading range.
Yesterday, the equity indexes, bonds, and crypto (which many saw as a hedge against equities) were sold, aggressively. The selling came one day after the Federal Reserve hiked 0.50 basis points and outlined its balance sheet reduction timeline.
Notable was ten-year Treasury yields breaking the 3.00% barrier.
Despite a more dovish tone (i.e., Fed assuaging participants of a 0.75 basis point hike in the coming meetings), the near-vertical price rise (which we discussed was a function of “structural buyback” in yesterday’s morning letter) was taken back in a fire sale across all sectors.
Today is data on nonfarm payrolls, unemployment rates, average hourly earnings, and labor force participation (8:30 AM ET). Later, consumer credit data is released (3:00 PM ET).
Speaking today is the Fed’s John Williams (9:15 AM ET), Raphael Bostic (3:20 PM ET), James Bullard and Chris Waller (7:15 PM ET), as well as Mary Daly (8:00 PM ET).
Graphic updated 6:45 AM ET. Sentiment Neutral if expected /ES open is inside of the prior day’s range. /ES levels are derived from the profile graphic at the bottom of the following section. Levels may have changed since initially quoted; click here for the latest levels. SqueezeMetrics Dark Pool Index (DIX) and Gamma (GEX) calculations are based on where the prior day’s reading falls with respect to the MAX and MIN of all occurrences available. A higher DIX is bullish. At the same time, the lower the GEX, the more (expected) volatility. Learn the implications of volatility, direction, and moneyness. SHIFT data used for S&P 500 (INDEX: SPX) options activity. Note that options flow is sorted by the call premium spent; if more positive, then more was spent on call options. Breadth reflects a reading of the prior day’s NYSE Advance/Decline indicator. VIX reflects a current reading of the CBOE Volatility Index (INDEX: VIX) from 0-100.
What To Expect
Positioning: In yesterday’s detailed letter, we talked about the implications of participants’ hedging heading into and after the Federal Open Market Committee (FOMC) event.
Mainly, markets were stretched and participants were demanding protection in size. As said:
“Barring a worst-case scenario, if markets do not perform to the downside (i.e., do not trade lower), those highly-priced (often very short-dated) bets on direction will quickly decay, and hedging flows with respect to time and volatility may bolster sharp rallies.”
After that “structural buyback,” as Kai Volatility’s Cem Karsan explained clearly, it was highly likely the bear trend would hold. Participants not shifting their bets on direction (via options) to higher prices, further out in time, further suggested very little change in sentiment.
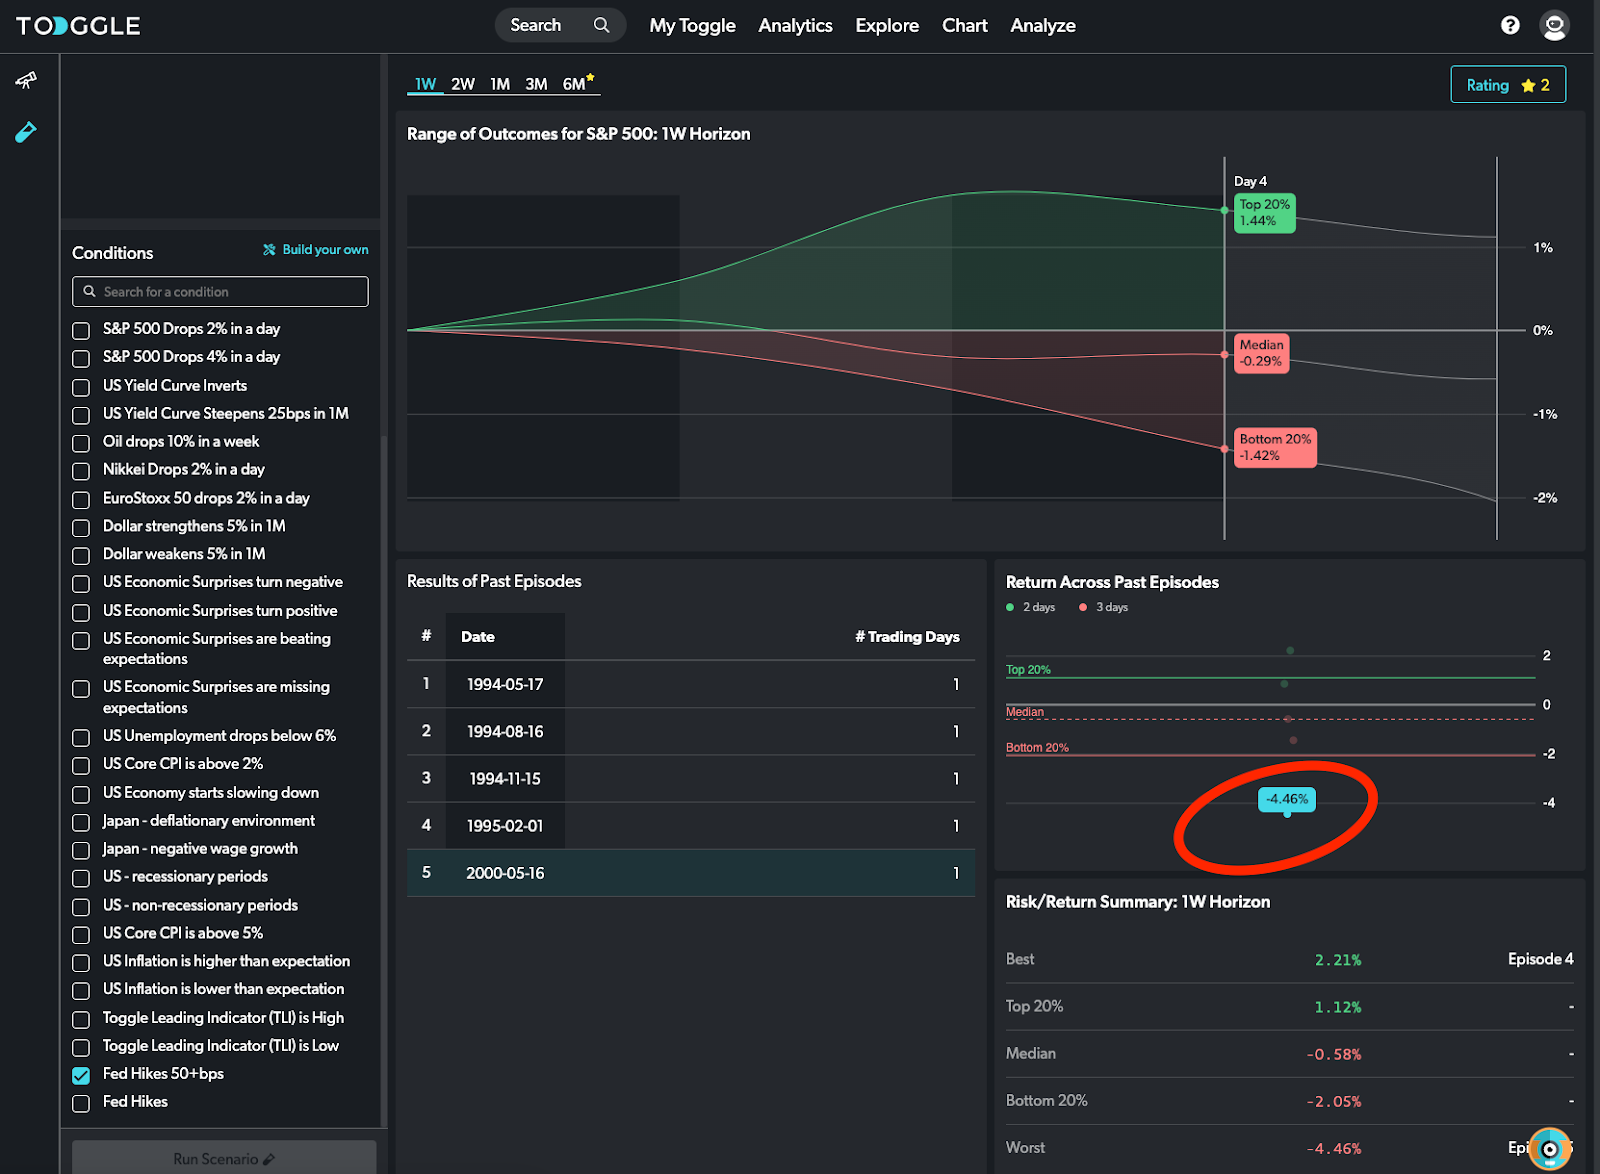
Toggle, which is an AI and machine learning research firm tracking 35,000 securities globally, sent us, yesterday, their post-Fed analysis. According to them, “during the first week after the Fed’s 50 bps hike markets broadly headed lower.”
“In fact, 1 in 5 times the drop reached more than 5%.”
Graphic: Via Toggle.
The firm’s CEO and founder – Jan Szilagyi – said, in response to the market action that “market bulls should root for stocks to go down first.”
That’s actually a powerful statement. For markets to break (rally), they sometimes need to rally (break). Said another way, at times the market is stretched. Sellers (buyers) are either too short (or too long), if we will.
In order to trade lower, for instance, that short inventory (which in and of itself is a support mechanism as it is a bunch of buy orders sitting at lower prices) must be cleared (i.e., covered).
After that support is removed, the market can succumb to whatever fundamental weaknesses it was trying to price in.
In this case, “the incremental effects on liquidity (QE/QT),” as Karsan says.
Moreover, what’s interesting, and this is something others have picked up on, is the difference between the level of volatility that is realized and implied by activity in the derivatives market.
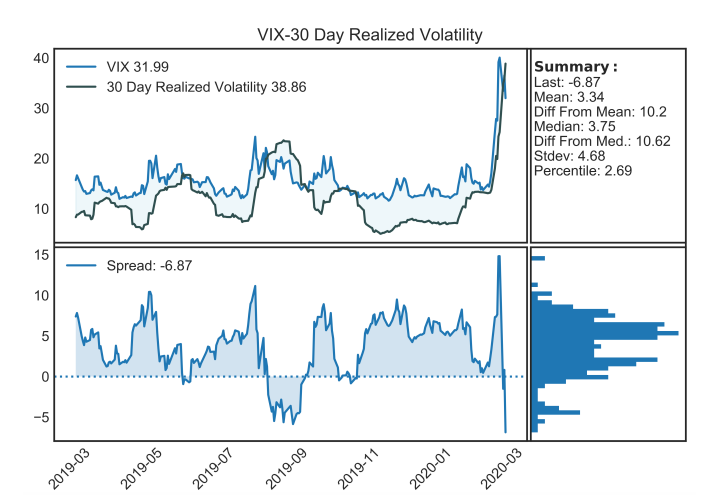
Another time we saw such divergences was during the 2020 Coronacrisis sell-off.
Graphic: Via @HalfersPower. On March 2, 2020, “VIX-30 day realized vol go from 99 percentile yesterday to inverted and 9 percentile today lol. (left vs. right).
Let’s unpack. So, the Cboe Volatility Index (INDEX: VIX), as described by Cboe Global Markets Inc (BATS: CBOE), is a “constant, 30-day expected volatility of the U.S. stock market, derived from real-time, mid-quote prices of S&P 500 Index (INDEX: SPX) call and put options.”
Essentially, to make it simple, VIX is the equity market’s pricing of risk or insurance and it has a strong inverse relationship with the SPX. If SPX is lower, the VIX higher, basically.
Then, just as we have metrics to measure the change in an option’s sensitivity to the underlying direction (delta) or gamma, we have the sensitivity of an option to changes in volatility (vega) or volga.
Volga has different names. Vomma. The convexity of vega (i.e., change in vega based on change in volatility implied by market participants’ activity). The volatility of volatility. And so on.
The volatility of volatility can naively be measured through the Cboe VVIX Index (INDEX: VVIX) which, according to Cboe, “represents a volatility of volatility in the sense that it measures the expected volatility of the 30-day forward price of VIX.”
Historically, the gauge has a mean somewhere beneath 100 and a high correlation with the VIX at times of heightened stress (e.g., Coronacrisis).
Graphic: The VVIX via Physik Invest.
What’s going on is there is really negative sentiment and emotion, both of which are playing into market weaknesses and realized volatility. However, that realized volatility is not priced in.
In other words, the volatility of volatility – VVIX – is low relative to the volatility realized (and implied) and that, as I take it, essentially means that the market is not pricing up protection.
Graphic: Via The Ambrus Group’s Kris Sidial. “Trotting out the good old VVIX/VIX (trader heuristic) to compare SPX skew to VIX Vol. Negative sentiment but lack of fear continues.”
Why does this matter? Well, when you think there is to be an outsized move, relative to what is priced, you buy options (positive exposure to gamma) so that you may have gains that are potentially amplified in case of directional movement.
You also buy can buy options for positive exposure to volga. This is so that you may have gains that are potentially amplified in case of movement (repricing) in implied volatility.
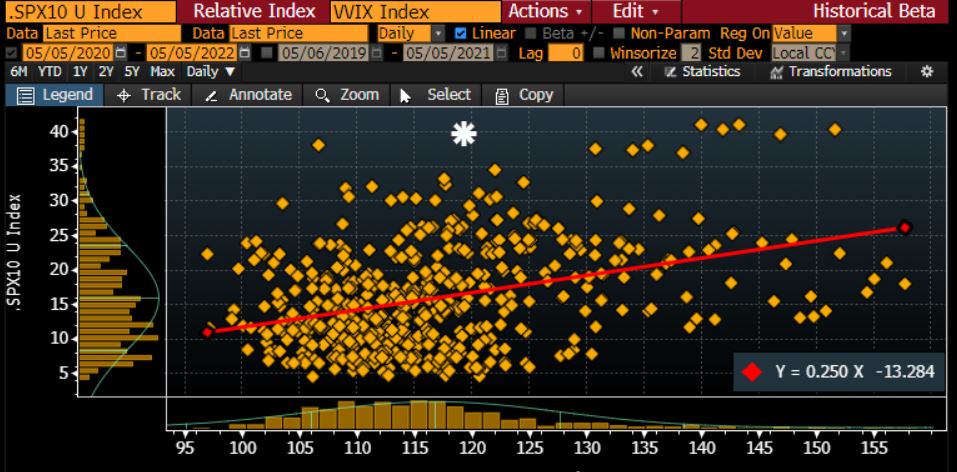
Graphic: Via @Alpha_Ex_LLC. “Here’s 10-day realized vs VVIX on a scatter. The ‘white star’ is 40 realized but only 117 VVIX. When realized this high, VVIX typically closer to 150.”
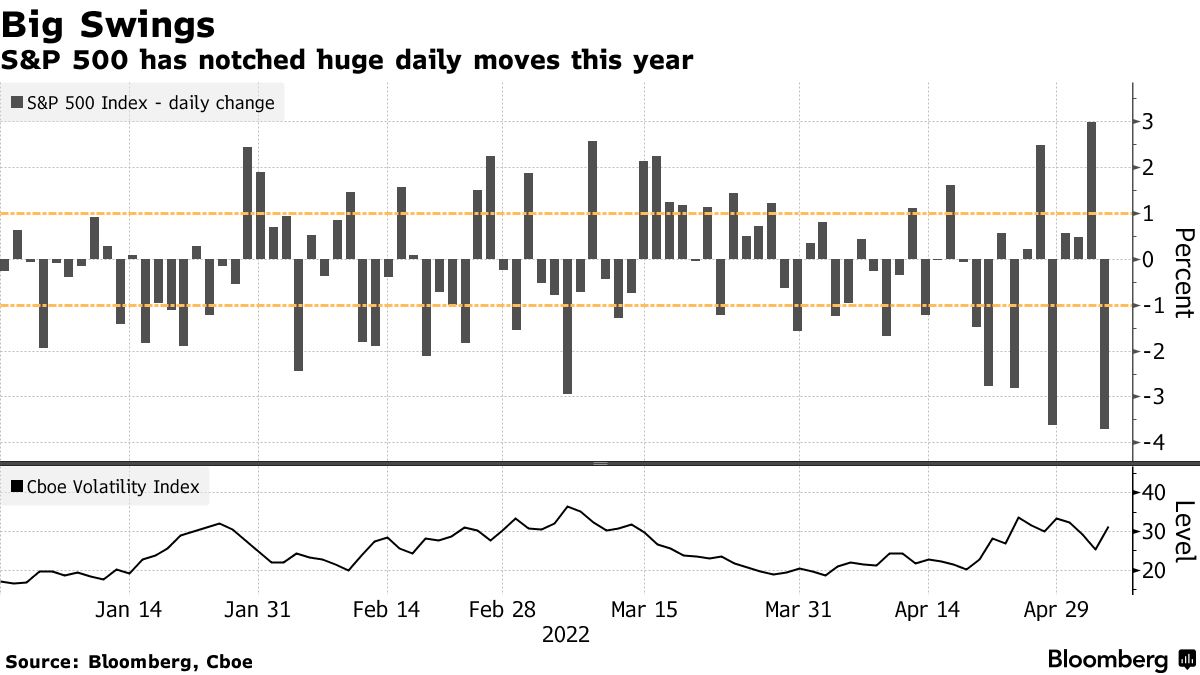
With back-to-back daily price changes sometimes in excess of 2%, this essentially suggests to us the potential for the pricing of equity market risk to “catch up.”
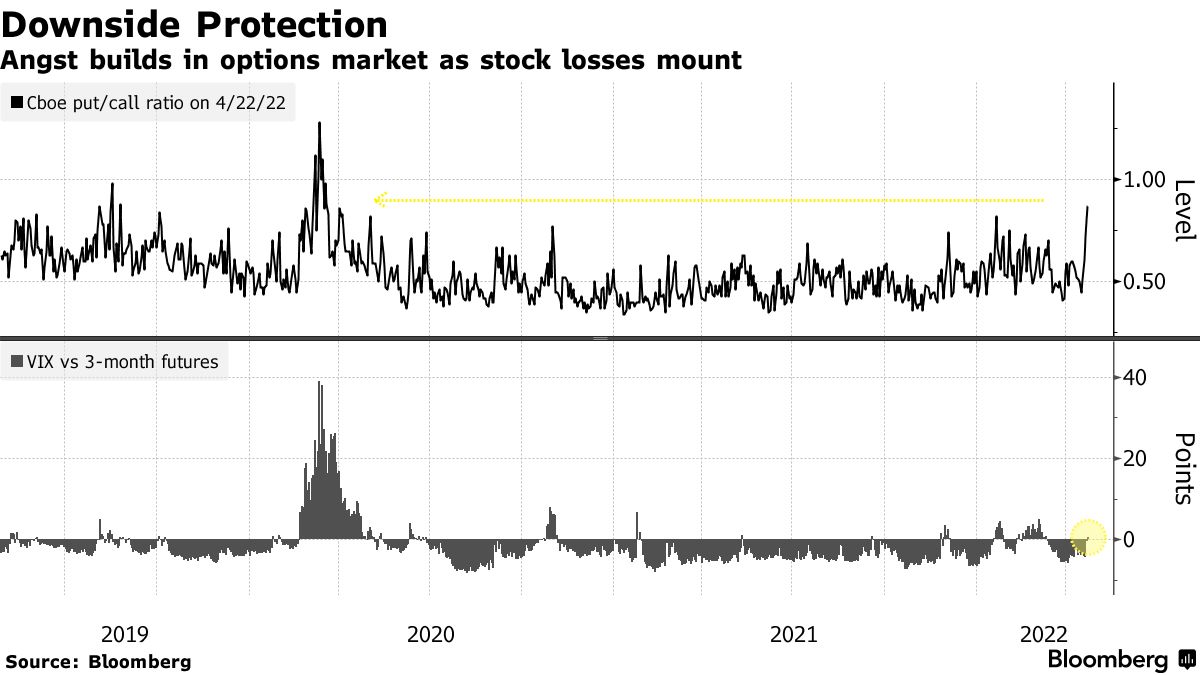
Graphic: Via Bloomberg. The realized volatility for the SPX versus the VIX.
Per SpotGamma, much of this has to do with market participants being “well-hedged.”
“From an options perspective, participants would have to demand en masse protection (buy puts, sell calls) for liquidity providers to further take from market liquidity (sell into weakness) and that volatility skew to, essentially, blowout (e.g., Corona crisis, Meme mania, and the like).”
The Ambrus Group’s Kris Sidial, who felt that the liquidation was likely large desks de-risking their book, explains, well, too:
“Vol is mainly used as a source of hedging. We are coming off of a big FOMC meeting where vol was slightly elevated. Think about this for a second, although SPX had a nasty day today, we are still right where we were at Tuesday… what does that tell you?”
“That means there wasn’t really a NEED to rehedge that same exposure. Volatility didn’t compress much after FOMC and when the market gave it all back it brought us right back to where we started. Put yourself in the shoes of an institution.”
Graphic: SpotGamma’s Hedging Impact of Real-Time Options Indicator (HIRO) for SPY shows light put selling and call buying. Participants are (likely) hedged and are not demanding protection in size amid lower prices.
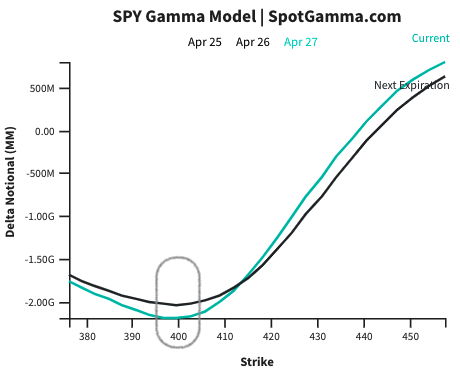
Pursuant to those remarks, SpotGamma sees markets reaching a lower limit near the $4,000.00 SPX area. At that juncture, the rate at which liquidity providers add pressure in their hedging activities flattens as they, too, have hedges.
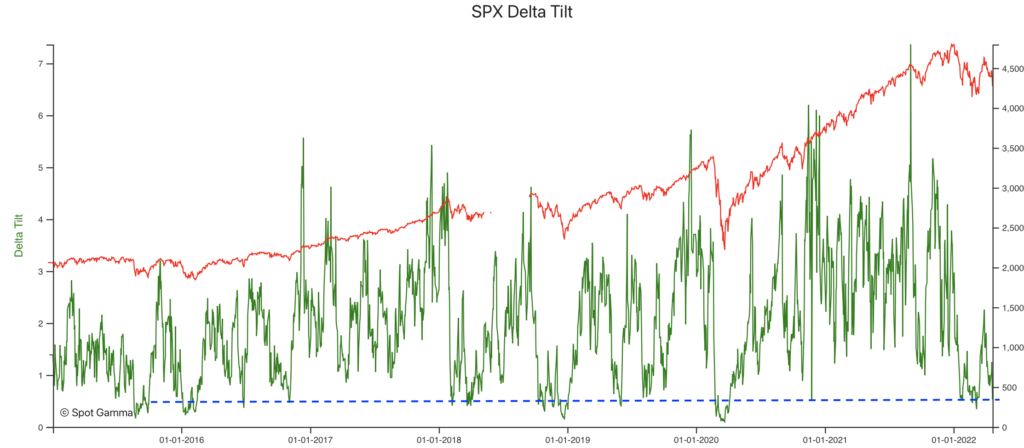
Graphic: Via SpotGamma. Updated April 27, 2022.
“In turn, dealers may be able to advantageously reduce delta hedging (sell less), and supply markets with more liquidity (buy more stock). This could serve to reduce volatility.”
So, what do you do with this information? The idea is that volatility implied may reprice to reflect what is realized. In such a case, you’d want positive exposure to volga (i.e., don’t sell volatility).
This is more of a view on volatility rather than direction, at this juncture.
Directionally speaking, the returns distribution is skewed positive. This is from an overlay of proxies for buying and naive gamma exposure.
Here’s one model using similar data we often look at in this letter.
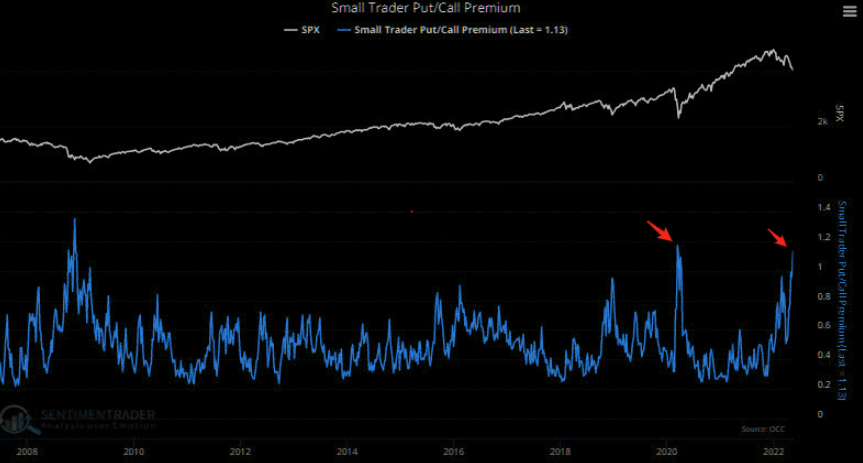
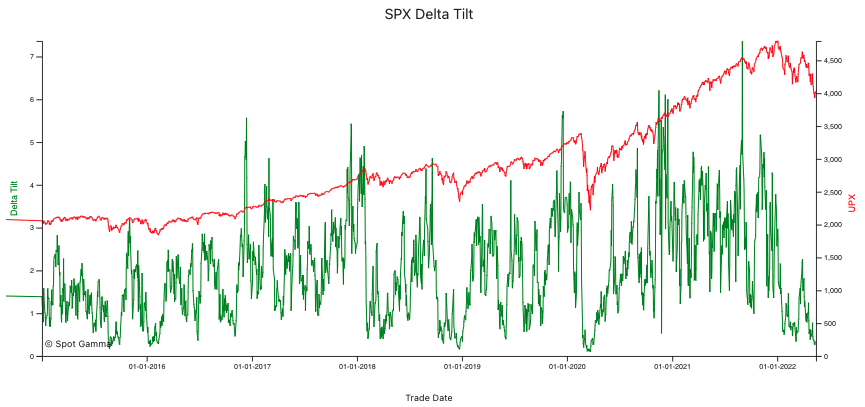
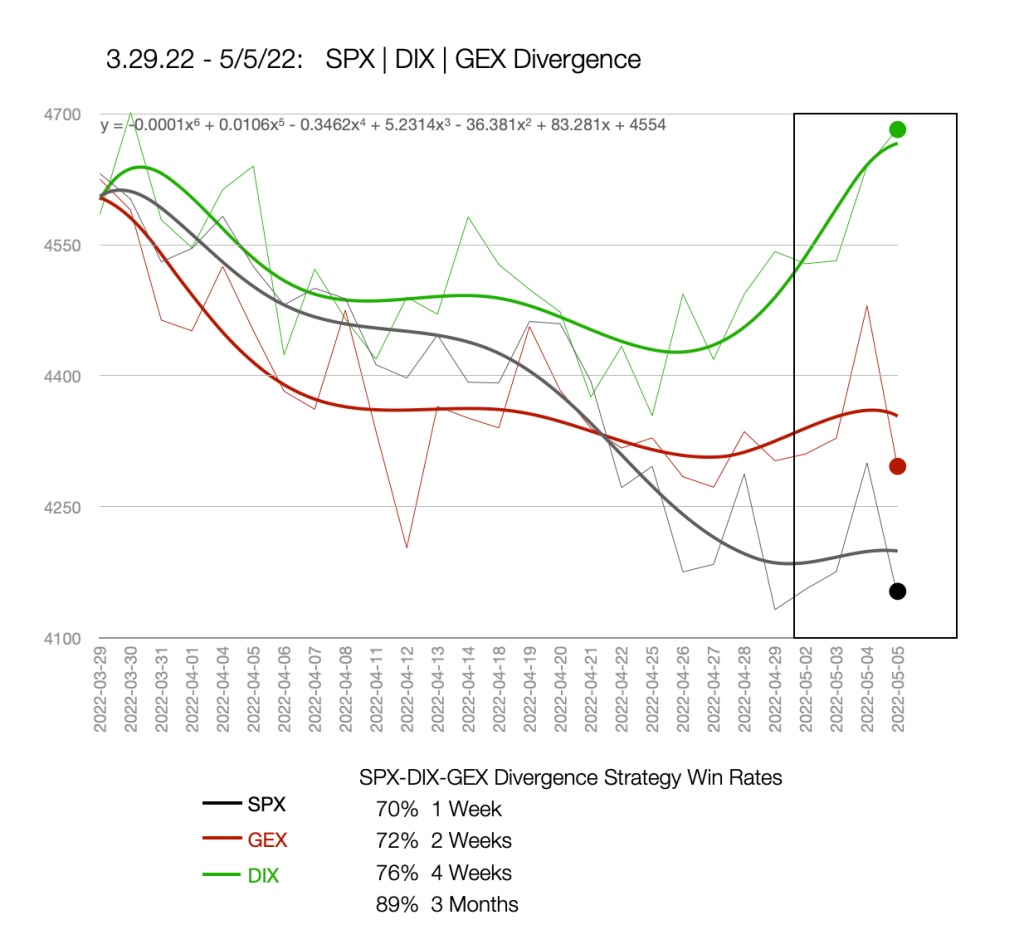
Graphic: Via nextSignals. “When SPX and [gamma exposure] nosedive after an extended selloff while dark pools’ buying sharply diverges to the upside … buy the S&P 500.”
Technical: As of 6:45 AM ET, Friday’s regular session (9:30 AM – 4:00 PM ET), in the S&P 500, will likely open in the middle part of a negatively skewed overnight inventory, inside of prior-range and -value, suggesting a limited potential for immediate directional opportunity.
In the best case, the S&P 500 trades higher; activity above the $4,148.25 high volume area (HVNode) puts in play the $4,184.25 HVNode. Initiative trade beyond the $4,184.25 HVNode could reach as high as the $4,212.25 micro composite point of control (MCPOC) and $4,303.00 weak high (obvious breakout level), or higher.
In the worst case, the S&P 500 trades lower; activity below the $4,148.25 HVNode puts in play the $4,099.25 regular trade low (RTH Low). Initiative trade beyond the RTH Low could reach as low as the $4,055.75 low volume area (LVNode) and $3,978.50 LVNode, or lower.
Click here to load today’s key levels into the web-based TradingView charting platform. Note that all levels are derived using the 65-minute timeframe. New links are produced, daily.
Graphic: 65-minute profile chart of the Micro E-mini S&P 500 Futures.
Definitions
Overnight Rally Highs (Lows): Typically, there is a low historical probability associated with overnight rally-highs (lows) ending the upside (downside) discovery process.
Volume Areas: A structurally sound market will build on areas of high volume (HVNodes). Should the market trend for long periods of time, it will lack sound structure, identified as low volume areas (LVNodes). LVNodes denote directional conviction and ought to offer support on any test.
If participants were to auction and find acceptance into areas of prior low volume (LVNodes), then future discovery ought to be volatile and quick as participants look to HVNodes for favorable entry or exit.
POCs: POCs are valuable as they denote areas where two-sided trade was most prevalent in a prior day session. Participants will respond to future tests of value as they offer favorable entry and exit.
Volume-Weighted Average Prices (VWAPs): A metric highly regarded by chief investment officers, among other participants, for quality of trade. Additionally, liquidity algorithms are benchmarked and programmed to buy and sell around VWAPs.
About
After years of self-education, strategy development, mentorship, and trial-and-error, Renato Leonard Capelj began trading full-time and founded Physik Invest to detail his methods, research, and performance in the markets.
Capelj also develops insights around impactful options market dynamics at SpotGamma and is a Benzinga reporter.
In no way should the materials herein be construed as advice. Derivatives carry a substantial risk of loss. All content is for informational purposes only.
The Daily Brief is a free glimpse into the prevailing fundamental and technical drivers of U.S. equity market products. Join the 200+ that read this report daily, below!
Overnight, equity index futures were sideways, inside of the prior range, after exploring much lower, Monday. Measures of implied volatility, bonds, and most commodities were bid.
This is alongside news that Russia is dodging default, the necessity for the Fed to drop inflation down to 4% by year-end per Citadel’s Ken Griffin, the U.S. Treasury’s intent to scale back sales of longer-term debt, falling earnings estimates, Taiwan preparing to fend-off a potential invasion as Beijing ordered officials to find ways to fight against western sanctions, similar to those used against Russia, among other things including Fitch trimming China’s 2022 growth forecast.
Also, near risk-free, inflation-protected I bonds will pay 9.62% through October, the Treasury said, and here’s more on the Citigroup Inc (NYSE: C) trader that’s behind a European crash.
Ahead is data on job openings and quits, as well as factory and core capital goods orders (10:00 AM ET).
Read on for coverage on the fundamental and technical position of the market, as well as ways to position for future trade.
Graphic updated 6:45 AM ET. Sentiment Neutral if expected /ES open is inside of the prior day’s range. /ES levels are derived from the profile graphic at the bottom of the following section. Levels may have changed since initially quoted; click here for the latest levels. SqueezeMetrics Dark Pool Index (DIX) and Gamma (GEX) calculations are based on where the prior day’s reading falls with respect to the MAX and MIN of all occurrences available. A higher DIX is bullish. At the same time, the lower the GEX, the more (expected) volatility. Learn the implications of volatility, direction, and moneyness. SHIFT data used for S&P 500 (INDEX: SPX) options activity. Note that options flow is sorted by the call premium spent; if more positive, then more was spent on call options. Breadth reflects a reading of the prior day’s NYSE Advance/Decline indicator. VIX reflects a current reading of the CBOE Volatility Index (INDEX: VIX) from 0-100.
What To Expect
Fundamental: The Federal Reserve (Fed) is expected to raise its target overnight rate by about 50 basis points and provide updates on quantitative tightening (QT).
Graphic: Via CME Group Inc’s (NASDAQ: CME) FedWatch Tool. Market participants expect a near-100% chance the fed moves its target rate to 75 or 100 basis points.
The expectations of the aforementioned have played into a tightening of financial conditions which, as Columbia Threadneedle’s Gene Tannuzzo explains, “reduces demand and ultimately slows inflation.”
Graphic: Via Bloomberg. “Tighter financial conditions are the mechanism that reduces demand and ultimately slows inflation,” said Tannuzzo, the firm’s global head of fixed income. “If financial conditions don’t tighten and inflation remains high, in their eyes, they need to hike more.”
The key is the update on QT. As Bloomberg’s John Authers puts it well, “what the Fed does with its balance sheet at the margin [] matters for asset prices, and there is little or no lag.”
Graphic: Via Crossborder Capital Ltd. Taken from Bloomberg.
The Fed’s liquidity reductions, thus far, have played into the market’s troubles since the start of the year. This is as QT has an impact on the “ability to roll over or refinance investments.”
Graphic: Taken from The Market Ear. “46% of non-earnings driven market cap changes were explained by Fed balance sheet expansion since GFC.”
Perspective: JPMorgan Chase & Co (NYSE: JPM) strategists note that investors’ fears are unwarranted. The U.S.’s economic expansion has not been derailed.
“Worries about China’s growth outlook, a negative take on the Q1 earnings reporting season, concerns about higher bond yields and further tightening of financial conditions from a strong dollar, all appear to have soured equity and credit investors’ sentiment,” the strategists said.
“We find these fears overblown.”
Positioning: Comments from yesterday’s morning letter remain valid, today.
Participants’ bets on the direction are concentrated in negative delta (long puts, short calls). The exposure is short-dated and extremely sensitive to changes in implied volatility and direction.
Graphic: Via Goldman Sachs Group Inc (NYSE: GS). Taken from The Market Ear. “Retail Investors buyers of 0-1 DTE (days-to-expiry) puts are largest on record.”
Those options carry a lot of gamma and are exposed to the potential for asymmetric or convex payouts. This is not good for those who are on the other side.
In hedging a short put, for instance, a positive delta and negative gamma trade, counterparties sell underlying if there is weakness or jumps in implied volatility. If the underlying trades higher, or dips in volatility, the counterparty will buy the underlying, all else equal.
Taken together, in such an environment, the counterparty leans toward taking liquidity and this exacerbates underlying movement if there’s a thinning liquidity environment, SpotGamma says.
Graphic: Via Goldman Sachs Group Inc (NYSE: GS). Taken from SpotGamma.
In other words, hedging matters more in such an environment. This was clear during Monday’s trade when a bout of put selling and light call buying appeared in both the SPDR S&P 500 ETF Trust (NYSE: SPY) and Invesco QQQ Trust Series 1 (NASDAQ: QQQ).
This, ultimately, too, fed into the compression of volatility at the short-end of the term structure, yesterday. To re-hedge, counterparts likely bought into the market’s weakness and bolstered the near-vertical reversal, and close higher.
Graphic: SpotGamma’s Hedging Impact of Real-Time Options (HIRO) indicator for SPY. A rising blue and orange denote put selling and call buying, respectively.
The odds of follow-through, to the upside, come back to the fundamental situation and Fed announcements this week. Should fears with respect to monetary policy be assuaged, then volatility can compress and that, alone, will spur a buy-back of those underlying short hedges.
If participants start to concentrate their bets at higher prices, further out in time, that confirms the odds of sustained follow-through. If not, it’s likely that prices, after a short-term relief, will succumb to fundamental weaknesses.
Technical: As of 6:45 AM ET, Tuesday’s regular session (9:30 AM – 4:00 PM ET), in the S&P 500, will likely open in the middle part of a balanced overnight inventory, inside of prior-range and -value, suggesting a limited potential for immediate directional opportunity.
In the best case, the S&P 500 trades higher; activity above the $4,123.00 untested point of control (VPOC) puts in play the $4,176.00 overnight high (ONH). Initiative trade beyond the ONH could reach as high as the $4,247.00 VPOC and $4,279.75 ONH, or higher.
In the worst case, the S&P 500 trades lower; activity below the $4,123.00 VPOC puts in play the $4,055.75 low volume area (LVNode). Initiative trade beyond the LVNode could reach as low as the $3,978.50 LVNode and $3,943.25 high volume area (HVNode), or lower.
Click here to load today’s key levels into the web-based TradingView charting platform. Note that all levels are derived using the 65-minute timeframe. New links are produced, daily.
Graphic: 65-minute profile chart of the Micro E-mini S&P 500 Futures.
Considerations: Most interesting was Monday’s response at a key technical level ($4,055.75) outlined in the morning letter.
Specifically, the E-mini S&P 500 probed $4,056.00 before staging a sharp reversal and closing higher. This is noteworthy as it tells us a lot about who has (or is gaining) the upper hand.
Push-and-pull, as well as responsiveness near key-technical areas (discernable visually on a chart), suggests technically-driven traders with shorter time horizons are (becoming) active.
Such traders often lack the wherewithal to defend retests and, additionally, this type of trade may suggest other time frame participants are waiting for more information to initiate trades.
Adding, the Federal Reserve’s meeting this week concludes with statements to be shared on Wednesday. For weeks heading into this event, (larger) participants (that move by committee) have de-grossed and hedged. For that reason, the reliability of our technical levels took a hit.
Graphic: Via JPMorgan Chase & Co (NYSE: JPM). Taken from The Market Ear. Per Bloomberg, “Hedge funds tracked by Morgan Stanley have also cut their net leverage — a measure of risk appetite that takes into account long versus short positions — to a two-year low.”
In the very near term, until more fundamental information is revealed, these technical-driven traders may play a larger role in the volatility. These traders, given capital constraints and tolerances, often trigger sharp moves in their entry and exit on news. Caution on whipsaw.
How I’m Playing: Presently, the market is stretched to the downside and participants are leaning, heavily, one way.
Graphic: Via SpotGamma, “Put vs Call gamma suggests stretched positioning.”
Pursuant to that remark, as SpotGamma says, “traders are underpricing right-tail risk,” and that opens the window for unique ways to play a returns distribution that is skewed positive (albeit with large negative outliers).
Consider zero- or low-cost bets that deliver asymmetric payouts in case of reversals.
This letter’s writer presently is structured positive delta and gamma in the Nasdaq 100 (INDEX: NDX) via ratios spread (1×2) and butterfly (1x2x1) structures.
The concern with these strategies is the width and time to expiry. Should either of those be wrong, then spreads initially positive gamma turn negative, meaning losses are amplified.
For instance, in the Nasdaq 100, to put in short, 500-1000 points wide ratio spreads (buy the closer leg, sell two of the farther legs) expiring in ten to fifteen days work well.
For those spreads that are not zero cost, debits can be offset with credit sales (on the put side) in products that have shown relative strength like the S&P 500 (INDEX: SPX). This, inherently, carries more risk. Read more about these strategies, here.
Please note that the above is NOT a trade recommendation or advice.
Graphic: Via Banco Santander SA (NYSE: SAN) research, the return profile, at expiry, of a classic 1×2 (long 1, short 2 further away) ratio spread.
Definitions
Overnight Rally Highs (Lows): Typically, there is a low historical probability associated with overnight rally-highs (lows) ending the upside (downside) discovery process.
Volume Areas: A structurally sound market will build on areas of high volume (HVNodes). Should the market trend for long periods of time, it will lack sound structure, identified as low volume areas (LVNodes). LVNodes denote directional conviction and ought to offer support on any test.
If participants were to auction and find acceptance into areas of prior low volume (LVNodes), then future discovery ought to be volatile and quick as participants look to HVNodes for favorable entry or exit.
POCs: POCs are valuable as they denote areas where two-sided trade was most prevalent in a prior day session. Participants will respond to future tests of value as they offer favorable entry and exit.
Volume-Weighted Average Prices (VWAPs): A metric highly regarded by chief investment officers, among other participants, for quality of trade. Additionally, liquidity algorithms are benchmarked and programmed to buy and sell around VWAPs.
About
After years of self-education, strategy development, mentorship, and trial-and-error, Renato Leonard Capelj began trading full-time and founded Physik Invest to detail his methods, research, and performance in the markets.
Capelj also develops insights around impactful options market dynamics at SpotGamma and is a Benzinga reporter.
In no way should the materials herein be construed as advice. Derivatives carry a substantial risk of loss. All content is for informational purposes only.
The Daily Brief is a free glimpse into the prevailing fundamental and technical drivers of U.S. equity market products. Join the 200+ that read this report daily, below!
Overnight, equity index futures auctioned sideways-to-lower ahead of an earnings season that’s set to accelerate.
Concerns that remain include the implications of China’s response to COVID-19, the resolution of the tension between Russia and Ukraine (and the rest of the world for that matter), as well as the intent, by policymakers, to accelerate a pivot to normalization (i.e., rate hikes and beyond).
Graphic: Via Sanford Bernstein. Taken from The Market Ear.
With a larger part of the market moving in sync (as talked about more in the “Technical” section), many strategists suggest the outlook for equities is continuing to worsen and positioning is likely to compound further volatility.
Ahead is data on durable goods and core capital equipment orders (8:30 AM ET), the S&P Case-Shiller U.S. home price index and FHFA U.S. home price index (9:00 AM ET), as well as consumer confidence index and new home sales (10:00 AM ET).
Graphic updated 7:00 AM ET. Sentiment Risk-Off if expected /ES open is below the prior day’s range. /ES levels are derived from the profile graphic at the bottom of the following section. Levels may have changed since initially quoted; click here for the latest levels. SqueezeMetrics Dark Pool Index (DIX) and Gamma (GEX) calculations are based on where the prior day’s reading falls with respect to the MAX and MIN of all occurrences available. A higher DIX is bullish. At the same time, the lower the GEX, the more (expected) volatility. Learn the implications of volatility, direction, and moneyness. SHIFT data used for S&P 500 (INDEX: SPX) options activity. Note that options flow is sorted by the call premium spent; if more positive, then more was spent on call options. Breadth reflects a reading of the prior day’s NYSE Advance/Decline indicator. VIX reflects a current reading of the CBOE Volatility Index (INDEX: VIX) from 0-100.
What To Expect
Fundamental: “With defensive stocks now expensive and offering little absolute upside, the S&P 500 appears ready to join the ongoing bear market,” Morgan Stanley (NYSE: MS) says.
Graphic: Via Morgan Stanley (NYSE: MS). Taken from The Market Ear. “[T]he accelerative price action on Thursday and Friday may also support the view we are now moving to this much broader sell-off phase.”
“The market has been so picked over at this point, it’s not clear where the next rotation lies. In our experience, when that happens, it usually means the overall index is about to fall sharply with almost all stocks falling in unison.”
Graphic: Via Bloomberg. “Everyone bearish, but redemptions just starting,” explain Bank of America Corporation (NYSE: BAC) strategists led by Michael Hartnett, adding that the environment of “extreme inflation” and rates shock is just setting in, as the Federal Reserve tightens monetary policy. “75 basis points is the new 25 basis points,” Hartnett said, referring to the scope of future interest-rate hikes.
Adding, Bank of America’s global EPS model predicts negative growth by year-end.
Graphic: Via Bank of America Corporation. Taken from The Market Ear.
Positioning: Monday’s bottoming at $4,200.00, near intraday lows, came as participants sold puts, and the hedging of the consequent volatility compression, thereafter, bolstered a price rise.
Graphic: Via SpotGamma’s Hedging Impact of Real-Time Options Indicator.
At this juncture, though positioning appears (a tad) stretched and prices are nearing a lower bound, there may be room for volatility to expand, further.
Per SpotGamma’s Delta Tilt indicator, which “reflects the market approaching a maximum put threshold, [there’s] potential for further hedging that may result in sharp rallies and declines with volatility climaxing around early May (FOMC and potential for Russian Default).”
Graphic: SpotGamma’s Delta Tilt.
This is as options counterparts themselves have hedges (i.e., protective puts) that reduce hedging requirements, so to speak, when underlyings trade down to certain levels.
“Using this logic, when the downside puts gain value, they may reduce the need to delta hedge. In turn, dealers may be able to advantageously reduce delta hedging (sell less), and supply markets with more liquidity (buy more stock). This could serve to reduce volatility.”
So, in summary, participants are pretty well-hedged. Should they begin to monetize protection, that may lower counterparty exposure to positive delta, thus fueling a price rise.
Whether that price has legs is dependent on improvement in the fundamental situation.
Technical: As of 7:00 AM ET, Tuesday’s regular session (9:30 AM – 4:00 PM ET), in the S&P 500, will likely open in the lower part of a negatively skewed overnight inventory, inside of prior-range and -value, suggesting a limited potential for immediate directional opportunity.
In the best case, the S&P 500 trades higher; activity above the $4,272.00 high volume area (HVNode) puts in play the $4,303.75 overnight high (ONH). Initiative trade beyond the ONH could reach as high as the $4,337.00 untested point of control (VPOC) and $4,393.75 HVNode, or higher.
In the worst case, the S&P 500 trades lower; activity below the $4,272.00 HVNode puts in play the $4,233.00 VPOC. Initiative trade beyond the VPOC could reach as low as the $4,195.25 regular trade low (RTH Low) and $4,129.50 overnight low (ONL), or lower.
Click here to load today’s key levels into the web-based TradingView charting platform. Note that all levels are derived using the 65-minute timeframe. New links are produced, daily.
Graphic: 65-minute profile chart of the Micro E-mini S&P 500 Futures.
Considerations: The market is weak and all major indexes covered by this newsletter are trading below their 20-, 50-, and 200-day simple moving averages.
Additionally, all indexes are below their volume-weighted average prices anchored from the start of this year (or their respective peaks). Further, AVWAPs are a metric highly regarded by chief investment officers (CIOs), among other participants, for quality of trade. Additionally, liquidity algorithms are benchmarked and programmed to buy and sell around VWAPs.
Graphic: Invesco QQQ Trust Series 1 (NASDAQ: QQQ) with anchored VWAPs.
The modus operandi is to sell into a flat-to-declining AVWAP. So long as prices are below the below AVWAPs, sellers remain in control and rally attempts are to likely fail, all else equal.
Another important note to make is the market’s poor breadth (via VOLD and ADD). Previously, there were divergences; rate-sensitive areas of the market were sold while more value was bid. Last week, there was a change in tone. All areas of the market were sold, heavily.
This suggests the potential for a broader sell-off (and this is supported by the U.S. Equity ETF flows graphic included, above).
Graphic: Market Internals as pioneered by (a mentor of mine) Peter Reznicek. Notice the indicator in the top right, weighted S&P sectors (histogram) versus unweighted (blue line). During late last week, participants sold the entire market, heavily (as supported by the difference between the volume flowing into stocks that are up versus those that are down).
What People Are Saying
Listen to this interview from Dudley, former FRBNY Pres and Chief Goldman US Economist. "Reverse wealth effect" is a policy tool. Fed needs risk assets to go lower to tame inflation. They will keep tightening until it goes lower.
Overnight Rally Highs (Lows): Typically, there is a low historical probability associated with overnight rally-highs (lows) ending the upside (downside) discovery process.
Volume Areas: A structurally sound market will build on areas of high volume (HVNodes). Should the market trend for long periods of time, it will lack sound structure, identified as low volume areas (LVNodes). LVNodes denote directional conviction and ought to offer support on any test.
If participants were to auction and find acceptance into areas of prior low volume (LVNodes), then future discovery ought to be volatile and quick as participants look to HVNodes for favorable entry or exit.
POCs: POCs are valuable as they denote areas where two-sided trade was most prevalent in a prior day session. Participants will respond to future tests of value as they offer favorable entry and exit.
About
After years of self-education, strategy development, mentorship, and trial-and-error, Renato Leonard Capelj began trading full-time and founded Physik Invest to detail his methods, research, and performance in the markets.
Capelj also develops insights around impactful options market dynamics at SpotGamma and is a Benzinga reporter.
In no way should the materials herein be construed as advice. Derivatives carry a substantial risk of loss. All content is for informational purposes only.