Categories
Methodology

Successful Traders’ Tips To Beat The Markets

Separate from his work at Physik Invest, founder Renato Leonard Capelj is an accredited journalist interviewing prestigious global leaders in business, government, and finance.

In his desire to learn and apply the methods of those others who are far more experienced, Capelj has a long list of interviews you may find helpful in strengthening your understanding of markets.

March 10, 2023: Portfolio Manager Prefers Option, Bond Overlays To Hedge Big Uncertainty Facing Markets

Capelj spoke with Simplify Asset Management’s Michael Green about cutting investors’ portfolio volatility while amplifying profit potential.

In response to uncertainty, Green says investors can park cash in short-term near-risk-free bonds yielding 5% or more, as well as allocate some capital to volatility “to introduce a degree of convexity,” risking only the premium paid. Alternatively, investors can take a more optimistic long view and position in innovations like artificial intelligence or next-generation energy production.

Michael Green of Simplify Asset Management

January 8, 2023: Two Major Risks Investors Should Watch Out For In 2023

Capelj spoke with The Ambrus Group’s Kris Sidial about his market perspectives.

Naive measures like the VVIX, which is the volatility of the VIX or the volatility of the S&P 500’s volatility, are printing at levels last seen in 2017, Sidial explains, noting this would suggest “we can get cheap exposure to convexity while a lot of people are worried.”

“Even if inflation continues, the rate at which it rises won’t be the same. Due to this, CTA exposures likely will not perform as well as they did in 2022, and that’s why you may see more opportunities in the volatility space.”

Kris Sidial of The Ambrus Group

June 28, 2022: Former Bridgewater Associate Andy Constan Talks Recession Odds, Capturing A Macro Edge

Capelj spoke with Damped Spring Advisors’ Andy Constan about what investors should focus on and how he creates trades that lose him less money.

Constan’s trades are constructed around two- to four-month time horizons and are structured long and short using defined-risk options trades like debit or credit spreads, depending on whether volatility is cheap or expensive.

I want deltas and leverage. My macro indicators give me an edge on price and in the worst case, the loss is limited to 10%, if everything has to go against me all at once. I can be 100% invested and only risk 10%.”

Andy Constan of Damped Spring Advisors

May 16, 2022: 42 Macro’s Darius Dale On His Wall Street Story, The Markets: ‘This Is Not The Financial Crisis’

Capelj spoke with 42 Macro’s Darius Dale about his Wall Street story and perspectives on life and markets.

“We’re tracking at an above-potential level of output in terms of the growth rate of output. We’re also slowing and the pace of that deceleration is likely to pick up steam in the coming quarters.”

By 2023, that process is likely to “catalyze pressure on asset markets through the lens of corporate earnings and valuations you assign to a lower level of growth.”

Darius Dale of 42 Macro

July 22, 2021: ShadowTrader’s Peter Reznicek On His Early Days, Tips For Success And Evolution

Capelj spoke with ShadowTrader’s Peter Reznicek about his start, perspectives, success tips, and visions for the future.

Reznicek recalled two turning points in his trading career.

The first was learning from expert floor traders involved with the thinkorswim team.

“That was really the genesis of where I started to learn the broken-wing butterflyratio spread and things like that,” he shared.

Floor traders, according to Reznicek, had low capital requirements. As a result, they could put on strategies like the 1×2 ratio — a debit spread with an extra short option — for a low cost.

(See parts 12, and 3 of ShadowTrader’s how-to series on ratio spreads.)

“On the floor, it is either go big or go home,” he chuckled, remarking that ratio spreads were the way of the casino. “You either get rich or they take your house. So, why would you put on any other spread?”

The next big turning point was Jim Dalton, who’s been a member of the Chicago Board of Trade, as well as a member of the Chicago Board Options Exchange (CBOE) and senior executive vice president of the CBOE during its formative years.

“I’m still in touch with him on a regular basis and I consider him a friend,” Reznicek said in a discussion on Dalton’s works like Mind Over Markets and Markets in Profile, as well as his use of WindoTrader Market Profile software. “I went to Chicago twice to see him teach live … and I came home from those seminars with five, six, 10 pages of notes. The nuances of profile continue to mold me.”

Peter Reznicek of ShadowTrader

July 26, 2021: Kai Volatility’s Cem Karsan Unpacks Implications Of Fed Taper, Shift To Fiscal Policy And More

Capelj spoke with Kai Volatility Advisors’ Cem Karsan about the implications of record valuations and the growth of derivatives markets on policy, the economy, and financial markets.

“It’s not a coincidence that the mid-February to mid-March 2020 downturn literally started the day after February expiration and ended the day of March quarterly expiration. These derivatives are incredibly embedded in how the tail reacts and there’s not enough liquidity, given the leverage, if the Fed were to taper.”

Cem Karsan of Kai Volatility Advisors

July 13, 2021: Ambrus Group CIO On Taking Advantage Of Volatility Dislocations

Capelj spoke with The Ambrus Group’s Kris Sidial to understand how to capitalize on volatility dislocations.

Unlike standard tail-risk funds which systematically buy equity puts, Ambrus’ approach is bespoke, cutting down on negative dynamics like decay with respect to time.

Given dislocations across single stock skew, term structure, and volatility risk premium, Ambrus will position itself in options with less time to maturity, buying protection up to six weeks out.

“The market will underestimate the distribution,” Sidial said in a conversation on Ambrus’ internal models that spot positional imbalances to determine who is off-sides and in what single asset. “We’re buying things that have happened before and we’re looking for it to carry a heavier beta when the sell-off happens.”

So, by analyzing flow, as well as using internal models to assess the probabilities of deleveraging in a risk-off event, Ambrus is able to venture into individual stocks where there may be excess fragility; “I know if stock XYZ goes down five percent, it’s going to go down 10% because this fund needs to deleverage.”

To aid the cost to carry, Ambrus utilizes defined-risk, short-volatility, absolute return strategies.

“I’m basically giving you a free put on the market – with a ton of convexity – with something that offers a payout that’s just more than a regular put,” Sidial summarized. “If the market doesn’t do anything, and we do an amazing job, we’re flat and you made money on all your long-only equity exposure.”

“You had a free hedge the entire time.”

Kris Sidial of The Ambrus Group

February 1, 2021: Volatility Arbitrage Trader Talks GameStop, Market Microstructure, Regulation

Capelj spoke with The Ambrus Group’s Kris Sidial about the meme stock debacle of 2021.

“You have distressed debt hedge funds that focus on shorting these types of companies. Melvin Capital is the one that is singled out due to the media, but they aren’t the only ones.”

Market participants added to the crash-up dynamics. Retail investors aggressively bought stock and short-term call options, while institutional investors further took advantage of the momentum and dislocations.

“You have this dynamic in the derivatives market where there is a gamma squeeze when people are buying way far out-of-the-money calls, and dealers reflexively have to hedge off their risk,” Sidial said.

“It causes a cascading reaction, moving the stock price up because dealers are short calls and they have to buy stock when the delta moves a specific way.”

The participation in the stock on the institutional side has not received much attention, he said. 

“We’ve noticed that some of the flow is more institutional,” he said in reference to activity on the level two and three order books, which are electronic lists of buy and sell orders for a particular security.

“You have certain prop guys and other hedge funds that understand what’s going on, and they’re trying to take advantage of it, as well.”

This institutional activity disrupted traditional correlations and caused shares of distressed debt assets like GameStop, BlackBerry Ltd, and AMC Entertainment Holdings Inc to trade in-line with each other.

“This was not some WallStreetBet user, … if you look at how some of these things were moving premarket, you would see GME drop like 2%, BB’s best bid would drop and AMC’s best bid would drop. That’s an algo.”

The takeaway: although the WallStreetBets crowd is getting most of the blame, institutions are also at fault for the volatility.

Kris Sidial of The Ambrus Group
Categories
Commentary

Daily Brief For March 20, 2023

Physik Invest’s Daily Brief is read free by thousands of subscribers. Join this community to learn about the fundamental and technical drivers of markets.

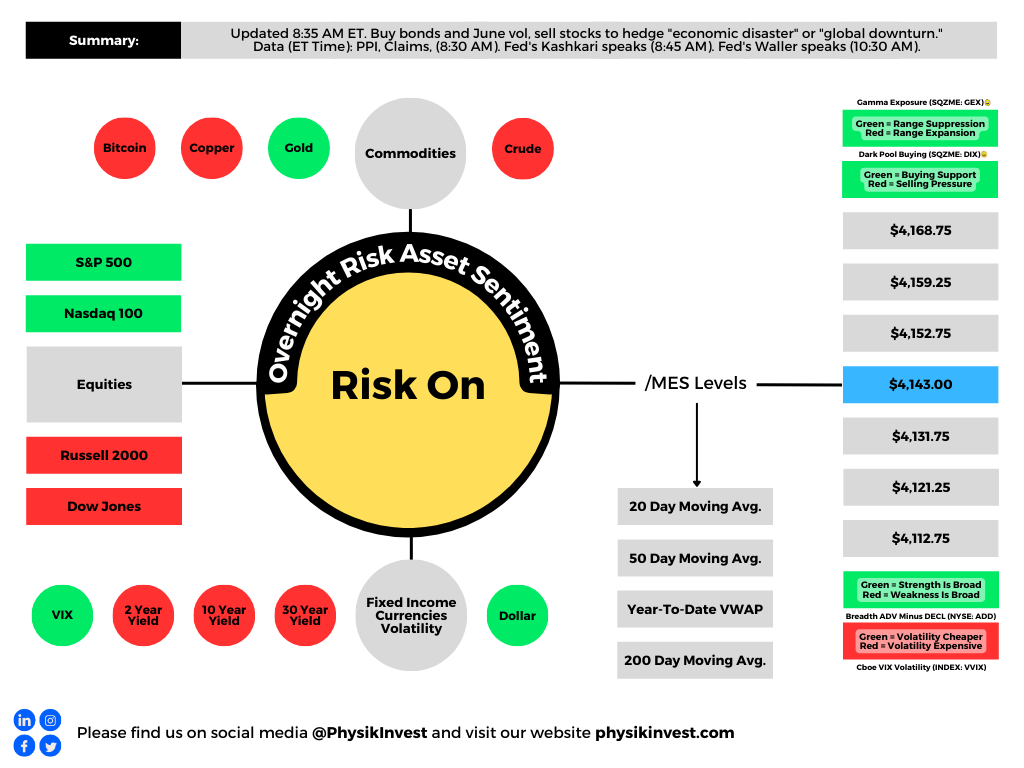
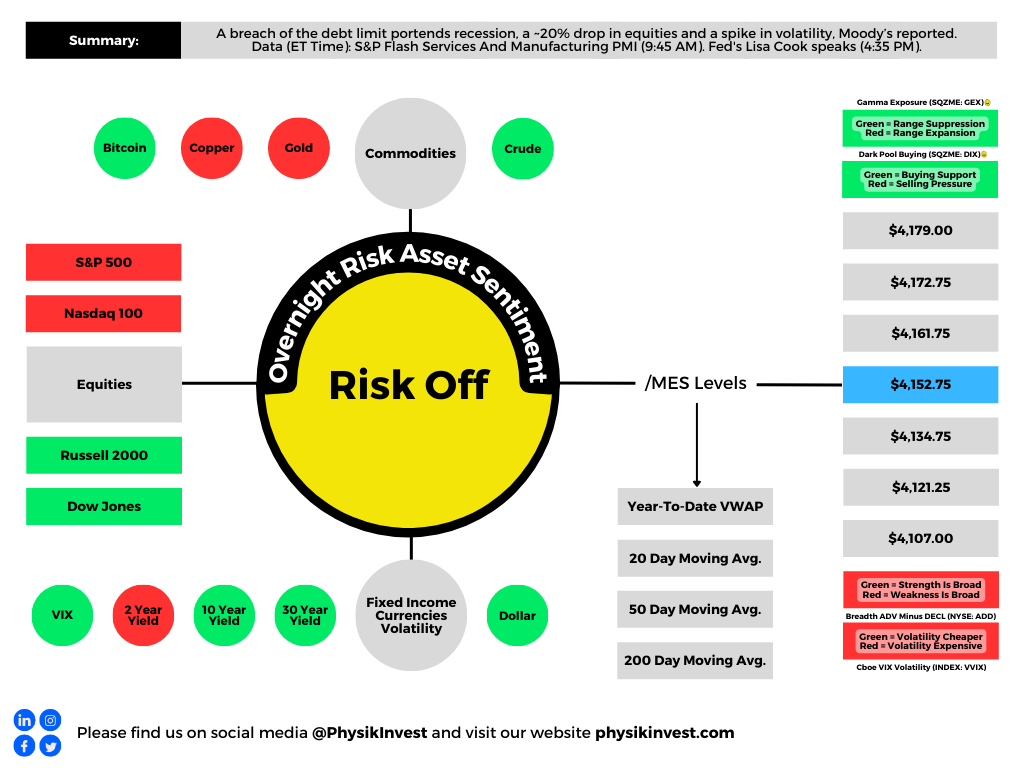
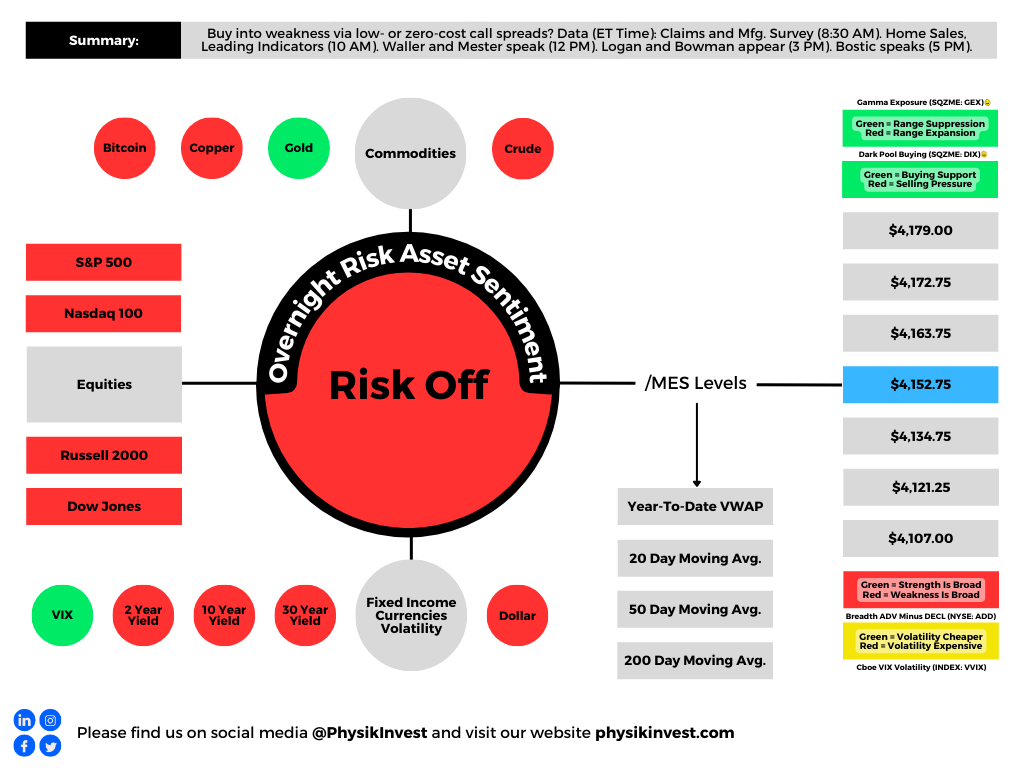
Graphic updated 8:10 AM ET. Sentiment Neutral if expected /MES open is inside of the prior day’s range. /MES levels are derived from the profile graphic at the bottom of this letter. Click here for the latest levels. SqueezeMetrics Dark Pool Index (DIX) and Gamma (GEX) with the latter calculated based on where the prior day’s reading falls with respect to the MAX and MIN of all occurrences available. A higher DIX is bullish. The lower the GEX, the more (expected) volatility. Click to learn the implications of volatility, direction, and moneyness. Breadth reflects a reading of the prior day’s NYSE Advance/Decline indicator. The CBOE VIX Volatility Index (INDEX: VVIX) reflects the attractiveness of owning volatility. UMBS prices via MNDClick here for the economic calendar.

Fundamental

As well summarized by Eric Basmajian, inflation, and growth are on a downward trajectory. Most leading indicators “suggest recessionary pressure will be ongoing.” The banking crisis and response, which will ultimately “cause a tightening of lending to the private economy,” likely exacerbates the ongoing recessionary pressures.

Breaking: UBS To Buy Credit Suisse In $3.3 Billion Deal

Most strategists including the Damped Spring’s Andy Constan agree. In a recent video, Constan detailed the implications of policymakers’ intervention. In short, an asset fire sale was turned into a managed sale, and a reduction in credit creation will tighten financial conditions, slowing the economy and inflation.

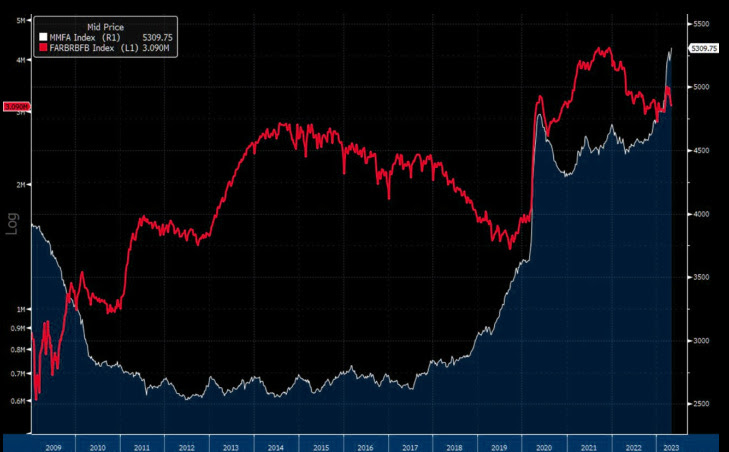
“Small banks that are facing deposit outflows will see earnings and margins collapse as their cost of funds surges from 1% or 2% on deposits to 4% or 5% at the Fed funding facility,” Basmajian summarizes, noting that the increase in the Federal Reserve (Fed) balance sheet came from the discount window, new bank funding facilities, and spillover from the FDIC insurance backstop, all of which are not to be confused with quantitative easing or QE (i.e., monetary stimulus and a flow of capital into capital markets). 

Graphic: Retrieved from Bank of American Corporation (NYSE: BAC) via The Market Ear.

“As deposits leave regional and smaller banks for more yield and safety, they will flow into bigger banks that do less lending or into money market funds that don’t drive credit creation.” Consequently, there will be “a significant tightening of lending standards, and a credit crunch on the private economy as regional and smaller banks face massive funding pressure.”

Graphic: Retrieved from Morgan Stanley (NYSE: MS) via The Market Ear. “MS models show that a permanent +10pt tightening in lending standards for C&I loans leads to a 35bps rise in the unemployment rate over the next two years. Historically, recessions have arrived more than half a year after jobless claims begin a sustained rise.”

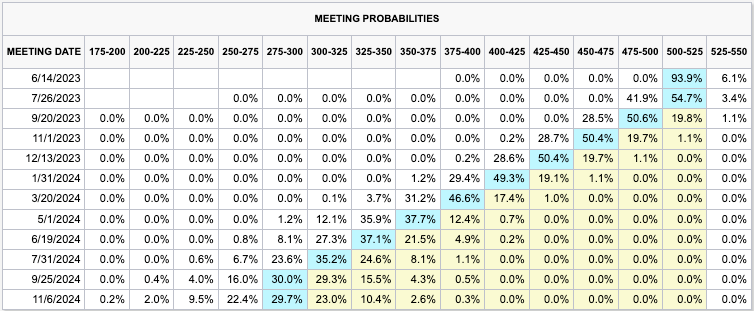
Traders are conflicted about the Fed’s coming interest rate decision. Many were expecting a couple more hikes of at least 25 basis points in size. However, following the recent bank turmoil in the US and abroad, it appears that traders think it will be one additional 25 basis point hike before rate cuts ensue in mid-2023.

Graphic: Retrieved from CME Group Inc’s (NASDAQ: CME) FedWatch Tool.

Historically, selling markets on the last Fed rate hike is a good strategy, Bank of America found.

Graphic: Retrieved from Bank of American Corporation (NYSE: BAC) via The Market Ear.

Positioning

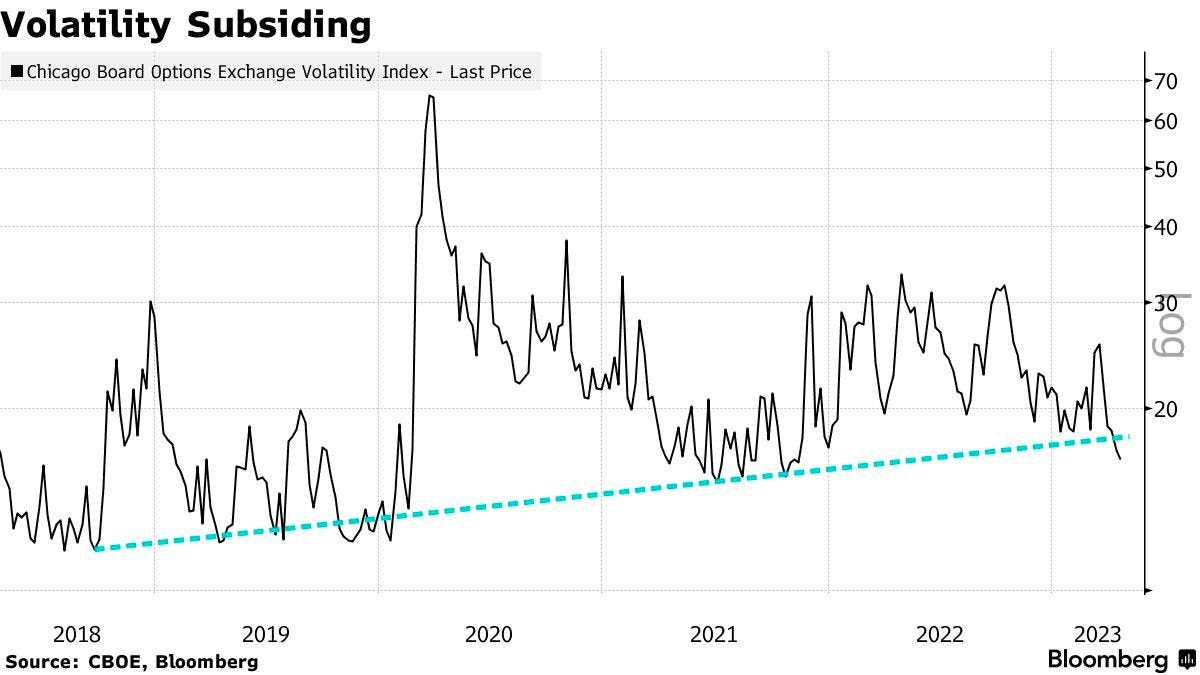
Top-line measures of implied volatility or IVOL including the Cboe Volatility Index or VIX are higher heading into Monday’s trade.

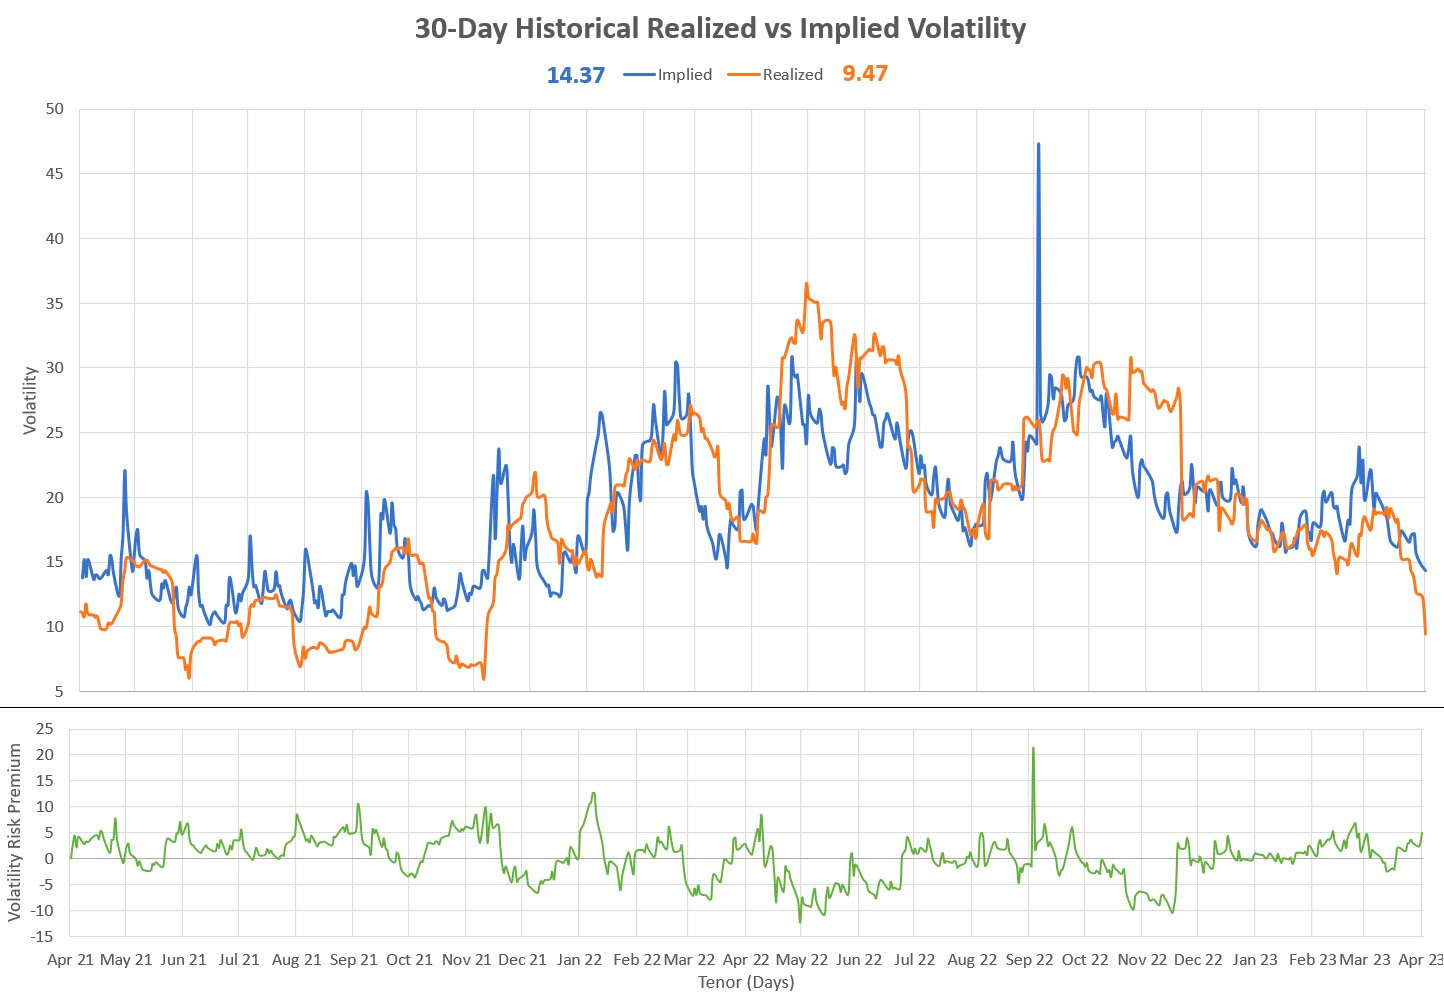
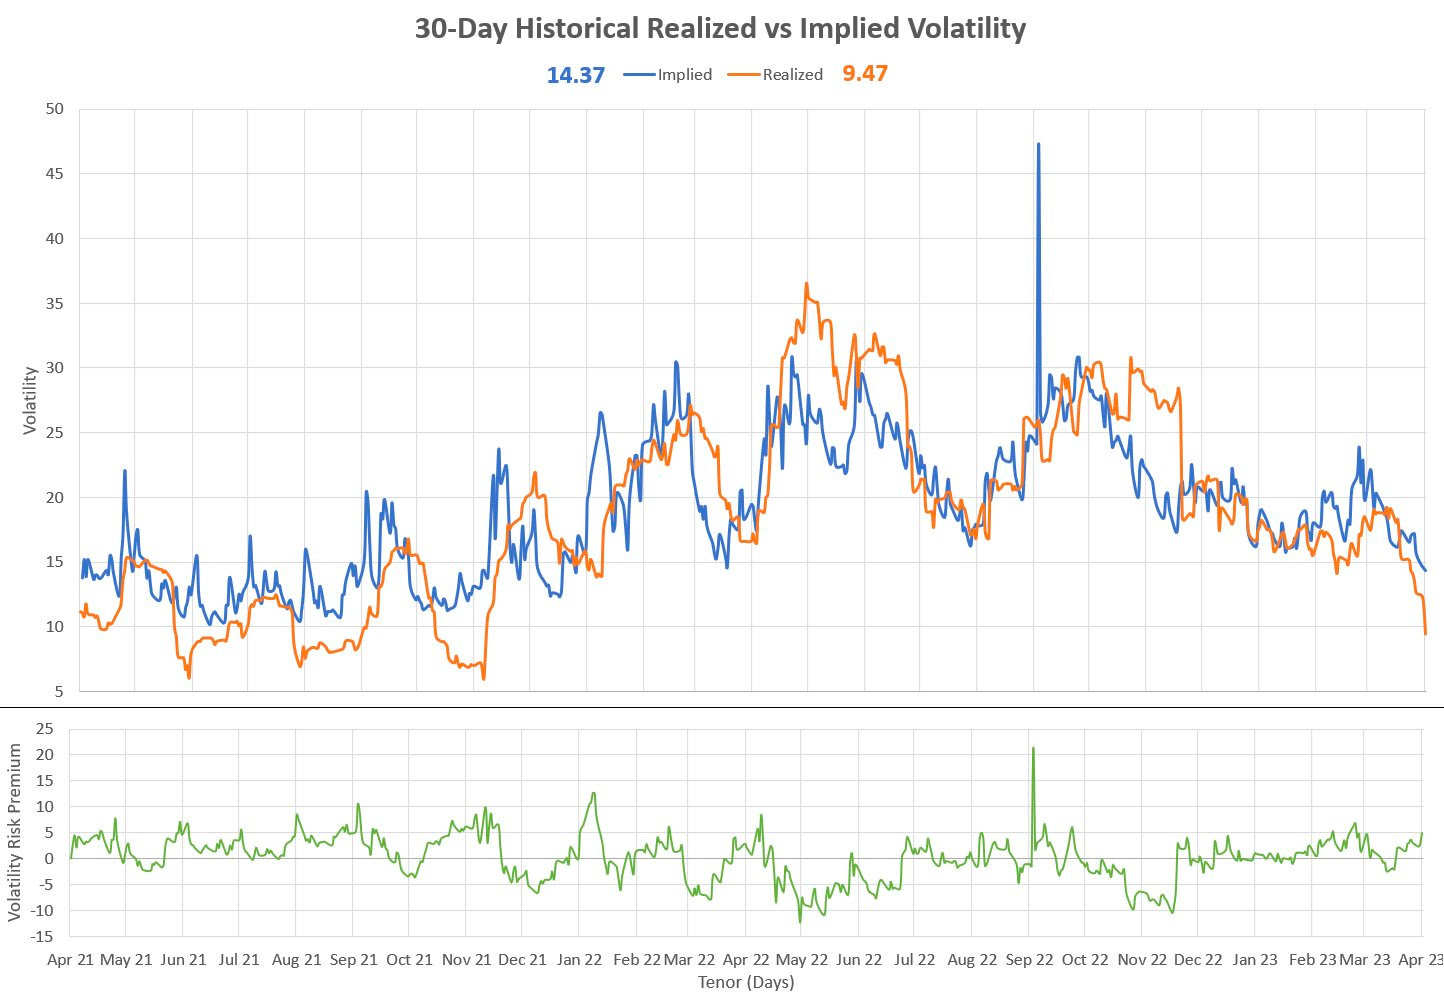
Macro uncertainties have some frightened, hence “equity volatility present[ing] itself in a much stronger way,” said The Ambrus Group’s Kris Sidial. For this equity volatility (i.e., implied volatility or IVOL) to continue performing well, realized volatility or RVOL (i.e., the movement that actually happens and is not implied by traders’ supply and demand of options) must shift and stay higher as well (note: in many ways RVOL and IVOL reinforce the other during extreme greed or fear events.

Though big options expiries (OpEx) “may help unpin the market” and manifest market downside and follow-through in RVOL needed to keep IVOL performing, the window for this to happen may be closing.

The monetization of profitable options structures, as well as volatility compression and options decay, may result in counterparties buying back their short stock and/or futures hedges (to the short put positions they have on), thus boosting the market (particularly the depressed and rate-sensitive Nasdaq 100).

If the market rallies, that has the potential to “make things hotter” in the economy, explained Kai Volatility’s Cem Karsan, which emboldens policymakers to make and keep policy tighter. So, barring follow-through to the downside, any equity market upside that arises is likely limited, as a disclaimer, some think.

Apologies for rushing this section, today. More on positioning in the coming letters.

Technical

As of 8:10 AM ET, Monday’s regular session (9:30 AM – 4:00 PM ET), in the S&P 500, is likely to open in the middle part of a negatively skewed overnight inventory, inside of the prior day’s range, suggesting a limited potential for immediate directional opportunity.

The S&P 500 pivot for today is $3,946.75. 

Key levels to the upside include $3,970.75, $3,994.25, and $4,026.75.

Key levels to the downside include $3,912.25, $3,891.00, and $3,868.25.

Disclaimer: Click here to load the updated key levels via the web-based TradingView platform. New links are produced daily. Quoted levels likely hold barring an exogenous development.

Graphic: 65-minute profile chart of the Micro E-mini S&P 500 (FUTURE: /MES) bottom-middle.

Definitions

Volume Areas: Markets will build on areas of high-volume (HVNodes). Should the market trend for a period of time, this will be identified by a low-volume area (LVNodes). The LVNodes denote directional conviction and ought to offer support on any test.

If participants auction and find acceptance in an area of a prior LVNode, then future discovery ought to be volatile and quick as participants look to the nearest HVNodes for more favorable entry or exit.

POCs: Areas where two-sided trade was most prevalent in a prior day session. Participants will respond to future tests of value as they offer favorable entry and exit.


About

The author, Renato Leonard Capelj, spends the bulk of his time at Physik Invest, an entity through which he invests and publishes free daily analyses to thousands of subscribers. The analyses offer him and his subscribers a way to stay on the right side of the market. 

Separately, Capelj is an accredited journalist with past works including interviews with investor Kevin O’Leary, ARK Invest’s Catherine Wood, FTX’s Sam Bankman-Fried, North Dakota Governor Doug Burgum, Lithuania’s Minister of Economy and Innovation Aušrinė Armonaitė, former Cisco chairman and CEO John Chambers, and persons at the Clinton Global Initiative.

Connect

Direct queries to renato@physikinvest.com. Find Physik Invest on TwitterLinkedInFacebook, and Instagram. Find Capelj on TwitterLinkedIn, and Instagram. Only follow the verified profiles.

Calendar

You may view this letter’s content calendar at this link.

Disclaimer

Do not construe this newsletter as advice. All content is for informational purposes. Capelj and Physik Invest manage their own capital and will not solicit others for it.

Categories
Commentary

Daily Brief For March 14, 2023

Physik Invest’s Daily Brief is read free by thousands of subscribers. Join this community to learn about the fundamental and technical drivers of markets.

Graphic updated 6:30 AM ET. Sentiment Neutral if expected /MES open is inside of the prior day’s range. /MES levels are derived from the profile graphic at the bottom of this letter. Click here for the latest levels. SqueezeMetrics Dark Pool Index (DIX) and Gamma (GEX) with the latter calculated based on where the prior day’s reading falls with respect to the MAX and MIN of all occurrences available. A higher DIX is bullish. The lower the GEX, the more (expected) volatility. Click to learn the implications of volatility, direction, and moneyness. Breadth reflects a reading of the prior day’s NYSE Advance/Decline indicator. The CBOE VIX Volatility Index (INDEX: VVIX) reflects the attractiveness of owning volatility. UMBS prices via MNDClick here for the economic calendar.

Administrative

A long(er) letter, today. Through the end-of-this week, newsletters may be shorter due to the letter writer’s commitments. Take care!

Fundamental

Yesterday’s letter focused on the SVB Financial Group (NASDAQ: SIVB) failure, albeit with an optimistic tone. In short, the bank could not make good on fast accelerating withdrawals. Read more here.

According to one TechCrunch article, the likes of Founders Fund “reportedly advised their portfolio companies … to withdraw their money, … [and], if everybody is telling each other that SVB is in trouble, that will be a challenge,” as it was.

Graphic: Retrieved from @Citrini7. In the worst-case scenario, it was likely that uninsured depositors at SIVB would have received $0.80 on each dollar barring a bailout.

Authorities later put forth emergency measures guaranteeing all deposits. The effort shored up confidence in the banking system and markets strengthened, though some regional names such as First Republic Bank (NYSE: FRC) continued trading weak. In FRC’s case, the Federal Reserve’s (Fed) new bailout facility does not help. As former Fed trader Joseph Wang explains, “you need Treasuries and Agency MBS to tap the facility, and [FRC] barely owns any.”

Graphic: Retrieved via Joseph Wang.

Anyways, as yesterday’s letter briefly mentioned, expectations on the path of Fed Funds shifted. Traders put the terminal/peak rate at 5.00-5.25%, down from 5.50-5.75%, while pricing cuts after spring. Previously, no cuts were expected in 2023.

Graphic: Retrieved from CME Group Inc’s (NASDAQ: CME) FedWatch Tool.

Some Treasury yields fell spectacularly, too, …

Graphic: Retrieved from Bloomberg.

… on par with those declines experienced amidst major crises, at least in the case of the 2-year.

Graphic: Retrieved from Bloomberg.

Measures of US Treasury yield volatility implied by options (i.e., bets or hedges on or against market movement) adjusted higher, accordingly. This is often a harbinger of equity market volatility.

Graphic: Merrill Lynch Option Volatility Estimate retrieved from TradingView

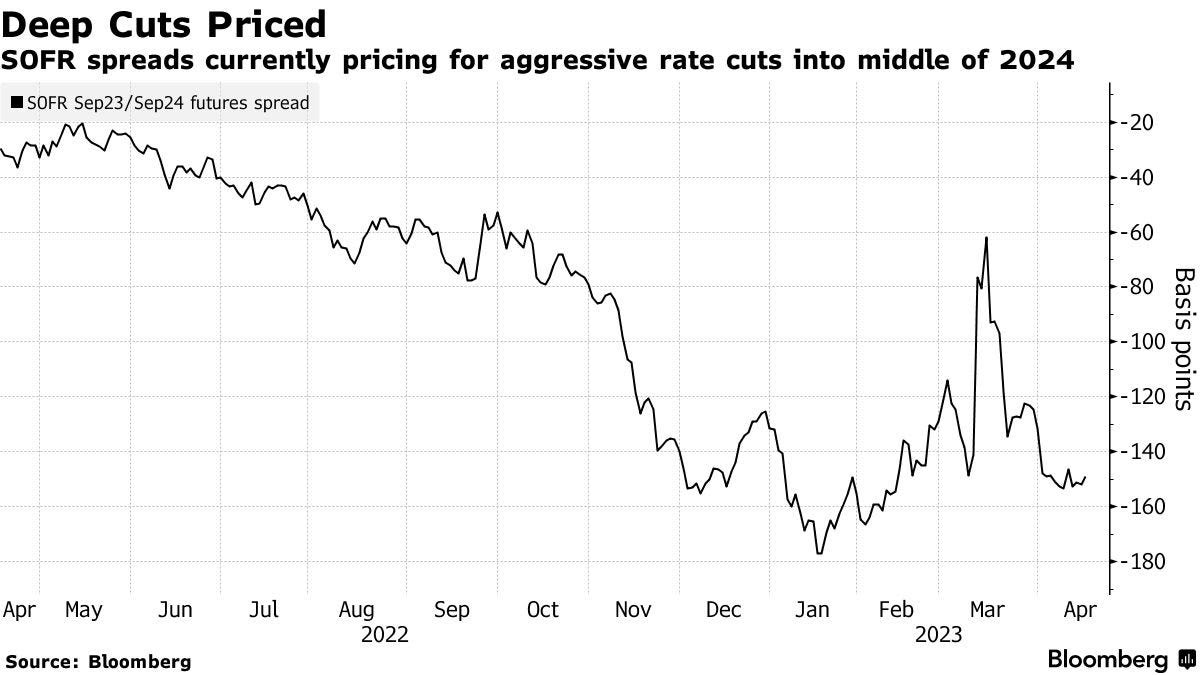
Call options on the three-month Secured Overnight Financing Rate (FUTURE: SOFR) future (i.e., bets on interest rates falling in the future) paid handsomely.

For instance, bull call spreads that expire in December 2023 (e.g., BUY +1 VERTICAL /SR3Z23:XCME 1/2500 DEC 23 /SR3Z23:XCME 96/97 CALL @.0375) increased in value by about 650.00% to $0.33 (i.e., $750.00 per contract).

Graphic: Retrieved via TradingView. Three-month SOFR Future (December 2023). When SOFR is at a lower (higher) number, the market is pricing an increase (decrease) in interest rates. Participants put the December 2023 SOFR rate at 100-96.145 = 3.855%.

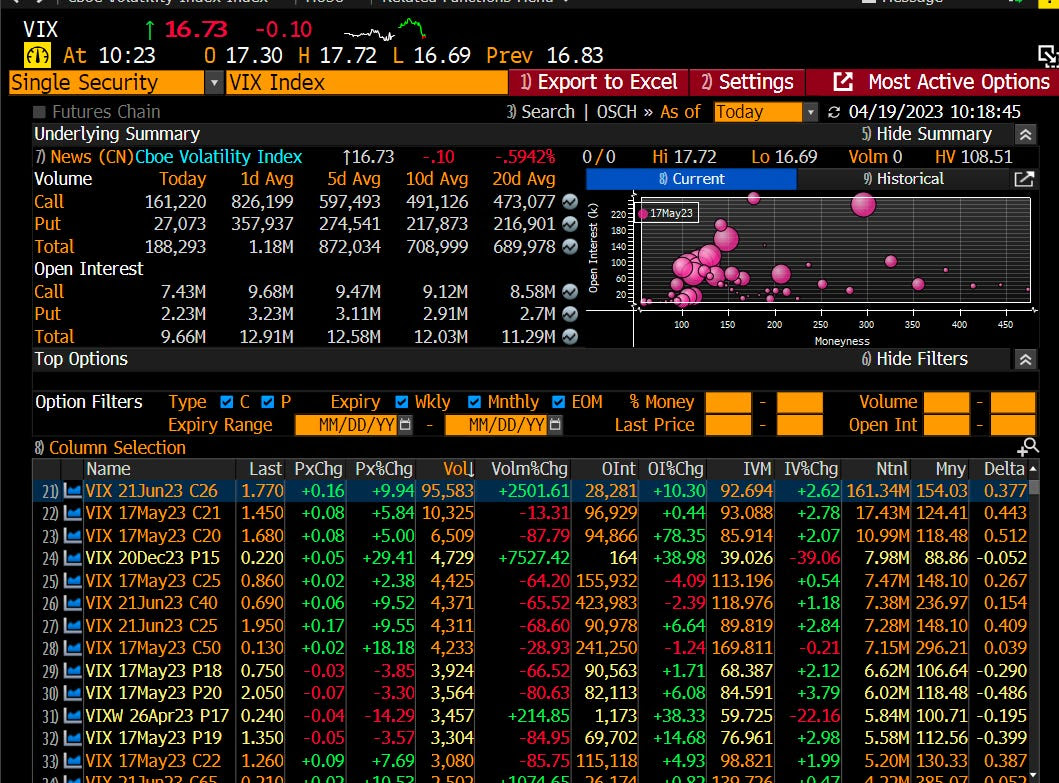
In the equity space, some readers may have caught some commentary on spot-vol beta in the VIX complex strengthening like we have not seen in a while, a nod to the harbinger of equity market volatility remark a few paragraphs higher.

Recommended Readings:

  • Read: The Ambrus Group’s Kris Sidial on two major risks investors should watch out for in 2023. In short, volatility’s sensitivity to underlying prices (spot-vol beta) was low, and Sidial cast blame, in part, on commodity trading advisors and strong volatility supply.
  • Read: Simplify Asset Management’s Michael Green on using option and bond overlays to hedge big uncertainties facing markets. Following 2022, investors swapped poor-performing long-dated volatility exposures for ones with bounded risk and less time to expiry, hence the increase in 0 DTE trading.
Graphic: Retrieved from Piper Sandler’s (NYSE: PIPR) Danny Kirsch.

This spot-vol beta remark suggests that (at least some of) the volatility in rates, as well as certain small pockets of the equity and crypto market, manifested demand for crash protection in the S&P 500, “which feeds back into VIX,” one explanation put well.

Graphic: Retrieved from Piper Sandler’s (NYSE: PIPR) Danny Kirsch. “[Last] week finally got a bit of explosiveness in VIX as fixed strike volatility got bid. This is VIX generic front month future and move in SPX. Last time it really “paid” to have VIX upside was Jan of 2022 (point in upper left corner).”

Notwithstanding, for these options to keep their value and continue to perform well, realized volatility (RVOL) must pick up substantially, which is not likely.

Unlimited’s Bob Elliott comments: “the bond market is pricing a broad-based credit crunch, … [and though] it’s not crazy for the Fed to slow down here given the current uncertainty,” odds are financial problems are contained and the Fed moves forward with its mission to get (and keep) inflation down.

Graphic: Retrieved from Fabian Wintersberger. Just as the “monetary expansion supported the rise in equity and bond prices in January.”

Consequently, “the pricing of Dec23s and 5yr BEIs makes no sense,” Elliott adds. This means the example SOFR trade above is/was ripe for some monetization, and equity volatility must be dealt with carefully (i.e., price movements must be higher than they are now which would be difficult given that authorities/Fed do not want liquidations).

In support of siding with the less extreme take, we paraphrase Kai Volatility’s Cem Karsan who says that for years prior to the 2007-2008 turmoil, macro tourists were calling for a crash.

For markets to crumble, there would have to be an exogenous event far greater in implications than what just transpired with SIVB over the weekend. With odds that such turmoil doesn’t happen soon, coupled with participants easing up on their long-equity exposure (i.e., selling stock and not needing to hedge, hence the statement that owning equity volatility must be dealt with carefully), RVOL is likely to stay contained. That’s not to say that this volatility observed in the rates market can’t persist. It’s also not to say that markets can’t continue to trade lower (in fact, with interest rates rising and processes like quantitative tightening challenging bank liquidity, there is less incentive for investors to reside in lower-yielding equities). It just means that, barring some exogenous event, the market remains intact.

Graphic: Retrieved from Jack Farley. “Silicon Valley Bank owns >$80 Billion of Mortgage-Backed Securities (MBS), a market that is ‘more prone to bouts of volatility’ because ‘small investors & leveraged funds have become the main buyers’ as the Fed & banks step away from market, according to Dec 2022 BIS report.”

Positioning

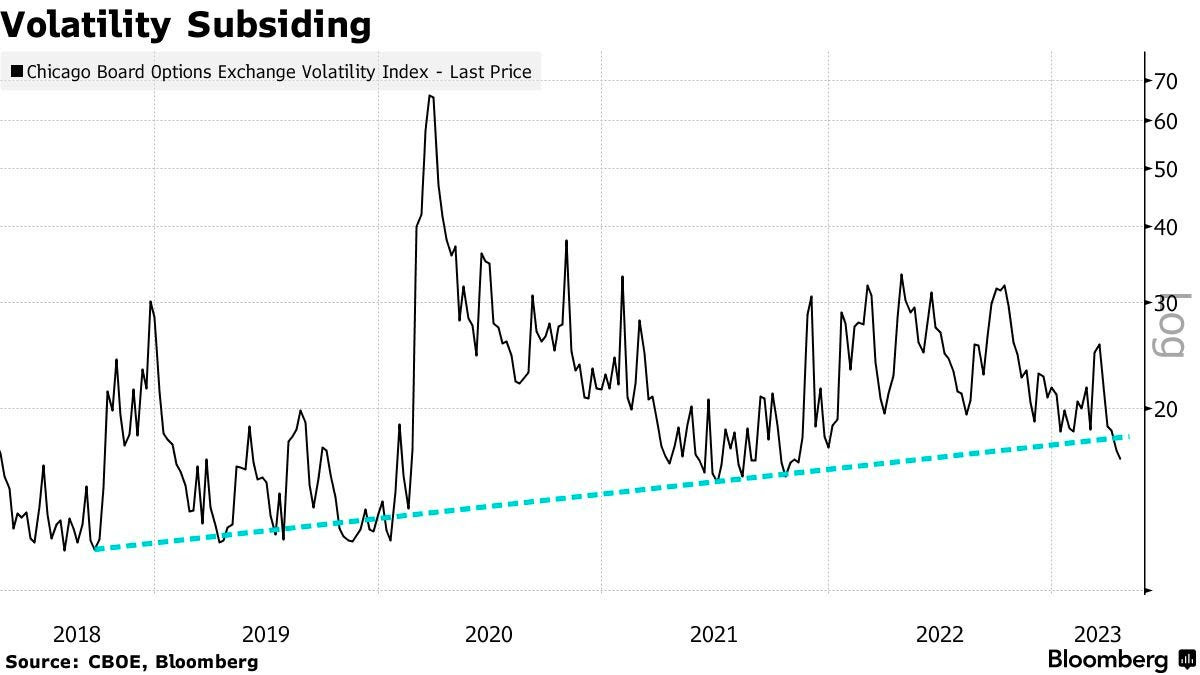
Following important events like the release of the Consumer Price Index (CPI) today, the compression of implied volatility or IVOL, coupled with the nearing of big options expirations (OpEx), sets the market up for potential short bursts of strength heading into the end of the month and next month.

Graphic: Retrieved from Bloomberg. Inflation has been well within forecasts.

A quick comparison of the Russell 2000 (INDEX: RUT) and Nasdaq 100 (INDEX: NDX) suggests this options-induced strength may help keep the recent re-grossing theme intact. The compression of wound IVOL and passage of OpEx, coupled with the still-live re-grossing theme, may put a floor under equities.

Graphic: Retrieved from TradingView. Orange = RUT. Candles = NDX. Note the weakness in RUT. Note the strength of the Nasdaq relative to the Russell.

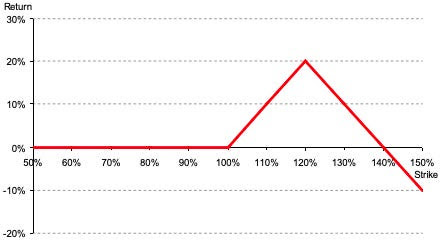
To play, one could place a portion of their cash in money market funds or T-bill ETFs or box spreads, for instance, while allocating another portion to leverage potential by way of some call options structures that use one or more short options to help bring down the cost of a long option that is closer to current market prices (e.g., a bull call spread or short ratio call spread). To note, based on options prices as of this writing, it may be too early to enter call structures (i.e., too expensive given the context).

 Technical

As of 6:30 AM ET, Tuesday’s regular session (9:30 AM – 4:00 PM ET), in the S&P 500, is likely to open in the middle part of a balanced overnight inventory, inside of the prior day’s range, suggesting a limited potential for immediate directional opportunity.

The S&P 500 pivot for today is $3,904.25. 

Key levels to the upside include $3,921.75, $3,945.00, and $3,970.75.

Key levels to the downside include $3,884.75, $3,868.25, and $3,847.25.

Disclaimer: Click here to load the updated key levels via the web-based TradingView platform. New links are produced daily. Quoted levels likely hold barring an exogenous development.

Graphic: 65-minute profile chart of the Micro E-mini S&P 500 Futures.

Definitions

Volume Areas: Markets will build on areas of high-volume (HVNodes). Should the market trend for a period of time, this will be identified by a low-volume area (LVNodes). The LVNodes denote directional conviction and ought to offer support on any test.

If participants auction and find acceptance in an area of a prior LVNode, then future discovery ought to be volatile and quick as participants look to the nearest HVNodes for more favorable entry or exit.

POCs: Areas where two-sided trade was most prevalent in a prior day session. Participants will respond to future tests of value as they offer favorable entry and exit.

Volume-Weighted Average Prices (VWAPs): A metric highly regarded by chief investment officers, among other participants, for quality of trade. Additionally, liquidity algorithms are benchmarked and programmed to buy and sell around VWAPs.


About

The author, Renato Leonard Capelj, spends the bulk of his time at Physik Invest, an entity through which he invests and publishes free daily analyses to thousands of subscribers. The analyses offer him and his subscribers a way to stay on the right side of the market. 

Separately, Capelj is an accredited journalist with past works including interviews with investor Kevin O’Leary, ARK Invest’s Catherine Wood, FTX’s Sam Bankman-Fried, North Dakota Governor Doug Burgum, Lithuania’s Minister of Economy and Innovation Aušrinė Armonaitė, former Cisco chairman and CEO John Chambers, and persons at the Clinton Global Initiative.

Connect

Direct queries to renato@physikinvest.com. Find Physik Invest on TwitterLinkedInFacebook, and Instagram. Find Capelj on TwitterLinkedIn, and Instagram. Only follow the verified profiles.

Calendar

You may view this letter’s content calendar at this link.

Disclaimer

Do not construe this newsletter as advice. All content is for informational purposes. Capelj and Physik Invest manage their own capital and will not solicit others for it.

Categories
Commentary

Daily Brief For March 10, 2023

Physik Invest’s Daily Brief is read free by thousands of subscribers. Join this community to learn about the fundamental and technical drivers of markets.

Graphic updated 7:15 AM ET. Sentiment Risk-Off if expected /MES open is below the prior day’s range. /MES levels are derived from the profile graphic at the bottom of this letter. Click here for the latest levels. SqueezeMetrics Dark Pool Index (DIX) and Gamma (GEX) with the latter calculated based on where the prior day’s reading falls with respect to the MAX and MIN of all occurrences available. A higher DIX is bullish. The lower the GEX, the more (expected) volatility. Click to learn the implications of volatility, direction, and moneyness. Breadth reflects a reading of the prior day’s NYSE Advance/Decline indicator. The CBOE VIX Volatility Index (INDEX: VVIX) reflects the attractiveness of owning volatility. UMBS prices via MNDClick here for the economic calendar.

Administrative

Yesterday’s newsletter put forth the writer’s discussion with Simplify’s Mike Green, fresh after he spoke at Exchange Miami. The letter covered a lot, albeit in a messy way, given some unforeseen obligations. Today, we clarify those narratives for you. Hopefully, you enjoy it, and take care!
Fundamental

In summary, Simplify’s Michael Green trades 60/40-looking portfolios on macroeconomic signals while using derivative exposures to reduce volatility and amplify profit potential (e.g., responding to economic data in real-time by trading options on the CME Group Inc’s [NASDAQ: CME] Eurodollar [FUTURE: /GE], a tool to express views on future interest rates).

His conversation with your letter writer covered a variety of topics including the reliability of data and what that means for his active management, derivatives trading, strength potential in markets, as well as what he’s optimistic about. Here’s what you need to know.

1 – Green explains that his preferred macro guides for decision-making are unclear. He explains that traditional adjustments “ranging from seasonality to the birth-death models used in smoothing employment reports” are in question, and he jokes that developed market data sets are approaching emerging market data sets in terms of quality.

2 – Green reflects on 2022 noting options, colloquially referred to as volatility, were a big underperformer. “One-year variance swaps or implied volatility on an at-the-money S&P 500 put option would trade somewhere in the neighborhood of 25 to 30%,” he explains. “That implies a level of daily price movement that is difficult to achieve.”

Having learned their lesson, in 2023 investors swapped long-dated volatility exposures for ones with bounded risk (e.g., Bear Put Spread) and less time to expiry (e.g., 0 DTE).

Graphic: Retrieved from Goldman Sachs Group Inc (NYSE: GS).

Though both may leave counterparties with less risk, if news shocks the market far one way, market movements may become exaggerated when investors, and counterparties accordingly, scramble to adjust their risk.

Major Wall Street players and clearing houses have, too, just announced an investigation into the risks such activity poses as well.

Up until now, however, the activity has manifested a push-and-pull, mean-reverting-type action; investors lean short volatility in the morning and long volatility in the afternoon which, combined, tends to mute price action.

Graphic: Retrieved from Bank of America Corporation (NYSE: BAC).

Say one morning an “investor sells call options and a dealer receives them,” Green puts forth as an example. “The dealer will hedge their long call position by selling futures which will pressure the market and result in the options prices collapsing in value.”

To re-hedge falling options prices, “dealers have to buy back their futures exposure and this pushes the markets upward. This is the pattern that’s been playing out over and over again. It’s weakness in the morning followed by strength in the afternoon.”

Though this is a very smart exposure to have, Green says volatility that’s longer-dated is cheap and, when an eventual shock occurs, its payout may more than justify its cost, particularly as the outlook for equities, bonds, and commodities further blurs.

Graphic: Retrieved from Goldman Sachs Group Inc (NYSE: GS) via The Market Ear.

3 – Despite still-robust appearing economic data, Green sees clear signs the economy is starting to deteriorate. 

Graphic: Retrieved from Bloomberg. “If the unemployment data this week is very strong then you’ve got 50 basis points back on the table,” explained Bob Michele, the chief investment officer of JPMorgan Asset Management. “But that is a pretty high hurdle to get to once you’ve down-shifted to 25 basis points.”

“We’re seeing cracks in bubbles like commercial real estate” and risk assets including crypto, presently maintained by a lack of inventory or supply that’s tied up in the bankruptcy proceedings of FTX (CRYPT0: FTT) and Voyager Digital Ltd (ex-OTC: VYGVF), of all things.

Graphic: Retrieved from JPMorgan Chase & Co (NYSE: JPM) via The Market Ear. “Excess liquidity is being withdrawn at an accelerating pace.”

“The question is whether higher interest rates ultimately drive a fraction of the market into distress with forced transactions,” Green wonders, pointing to the likes of Blackstone Inc (NYSE: BX) and Brookfield Corp (NYSE: BN) handing in keys to properties. “It takes one person being in distress to set a new clearing price which, in turn, changes valuations for everybody, and makes it more difficult to qualify for things like mortgages.”

4 – Looking forward, over the short-term at least, Green says inflation is likely to trend higher for longer, particularly with monetary policy inspiring fiscal action and sparking off geopolitics.

“The world’s growing materially slower and manufacturing capacity, which is spreading around the world, requires labor and investment, which could be inflationary in the short-run,” Green puts forth. Traditionally, “lower rates and costs enable added capacity and a predictable rebound in consumption. However, we’re driving a stake through the vampire’s heart, now, and … there’s the multiplier effect driving fiscal policy, too.”

Graphic: Retrieved from CME Group Inc’s (NASDAQ: CME) FedWatch Tool. The terminal (peak) rate sits at 5.50-5.75%.

5 – In response to uncertainty, investors can park cash in Treasury bonds, as well as allocate some capital to volatility “to introduce a degree of convexity,” risking only the premium paid. Alternatively, investors can take a more optimistic long view and position in innovations like artificial intelligence or next-generation energy production.

Graphic: Retrieved from Goldman Sachs Group Inc (NYSE: GS) via The Market Ear. Investors are not concerned with tail risk.

“I’m optimistic about human innovation and the rise of AI, … as well as higher energy prices creating the impetus for tremendous innovations in energy generation that have the potential to lift us out of this period of perceived scarcity if we allow ourselves to embrace it.”

Technical

As of 8:00 AM ET, Friday’s regular session (9:30 AM – 4:00 PM ET), in the S&P 500, is likely to open in the upper part of a negatively skewed overnight inventory, outside of the prior day’s range, suggesting a potential for immediate directional opportunity.

The S&P 500 pivot for today is $3,947.00. 

Key levels to the upside include $3,965.25, $3,979.25, and $4,004.75.

Key levels to the downside include $3,921.75, $3,891.00, and $3,857.25.

Disclaimer: Click here to load the updated key levels via the web-based TradingView platform. New links are produced daily. Quoted levels likely hold barring an exogenous development.

Graphic: 65-minute profile chart of the Micro E-mini S&P 500 Futures (bottom middle) and market internals as taught by Peter Reznicek.

Definitions

Volume Areas: Markets will build on areas of high-volume (HVNodes). Should the market trend for a period of time, this will be identified by a low-volume area (LVNodes). The LVNodes denote directional conviction and ought to offer support on any test.

If participants auction and find acceptance in an area of a prior LVNode, then future discovery ought to be volatile and quick as participants look to the nearest HVNodes for more favorable entry or exit.

POCs: Areas where two-sided trade was most prevalent in a prior day session. Participants will respond to future tests of value as they offer favorable entry and exit.

MCPOCs: Denote areas where two-sided trade was most prevalent over numerous sessions. Participants will respond to future tests of value as they offer favorable entry and exit.


About

The author, Renato Leonard Capelj, spends the bulk of his time at Physik Invest, an entity through which he invests and publishes free daily analyses to thousands of subscribers. The analyses offer him and his subscribers a way to stay on the right side of the market. 

Separately, Capelj is an accredited journalist with past works including interviews with investor Kevin O’Leary, ARK Invest’s Catherine Wood, FTX’s Sam Bankman-Fried, North Dakota Governor Doug Burgum, Lithuania’s Minister of Economy and Innovation Aušrinė Armonaitė, former Cisco chairman and CEO John Chambers, and persons at the Clinton Global Initiative.

Connect

Direct queries to renato@physikinvest.com. Find Physik Invest on TwitterLinkedInFacebook, and Instagram. Find Capelj on TwitterLinkedIn, and Instagram. Only follow the verified profiles.

Calendar

You may view this letter’s content calendar at this link.

Disclaimer

Do not construe this newsletter as advice. All content is for informational purposes. Capelj and Physik Invest manage their own capital and will not solicit others for it.

Categories
Commentary

Daily Brief For March 9, 2023

Physik Invest’s Daily Brief is read free by thousands of subscribers. Join this community to learn about the fundamental and technical drivers of markets.

Graphic updated 8:30 AM ET. Sentiment Neutral if expected /MES open is inside of the prior day’s range. /MES levels are derived from the profile graphic at the bottom of this letter. Click here for the latest levels. SqueezeMetrics Dark Pool Index (DIX) and Gamma (GEX) with the latter calculated based on where the prior day’s reading falls with respect to the MAX and MIN of all occurrences available. A higher DIX is bullish. The lower the GEX, the more (expected) volatility. Click to learn the implications of volatility, direction, and moneyness. Breadth reflects a reading of the prior day’s NYSE Advance/Decline indicator. The CBOE VIX Volatility Index (INDEX: VVIX) reflects the attractiveness of owning volatility. UMBS prices via MNDClick here for the economic calendar.

Fundamental

Last year, Simplify Asset Management’s Michael Green, an active manager focused on creating portfolios mimicking traditional constructions like 60/40, albeit with less realized volatility (RVOL), thought a dot-com-type collapse was unfolding under the surface of the indexes.

In an interview for an upcoming Benzinga article, Green explained to your letter writer that he maintains today’s action is similar to the early 2000s.

Prior to 1999, “many of the early winners in the dot-com cycle had already started to falter and, as we came into the market peak for the Nasdaq (INDEX: NDX) in March of 2000, the Nasdaq was much higher and the market was much more narrow,” Green says. “This is 2021 into 2022.” Green adds that the S&P 500 (INDEX: SPX) correction didn’t begin until late-2000, and the homebuilder- and energy-type stocks were the ones that outperformed, as we saw in 2022.

Ultimately, a recession hit in 2001, and credit deteriorated, Green explains, revealing fraud among many high-flyers of the dot-com boom. Many were unprepared, Green adds, drawing parallels to 2022 events concerning the likes of FTX.

Graphic: Retrieved from WSJ Market Data Group.

In 2023 and beyond, Green thinks the economy and markets are set for a bumpy ride. He projects that rising interest rates cause pain for businesses that received a stay of execution in 2020 through PPP loans and subsidized borrowing.

“Many of them put in two- or three-year paper as a stopgap,” he explains. Now, due to the higher rate environment, “companies can’t refinance, so we’re seeing Blackstone Inc (NYSE: BX) and Brookfield Corp (NYSE: BN) hand in keys.”

As put in yesterday’s letter, the deterioration in markets has, in part, been “offset by a lack of inventory,” as well as the hesitancy to sell (i.e., lack of supply). However, the marginal impact of one new person “in distress … [may] set a new clearing price” that changes valuations for everybody. Green says that investors know supply will cause markets to weaken, and that is why products like Bitcoin (CRYPTO: BTC) are intact.

“If we tie up stuff in bankruptcy courts for the next three or four years, nothing will get done,” Green elaborates. “That’s part of what we’re seeing in the crypto space where part of the strength for Bitcoin is simply the absence of sellers as we navigate our way through bankruptcy on many of these entities.”

As an example, Voyager Digital Ltd (ex-OTC: VYGVF) claimants “desperately [sought] to submit a bid to prevent Bitcoin from having to be sold” because these sales would pressure prices and “increase the damage across the entire crypto universe.”

relates to Fed Minutes Show Three Weeks Is a Long Time
Graphic: Retrieved from Bank of America (NYSE: BAC) via Bloomberg.

Green went on to add his firm objection to Federal Reserve’s (Fed) policy choices noting that deterioration is threatening the “commercial real estate bubble … and residential real estate” currently afloat on a “lack of inventory.”

The “multiplier effect” will be a serious challenge for markets; monetary policy drives fiscal policy and this has an impact elsewhere on geopolitics, manufacturing, and so on (e.g., the cost of interest rates offset by credits to households, the relocation and addition of manufacturing at home and outside of China), which only serves to boost inflation over the short term and further complicate things for the Fed.

Positioning

With data very unreliable and markets fearful of a 2020-like decline, 2022 was a far more orderly year than expected.

“I think people were extremely well-hedged,” he explains. “There was a tremendous amount of exposure that had been purchased for deep out-of-the-money, relatively long-dated [put options], and that created conditions under which the volatility surface, beyond six months, was extremely elevated heading into 2022.”

Green says one-year variance swaps and implied volatility (IVOL) on at-the-money S&P 500 puts was “in the neighborhood of 25-30%, … which is very expensive … [and this] implies a level of daily price movement that is difficult to achieve.”

Consequently, investors’ hedges did not work. Green adds that “having learned their lesson from 2022, people have by and large abandoned those types of hedges and have instead moved, even as skew moves to near-record cheapness, … to spreads” and shorter-dated options (e.g., 0 DTE).

relates to Clueless Wall Street Is Racing to Size Up Zero-Day Options Boom
Graphic: Retrieved from Goldman Sachs Group Inc (NYSE: GS) via Bloomberg.

With a vast majority of these shorter-dated options exposures held short by investors, this creates conditions of suppressed volatility that can last; dealers own volatility and in hedging that, they promote mean reversion-type activity (i.e., instead of institutions writing calls against long exposure out one-month, they are writing calls against long exposure out one-day, and this supply of options has dealers pressuring the market on their initial hedging and supporting the market on later re-hedging) over the very short-term. In other words, when investors sell those calls, the dealer receives them and sells futures to hedge. This “pressures the market lower which causes … the delta of that option or replicating exposure to decline and, now, the dealers have to buy back that exposure and push the markets upward,” later, because the risk they are exposed to by that exposure has declined (i.e., lower delta). See the image below.

Graphic: Retrieved from Bank of America Corporation (NYSE: BAC).

This options activity may become problematic. If there is a gap, investors’ “scramble to hedge those positions” may lead to even larger movement, given that the market “is not prepared to provide liquidity,” generally speaking.

Green suggests that investors can side-step a lot of the turmoil by allocating some or all of their portfolio to bonds. Any cash remaining could be used to amplify portfolio returns in a fixed-risk manner (e.g., buy bond and SPX options and options spreads).

More detail to come in the next sessions. Hope you enjoyed this (rushed) letter.

Technical

As of 8:30 AM ET, Thursday’s regular session (9:30 AM – 4:00 PM ET), in the S&P 500, is likely to open in the lower part of a negatively skewed overnight inventory, inside of the prior day’s range, suggesting a limited potential for immediate directional opportunity.

The S&P 500 pivot for today is $3,988.25. 

Key levels to the upside include $3,999.25, $4,013.00, and $4,024.75.

Key levels to the downside include $3,975.25, $3,965.25, and $3,947.00.

Disclaimer: Click here to load the updated key levels via the web-based TradingView platform. New links are produced daily. Quoted levels likely hold barring an exogenous development.

Graphic: 65-minute profile chart of the Micro E-mini S&P 500 Futures.

About

The author, Renato Leonard Capelj, spends the bulk of his time at Physik Invest, an entity through which he invests and publishes free daily analyses to thousands of subscribers. The analyses offer him and his subscribers a way to stay on the right side of the market. 

Separately, Capelj is an accredited journalist with past works including interviews with investor Kevin O’Leary, ARK Invest’s Catherine Wood, FTX’s Sam Bankman-Fried, North Dakota Governor Doug Burgum, Lithuania’s Minister of Economy and Innovation Aušrinė Armonaitė, former Cisco chairman and CEO John Chambers, and persons at the Clinton Global Initiative.

Connect

Direct queries to renato@physikinvest.com. Find Physik Invest on TwitterLinkedInFacebook, and Instagram. Find Capelj on TwitterLinkedIn, and Instagram. Only follow the verified profiles.

Calendar

You may view this letter’s content calendar at this link.

Disclaimer

Do not construe this newsletter as advice. All content is for informational purposes. Capelj and Physik Invest manage their own capital and will not solicit others for it.

Categories
Commentary

Daily Brief For March 1, 2023

Physik Invest’s Daily Brief is read free by thousands of subscribers. Join this community to learn about the fundamental and technical drivers of markets.

Graphic updated 9:25 AM ET. Sentiment Risk-Off if expected /MES open is below the prior day’s range. /MES levels are derived from the profile graphic at the bottom of this letter. Click here for the latest levels. SqueezeMetrics Dark Pool Index (DIX) and Gamma (GEX) with the latter calculated based on where the prior day’s reading falls with respect to the MAX and MIN of all occurrences available. A higher DIX is bullish. The lower the GEX, the more (expected) volatility. Click to learn the implications of volatility, direction, and moneyness. Breadth reflects a reading of the prior day’s NYSE Advance/Decline indicator. The CBOE VIX Volatility Index (INDEX: VVIX) reflects the attractiveness of owning volatility. UMBS prices via MNDClick here for the economic calendar.

Administrative

Pardon, the delay. Also, the levels in this letter are a little messy to the downside. Too many confluences. Will clear them up over the coming days. Have a great day!

Fundamental

In the face of contrarian economic indications, based on CME Group Inc’s (NASDAQ: CME) FedWatch Tool, traders’ activity in the Fed Fund Futures shows the terminal rate peaking at 5.25-5.50%. Expectations for easing are pushed out to 2024, though at a less steep rate. This context, coupled with the prospects of slower economic growth, presents uninspiring realities for investors.

Graphic: Retrieved from CME Group Inc’s (NASDAQ: CME) FedWatch Tool.

Consequently, the equity-bond correlation break is set to persist.

Graphic: Retrieved from Credit Suisse Group AG (NYSE: CS).

Quoting a Bloomberg analysis of Credit Suisse’s Global Investment Returns Yearbook, “[b]onds, equities and real estate tend to be negatively correlated with inflation,” while “only commodities had a positive correlation, making them the only true hedge.”

However, commodities are “often susceptible to deep and lengthy drawdowns … in periods of disinflation” and falling growth expectations. Though commodities are a hedge against inflation, they aren’t a hedge against (rising odds of) recession.

Graphic: Retrieved from Credit Suisse Group AG (NYSE: CS).

So, interest rates are likely to rise and stay higher for longer. 

Graphic: Retrieved from Bridgewater Associates LP. “Nominal spending on services has continued to grow at a rapid clip of about 6% annualized. Real and nominal demand for goods has been gradually weakening. This shift in the mix of demand has implications. Services spending is an upward pressure on employment and wages, while weak goods demand has a more pronounced impact on listed company sales.”

Equities, which are particularly sensitive to interest rates, are likely to weaken despite economic and earnings growth which is set to fall (i.e., close to zero earnings growth).

Graphic: Retrieved January 5, 2023, from Nasdaq Inc’s (NASDAQ: NDAQ) Phil Mackintosh.

Quantitative tightening or QT (i.e., the flow of capital out of capital markets and an asset headwind), which has been offset by the running off of the Treasury General Account and injecting liquidity into markets (i.e., TGA runoff increases the room banks have to lend and finance trading activities) in the face of the debt ceiling issue, is set to accelerate and compound the rising rate impact.

Graphic: Via Physik Invest. Data compiled by @jkonopas623. Fed Balance Sheet data, here. Treasury General Account Data, here. Reverse Repo data, here. NL = BS – TGA – RRP.

In light of rates and QT risk asset headwind, as well as slowing growth and inflation headwind to bonds and commodities, how does one protect their portfolio? As The Ambrus Group’s Kris Sidial explains, “[e]ven if inflation continues, the rate at which it rises won’t be the same. Due to this, CTA exposures likely will not perform as well as they did in 2022, and that’s why you may see more opportunities in the volatility space … [where] we can get cheap exposure to convexity.”

Graphic: Retrieved from Bloomberg via Tier1Alpha. “[T]he correlation between bond yields and equities, has begun to turn higher from a negative level. Remember that a negative correlation between bond yields and equity prices means equities go lower as bond prices go lower, defeating the historical diversification benefits of a 60/40-type portfolio.  Historically, this rotation has been associated with a period of LOWER returns, but it’s important to emphasize that this is because these periods are associated with Fed-induced slowdowns. Whether 2023 follows the same pattern remains to be seen.”

Please refer to past letters for trade examples. Though such trades may not be as attractive to enter now, they are attractive to keep on for longer.

Graphic: Retrieved from Nomura Holdings Inc (NYSE: NMR). Downside trades are rather attractive now in the absence of hedging demands in longer-dated protection convex in price and volatility. Naive measures like the Cboe VIX Volatility (INDEX: VVIX), as well as the graphic above, allude to the little demands for convexity and a declining sensitivity of the VIX with respect to changes in share prices.

If, as Bridgewater Associates put it, there is another stage to tightening “marked either by an economic downturn or failure to meet the inflation target, prompting more tightening,” risk assets will perform poorly and this letter’s trade examples are likely to protect portfolios well until assets appear attractive enough to buy again.

Graphic: Retrieved from NDR via Macro Ops.

Positioning

SpotGamma explains that more of the same (i.e., back-and-forth consolidation and a grind higher or lower) can be expected until some macroeconomic catalysts solicit demand for upside or downside protection and, accordingly, counterparty hedging pressures catalyze a far-reaching movement. 

As an aside, “With IV at already low levels, the bullish impact of it falling further is weak, hence the SPX trending lower all the while IV measures (e.g., VIX term structure) have shifted markedly lower since last week. If IV was at a higher starting point, its falling would work to keep the market in a far more positive/bullish stance.”

Graphic: VIX Term Structure retrieved from VIX Central via The Market Ear.

Consequently, “if traders enter the market and demand protection, particularly that which is farther-dated, the bearish effect of rising IV will far outweigh the bullish effect of it falling. This will add to the underlying/fundamental pressure we see building via weak price action.”

Technical

As of 9:20 AM ET, Wednesday’s regular session (9:30 AM – 4:00 PM ET), in the S&P 500, is likely to open in the lower part of a positively skewed overnight inventory, outside of the prior day’s range, suggesting a potential for immediate directional opportunity.

The S&P 500 pivot for today is $3,965.25. 

Key levels to the upside include $3,979.75, $3,992.75, and $4,003.25.

Key levels to the downside include $3,949.00, $3,927.50, and $3,908.25.

Disclaimer: Click here to load the updated key levels via the web-based TradingView platform. New links are produced daily. Quoted levels likely hold barring an exogenous development.

Graphic: 65-minute profile chart of the Micro E-mini S&P 500 Futures.

Definitions

Volume Areas: Markets will build on areas of high-volume (HVNodes). Should the market trend for a period of time, this will be identified by a low-volume area (LVNodes). The LVNodes denote directional conviction and ought to offer support on any test.

If participants auction and find acceptance in an area of a prior LVNode, then future discovery ought to be volatile and quick as participants look to the nearest HVNodes for more favorable entry or exit.

POCs: Areas where two-sided trade was most prevalent in a prior day session. Participants will respond to future tests of value as they offer favorable entry and exit.

MCPOCs: Denote areas where two-sided trade was most prevalent over numerous sessions. Participants will respond to future tests of value as they offer favorable entry and exit.


About

The author, Renato Leonard Capelj, works in finance and journalism.

Capelj spends the bulk of his time at Physik Invest, an entity through which he invests and publishes free daily analyses to thousands of subscribers. The analyses offer him and his subscribers a way to stay on the right side of the market. Separately, Capelj is an options analyst at SpotGamma and an accredited journalist.

Capelj’s past works include conversations with investor Kevin O’Leary, ARK Invest’s Catherine Wood, FTX’s Sam Bankman-Fried, North Dakota Governor Doug Burgum, Lithuania’s Minister of Economy and Innovation Aušrinė Armonaitė, former Cisco chairman and CEO John Chambers, and persons at the Clinton Global Initiative.

Connect

Direct queries to renato@physikinvest.com. Find Physik Invest on TwitterLinkedInFacebook, and Instagram. Find Capelj on TwitterLinkedIn, and Instagram. Only follow the verified profiles.

Calendar

You may view this letter’s content calendar at this link.

Disclaimer

Do not construe this newsletter as advice. All content is for informational purposes. Capelj and Physik Invest manage their own capital and will not solicit others for it.

Categories
Commentary

Daily Brief For February 16, 2023

Physik Invest’s Daily Brief is read by thousands of subscribers. You, too, can join this community to learn about the fundamental and technical drivers of markets.

Graphic updated 6:15 AM ET. Sentiment Neutral if expected /ES open is inside of the prior day’s range. /ES levels are derived from the profile graphic at the bottom of this letter. Click here for the latest levels. SqueezeMetrics Dark Pool Index (DIX) and Gamma (GEX) with the latter calculated based on where the prior day’s reading falls with respect to the MAX and MIN of all occurrences available. A higher DIX is bullish. At the same time, the lower the GEX, the more (expected) volatility. Click to learn the implications of volatility, direction, and moneyness. Breadth reflects a reading of the prior day’s NYSE Advance/Decline indicator. The CBOE VIX Volatility Index (INDEX: VVIX) reflects the attractiveness of owning volatility. UMBS price via MNDClick here for the calendar.

Positioning

In the news is quite a bit of noise surrounding ultra-short-dated options with little time to expiry. To quote Nomura Holdings Inc’s (NYSE: NMR) Charlie McElligott, the trading of these options is adding noise; “US equities are such an untradable mess right now.” 

However, your letter writer, who mainly trades complex spreads on the cash-settled indexes, thinks there has never been a better time to trade. Ultra-short-dated options enable you to express your opinion in more efficient ways. Additionally, the trade of these options, in the aggregate, can influence market movements, and this is added opportunity if you understand it.

Graphic: Retrieved from Goldman Sachs Group Inc (NYSE: GS) via Bloomberg.

Darrin Johnson, a volatility trader, recently discussed sharp ways to use these options.

Heading into some big events this week, John noted S&P 500 (INDEX: SPX) implied volatility (IVOL) was trading at ~25% on a five-day straddle. Traders could buy this structure while, in the interim, selling other structures like it “against CPI, Retail Sales, and PPI” where IVOL was higher. This would enable you to lower the cost of having positive exposure to movement or positive gamma via the five-day straddle, though this is operating on the premise “that Friday’s volatility will hold mostly steady, while the other 3 deflate.”

Moreover, the ultra-short-dated options are palatable if we will, and other traders, potentially much bigger in size, are observant of this too. The growing interest in these products (e.g., in the second half of last year, ultra-short-dated options made up more than 40% of the S&P 500’s trading volume) is growing in impact on underlying products like the SPX.

In fact, JPMorgan Chase & Co’s (NYSE: JPM) Peng Cheng found these options have an impact that “can vary from a drag of as much as 0.6% to a boost of up to 1.1%.” 

To explain, though as of late options counterparties may be playing a smaller role as “customers have taken equal and opposite sides” of positions, per SqueezeMetrics, we can naively look at there being a pool of liquidity to absorb the demand for these ultra-short-dated options which are very sensitive to time, price, and volatility. These increased sensitivities are hedged in a way that impacts this available pool of liquidity. If the trade or impact is large enough, it is transmitted onto underlying market prices. 

For instance, consider so-called meme mania and stocks like GameStop Corporation (NYSE: GME) that rocketed as traders’ interest in short-dated options demands rose. To hedge increased demand in call options, for instance, counterparties must buy the underlying stock. This demand boosts the stock.

Likewise, if traders’ consensus is that markets won’t move much until some large macroeconomic events, then their bets against market movement (i.e., sell ultra-short-dated options) will result in counterparties having more exposure to bets on market movement (i.e., positive gamma) which they will hedge in a way that reduces market movement (i.e., buy weakness or sell strength in the underlying stock). So, if traders bet against the movement, resulting in more counterparty positive gamma, then market movement is reduced due to the reaction to this positioning.

On the other hand, if traders’ consensus is that markets may move a lot, particularly to the downside, their bets on market movement (e.g., buy ultra-short-dated put) will result in counterparties having more exposure to bets against market movement (i.e., negative gamma). This demand for protection will bid options prices, particularly at the front-end of the IVOL term structure as counterparties price this demand in, and the counterparty will sell underlying to hedge. If fears are assuaged and traders no longer demand these bets on market movements, the counterparty can unwind their hedge which, in the put buying example provided, may provide a market boost, such as that which we saw immediately following the release of consumer price updates (CPI) this week; to quote Bloomberg, “[w]hen the worst didn’t happen, these hedges were unwound, helping propel a recovery in futures. It’s partly why the Cboe Volatility Index, or VIX, dropped 7% in a seemingly outsize reaction in a market when the S&P 500 ended the session basically flat.”

Graphic: Retrieved from Bloomberg.

Additionally, the re-hedging-inspired recovery was short-lived as well; the impact of ultra-short-dated options, as this letter has stated before, is short-dated. It, too, does much less to influence measures like the Cboe Volatility Index (INDEX: VIX), a floating measure of ~30 day-to-expiry SPX options trading at a fixed-strike IVOL, though it does have an impact. Thus, the dis-interest to hedge stocks traders do not own (or hedge further stocks that may be hedged) out in time, does less to boost the VIX.

Anyways, in January, your letter writer interviewed The Ambrus Group’s co-CIO Kris Sidial about major risks to markets in 2023, as well as reasons why volatility could outperform in 2023 and beyond. Some of the information in that Benzinga interview made it into this newsletter in the days following its release. 

Basically, the SPX and VIX complexes are growing and, on the other side, are a small concentrated group of market makers taking on far more exposure to risk. 

Graphic: Retrieved from Ambrus’ publicly available research.

During moments of stress, as we’ve seen in the past with GME for example, options counterparties may be unable to keep up with the demands of investors, so you get a reflexive dynamic that helps push the stock higher. “That same dynamic can happen on the way down”; counterparties will mark up options prices during intense selling. As the options prices rise, options deltas (i.e., their exposure to direction) rise and this prompts so-called bearish vanna counterparty hedging flows in the underlying.

“Imagine a scenario where [some disaster happens] and everybody starts buying 0 DTE puts. That’s going to reflexively drive the S&P lower,” Sidial said. “Take, for example, the JPMorgan collar position that clearly has an effect on the market, and people are starting to understand that effect. That’s just one fund. Imagine the whole derivative ecosystem” leaning one way.

Graphic: Retrieved from Ambrus’ publicly available research.

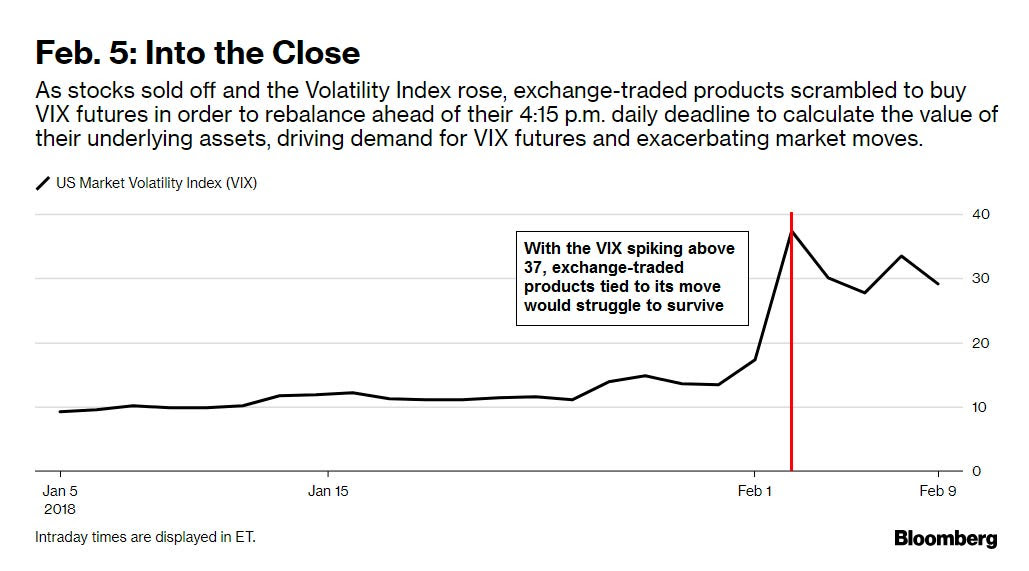
Well, that’s what JPM’s Marko Kolanovic just said is a major risk and could exacerbate market volatility. “While history doesn’t repeat, it often rhymes,” he explained, noting that the trade of ultra-short-dated options portends a Volmageddon 2.0. If you recall, in 2018, Volmageddon 1.0 turned successful long-running short-volatility trades on their head when traders who were betting against big movements in the market saw their profits erode in days.

Further, to conclude this section since your letter writer is running short on time, as Sidial said, “if you’re trading volatility, let there be an underlying catalyst for doing so.” From a “risk-to-reward perspective, … it’s a better bet to be on the long volatility side,” given “that there are so many things that … keep popping up” from a macro perspective. Check out our letters from the past weeks where we talked about protecting profits (e.g., sell call vertical to finance and buy a put vertical with a lot of time to expiry).

For Ambrus’ publicly available research, click here. Also, follow Sidial on Twitter, here. Consider reading your letter writer’s past two conversations with Sidial, as well. Here is an article on 2021 and the meme stock debacle. Here is another article talking more about Ambrus’ processes.

Technical

As of 6:15 AM ET, Thursday’s regular session (9:30 AM – 4:00 PM ET), in the S&P 500, is likely to open in the lower part of a balanced overnight inventory, inside of the prior day’s range, suggesting a limited potential for immediate directional opportunity.

The S&P 500 pivot for today is $4,153.25. 

Key levels to the upside include $4,168.75, $4,189.00, and $4,206.25.

Key levels to the downside include $4,136.25, $4,122.75, and $4,104.25.

Disclaimer: Click here to load the updated key levels via the web-based TradingView platform. New links are produced daily. Quoted levels likely hold barring an exogenous development.

Graphic: 65-minute profile chart of the Micro E-mini S&P 500 Futures.

Definitions

Volume Areas: Markets will build on areas of high-volume (HVNodes). Should the market trend for a period of time, this will be identified by a low-volume area (LVNodes). The LVNodes denote directional conviction and ought to offer support on any test.

If participants auction and find acceptance in an area of a prior LVNode, then future discovery ought to be volatile and quick as participants look to the nearest HVNodes for more favorable entry or exit.

POCs: Areas where two-sided trade was most prevalent in a prior day session. Participants will respond to future tests of value as they offer favorable entry and exit.


About

The author, Renato Leonard Capelj, works in finance and journalism.

Capelj spends the bulk of his time at Physik Invest, an entity through which he invests and publishes free daily analyses to thousands of subscribers. The analyses offer him and his subscribers a way to stay on the right side of the market. Separately, Capelj is an options analyst at SpotGamma and an accredited journalist.

Capelj’s past works include conversations with investor Kevin O’Leary, ARK Invest’s Catherine Wood, FTX’s Sam Bankman-Fried, Lithuania’s Minister of Economy and Innovation Aušrinė Armonaitė, former Cisco chairman and CEO John Chambers, and persons at the Clinton Global Initiative.

Connect

Direct queries to renato@physikinvest.com or find Physik Invest on TwitterLinkedInFacebook, and Instagram.

Calendar

You may view this letter’s content calendar at this link.

Disclaimer

Do not construe this newsletter as advice. All content is for informational purposes.

Categories
Commentary

Daily Brief For January 13, 2023

Physik Invest’s Daily Brief is read by thousands of subscribers. You, too, can join this community to learn about the fundamental and technical drivers of markets.

Graphic updated 7:00 AM ET. Sentiment Neutral if expected /ES open is inside of the prior day’s range. /ES levels are derived from the profile graphic at the bottom of this letter. Levels may have changed since initially quoted; click here for the latest levels. SqueezeMetrics Dark Pool Index (DIX) and Gamma (GEX) with the latter calculated based on where the prior day’s reading falls with respect to the MAX and MIN of all occurrences available. A higher DIX is bullish. At the same time, the lower the GEX, the more (expected) volatility. Click to learn the implications of volatility, direction, and moneyness. Breadth reflects a reading of the prior day’s NYSE Advance/Decline indicator. The CBOE VIX Volatility Index (INDEX: VVIX) measure reflects the total attractiveness of owning volatility.

Administrative

A bit late as your letter writer is getting ready to travel. Sorry and have a great Friday!

Fundamental

Thursday’s inflation update was as expected.

The Consumer Price Index (CPI) saw a 6.5% rise year-over-year (YoY) and a 0.1% fall month-over-month (MoM). Core CPI was +5.7% YoY and +0.3% MoM. 

In his post-CPI analysis, Andreas Steno Larsen said inflation has mostly disappeared, and, if we cut shelter costs, which are outdated, “deflation on a quarterly and monthly basis is here.”

Graphic: Retrieved from Andreas Steno Larsen.

The Federal Reserve’s (Fed) “favored statistical measures for underlying inflationary pressure all confirm a decline,” added Bloomberg’s John Authers.

Prices are beginning to behave more as central bankers would wish,” paving the way to a downshift in tightening, as is priced by the markets. Using the CME Group Inc’s (NASDAQ: CME) FedWatch Tool, traders were split, and the odds of a 25 or 50 basis point hike were more even prior to CPI.

The odds are now skewed toward a 25 basis point hike.

Graphic: Retrieved from CME Group Inc’s (NASDAQ: CME) FedWatch Tool. Depending on the measure, rates are seen peaking between 4.9% and 5.10%.

Despite the odds of a less aggressive hike – yields falling and swaps suggesting the Fed could skip a hike in March – and the impact that has on valuing businesses (e.g., firm profits worth less at higher interest rates hence the de-rate of 2022), the data suggests that “inflation spikes have never been vanquished until the federal funds rate exceeds the inflation rate,” and, with the return in deflation, Steno Larsen said, the outlook for stocks remains poor.

“Remember that the PPI (and the CPI for that matter) is a leading indicator for EPS.” Consequently, “we are in for negative EPS.”

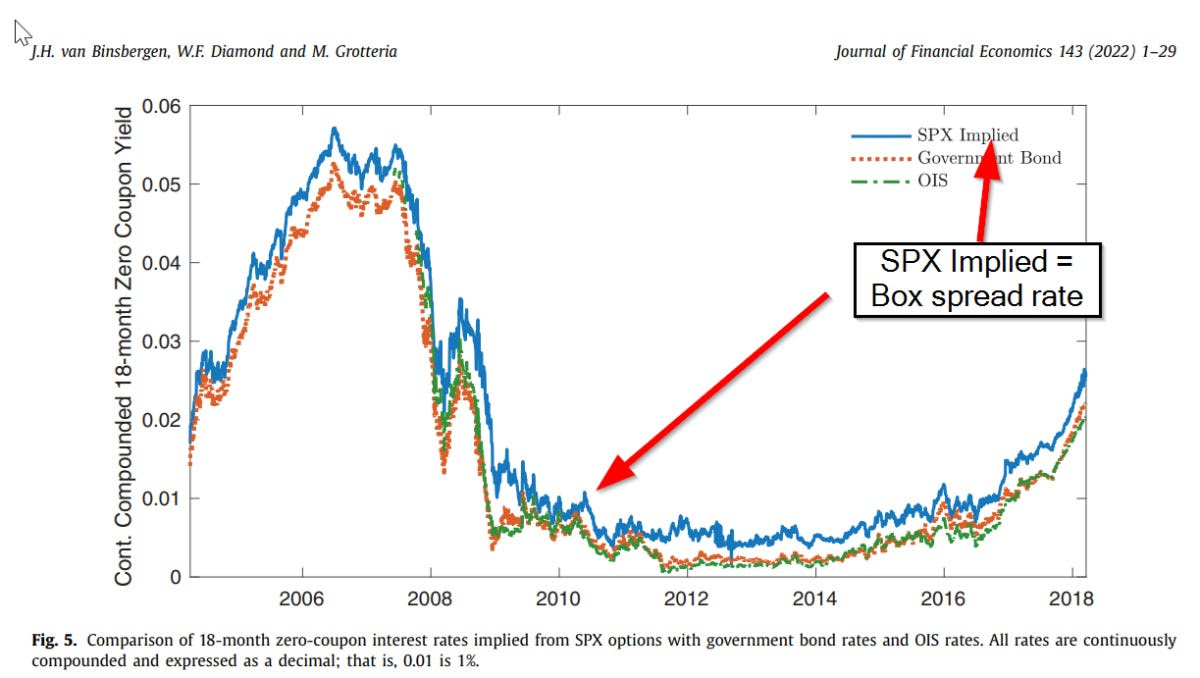
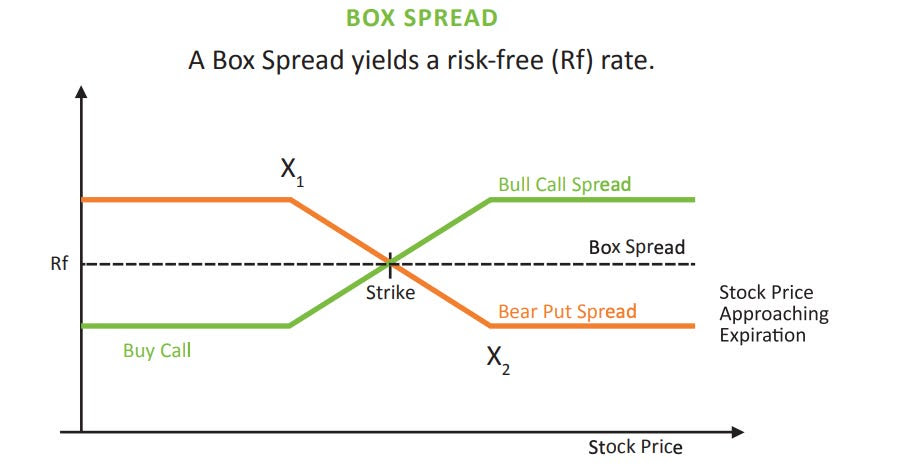
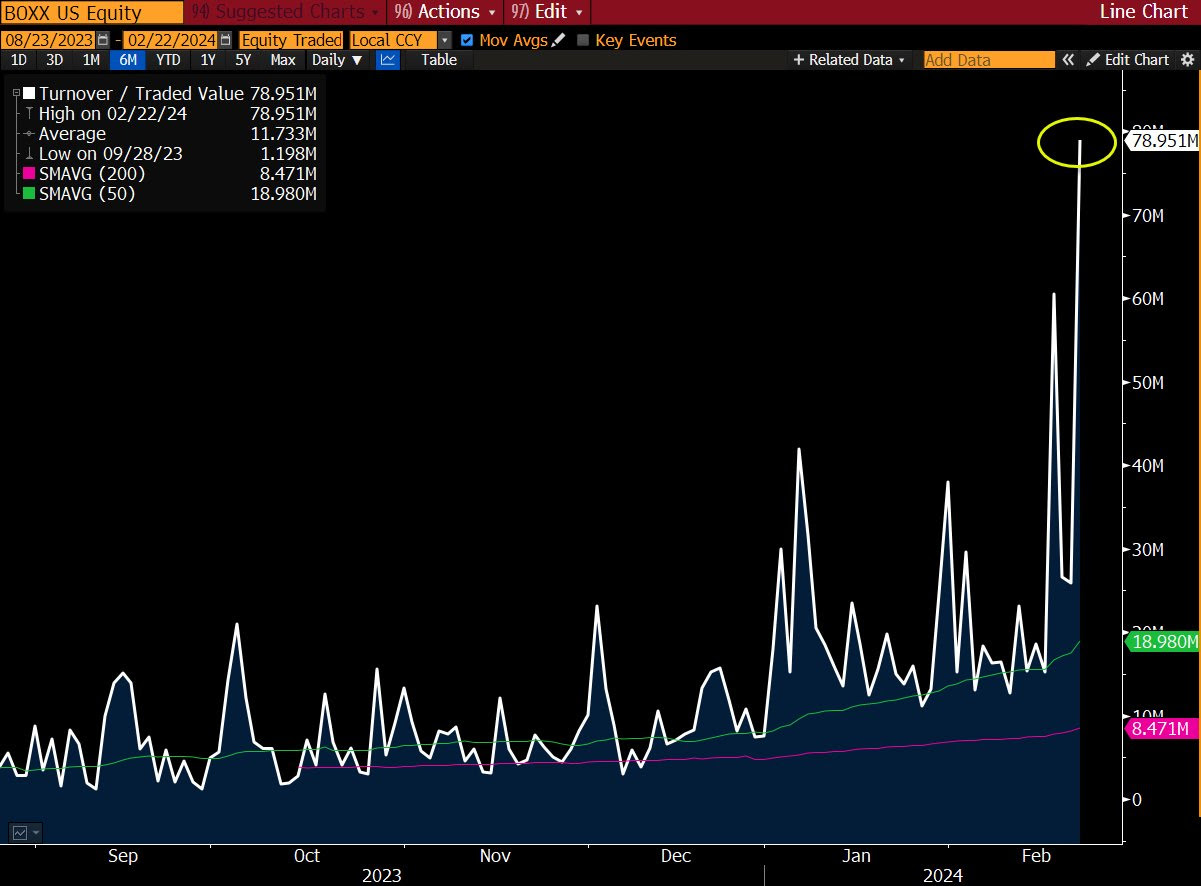
If you’re not an active trader and unable to participate in both the up- and down-side of markets, then you may capitalize on higher interest rates with Treasury bills or Box Spreads, which allow you to create loan structures similar to a Treasury bill. Upon the spread’s maturity, it settles and earns a competitive interest rate.

Graphic: Retrieved from boxtrades.com.

If you’re an active trader, as I said to one subscriber privately, “the more depressed technology names to the upside for debits [were] attractive” (i.e., buying call option structures in the likes of Tesla and Amazon).

This is while put structures you may monetize in case of a large repricing in volatility have kept their values well amid what appears to be a shift higher in the skew; in the past days, we talked about measures including the Cboe VIX Volatility (INDEX: VVIX) printing at historic levels.

Graphic: Updated January 12, 2023. S&P 500 (INDEX: SPX) volatility skew retrieved from Interactive Brokers Group Inc’s (NASDAQ: IBKR) Trader Workstation.

Measures like the VVIX suggests “we can get cheap exposure to convexity while a lot of people are worried,” as The Ambrus Group’s Kris Sidial said in one article. Though volatility can be bimodal (i.e., stay low for longer for lack of better phrasing), from a “risk-to-reward perspective, … it’s a better bet to be on the long volatility side,” given “that there are so many things that … keep popping up” from a macro perspective.

Graphic: Cboe VIX Volatility (INDEX: VVIX) via TradingView.

Technical

As of 7:00 AM ET, Friday’s regular session (9:30 AM – 4:00 PM ET), in the S&P 500, is likely to open in the lower part of a negatively skewed overnight inventory, inside of prior-range and -value, suggesting a limited potential for immediate directional opportunity.

Our S&P 500 pivot for today is $3,988.25 HVNode. 

Key levels to the upside include $4,000.25, $4,011.75, and $4,028.75.

Key levels to the downside include $3,979.75, $3,959.00, and $3,943.25.

Click here to load today’s key levels into the web-based TradingView platform. All levels are derived using the 65-minute timeframe. New links are produced, daily. 

As a disclaimer, the S&P 500 could trade beyond the levels quoted in the letter. Therefore, you should load the above link on your browser for more relevant levels.

Graphic: 65-minute profile chart of the Micro E-mini S&P 500 Futures.

Definitions

Volume Areas: Markets will build on areas of high-volume (HVNodes). Should the market trend for long periods of time, it will be identified by low-volume areas (LVNodes). LVNodes denote directional conviction and ought to offer support on any test.

If participants auction and find acceptance in an area of a prior LVNode, then future discovery ought to be volatile and quick as participants look to HVNodes for favorable entry or exit.

POCs: Denote areas where two-sided trade was most prevalent in a prior day session. Participants will respond to future tests of value as they offer favorable entry and exit.

MCPOCs: Denote areas where two-sided trade was most prevalent over numerous sessions. Participants will respond to future tests of value as they offer favorable entry and exit.


About

In short, an economics graduate working in finance and journalism.

Capelj spends most of his time as the founder of Physik Invest through which he invests and publishes daily analyses to subscribers, some of whom represent well-known institutions.

Separately, Capelj is an equity options analyst at SpotGamma and an accredited journalist interviewing global leaders in business, government, and finance.

Past works include conversations with investor Kevin O’Leary, ARK Invest’s Catherine Wood, FTX’s Sam Bankman-Fried, Lithuania’s Minister of Economy and Innovation Aušrinė Armonaitė, former Cisco chairman and CEO John Chambers, and persons at the Clinton Global Initiative.

Contact

Direct queries to renato@physikinvest.com or Renato Capelj#8625 on Discord.

Calendar

You may view this letter’s content calendar at this link.

Disclaimer

Do not construe this newsletter as advice. All content is for informational purposes.

Categories
Commentary

Daily Brief For January 9, 2023

Physik Invest’s Daily Brief is read by thousands of subscribers. You, too, can join this community to learn about the fundamental and technical drivers of markets.

Graphic updated 7:50 AM ET. Sentiment Risk-On if expected /ES open is above the prior day’s range. /ES levels are derived from the profile graphic at the bottom of this letter. Levels may have changed since initially quoted; click here for the latest levels. SqueezeMetrics Dark Pool Index (DIX) and Gamma (GEX) with the latter calculated based on where the prior day’s reading falls with respect to the MAX and MIN of all occurrences available. A higher DIX is bullish. At the same time, the lower the GEX, the more (expected) volatility. Click to learn the implications of volatility, direction, and moneyness. Breadth reflects a reading of the prior day’s NYSE Advance/Decline indicator. The CBOE VIX Volatility Index (INDEX: VVIX) measure reflects the attractiveness of owning volatility. Green means that owning volatility is attractive.

Administrative

In last week’s letters, we discussed, mainly, fundamental and positioning contexts. Today’s letter will add to the discussion on the positioning.

Positioning

Last week, for an article published on Benzinga.com over the weekend, your letter writer spoke with The Ambrus Group’s co-chief investment officer Kris Sidial. Shared were the things to look out for in 2023 and tips for newer traders. The article can be viewed here, at this link.

In short, there are four big takeaways. 

First, though options prices could stay under pressure, naive measures like the VVIX, which is the volatility of the VIX, or the volatility of the S&P 500’s volatility, are printing at levels last seen in 2017. This means “we can get cheap exposure to convexity while a lot of people are worried.”

Graphic: Retrieved from TradingView. Cboe Volatility Index (INDEX: VIX) is on the top. The volatility of the VIX itself (INDEX: VVIX) is at the bottom.

Second, on the other side of the growing S&P 500 and VIX complexes is a small concentrated group of market makers taking on far more exposure to risk. 

Graphic: Retrieved from Ambrus’ publicly available research.

During moments of stress, these market makers may be “unable to keep up with the demands of frenetic investors,” Sidial said, pointing to GameStop Corporation (NYSE: GME) where “there was this reflexive dynamic” that helped push the stock higher in 2021.

“That same dynamic can happen on the way down”; market makers will mark up options prices during intense selling. As the options prices rise, options deltas (i.e., their exposure to direction) rise and this prompts so-called bearish vanna hedging flows.

Graphic: Retrieved from Ambrus’ publicly available research.

“Imagine a scenario where [some disaster happens] and everybody starts buying 0 DTE puts. That’s going to reflexively drive the S&P lower,” Sidial said. “Take, for example, the JPMorgan collar position that clearly has an effect on the market, and people are starting to understand that effect. That’s just one fund. Imagine the whole derivative ecosystem” leaning one way.

Graphic: Retrieved from Ambrus’ publicly available research.

The third is in reference to liquidity. As private market investors’ “deals are getting marked down, [t]o source liquidity, they may have to sell some of their holdings in the public equity markets.” Benn Eifert, the CIO at QVR Advisors, recently put forth that “late-stage technology is a great example where public comps are down 80-90% but privates marked down 20% or not at all. It is possible to imagine large institutions engaging in forced selling of liquid public equities to meet capital calls in private fund investments.”

And, lastly, investors often go “back and forth” and do not stick to a strict process. In trying to pick what will work at one specific time, investors can “miss what is going to work in the future.” Consequently, Sidial says investors should have an outlook and process to express that outlook. “It’s not as easy as saying: ‘Buy volatility because it’s cheap or sell it because it is expensive.’” 

As a validation, in the Benzinga article, your letter writer wrote about 2017 when volatility was at some of its lowest levels. Back then, the correct trade was to sell volatility, in some cases, due to volatility’s bimodality; if you sold volatility back then, you made money due to its clustering.

Graphic: Retrieved from TradingView. Cboe Volatility Index (INDEX: VIX) is on the top. Cboe Realized Volatility (INDEX: RVOL) is at the bottom.

So, “if you’re trading volatility, let there be an underlying catalyst for doing so.” That said, from a “risk-to-reward perspective, … it’s a better bet to be on the long volatility side,” given “that there are so many things that … keep popping up” from a macro perspective.

For Ambrus’ publicly available research, click here. Also, follow Sidial on Twitter, here. Consider reading your letter writer’s past two conversations with Sidial, as well. Here is an article on 2021 and the meme stock debacle. Here is another article talking more about Ambrus’ processes.

Technical

As of 7:50 AM ET, Monday’s regular session (9:30 AM – 4:00 PM ET), in the S&P 500, is likely to open in the upper part of a positively skewed overnight inventory, outside of prior-range and -value, suggesting a potential for immediate directional opportunity.

Our S&P 500 pivot for today is $3,926.50. 

Key levels to the upside include $3,943.25, $3,960.25, and $3,979.75.

Key levels to the downside include $3,908.25, $3,891.00, and $3,874.25.

Click here to load today’s key levels into the web-based TradingView platform. All levels are derived using the 65-minute timeframe. New links are produced, daily. 

As a disclaimer, note the S&P 500 could trade beyond the levels quoted in the letter. Therefore, you should load the key levels on your browser.

Graphic: 65-minute profile chart of the Micro E-mini S&P 500 Futures.

Definitions

Volume Areas: Markets will build on areas of high-volume (HVNodes). Should the market trend for long periods of time, it will be identified by low-volume areas (LVNodes). LVNodes denote directional conviction and ought to offer support on any test.

If participants auction and find acceptance in an area of a prior LVNode, then future discovery ought to be volatile and quick as participants look to HVNodes for favorable entry or exit.

Vanna: The rate at which the Delta of an option changes with respect to implied volatility.

POCs: Denote areas where two-sided trade was most prevalent in a prior day session. Participants will respond to future tests of value as they offer favorable entry and exit.

MCPOCs: Denote areas where two-sided trade was most prevalent over numerous sessions. Participants will respond to future tests of value as they offer favorable entry and exit.


About

In short, an economics graduate working in finance and journalism.

Capelj spends most of his time as the founder of Physik Invest through which he invests and publishes daily analyses to subscribers, some of whom represent well-known institutions.

Separately, Capelj is an equity options analyst at SpotGamma and an accredited journalist interviewing global leaders in business, government, and finance.

Past works include conversations with investor Kevin O’Leary, ARK Invest’s Catherine Wood, FTX’s Sam Bankman-Fried, Lithuania’s Minister of Economy and Innovation Aušrinė Armonaitė, former Cisco chairman and CEO John Chambers, and persons at the Clinton Global Initiative.

Contact

Direct queries to renato@physikinvest.com or Renato Capelj#8625 on Discord.

Calendar

You may view this letter’s content calendar at this link.

Disclaimer

Do not construe this newsletter as advice. All content is for informational purposes.

Categories
Commentary

Daily Brief For January 6, 2023

Physik Invest’s Daily Brief is read by thousands of subscribers. You, too, can join this community to learn about the fundamental and technical drivers of markets.

Graphic updated 8:30 AM ET. Sentiment Neutral if expected /ES open is inside of the prior day’s range. /ES levels are derived from the profile graphic at the bottom of this letter. Levels may have changed since initially quoted; click here for the latest levels. SqueezeMetrics Dark Pool Index (DIX) and Gamma (GEX) with the latter calculated based on where the prior day’s reading falls with respect to the MAX and MIN of all occurrences available. A higher DIX is bullish. At the same time, the lower the GEX, the more (expected) volatility. Click to learn the implications of volatility, direction, and moneyness. Breadth reflects a reading of the prior day’s NYSE Advance/Decline indicator. VIX reflects a current reading of the CBOE Volatility Index (INDEX: VIX) from 0-100.

Administrative

Hey team, hope you had a great week! Please consider reading our letters for January 3 and 4. In those letters, we discussed the potential drivers of long-lasting inflation that may not be good for traditional portfolio constructions like 60/40. 

In today’s letter, we talk about some positioning contexts, leaning into this letter writer’s interview with The Ambrus Group’s Kris Sidial for a Benzinga article to be published either this weekend or next week.

This letter will serve as a primer. Next week, we will go into further depth. Have a great weekend!

Positioning

In a conversation with your letter writer prior to 2022, and on YouTube, Sidial and some other Ambrus members said markets were increasingly fragile and traditional portfolio constructions such as 60/40 (i.e., 60% of holdings held in stocks and 40% of the holdings held in bonds) would not perform as well as history would imply. 

Instead, options (colloquially referred to as volatility) may “potentially outperform the market” and limit losses.

Pursuant to Ambrus’ warnings, 60/40 logged one of its worst stretches as inflation and interest rates rose. On the other hand, Ambrus, which is a volatility arbitrage fund, managed to end the year unscathed.

“That does not mean all volatility funds ended the same way,” Sidial said in a nod to his team’s unique approach to leveraging options’ multi-dimensionality in reducing the cost of protection they own for investors.

Here’s more on Ambrus’ approach from a previous conversation your letter writer had with Sidial for a Benzinga article.

Graphic: Text retrieved from Benzinga.com.

This approach is limiting, though, Sidial notes. Increasing assets under management can eat into the firm’s own alpha.

Anyways, Sidial went on to discuss the performance of volatility in 2022 and its potential to outperform in 2023 and beyond. 

“It caught everybody by surprise that long volatility underperformed,” he said in reference to a high spot-vol beta (i.e., volatility’s sensitivity to underlying prices) in 2021 suggesting volatility was likely to come to life in 2022, and “there would be more follow-through.”

However, there was no follow-through, and Sidial believes this was the result of allocations to commodity trading advisors or CTAs, and the “consensus trade,” or the sales of volatility on expectations markets would grind and chop lower for the entirety of 2022. 

As this letter has put forth in the past, traders proactively hedged heading into 2022. The unwind or supply of some of these hedges, coupled with investors’ expectation markets would continue to grind far lower, prompted more volatility sales (a pressure on options prices), masked by the persistently high, albeit tame Cboe Volatility Index (INDEX: VIX) and metrics like the put-to-call ratio appearing inflated, potentially the result of stock loan desks replacing short stock with in-the-money puts given high-interest rates.

Though the price of volatility could move toward the extremes (i.e., clustering/mean-reverting), trends may be near exhaustion.

Naive measures like the VVIX, which is the volatility of the VIX (i.e., the volatility of the S&P 500 volatility), are printing at levels last seen in 2017. This suggests “we can get cheap exposure to convexity while a lot of people are worried.”

Therefore, “even if inflation continues, the rate at which inflation rises won’t be the same. Due to this, CTA exposures likely will not perform as well as they did in 2022, and that’s why you may see more opportunities in the volatility space.”

Moving on, though not catalysts or reasons for Ambrus to initiate trades per se, risks Sidial said could result in volatility performing well include the concentration of market makers and private markets’ sourcing of liquidity (or raising cash) through sales of public equity markets.

“During moments of market stress, the market makers are unable to keep up with the demands of frenetic investors. If you think of GameStop Corp (NYSE: GME), which we talked about before, there was this reflexive dynamic that happened when investors rushed into the stock one way.”

“That same dynamic can happen on the way down”; market makers mark up volatility during stress which can pressure markets. As the price of volatility rises, option deltas rise and this prompts bearish vanna hedging flows, as they are called. 

Your letter writer will pause the commentary at this point while he further unpacks his discussion with Sidial, but at least you got a sneak peek ahead of next week’s article release. Take care!

Technical

As of 8:30 AM ET, Friday’s regular session (9:30 AM – 4:00 PM ET), in the S&P 500, is likely to open in the middle part of a balanced overnight inventory, inside of prior-range and -value, suggesting a limited potential for immediate directional opportunity.

Our S&P 500 pivot for today is $3,834.25. 

Key levels to the upside include $3,845.25, $3,857.00, and $3,867.75. 

Key levels to the downside include $3,813.25, $3,793.25, and $3,776.75.

Click here to load today’s key levels into the web-based TradingView platform. All levels are derived using the 65-minute timeframe. New links are produced, daily.

Note that early morning news may result in quoted levels not performing well. Please make sure to use the link to view the real-time chart for more levels that may be in play.

Graphic: 65-minute profile chart of the Micro E-mini S&P 500 Futures.

Definitions

Volume Areas: Markets will build on areas of high-volume (HVNodes). Should the market trend for long periods of time, it will be identified by low-volume areas (LVNodes). LVNodes denote directional conviction and ought to offer support on any test.

If participants auction and find acceptance in an area of a prior LVNode, then future discovery ought to be volatile and quick as participants look to HVNodes for favorable entry or exit.

MCPOCs: Denote areas where two-sided trade was most prevalent over numerous sessions. Participants will respond to future tests of value as they offer favorable entry and exit.


About

In short, an economics graduate working in finance and journalism.

Capelj spends most of his time as the founder of Physik Invest through which he invests and publishes daily analyses to subscribers, some of whom represent well-known institutions.

Separately, Capelj is an equity options analyst at SpotGamma and an accredited journalist interviewing global leaders in business, government, and finance.

Past works include conversations with investor Kevin O’Leary, ARK Invest’s Catherine Wood, FTX’s Sam Bankman-Fried, Lithuania’s Minister of Economy and Innovation Aušrinė Armonaitė, former Cisco chairman and CEO John Chambers, and persons at the Clinton Global Initiative.

Contact

Direct queries to renato@physikinvest.com or Renato Capelj#8625 on Discord.

Calendar

You may view this letter’s content calendar at this link.

Disclaimer

Do not construe this newsletter as advice. All content is for informational purposes.