The daily brief is a free glimpse into the prevailing fundamental and technical drivers of U.S. equity market products. Join the 1000+ that read this report daily, below!
Administrative
Good morning, team! Appreciate you opening up this email and reading through the newsletter.
Over the span of two or so years, on Substack and Physik Invest’s website, issued daily was this letter you, alongside about 1,000 others, are subscribed to.
This newsletter went from about 400 subscribers in July to 1,000 in October, a 150% increase. Thank you to fx:macro, The Morning Hark, The Transcript, and twenty others who, in large part, made that increase happen.
From hereon, gun to the head, I (your letter writer) can’t tell where this newsletter is going.
In short, this letter served as a tool for me to improve and keep me aware. It was years ago that markets were a dream I was in steadfast pursuit of; I sought mentorship, studied, saved money, and, ultimately, made it a successful full-time gig.
This letter helped keep me committed to continuous improvement. Sure the money was great, but how do you keep that flow when times get tough? That is something this letter helped me achieve. I hope it’s done the same for you.
At the same time, to weather the storms (periods of inactivity or low earnings while trading like now), I continued my work at places like Benzinga and SpotGamma.
Probably shaved a few years off my life expectancy but the effect was a net positive, I believe.
That said, in our own way, each and every one of us wants to level up, and that is what makes it difficult for me to promise where this newsletter may go. Speaking bluntly, I am faced with some good problems; e.g., should I raise money and build a fund? Work at an institution? Pivot to PE or, even, government work? Go back to school? Can’t tell you, yet.
What the next step will be I am not sure. Regardless, I intend to keep you fully in the loop.
As I set out and travel over the next 30 days, I’ll be doing a lot of thinking and, though the frequency of issued letters may change, briefly, the result may be better letters potentially spanning areas far beyond the S&P and the factors that are driving it.
Definitely am open to feedback. Appreciate you for joining the community and staying on board!
PS: Two things.
First, I’ll be in London and Lisbon over the next month. If you’re in either of the two cities, reach me on Telegram (@renatolcapelj) and/or Discord (Renato Capelj#8625).
Maybe a coffee?
Second, I spent the past half-year helping Benzinga build an awesome fintech event coming to New York City this December 8, 2022. Organizations such as FIS, Fireblocks, Truist, Symbiont, State Street, Vanguard, Northern Trust, Partisia, and Apex Clearing are a few that will be there.
If you want to network with the best, let me know and I’ll try to get you a ticket!
Regards,
Renato
Fundamental
An eventful week.
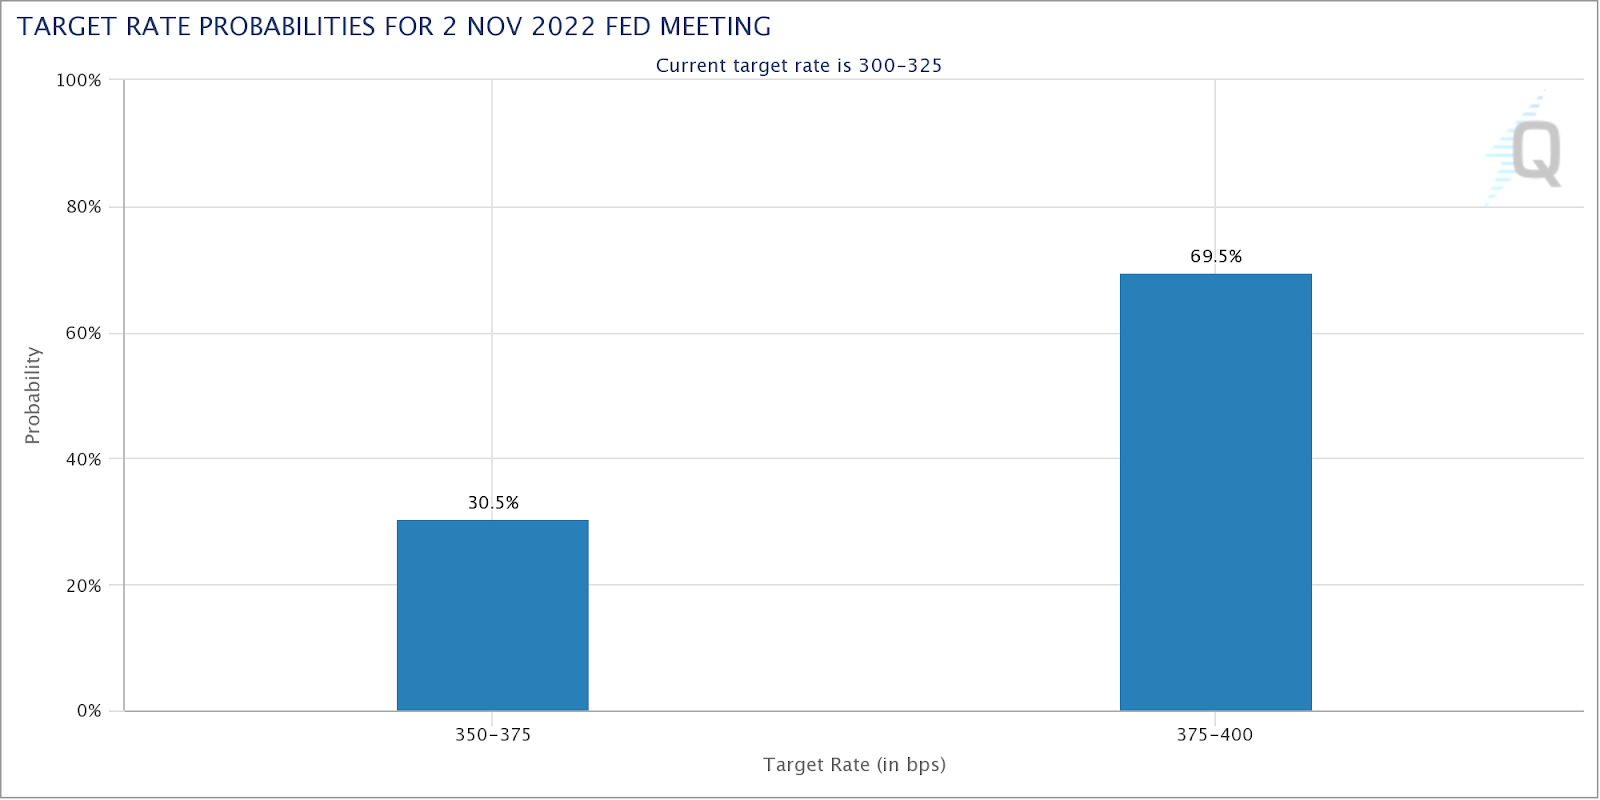
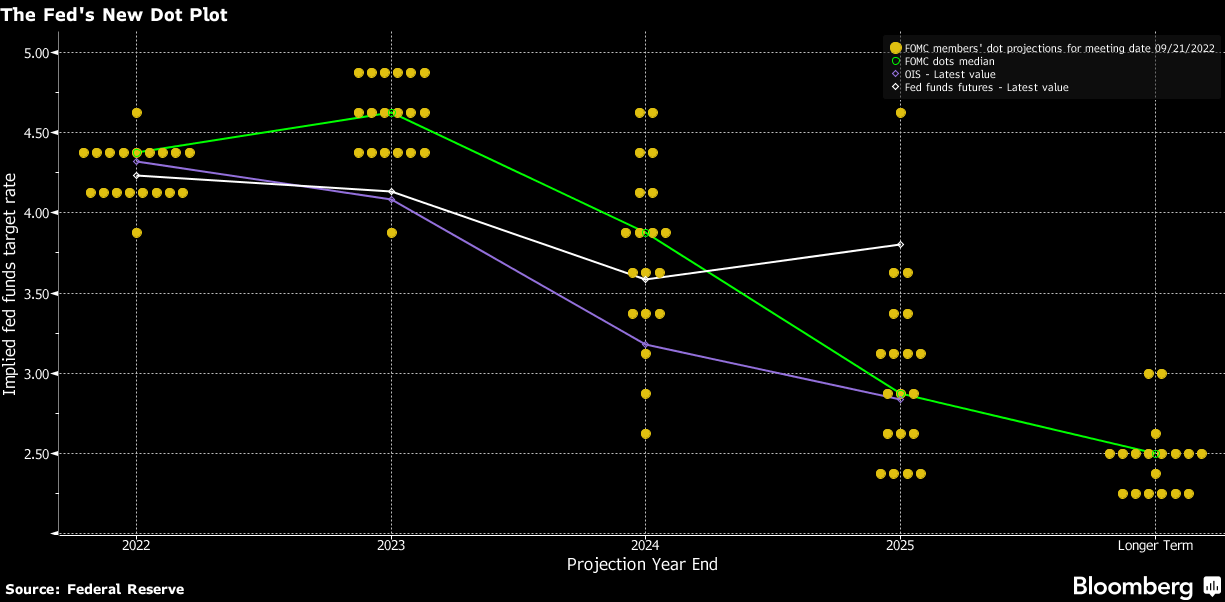
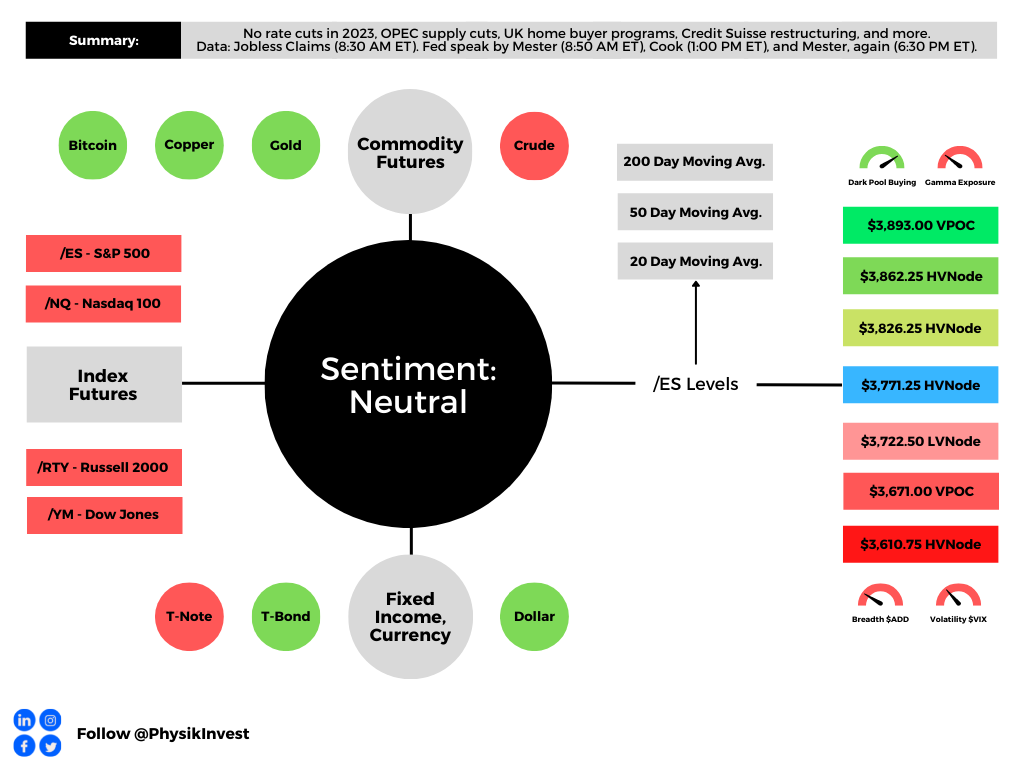
News, today, was focused on Federal Reserve (Fed) officials not planning to cut interest rates next year, the Organization of the Petroleum Exporting Countries (OPEC) agreeing to a supply cut, the UK mulling first-time home buyer program extensions, and Credit Suisse Group AG (NYSE: CS) seeking investment to help spin off its advisory and investment banking units.
Please check out the Physik Invest archives and upcoming letters for more on the impact.
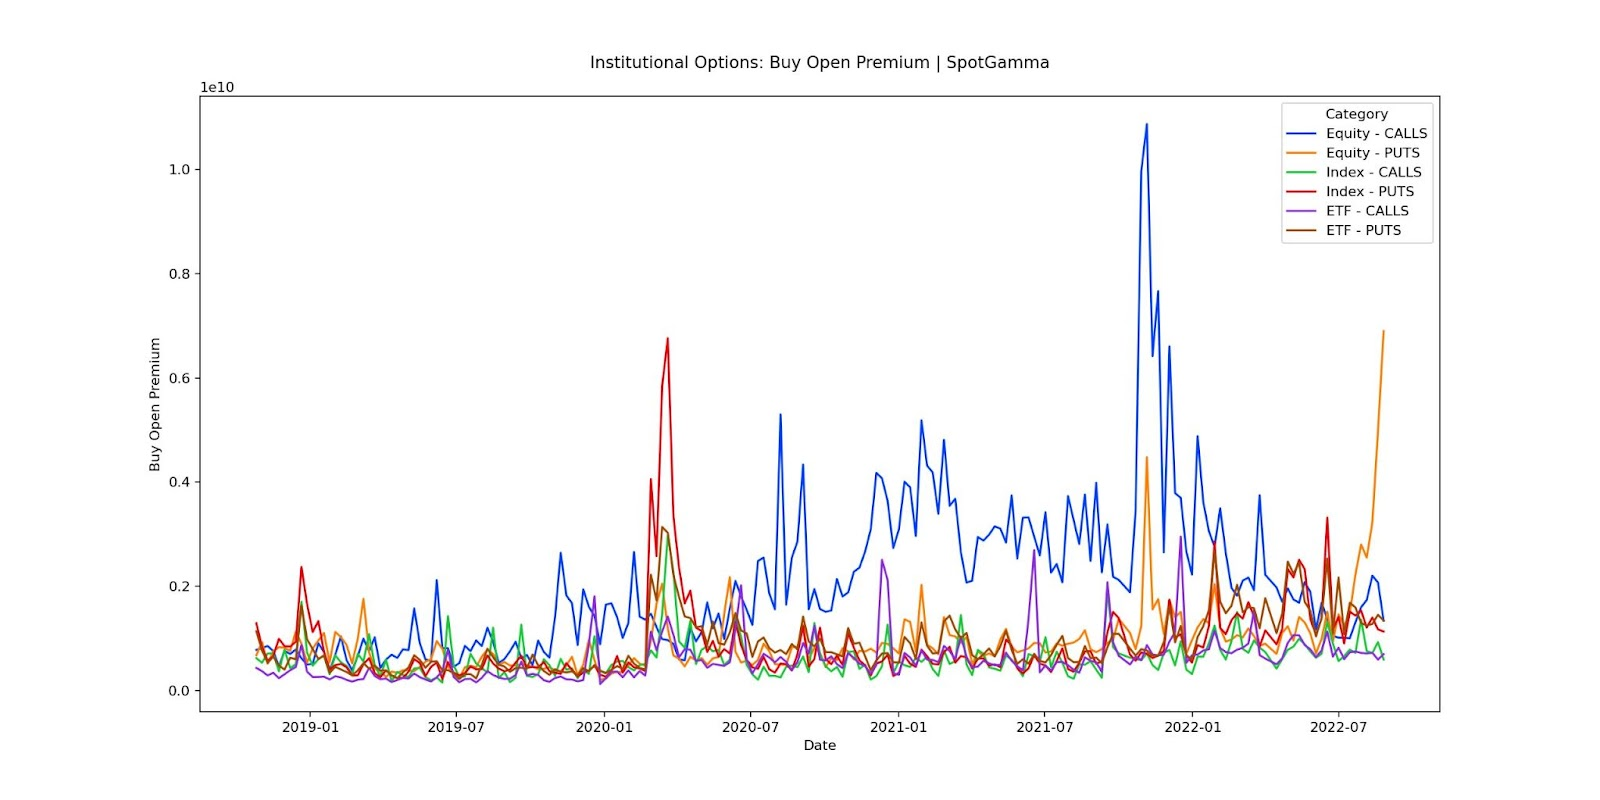
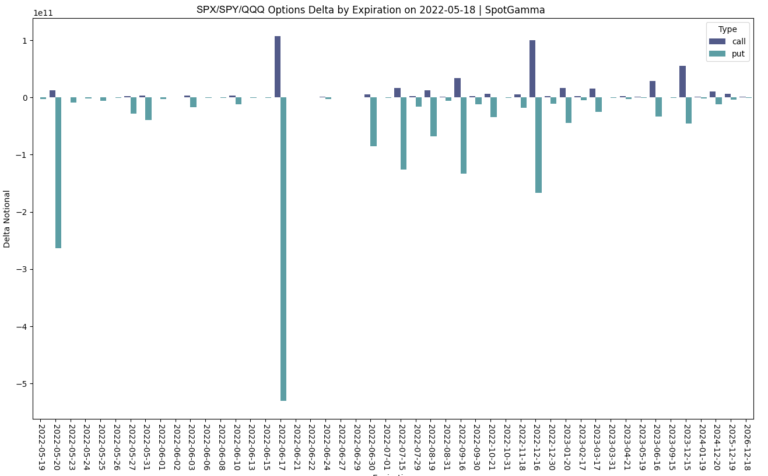
Positioning
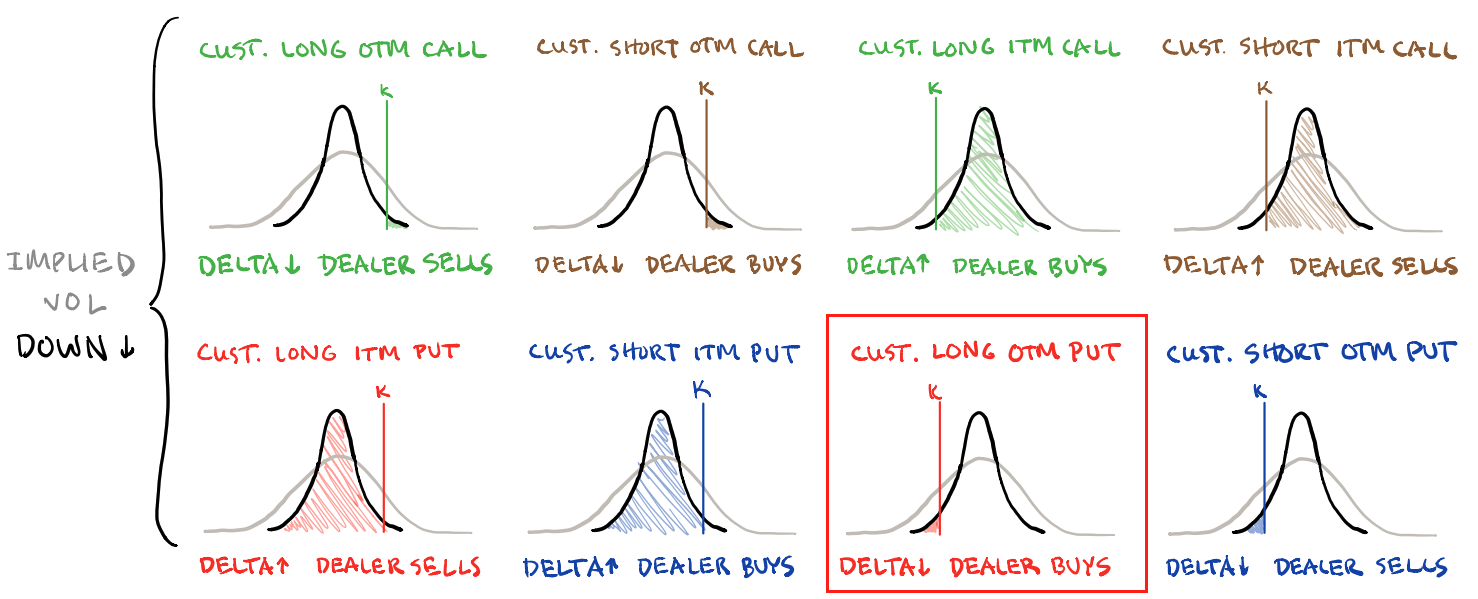
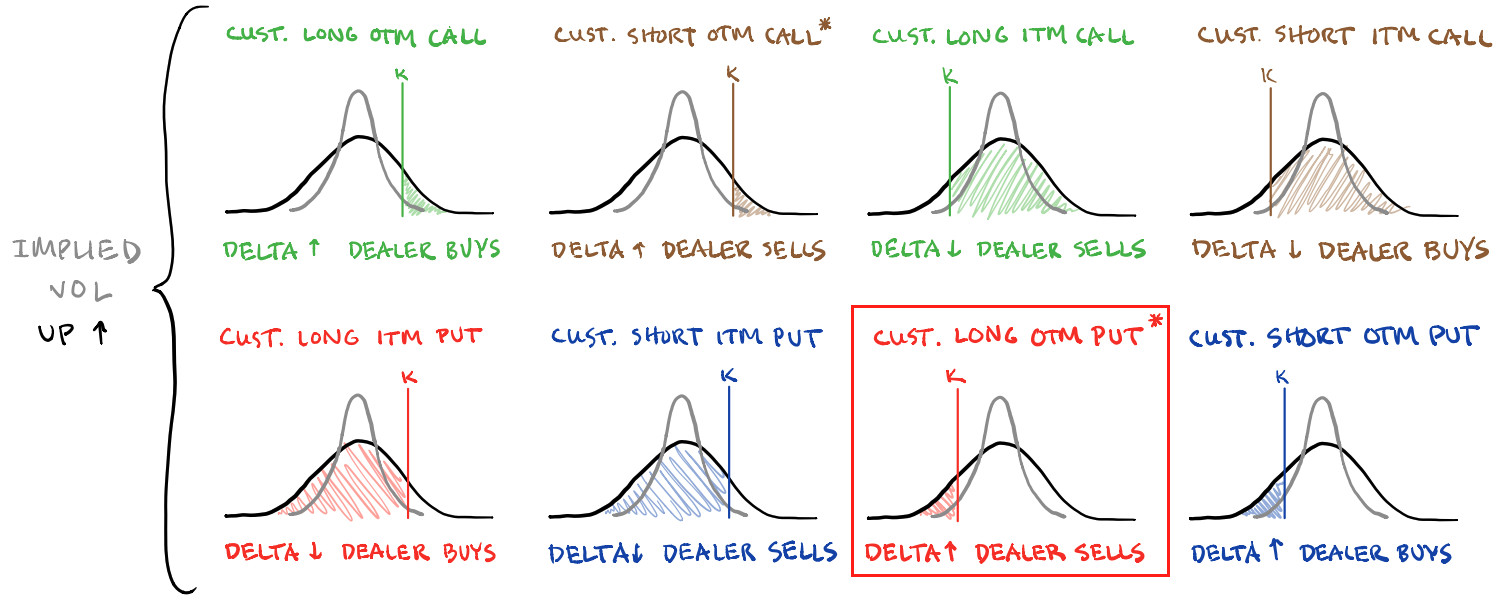
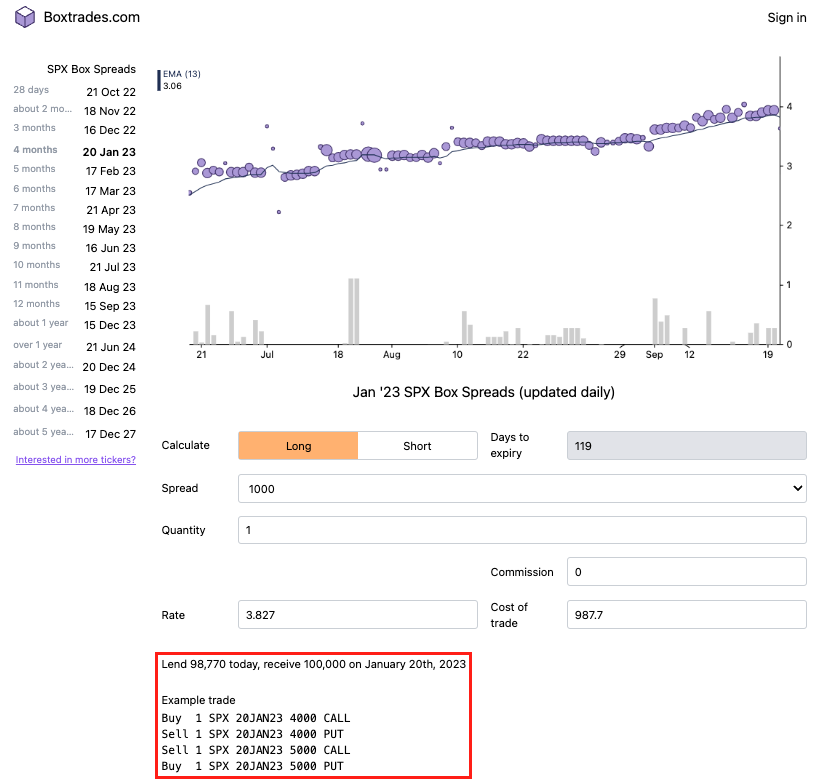
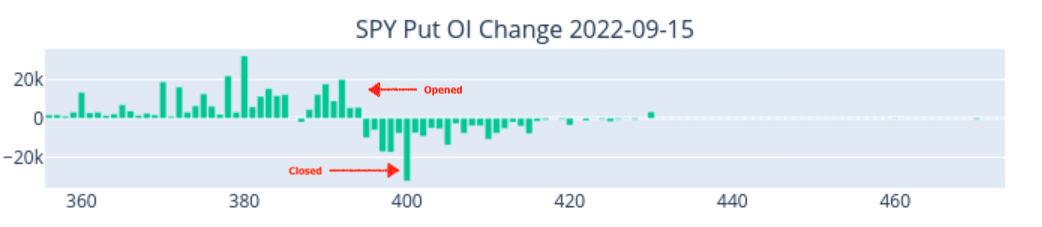
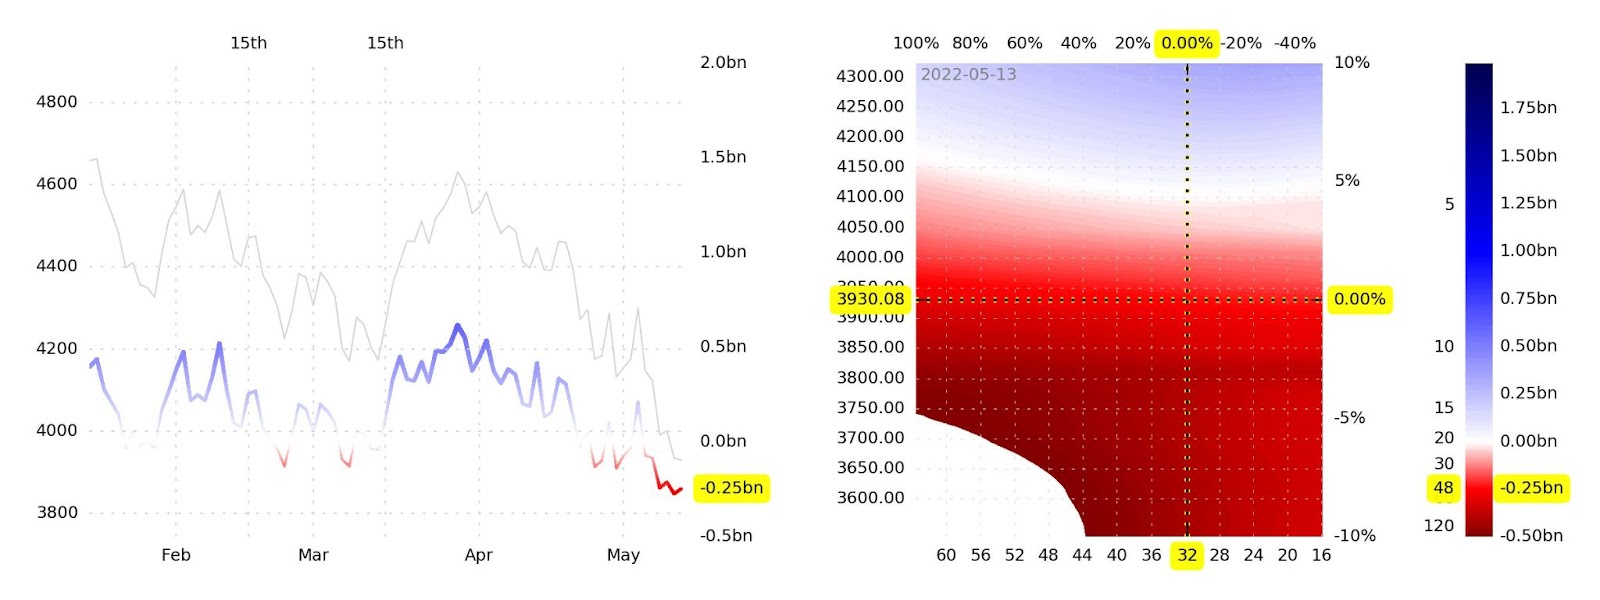
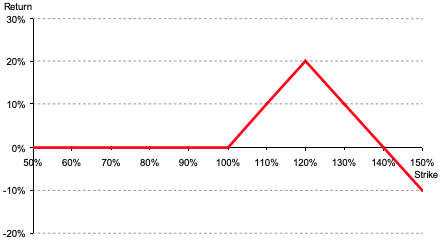
Bloomberg reported yesterday a big trade fired off mid-day propelling the S&P 500 higher into the close. The trade consisted of +20,000 OCT $4,500.00, +14,000 MAR $4,300.00 calls, and -48,000 JAN $4,500.00 calls.
The trade leaves the participant(s) with positive Delta. The other side has exposure to negative Delta meaning they lose money if the S&P 500 is higher, all else equal. To hedge this negative Delta, counterparties buy futures (positive Delta) and that has a positive impact.
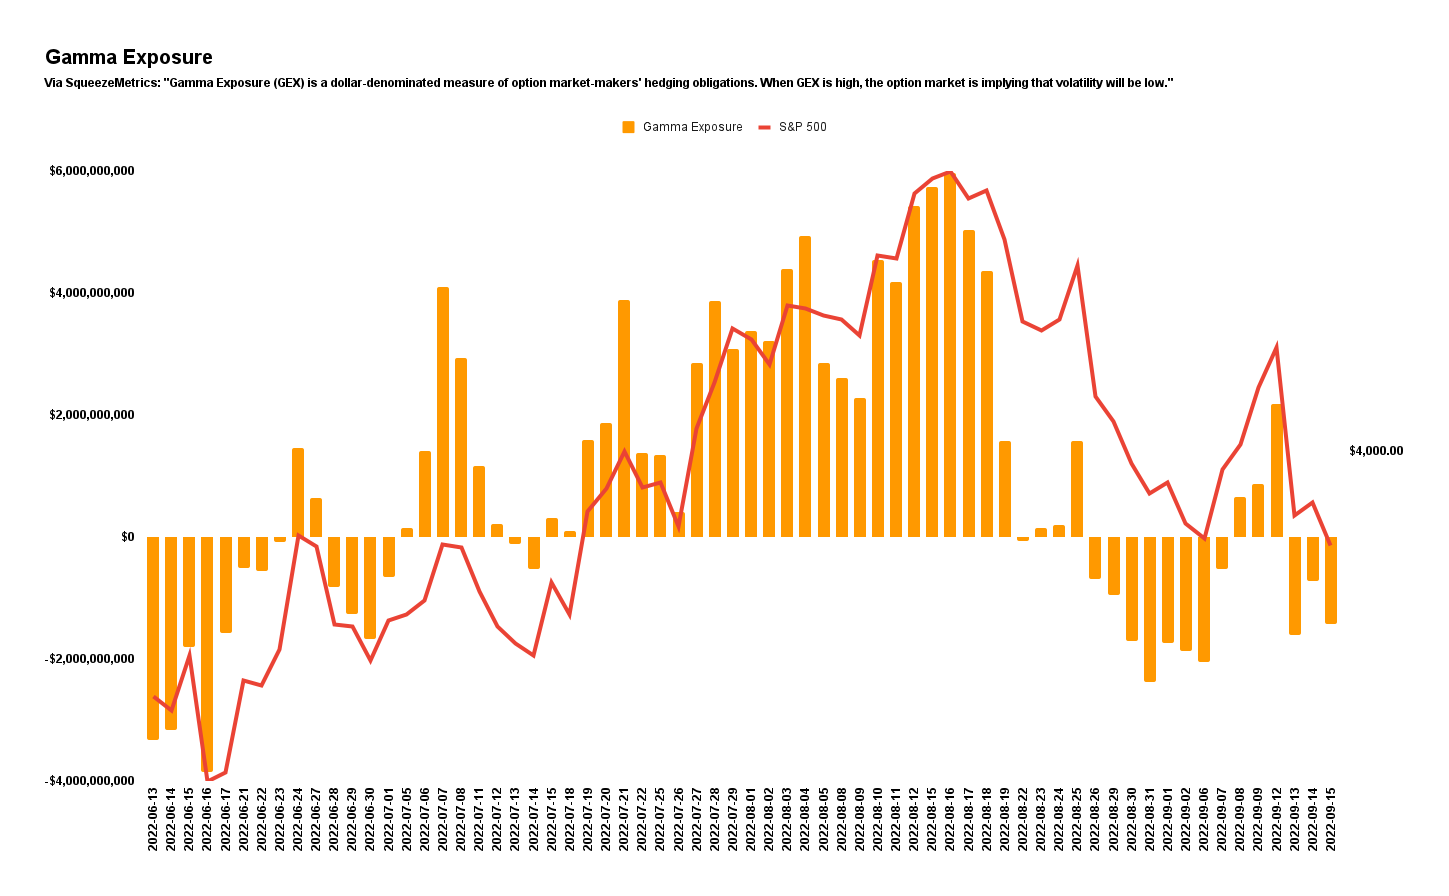
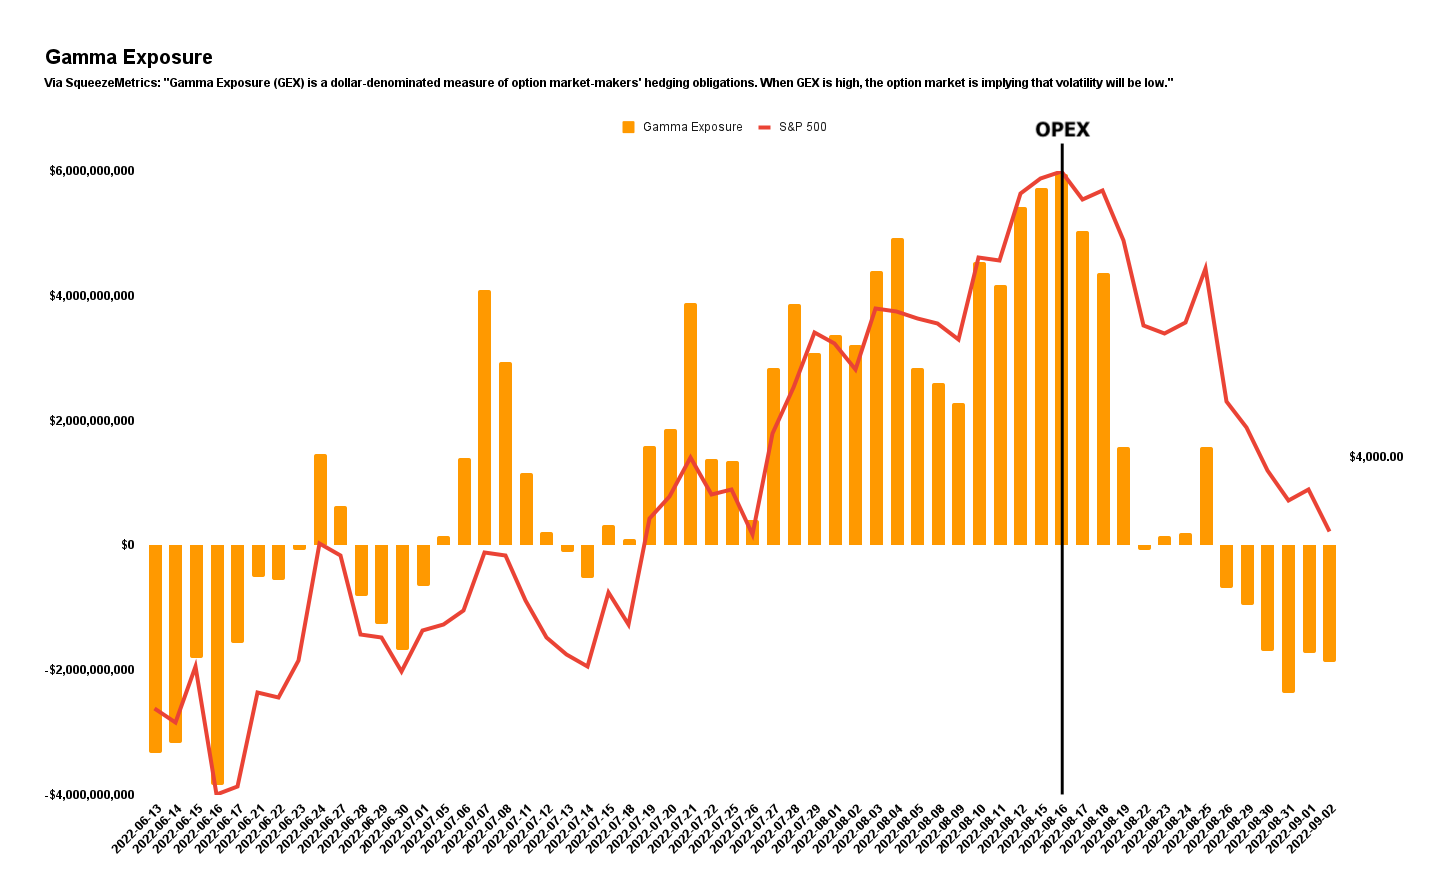
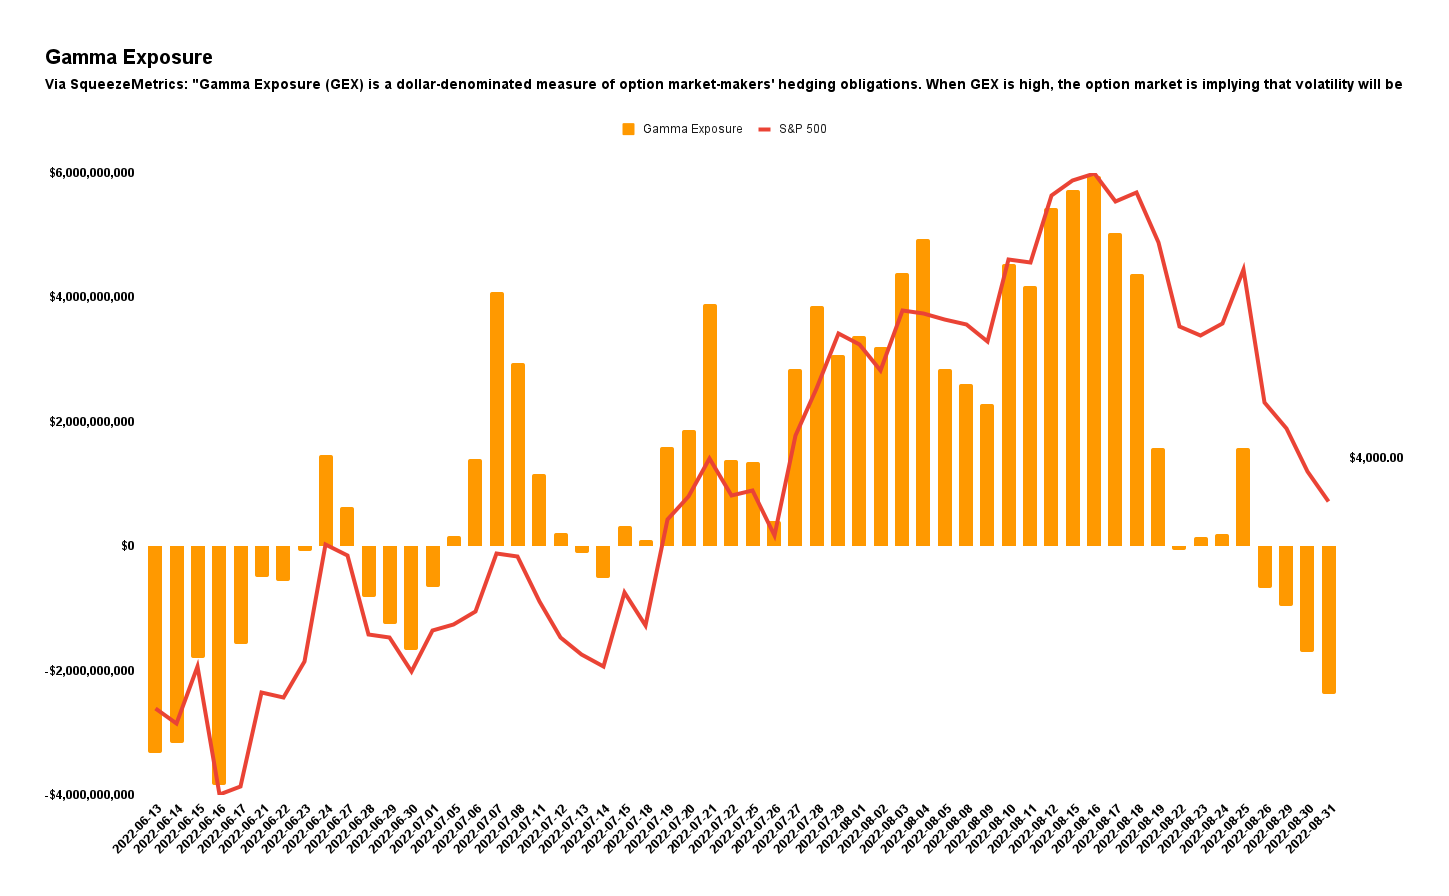
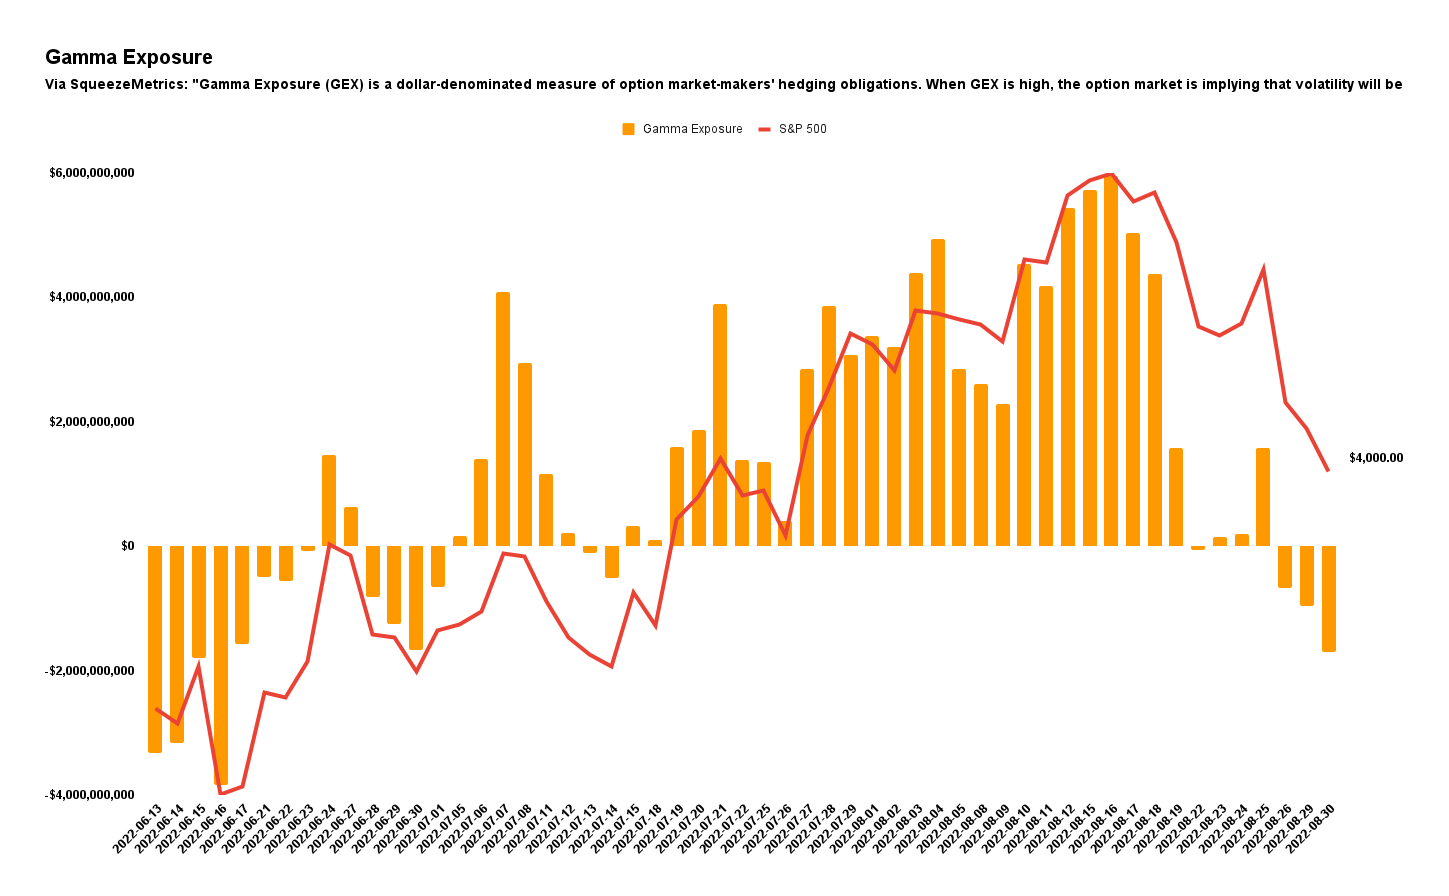
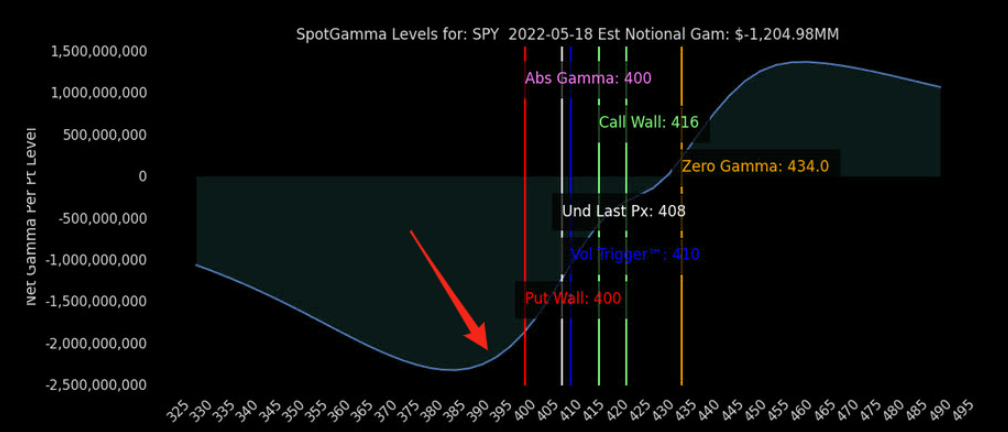
According to SpotGamma, though, there needs to be more impactful bullish call repositioning or a market rise that’s large enough to solicit volatility-dampening hedging from counterparties.
Until the last-mentioned happens, the market may continue to balance in a larger range.
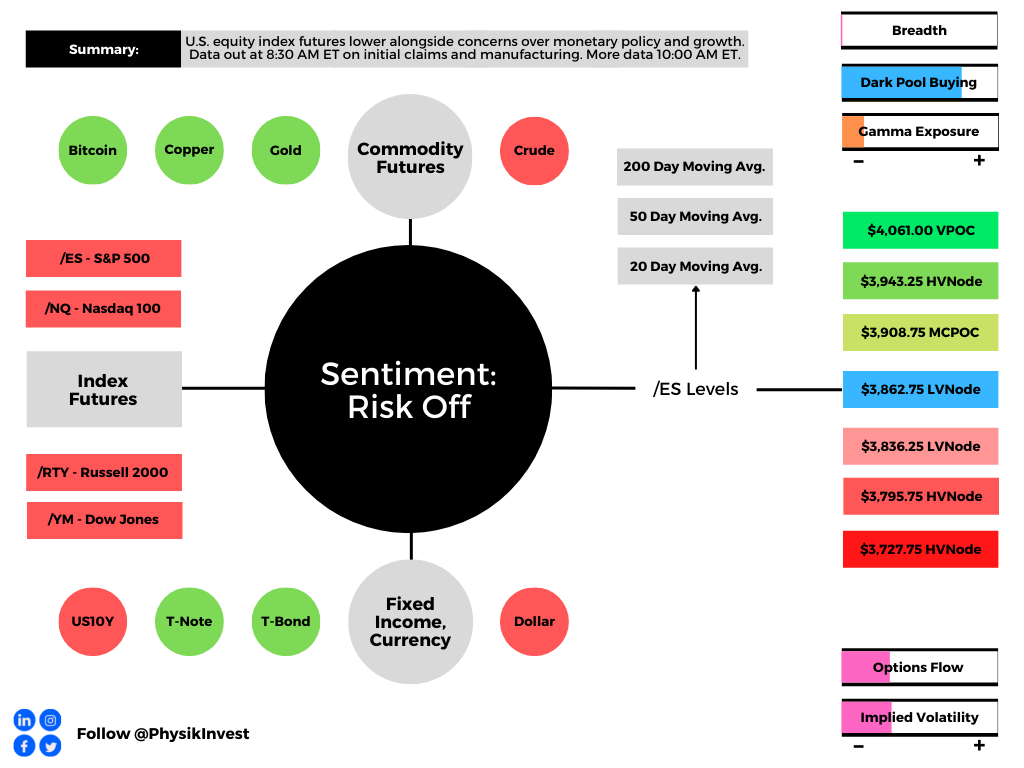
Technical
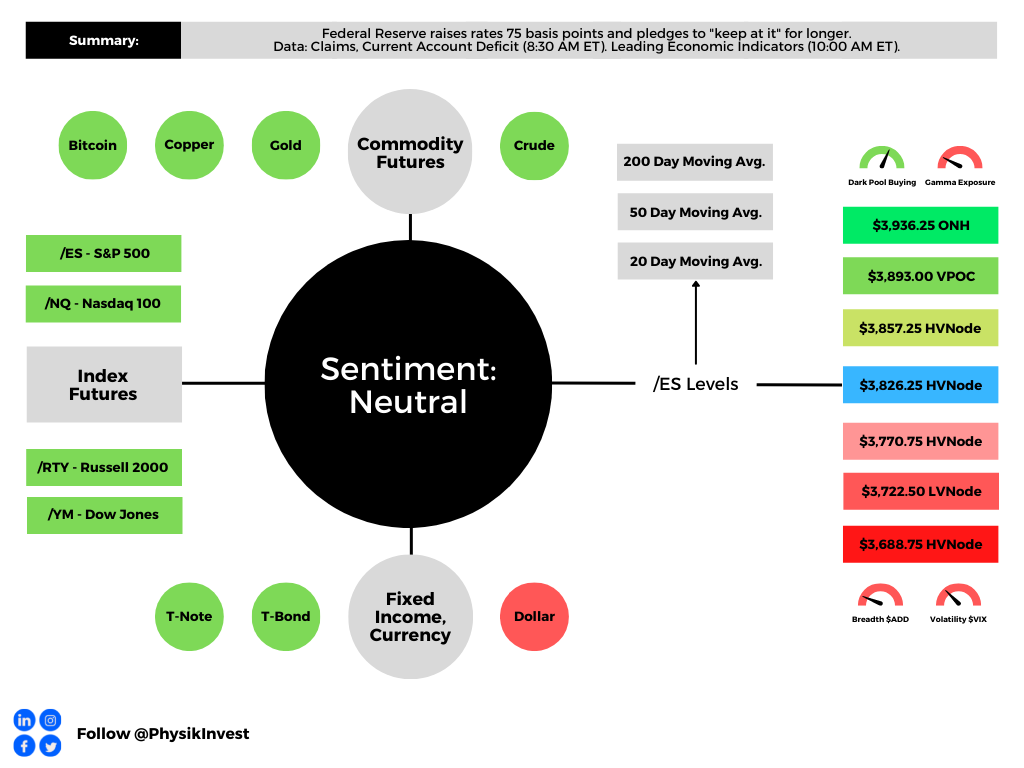
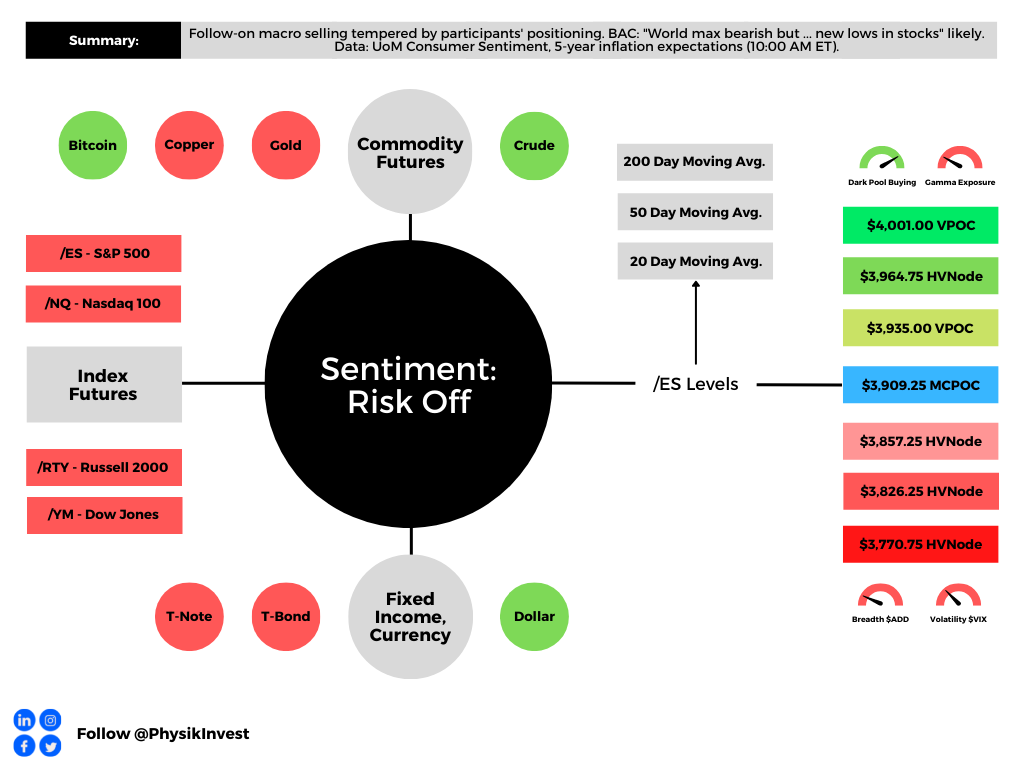
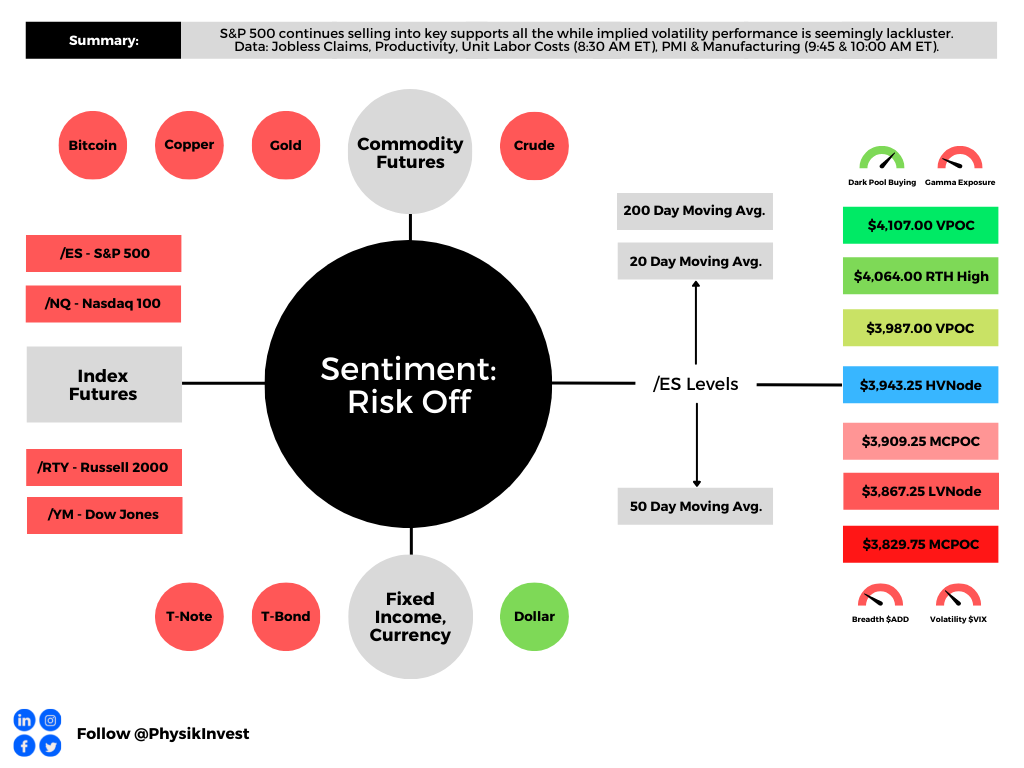
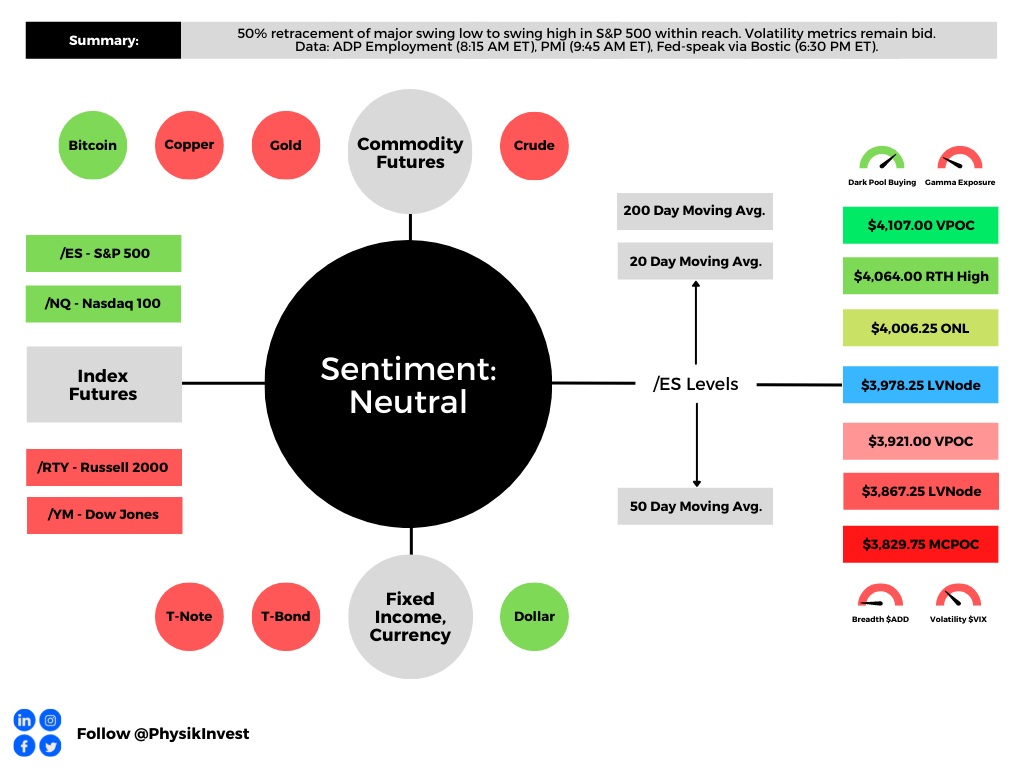
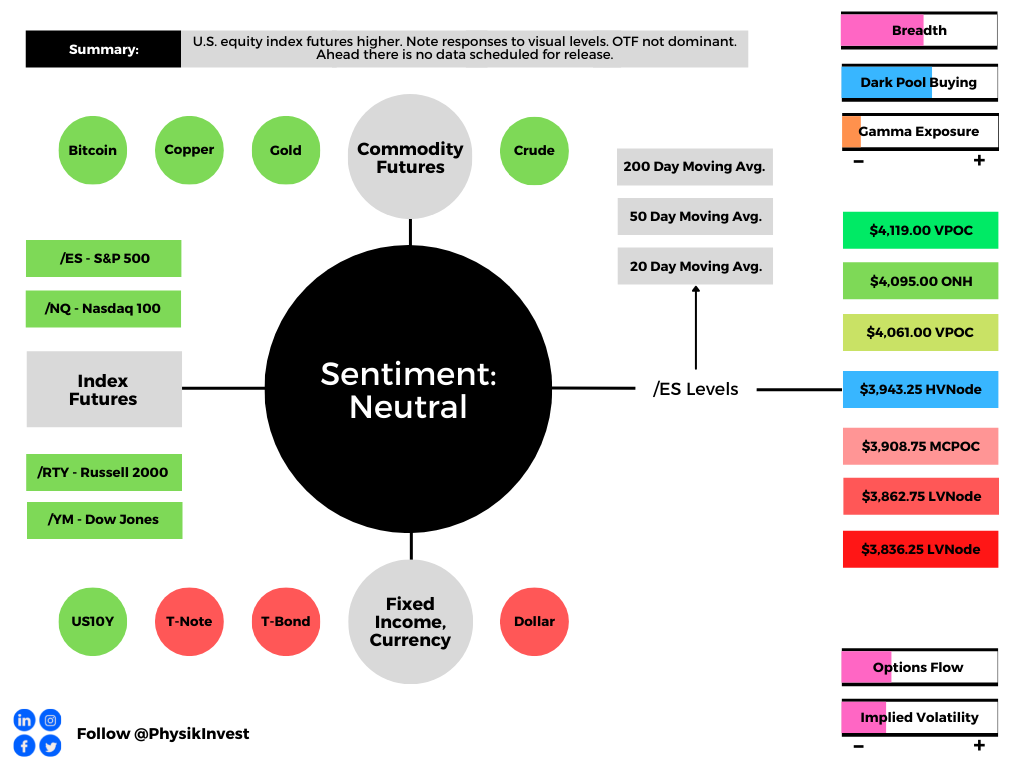
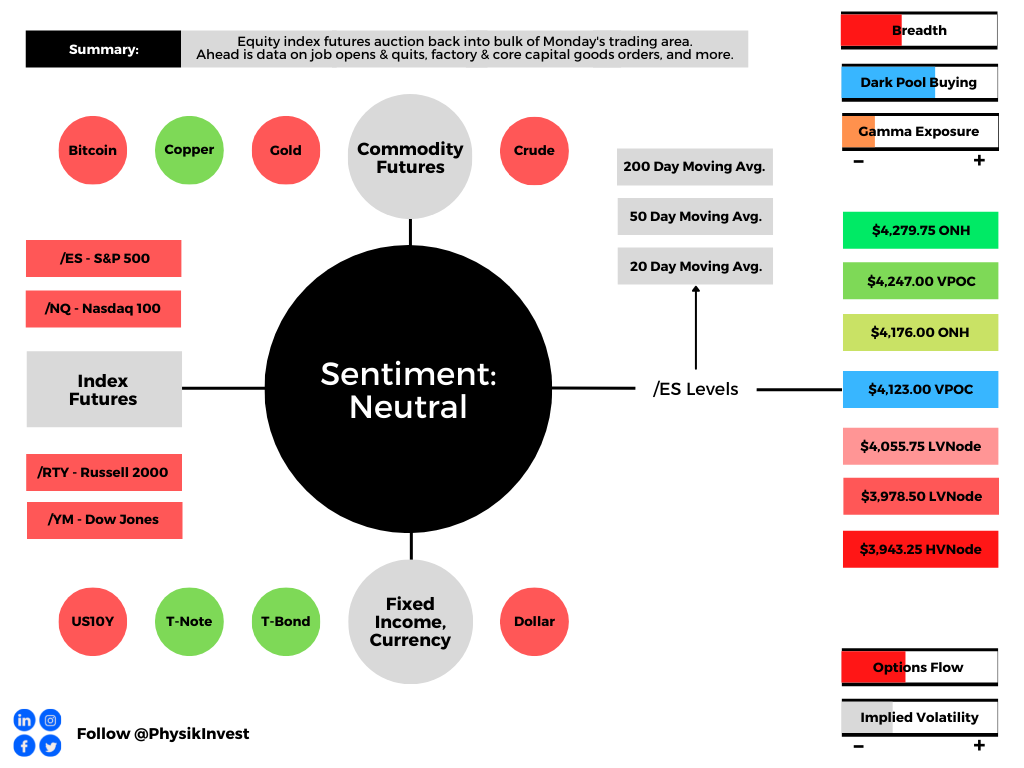
As of 8:00 AM ET, Thursday’s regular session (9:30 AM – 4:00 PM ET), in the S&P 500, is likely to open in the lower part of a negatively skewed overnight inventory, inside of prior-range and -value, suggesting a limited potential for immediate directional opportunity.
In the best case, the S&P 500 trades higher.
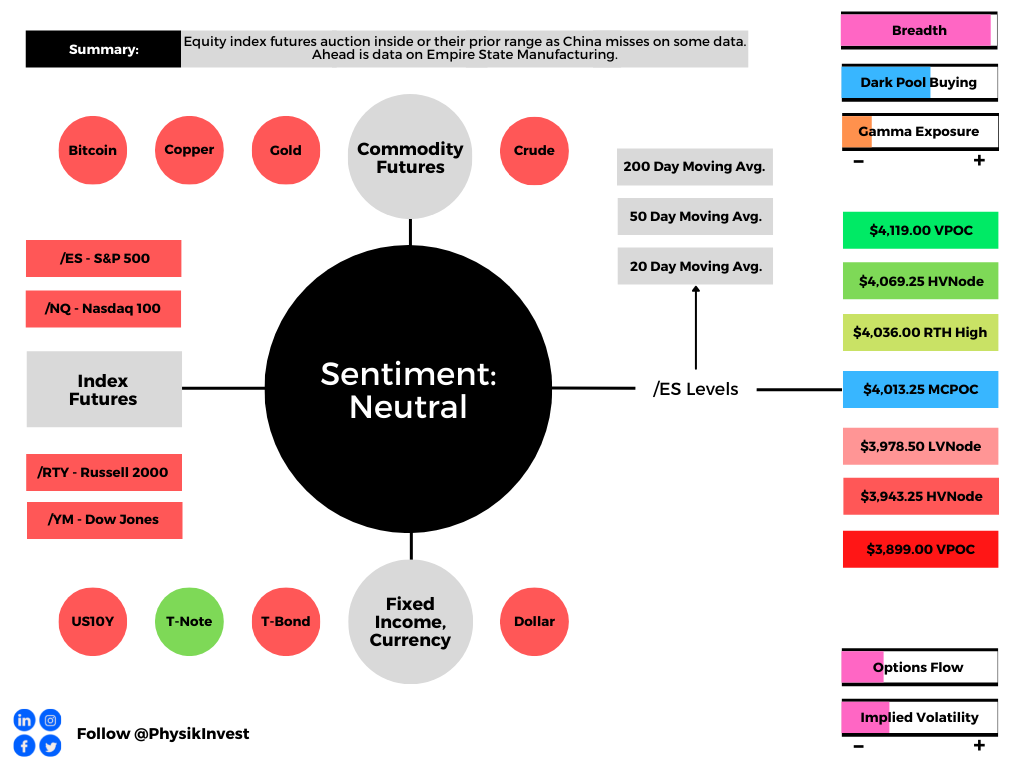
Any activity above the $3,771.25 HVNode puts into play the $3,826.25 HVNode. Initiative trade beyond the last-mentioned could reach as high as the $3,862.25 HVNode and $3,893.00 VPOC, or higher.
In the worst case, the S&P 500 trades lower.
Any activity below the $3,771.25 HVNode puts into play the $3,722.50 LVNode. Initiative trade beyond the LVNode could reach as low as the $3,671.00 VPOC and $3,610.75 HVNode, or lower.
Click here to load today’s key levels into the web-based TradingView charting platform. Note that all levels are derived using the 65-minute timeframe. New links are produced, daily.

Definitions
Volume Areas: A structurally sound market will build on areas of high volume (HVNodes). Should the market trend for long periods of time, it will lack sound structure, identified as low volume areas (LVNodes). LVNodes denote directional conviction and ought to offer support on any test.
If participants were to auction and find acceptance into areas of prior low volume (LVNodes), then future discovery ought to be volatile and quick as participants look to HVNodes for favorable entry or exit.
POCs: POCs are valuable as they denote areas where two-sided trade was most prevalent in a prior day session. Participants will respond to future tests of value as they offer favorable entry and exit.
About
After years of self-education, strategy development, mentorship, and trial-and-error, Renato Leonard Capelj began trading full-time and founded Physik Invest to detail his methods, research, and performance in the markets.
Capelj also develops insights around impactful options market dynamics at SpotGamma and is a Benzinga reporter.
Some of his works include conversations with ARK Invest’s Catherine Wood, investors Kevin O’Leary and John Chambers, FTX’s Sam Bankman-Fried, ex-Bridgewater Associate Andy Constan, Kai Volatility’s Cem Karsan, The Ambrus Group’s Kris Sidial, among many others.
Disclaimer
In no way should the materials herein be construed as advice. Derivatives carry a substantial risk of loss. All content is for informational purposes only.