Physik Invest’s Daily Brief is read by over 1,200 people. To join this community and learn about the fundamental and technical drivers of markets, subscribe below.
Team, it’s been insane on my end. Physik Invest’s Daily Brief will be paused through the end of this week (November 24 and 25). Wishing you happy holidays!
Hopefully, clearer notes and consistent releases to resume, after the break.
Crypto Turmoil Persists:
The FTX (CRYPTO: FTT) debacle has induced even more illiquidity.
Bloomberg’s Matt Levine wrote that the fall in liquidity “has been dubbed the ‘Alameda Gap,’” noting that “[p]lunges in liquidity usually come during periods of volatility as trading shops pull bids and asks from their order books.”
Turmoil and Opportunity:
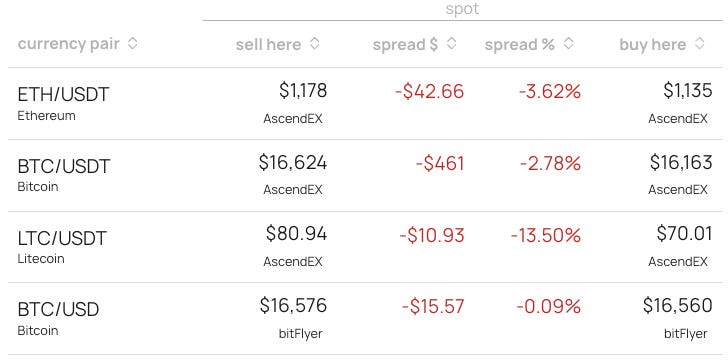
You may take advantage of the aforementioned uncertainties through arbitrage (i.e., buy at a lower price at one venue and sell at a higher price at another venue). Notice the ~$500 spread on BTC/USDT, for instance.
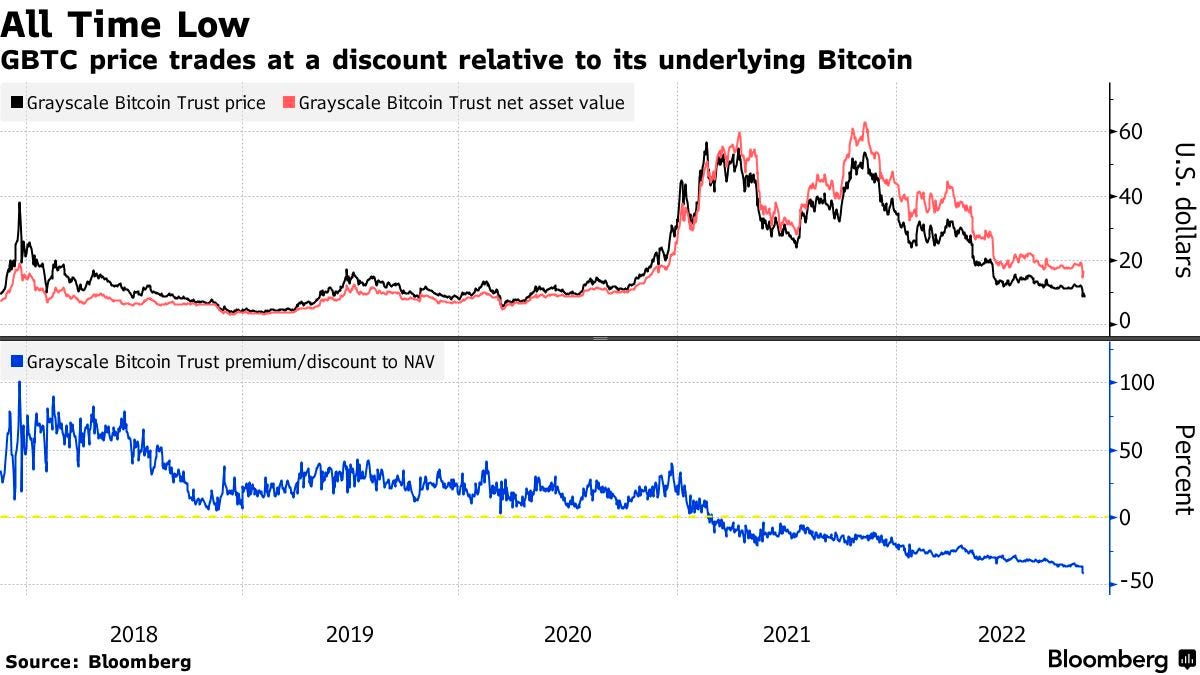
Elsewhere, the Grayscale Bitcoin Trust (OTC: GBTC) is trading at a ~43.00% discount to the value of the Bitcoin (CRYPTO: BTC) it holds.
Per Bloomberg, “US regulators have repeatedly denied applications to convert GBTC into a physically-backed exchange-traded fund,” and that means the fund is not “able to redeem shares to keep pace with shifting demand.”
To note, the discount pales in comparison to the 101.00% premium to the net-asset value achieved in December 2017. The average net-asset value is a 12.00% premium.
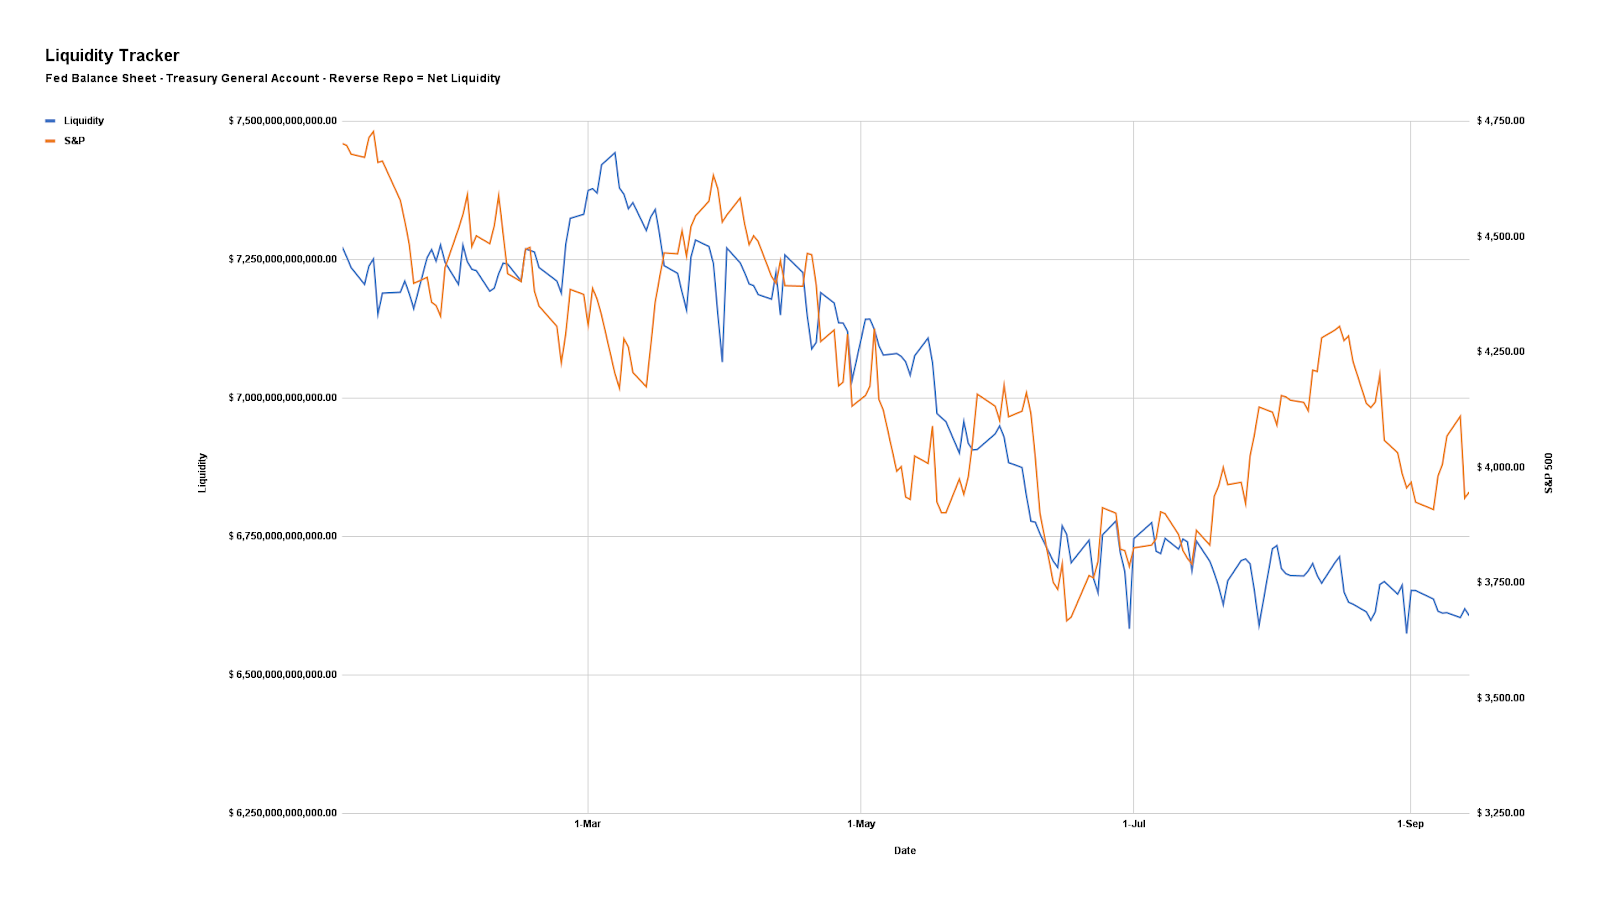
Anyways, in greater detail, we discussed the crypto turmoil on November 9 and 10. Those notes may be of interest if the context is desired. Though this is not a crypto-focused letter, crypto is “tied up in the liquidity bubble that exists across all assets.”
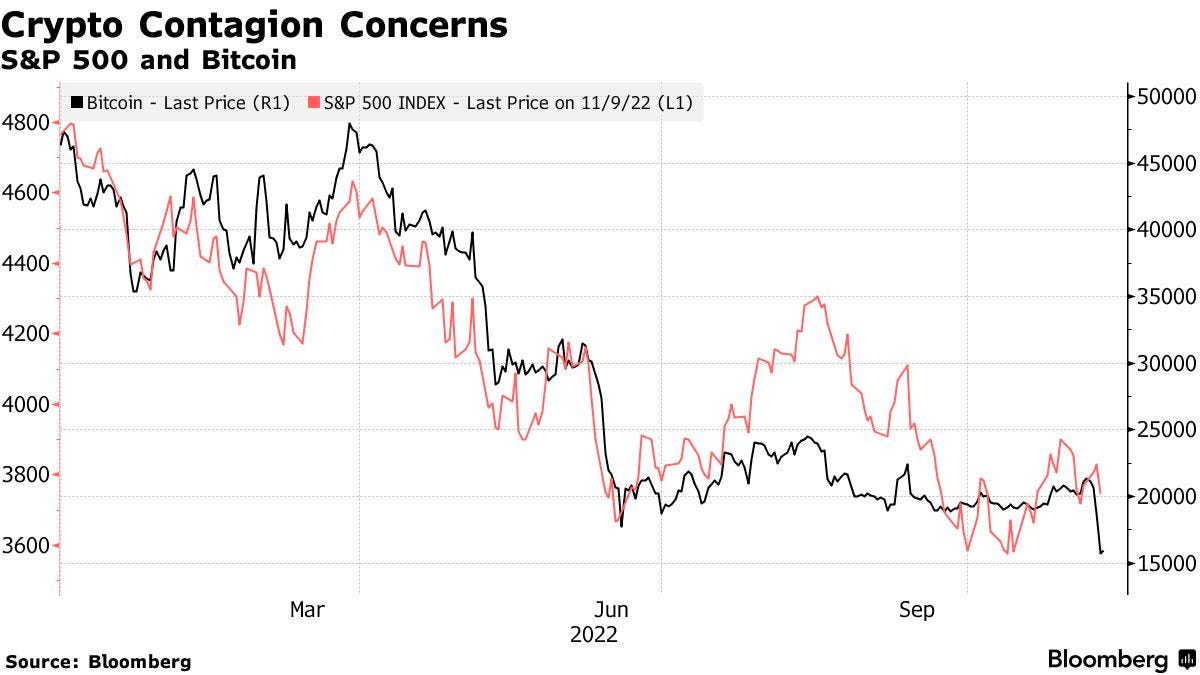
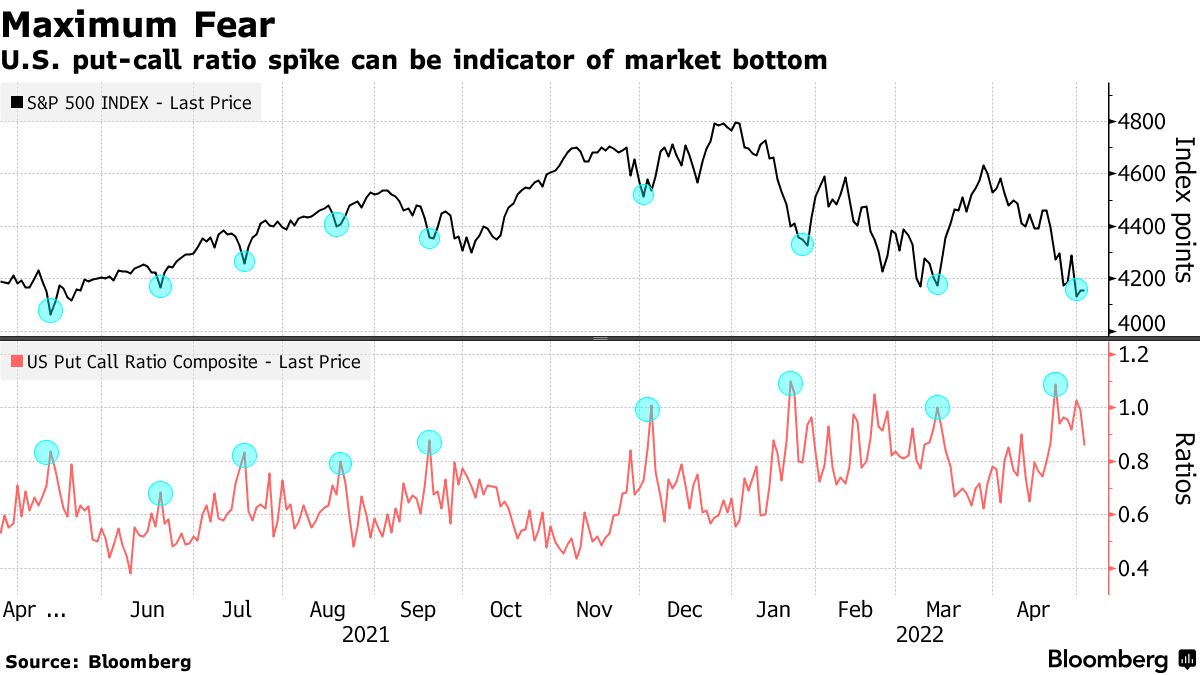
As an example, during the week of November 8, when the narrative surrounding FTX’s demise was at its peak, the S&P 500 (INDEX: SPX), Bitcoin (CRYPTO: BTC), and FTX Trading token (CRYPTO: FTT) slid lower, bottomed, and rallied in sync.
Uncertainty, Correlation, and Positioning:
This is a part of the letter that may appear somewhat similar. We continue carrying forward and building on past analyses.
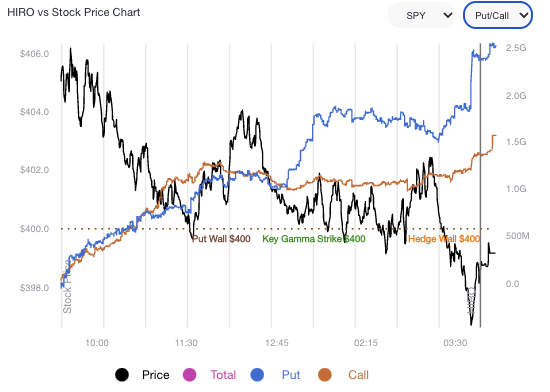
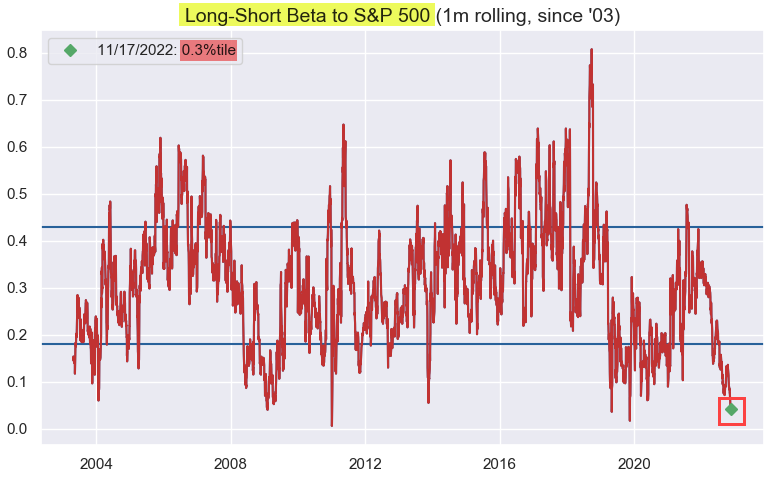
At its core, breakages in correlations some may have observed are accentuated by positioning forces we have talked about recently, as well as the above. These forces are important as you may have noticed the S&P 500’s tendency in responding to areas quoted by this letter.
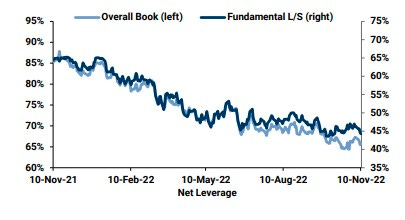
In a nutshell, in light of a “de-grossing of ‘shorts’” per Nomura Holdings Inc (NYSE: NMR), the sale of the volatility investors owned, after events such as elections and CPI, boosted markets indirectly (i.e., counterparty exposure to risk declines as the market rises and investors sell volatility → counterparty reduces the size of their negative Delta hedges → this reduces market pressure and bolsters a rally).
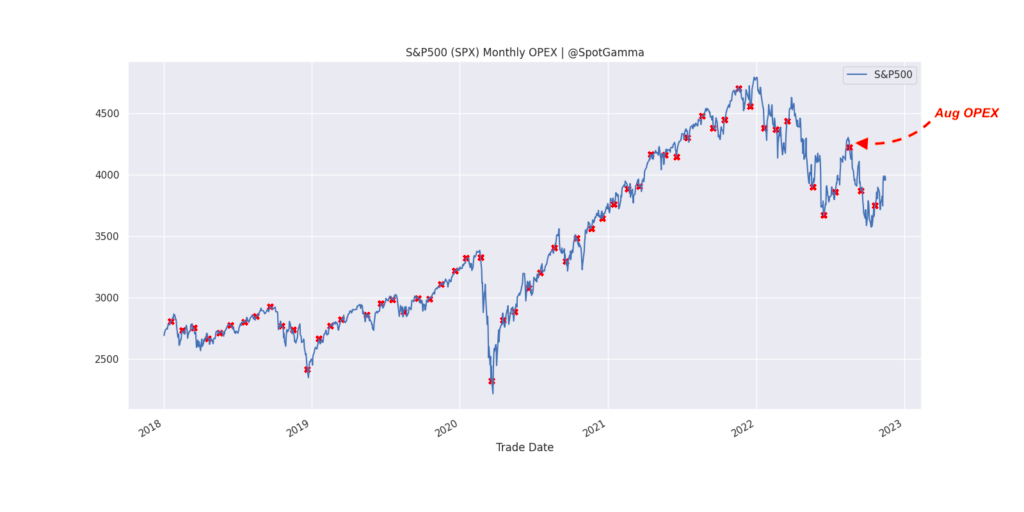
Investors’ continued supply of protection, all the while markets were rising, resulted in further indirect support and, later, prompted responsiveness to key areas at which the options activity was concentrated. This was better detailed on November 16 and 18.
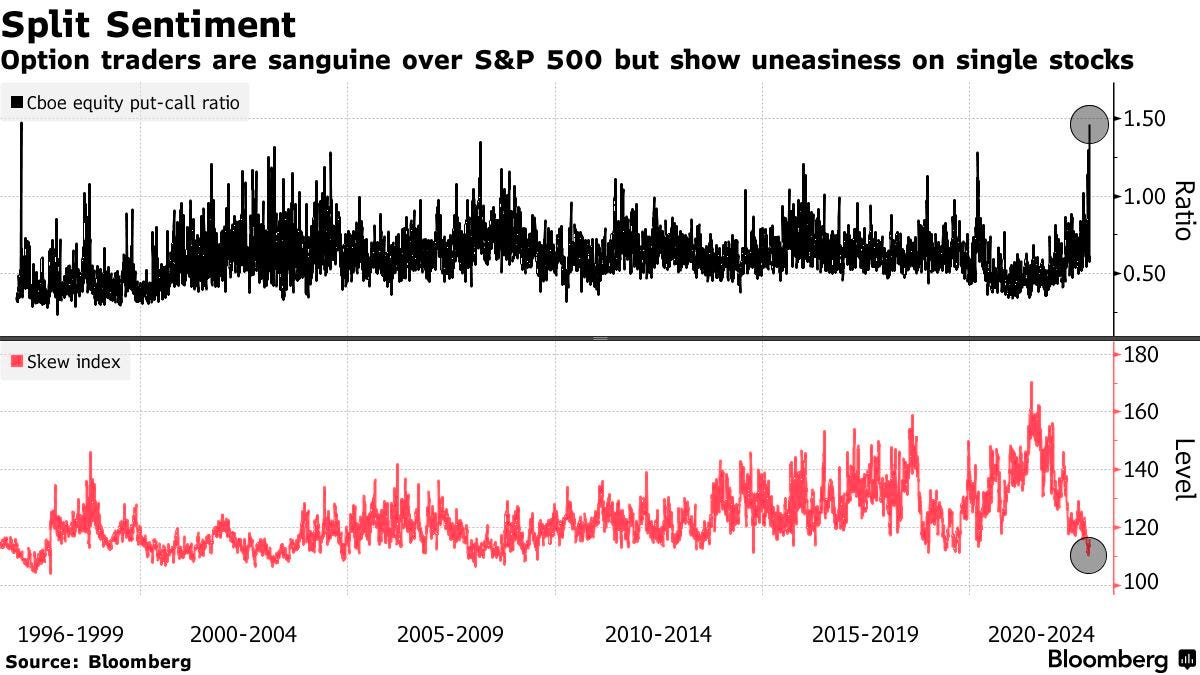
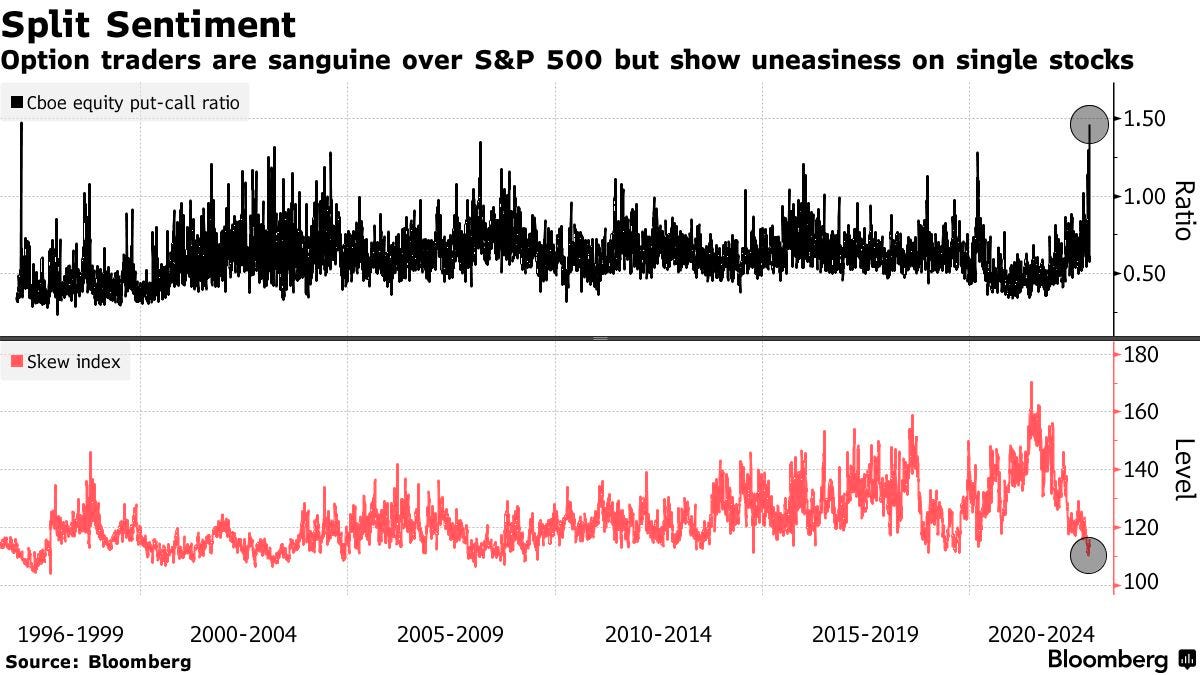
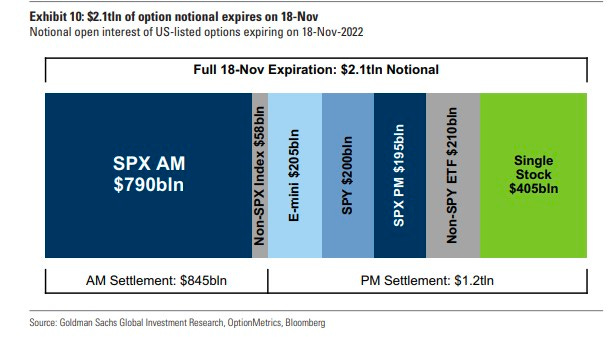
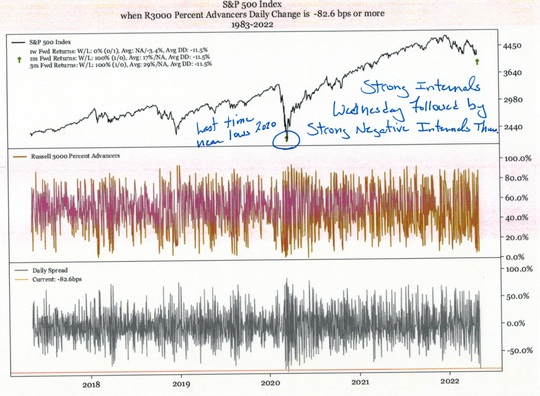
While this activity is happening – the S&P pinning – underlying constituents are swinging far more amid traders’ own “uneasiness” in stocks and the crypto turmoil; if there are forces pinning and supporting the S&P, all the while there are constraints connecting it to wild(er) components, then something (e.g., correlation) has to give.
Expecting More Of The Same For Now:
Nonetheless, it’s likely for this wild activity under the surface to continue, and for the S&P 500, itself, to be the recipient of even more supportive flows.
For example, the buyback related to the pulled-forward decay of options’ Delta with respect to time (Charm) and continued sale of volatility (Vanna), in a lower liquidity environment, likely results in hedging flows enforcing seasonality and masking the wild(ness) mentioned above.
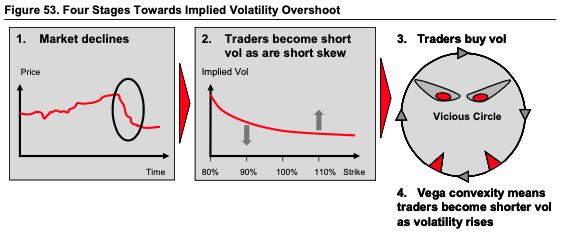
Risks Building Under The Surface:
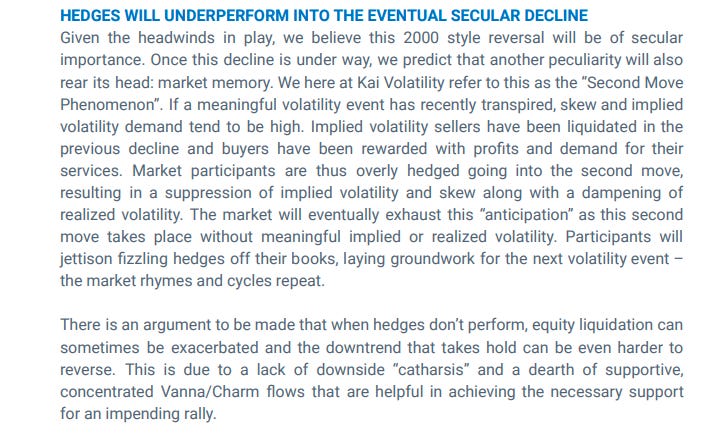
However, what is happening right now may set the stage for persistently high realized volatility (RVOL) when something bad does happen and those flows we talked about do less to resist that underlying volatility and weakness.
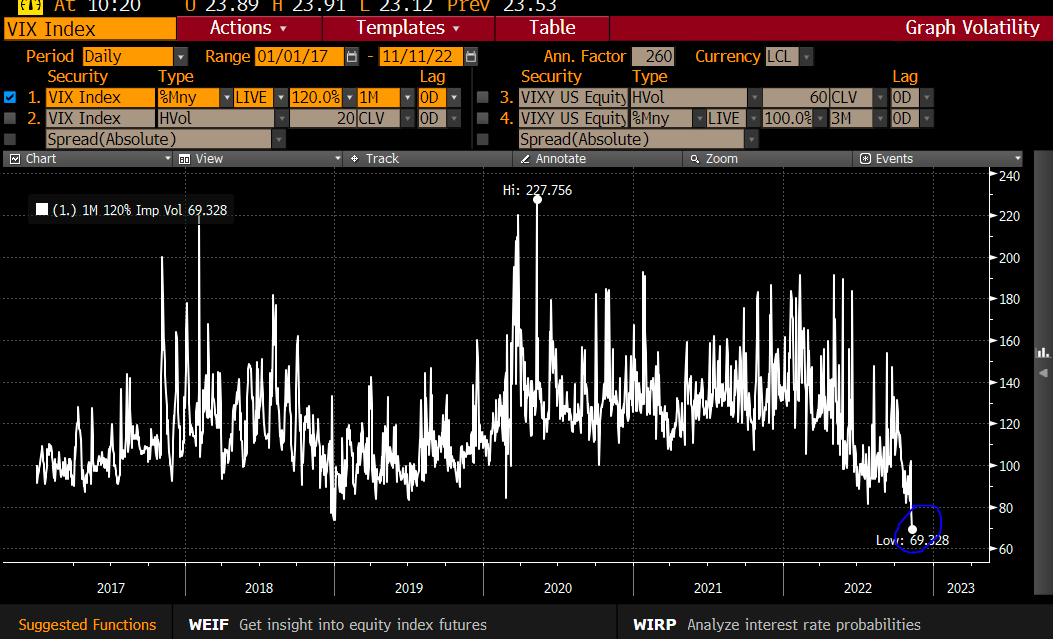
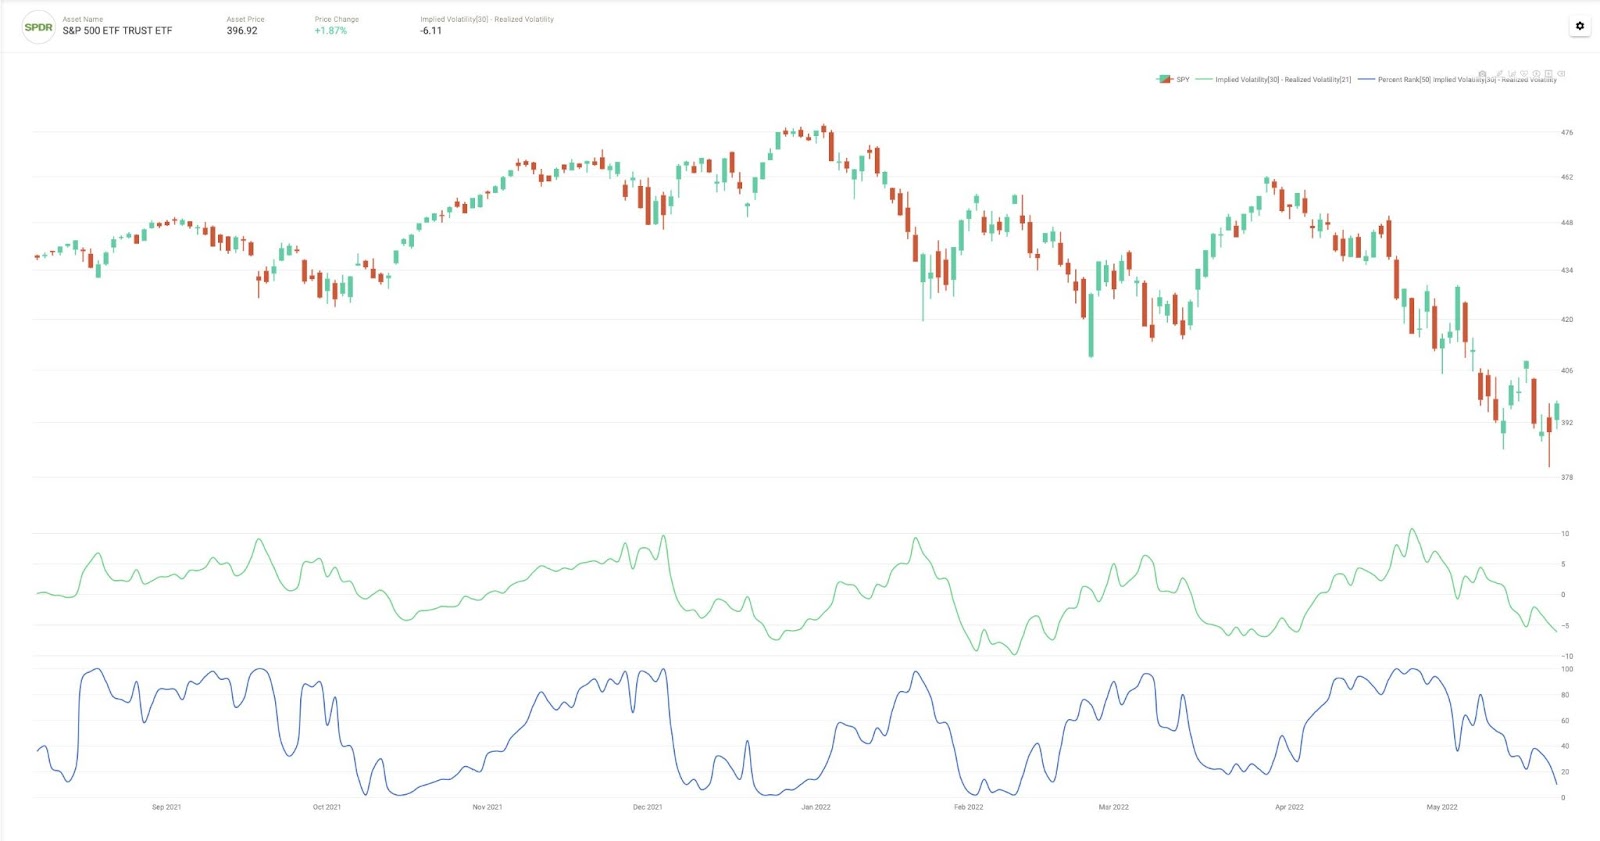
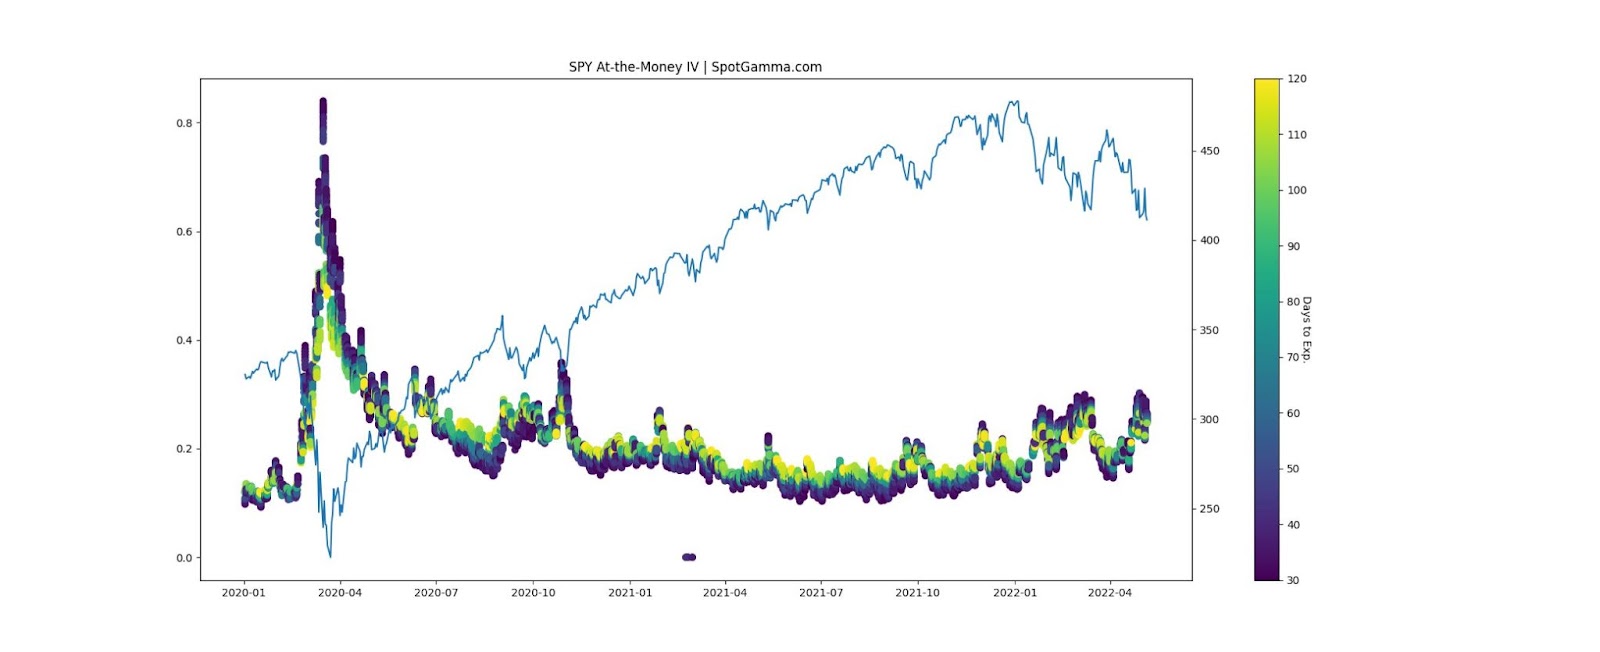
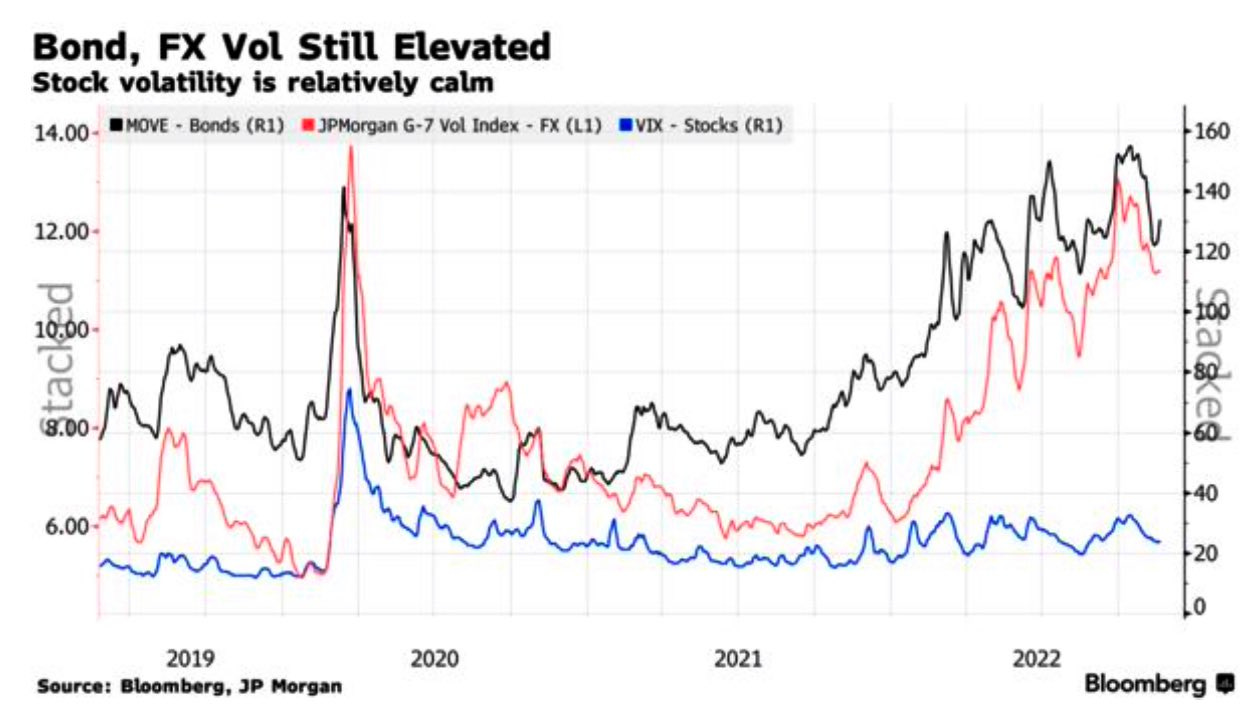
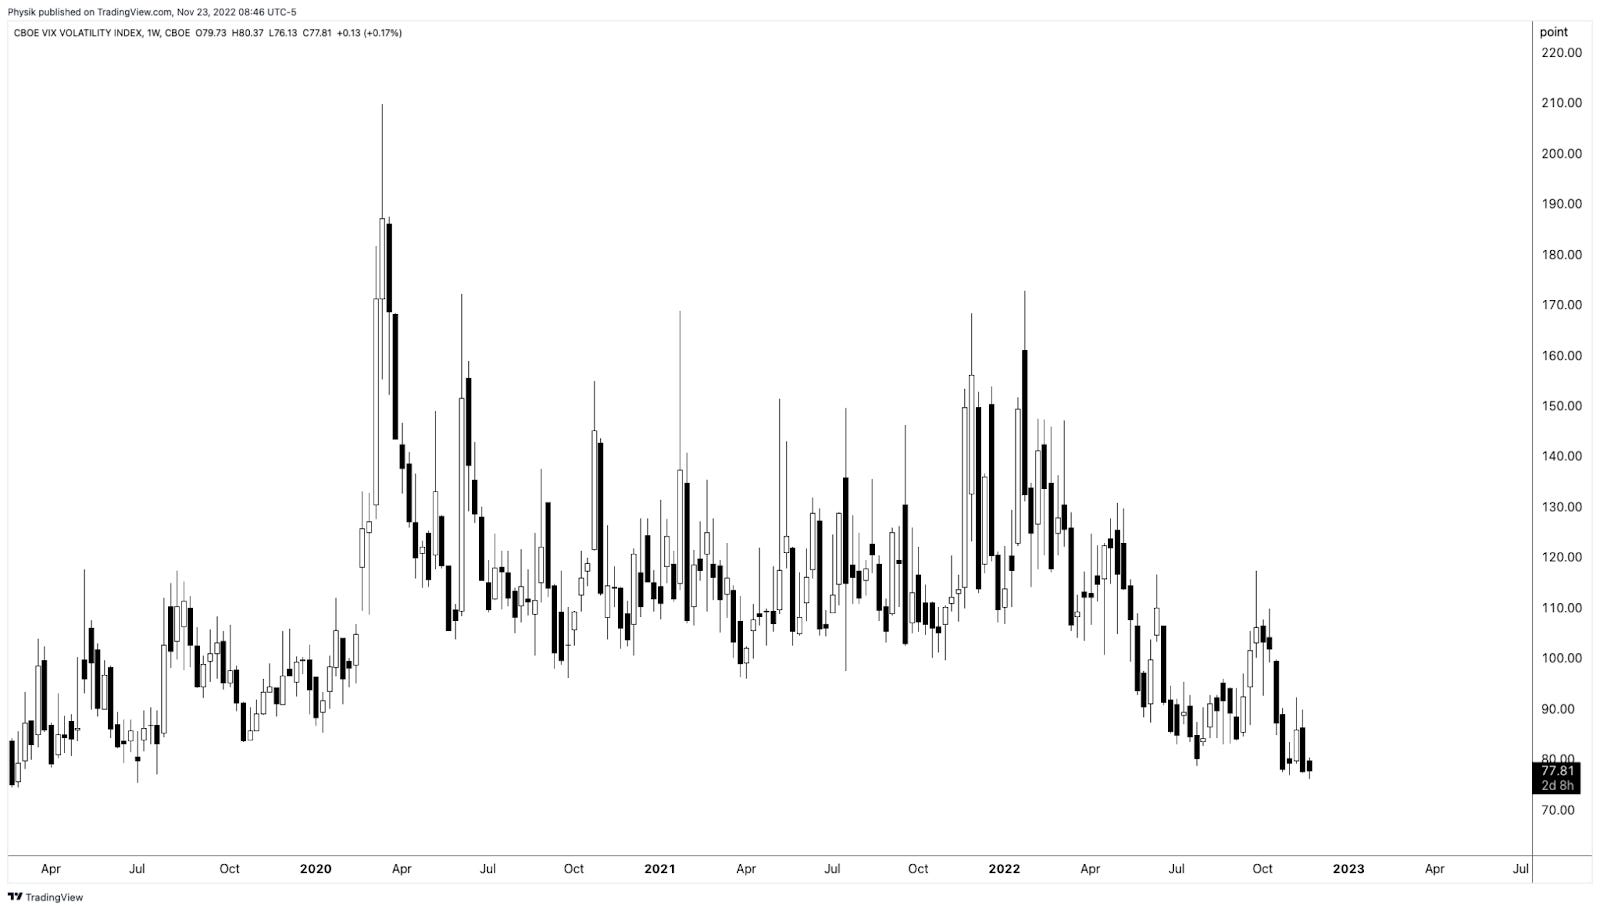
To explain, implied volatility (IVOL) has performed poorly in the context of 2022’s far-reaching decline. That’s in part the result of proactive hedging and monetization of protection (i.e., supply) into the decline.
Investors, with IVOL performing poorly, are pushed into better-performing strategies. That includes selling IVOL which does less and less to boost the markets more and more (i.e., per SpotGamma, “the marginal impact of added volatility compression is far lower” at this juncture).
Accordingly, the market is left in a more precarious, less well-hedged position, and that’s concerning given some of the cracks that have appeared including the Credit Suisse Group AG (NYSE: CS) debacle covered in October, the UK liability-driven investment funds covered in September, interest rate swap risks, and beyond.
SCT Capital’s Hari Krishnan talked about some of these risks on a recent podcast.
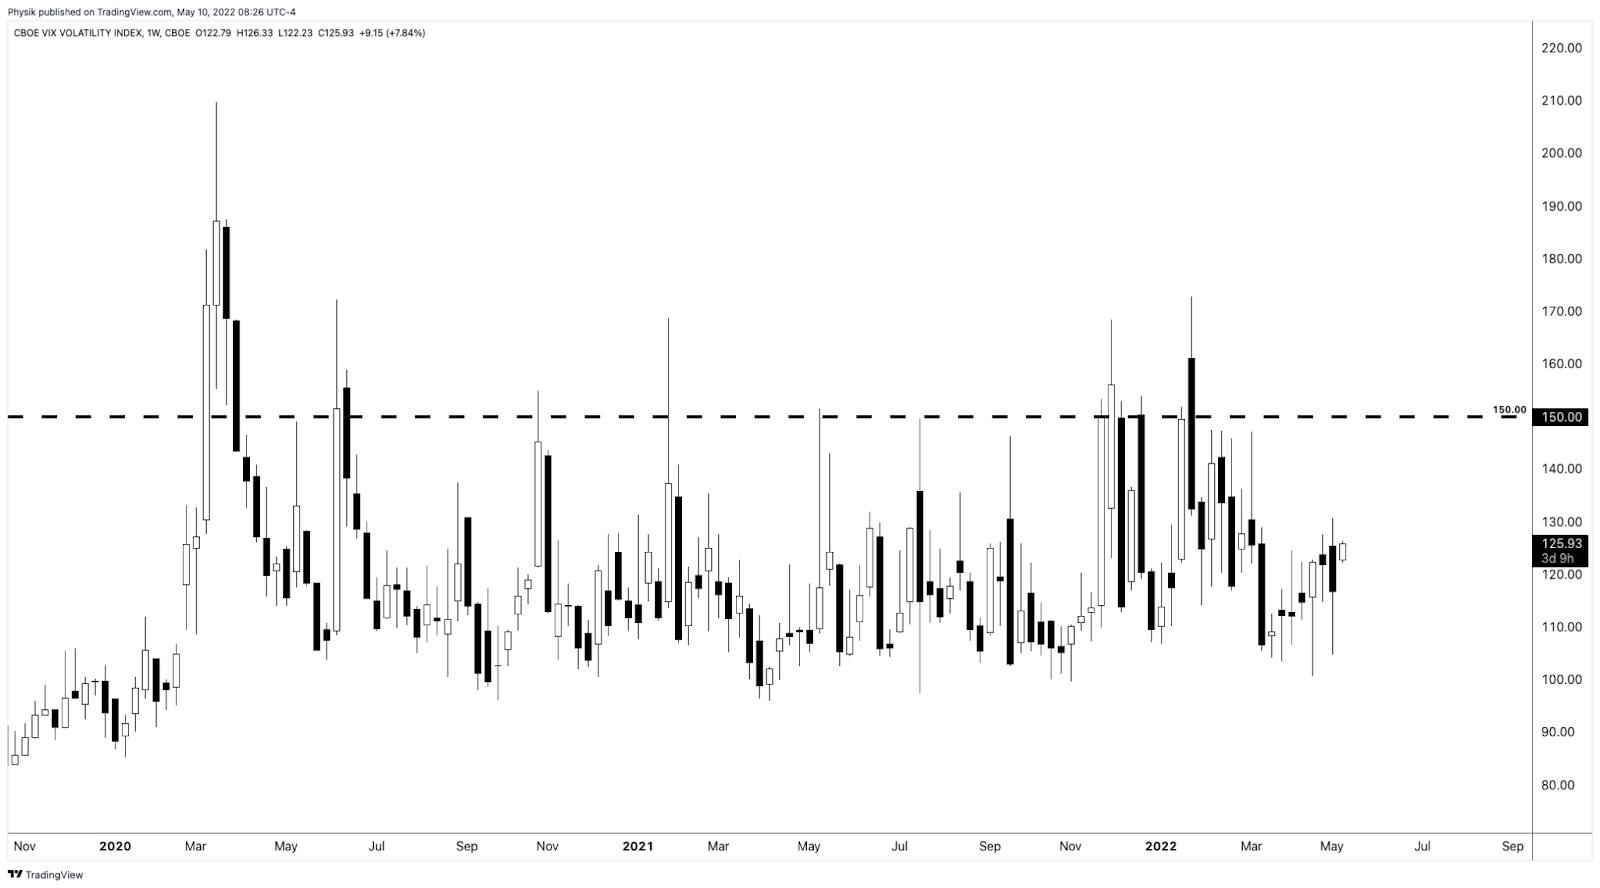
In Essence, It’s Cheap To Hedge:
According to SpotGamma, “if you wanted to hedge, … it is historically cheap.”
When you think there is to be an outsized move in the underlying, relative to what is priced, you buy options (+Gamma or positive exposure to directional movement).
When you think there is to be an outsized move in the implied volatility, relative to what is priced, you buy options (+Volga or positive exposure to IVOL changes).
If there’s a large change in direction (RVOL) or IVOL repricing, you may make money.
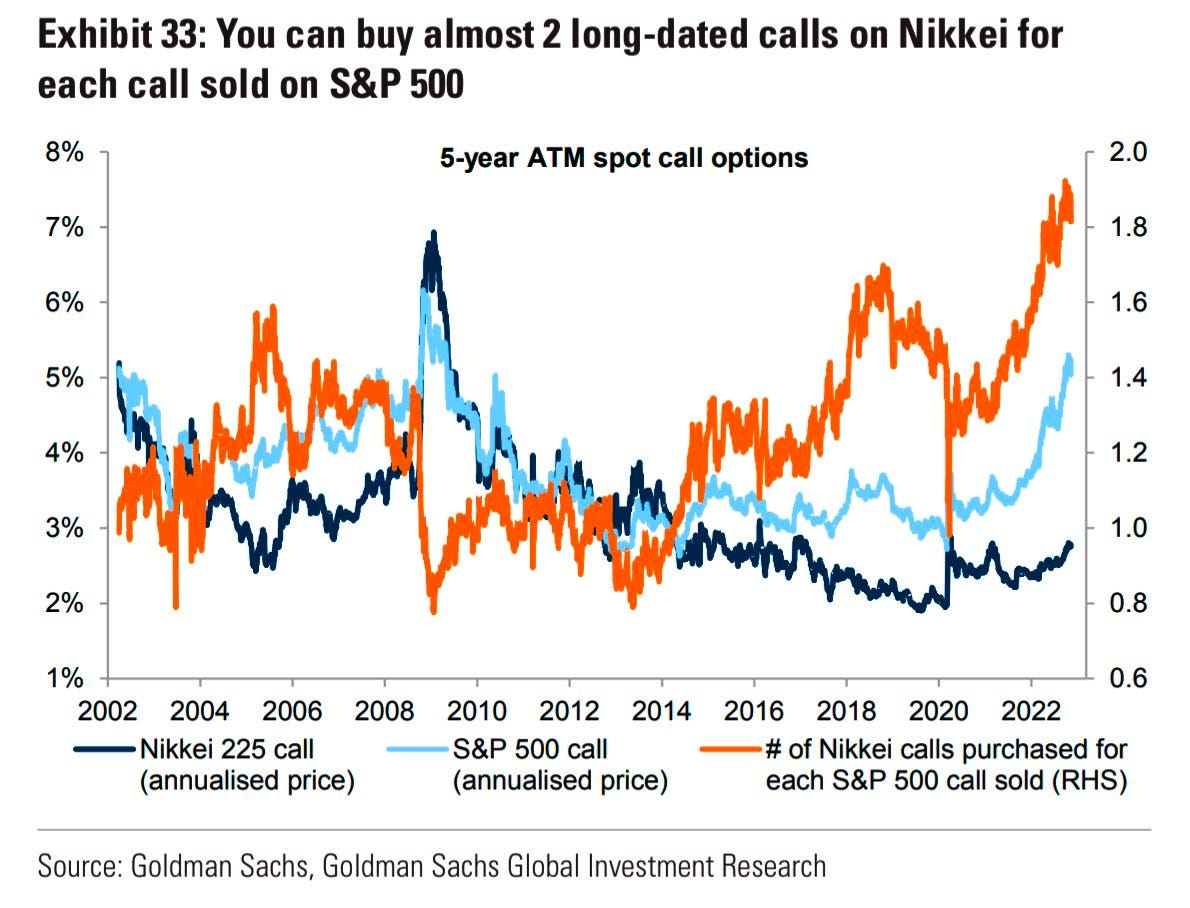
As an example, in mid-June, a trading partner and I noticed a change in tone in the non-linearity of volatility and skew with respect to linear changes in the price of the market (or S&P 500). The prices of ratio spread structures (i.e., long or short one option near-the-money, short or long two or more further out-of-the-money) changed by hundreds of percent for only a few basis points of change in the indexes.
At the time, Kai Volatility’s Cem Karsan noted this was “a spike in short-dated -sticky skew, [the] first we’ve seen since [the] secular decline began and it hints [at] a potentially critical change in dealer positioning [and] the distribution of underlying outcomes.”
“We’re transitioning to a fat left tail, right-based distribution,” he added.
So why does any of this matter?
In essence, it’s cheap to hedge and the context is there for you to do so, at least from a volatility (not directional) perspective.
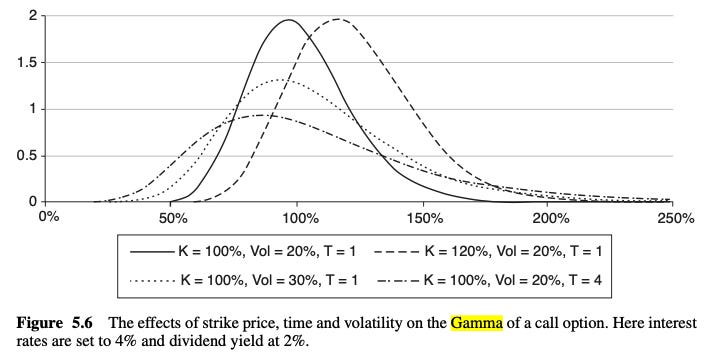
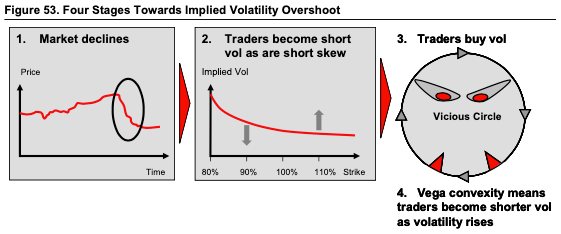
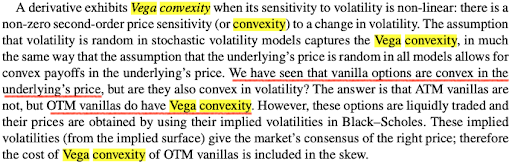
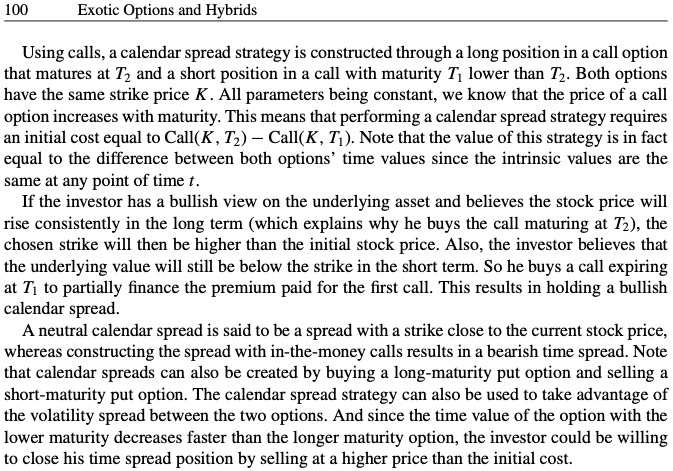
Here is an excerpt from Mohamed Bouzoubaa et al’s book Exotic Options and Hybrids to support some of the earlier statements.
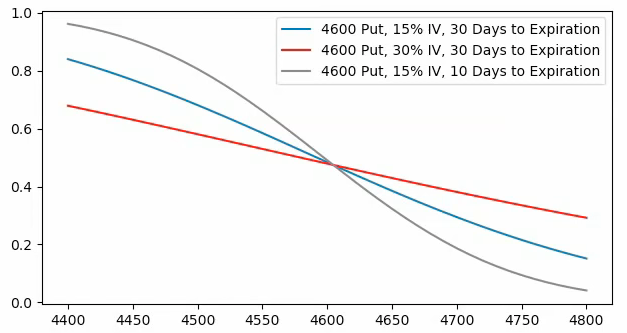
Options have a “non-zero second-order price sensitivity (or convexity) to a change in volatility,” Bouzoubaa et al explain. “ATM vanillas are [not] convex in the underlying’s price, … but OTM vanillas do have vega convexity … [so], when the holder of an option is long vega convexity, we say she is long vol-of-vol.”
In other words, by owning protection that’s far from current prices, you are positioned to monetize on a non-linear repricing of volatility, something we saw earlier this year and may continue to see.
Doing this in a manner that cuts decay (when nothing happens) is the difficult part.
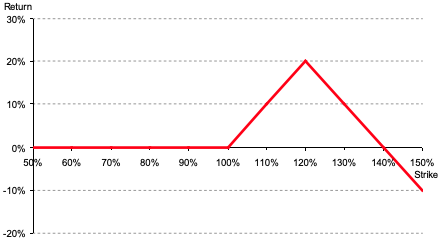
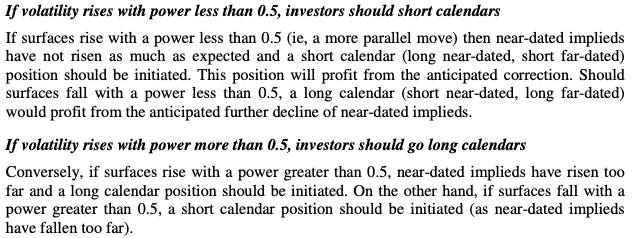
Calendar and diagonal spreads come to mind (i.e., sell a short-dated option and buy a far-dated option). You are betting against movement (negative Gamma) over a span of time you don’t think the market will move (e.g., Thanksgiving). And, you are betting on movement (positive Gamma) over a larger span of time (e.g., after Thanksgiving) where decay may not be as accelerated.
Ultimately, counterparties’ response to new demands for protection, if something bad happens later, would exacerbate movement and aid in the repricing of IVOL.
At that new IVOL level, there would be more stored energy to catalyze a rally and this letter would express that.
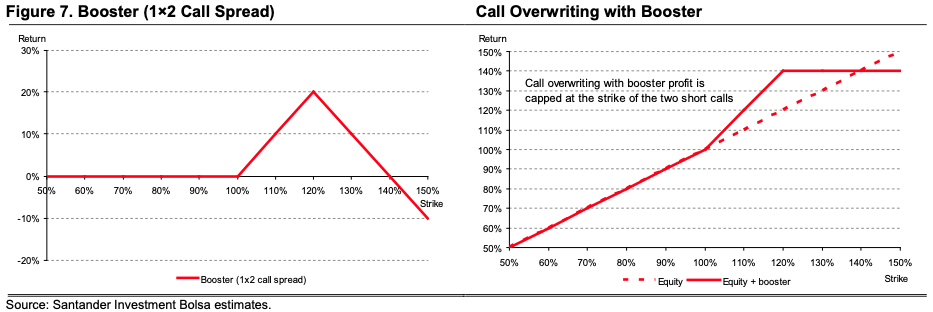
To sell downside volatility (or puts) at this juncture (with time) is a poor trade. To sell downside volatility as part of a larger, more complex structure could be a good trade (e.g., sell a call spread to finance an ultra-wide SPX put ratio spread).
It all depends on structure and management.
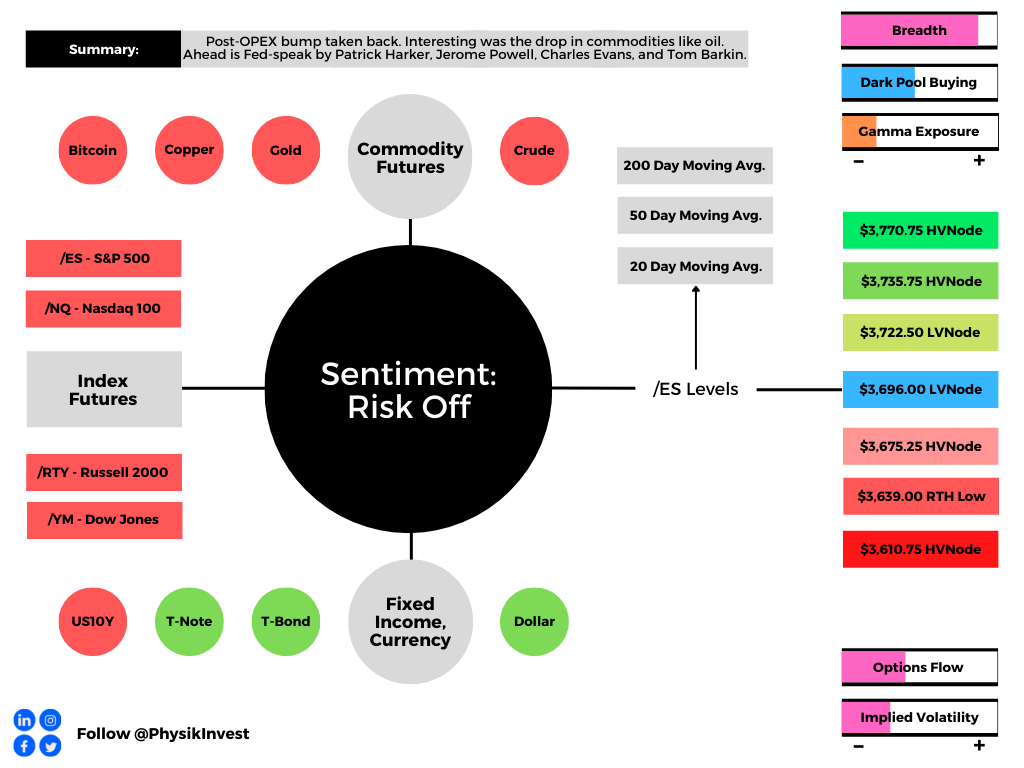
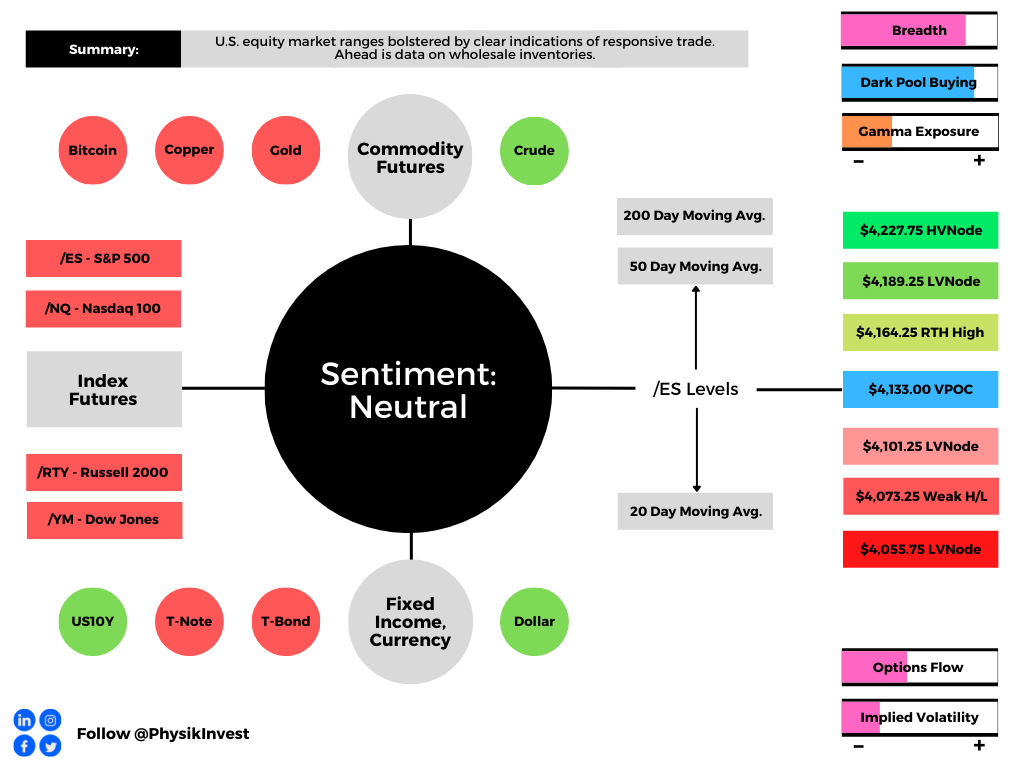
Technical
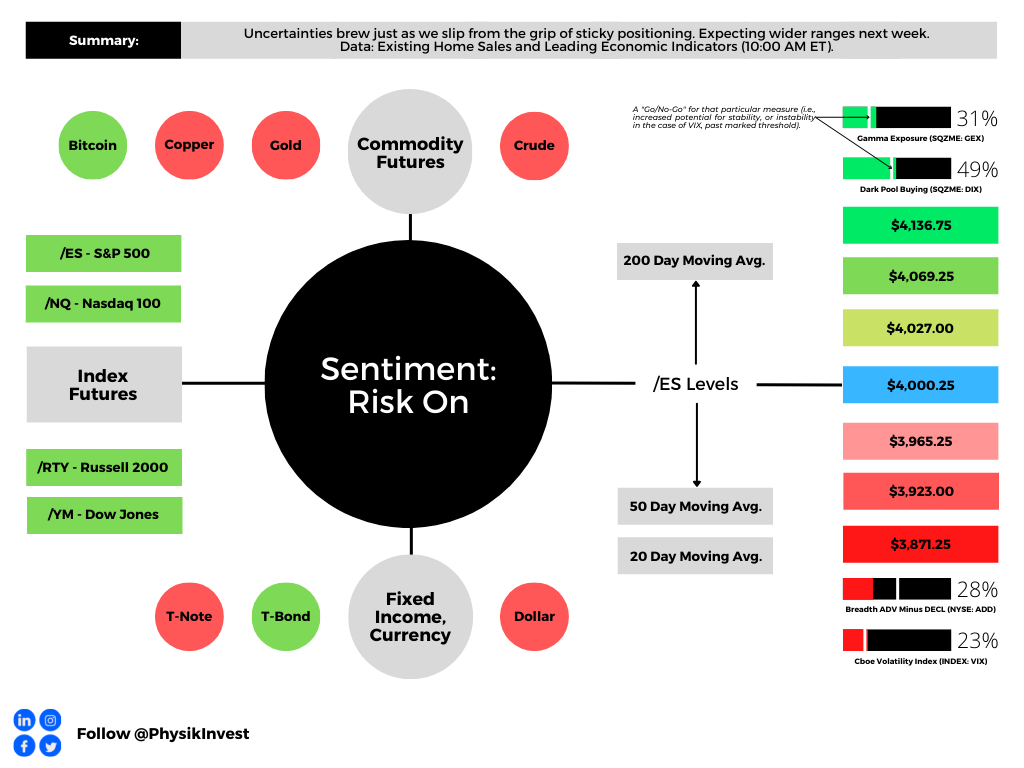
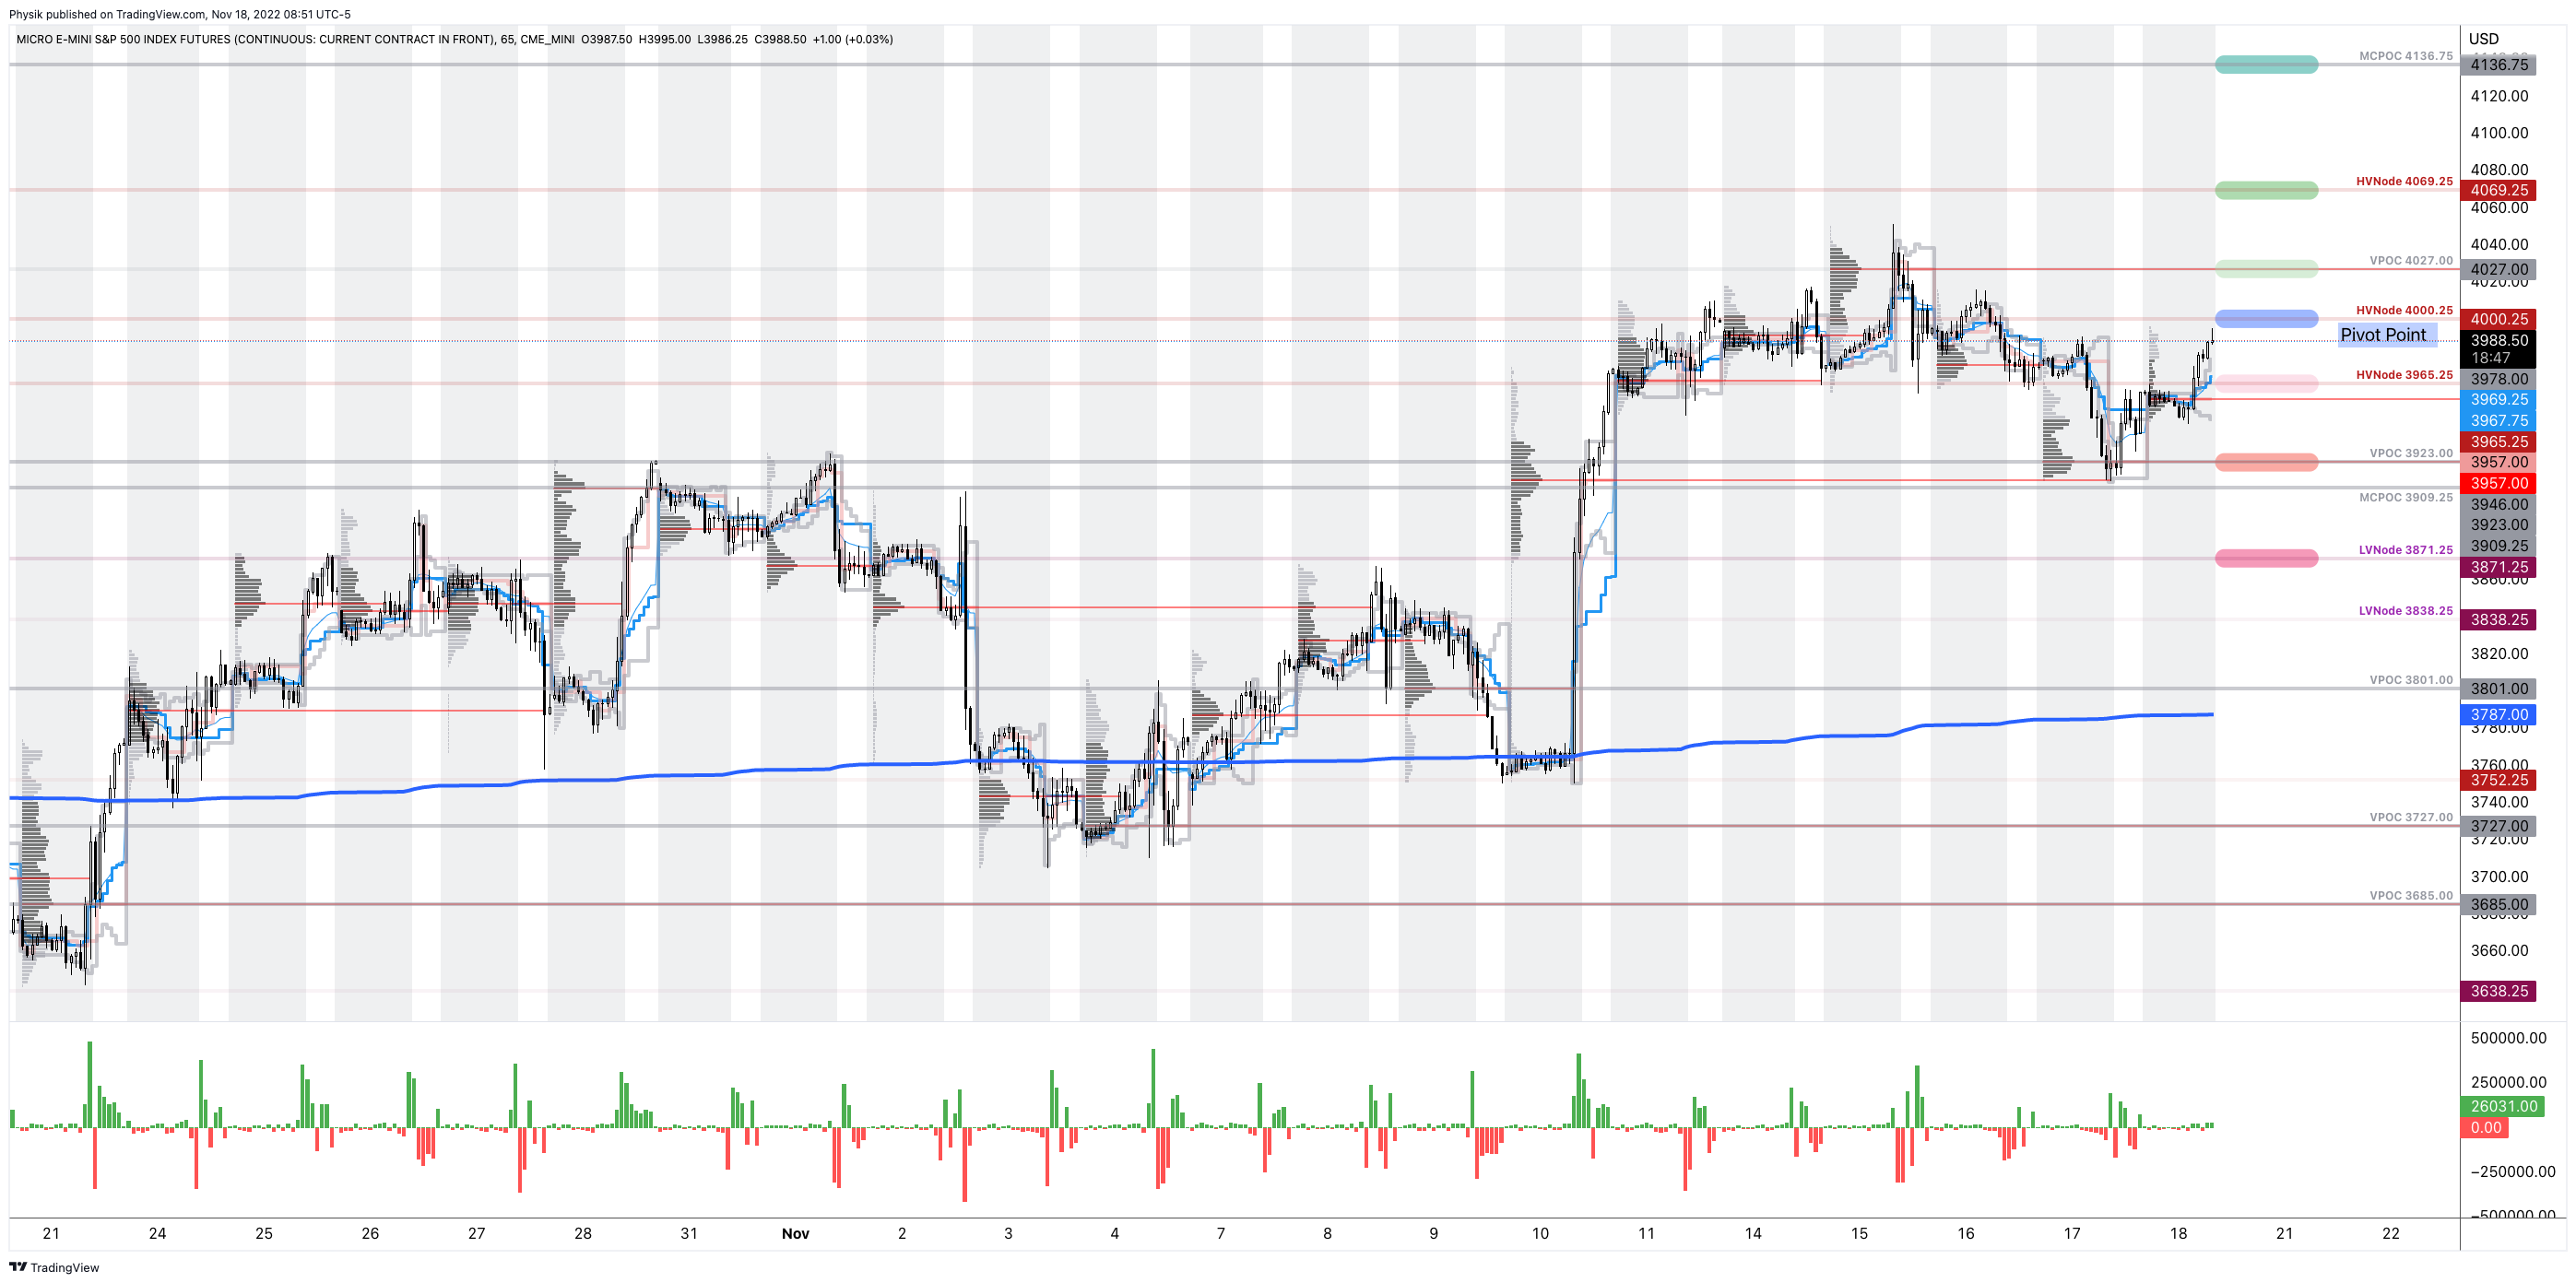
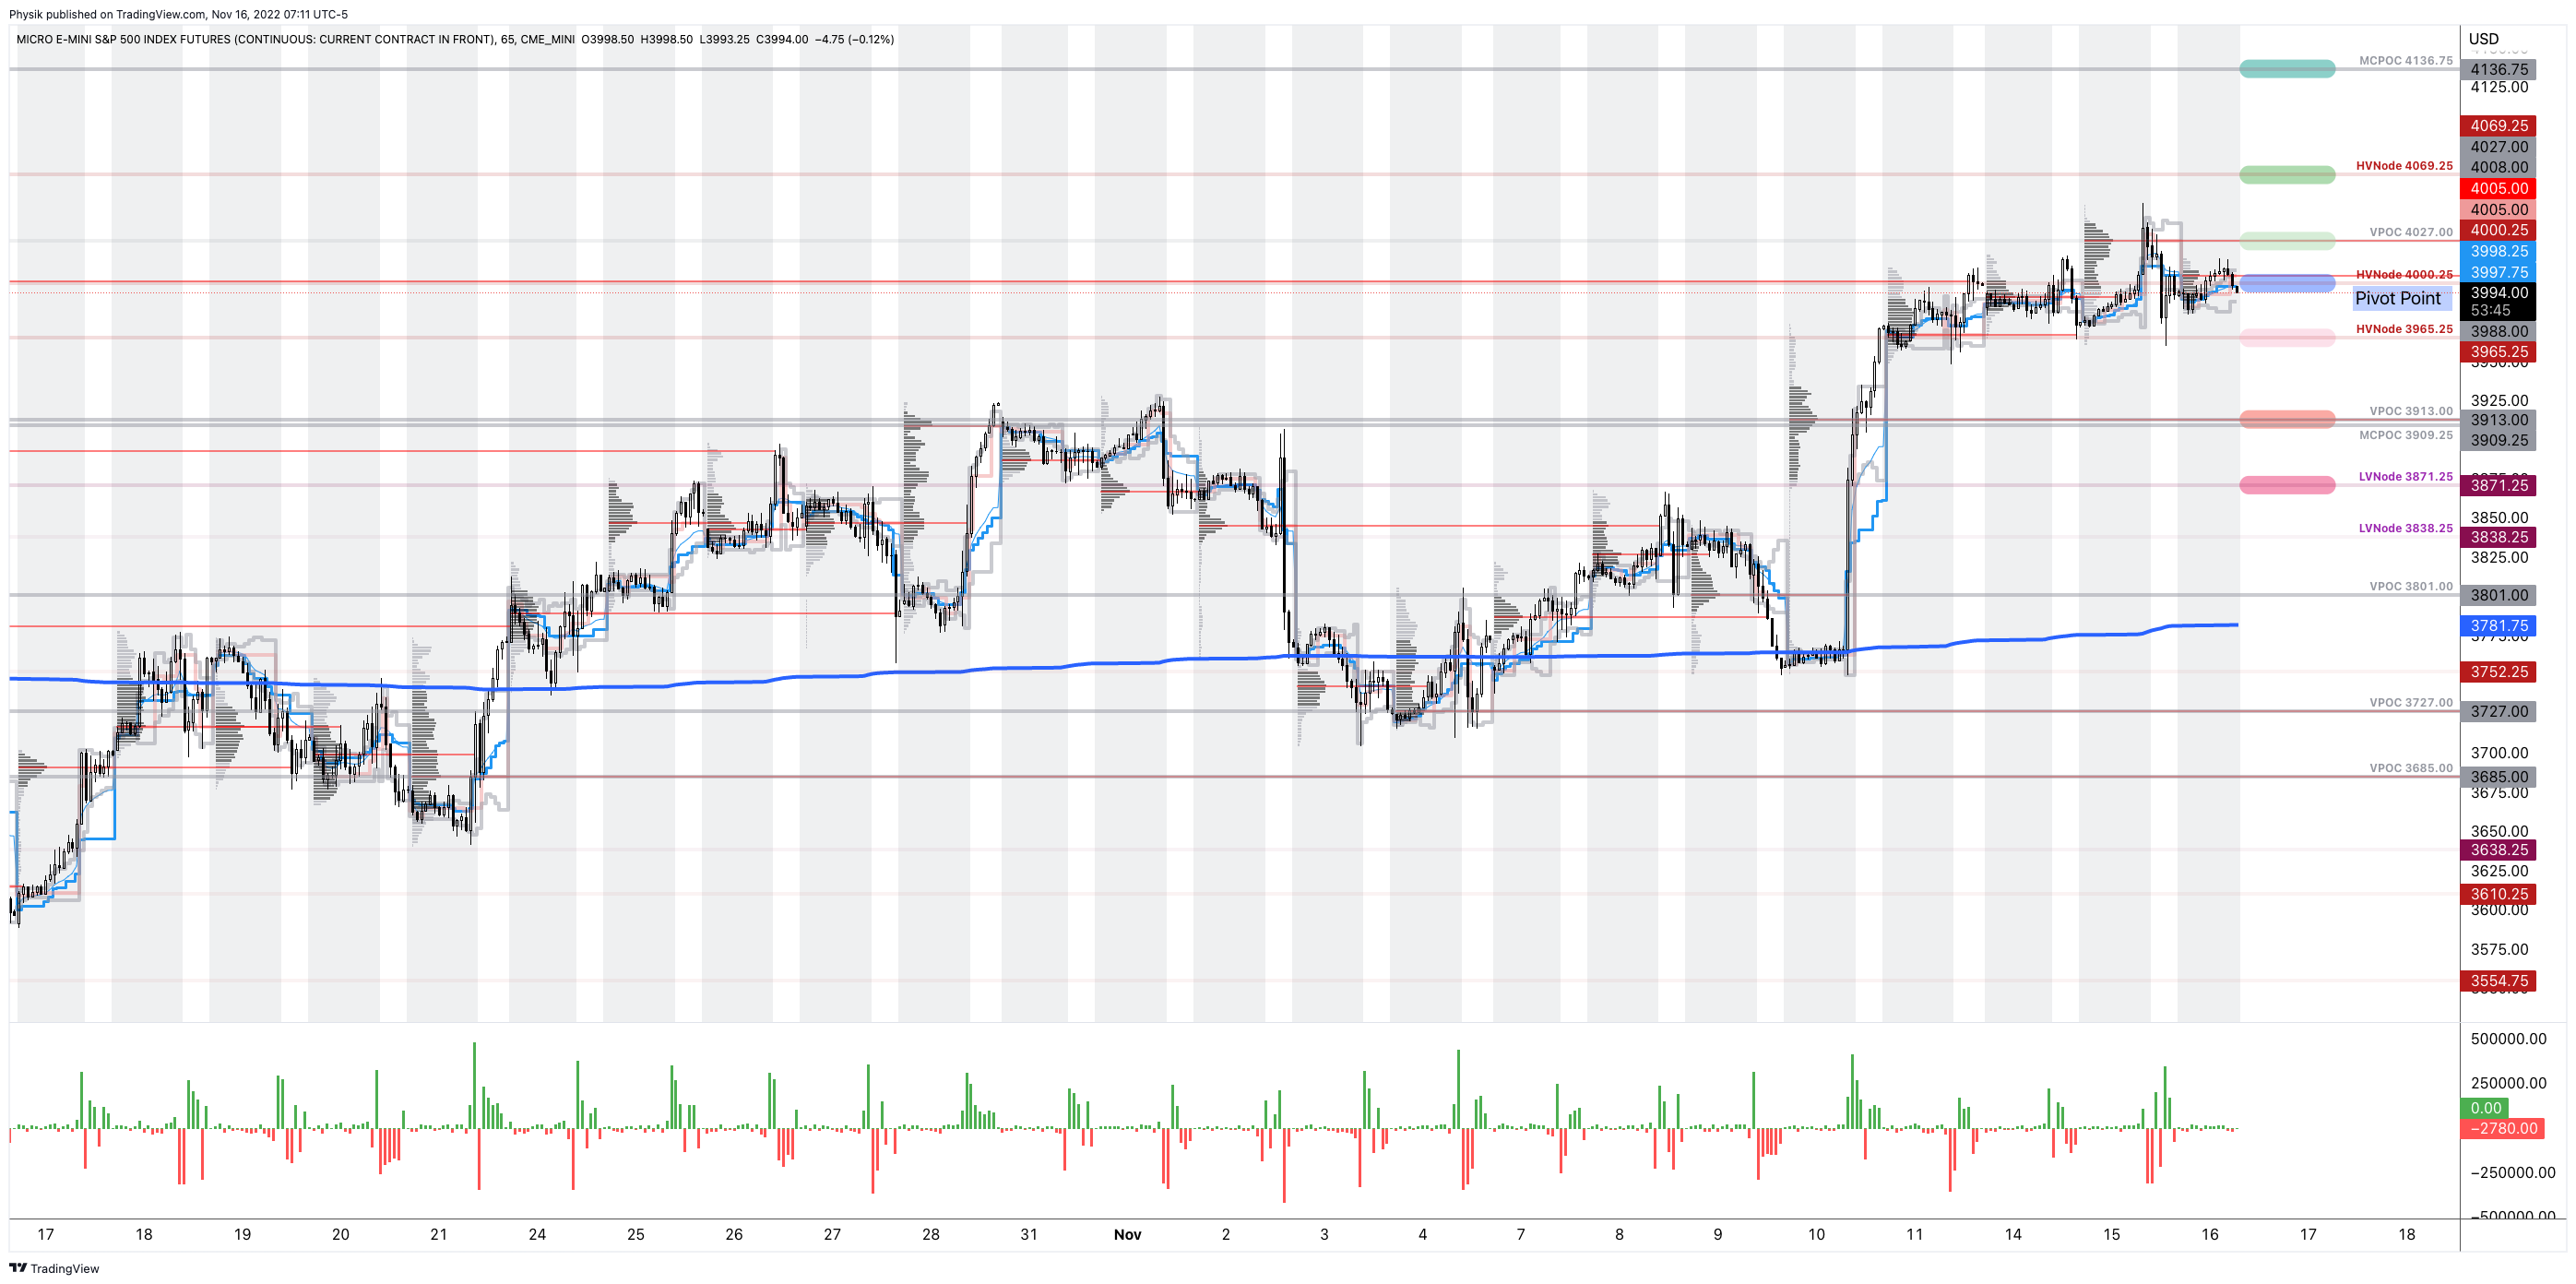
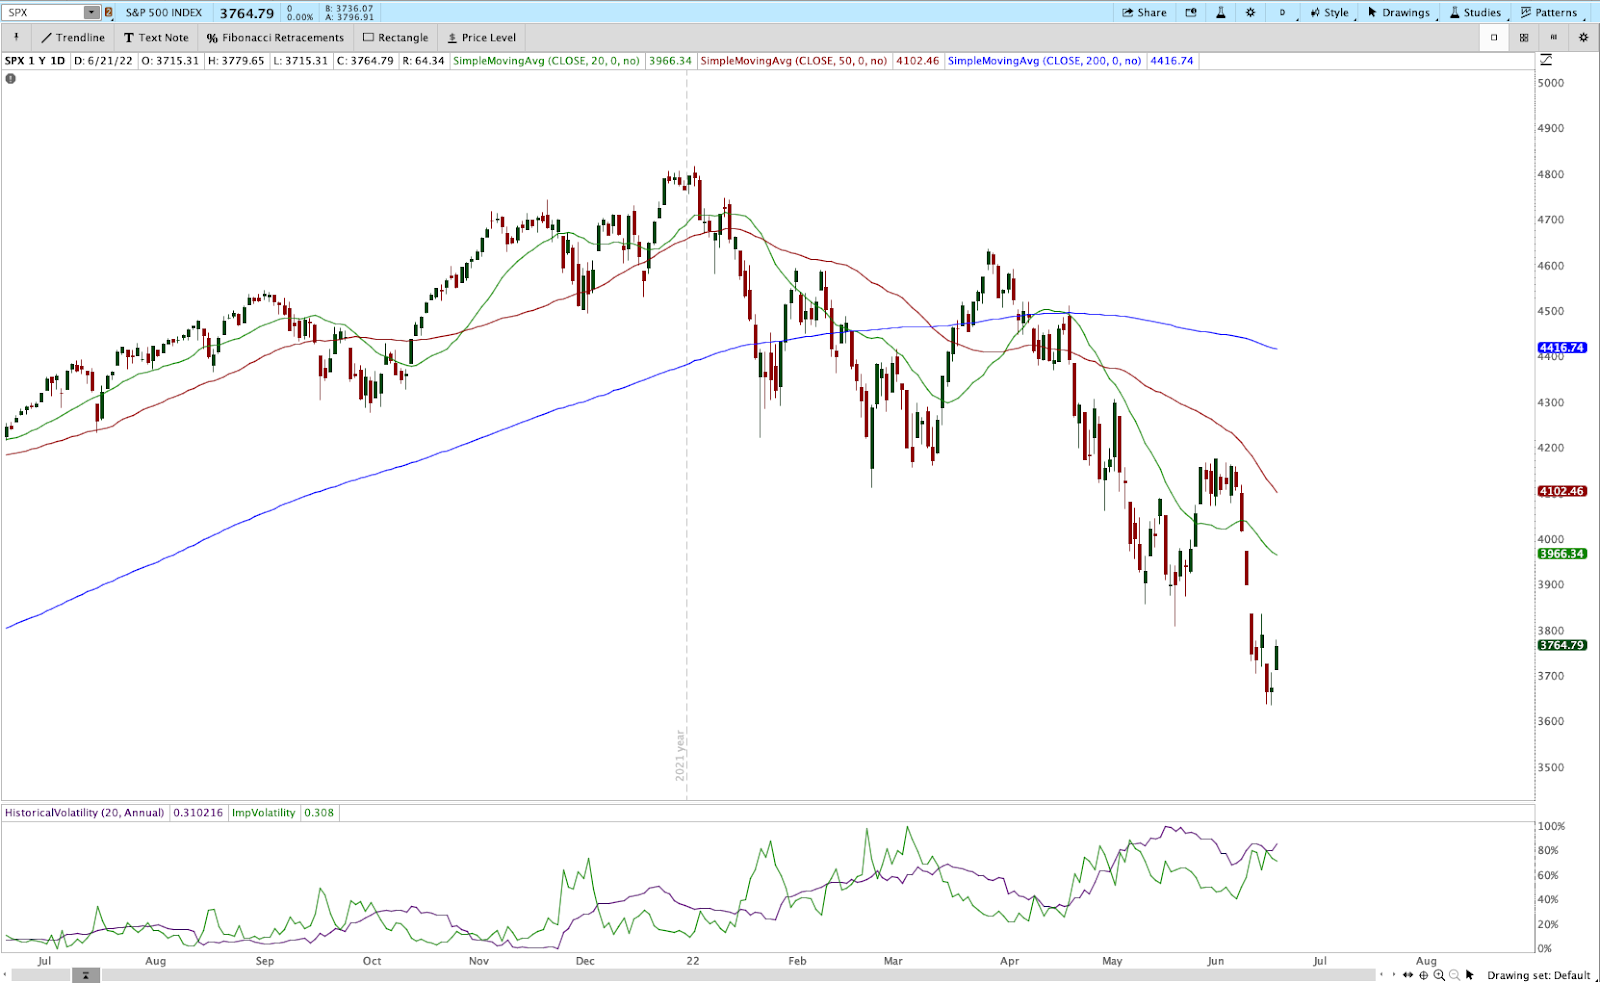
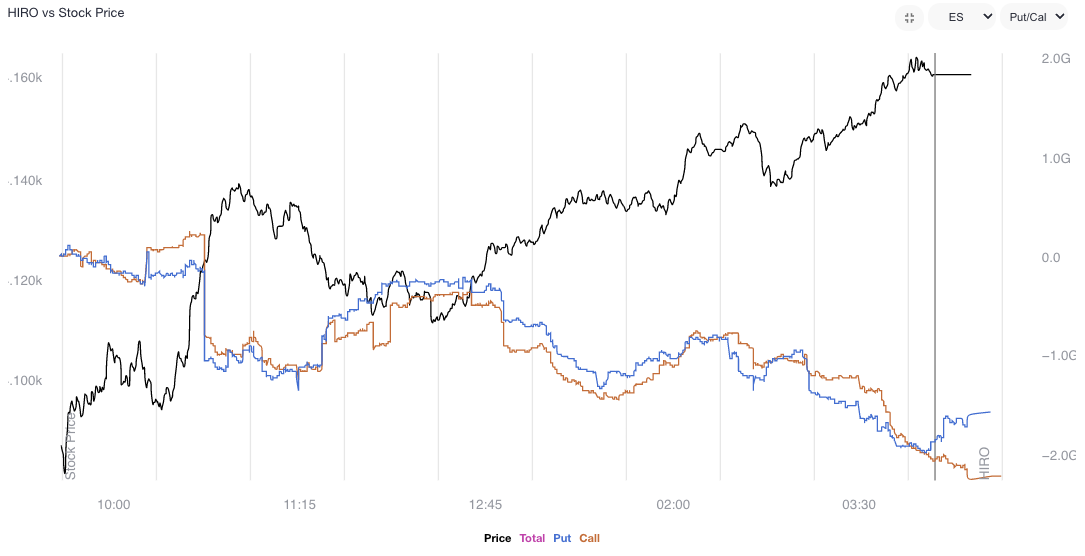
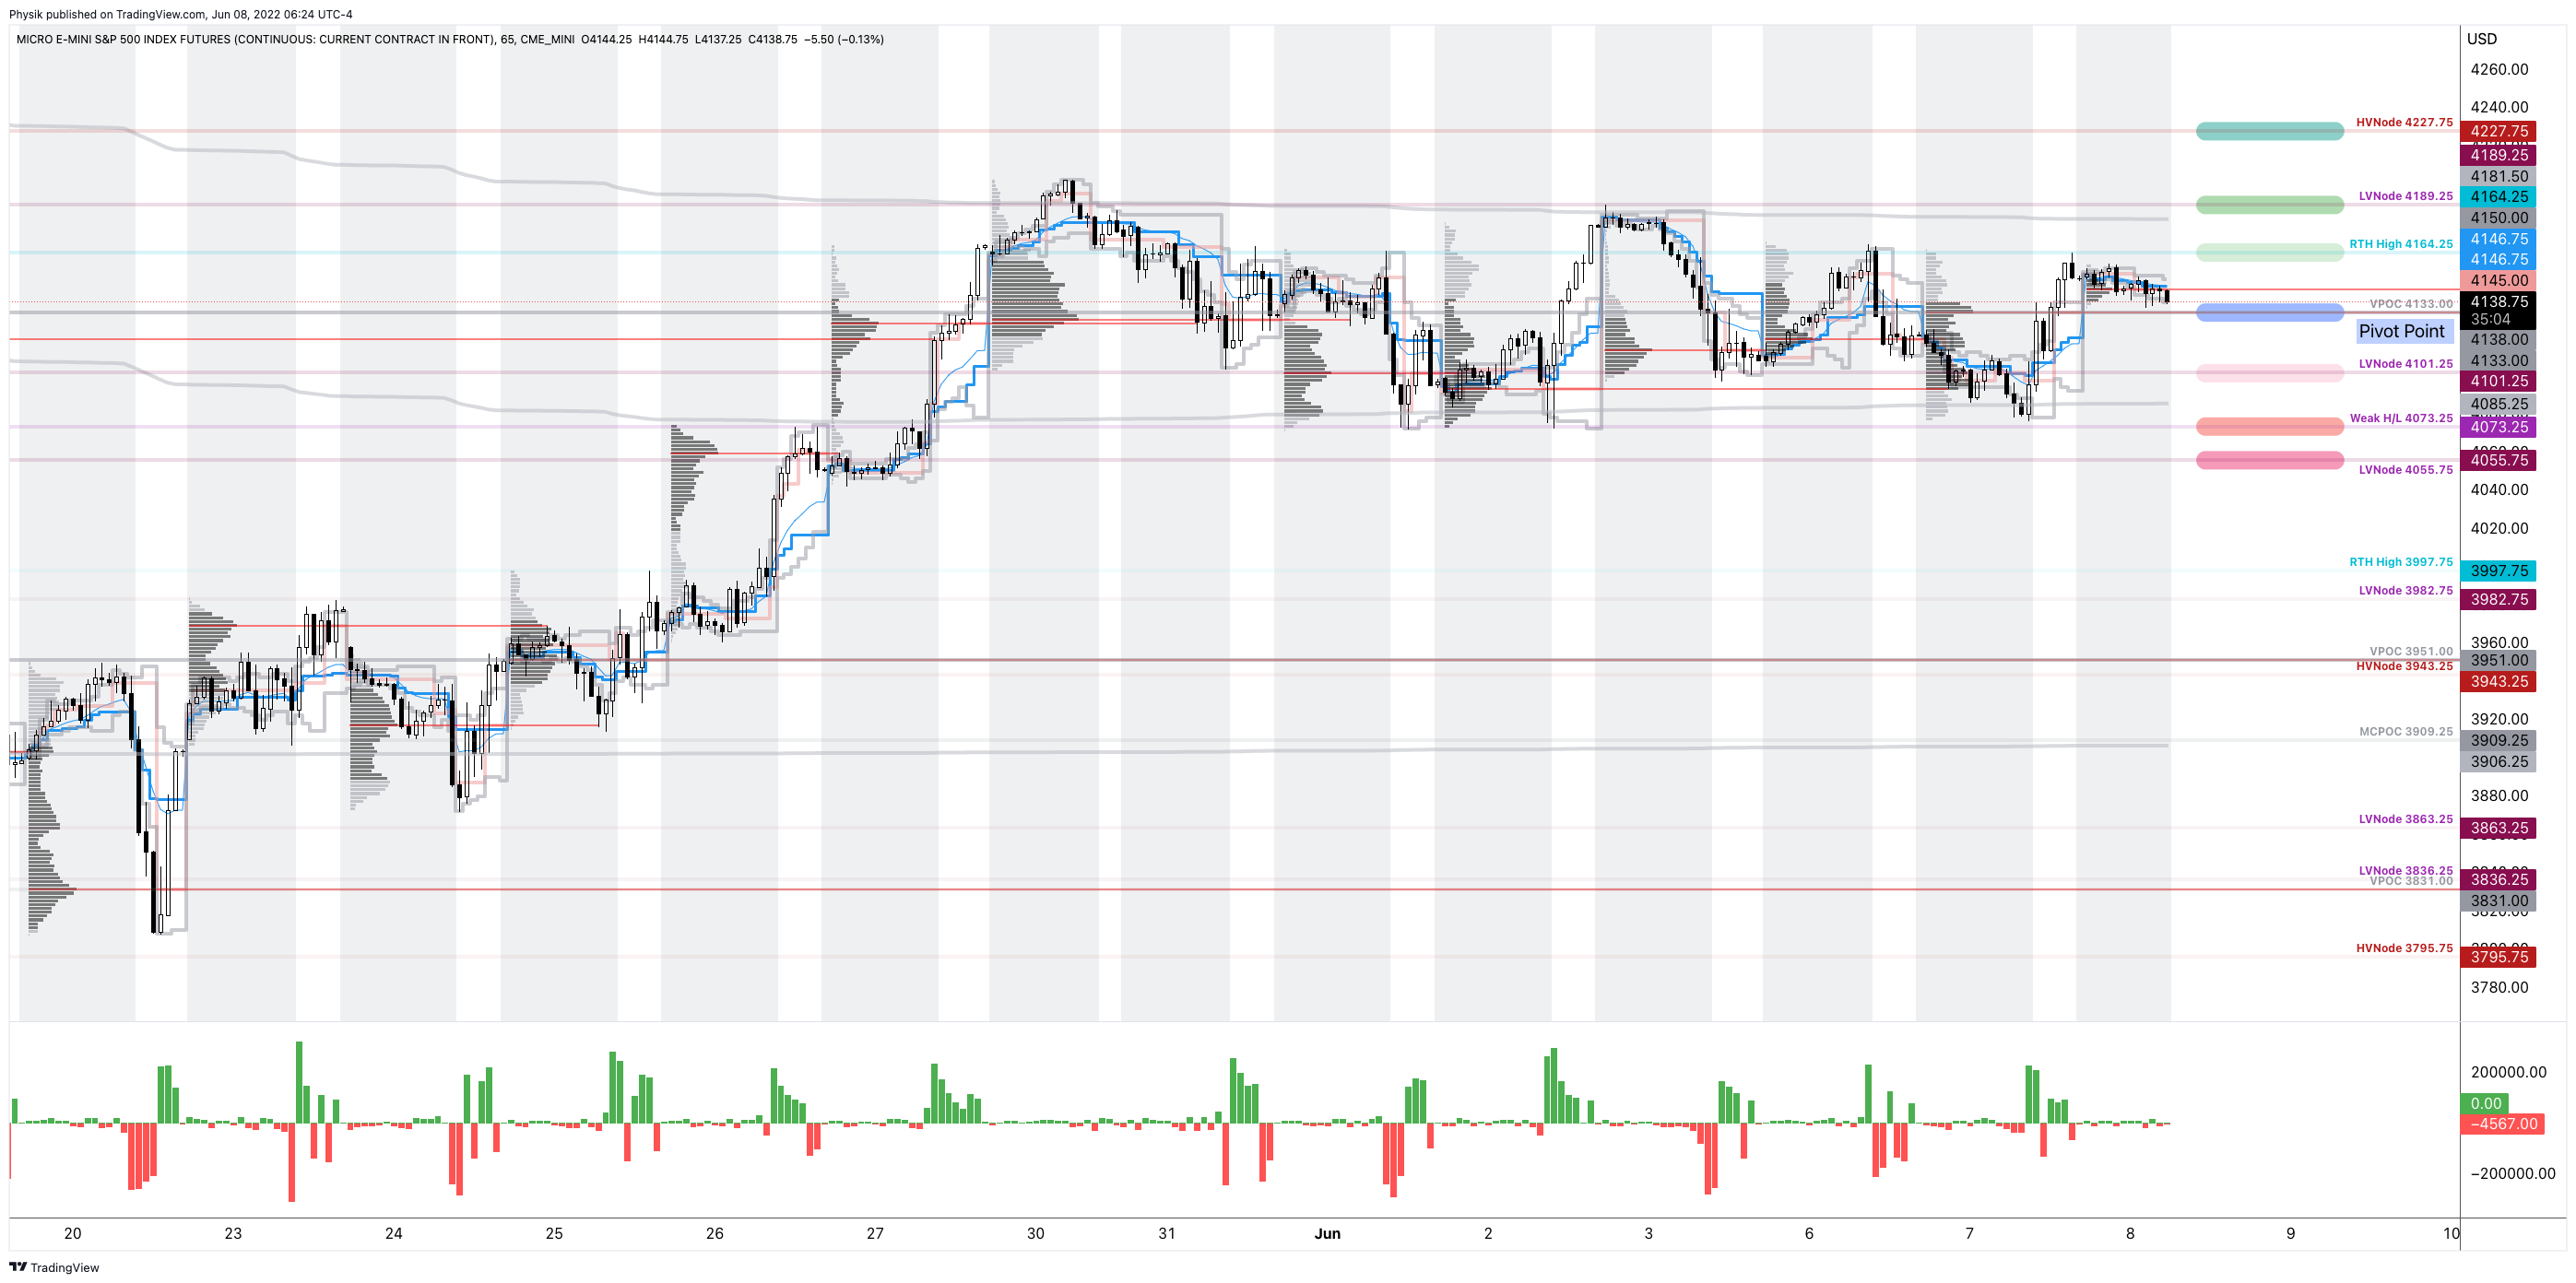
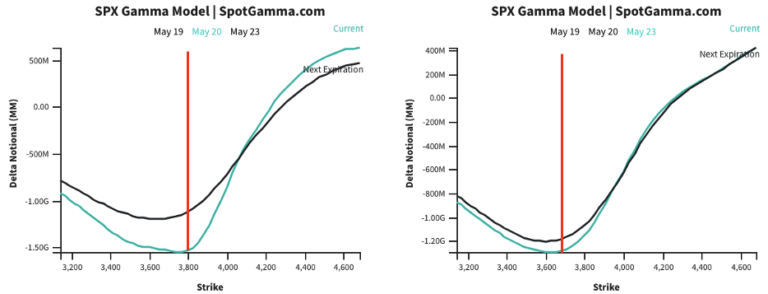
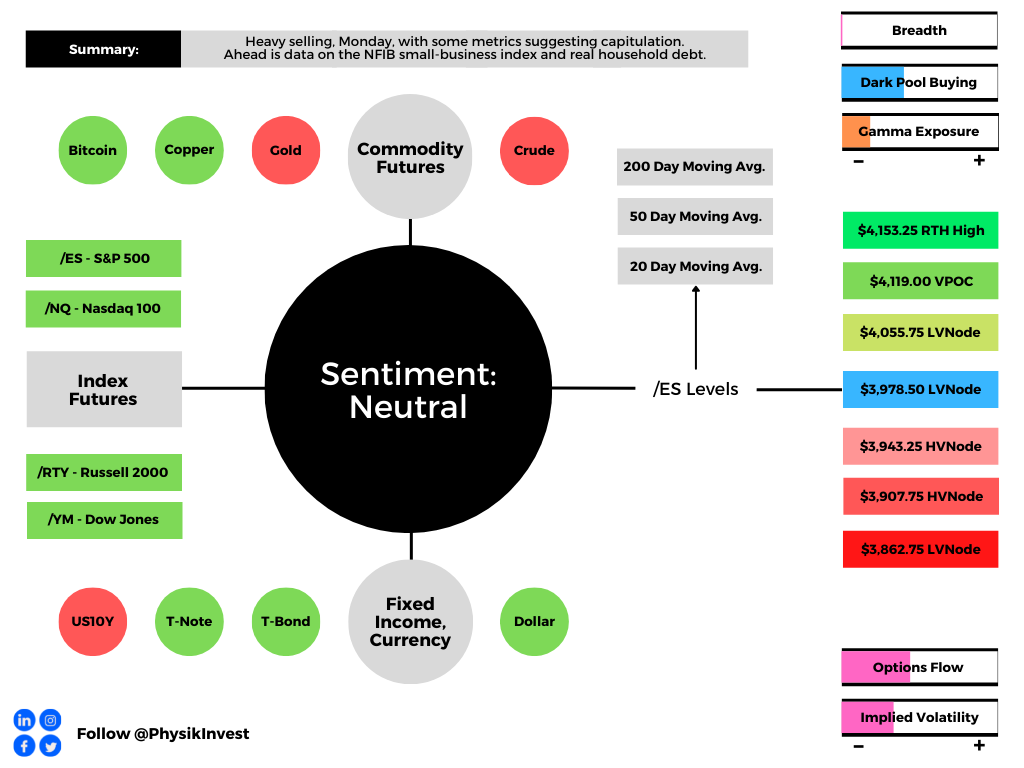
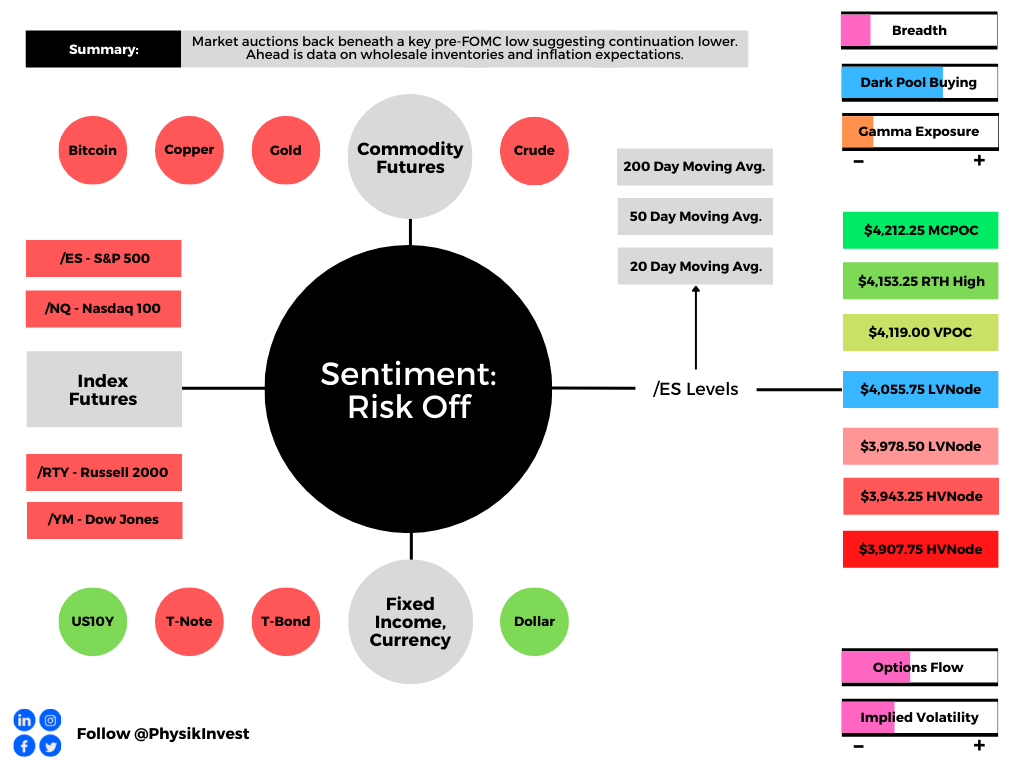
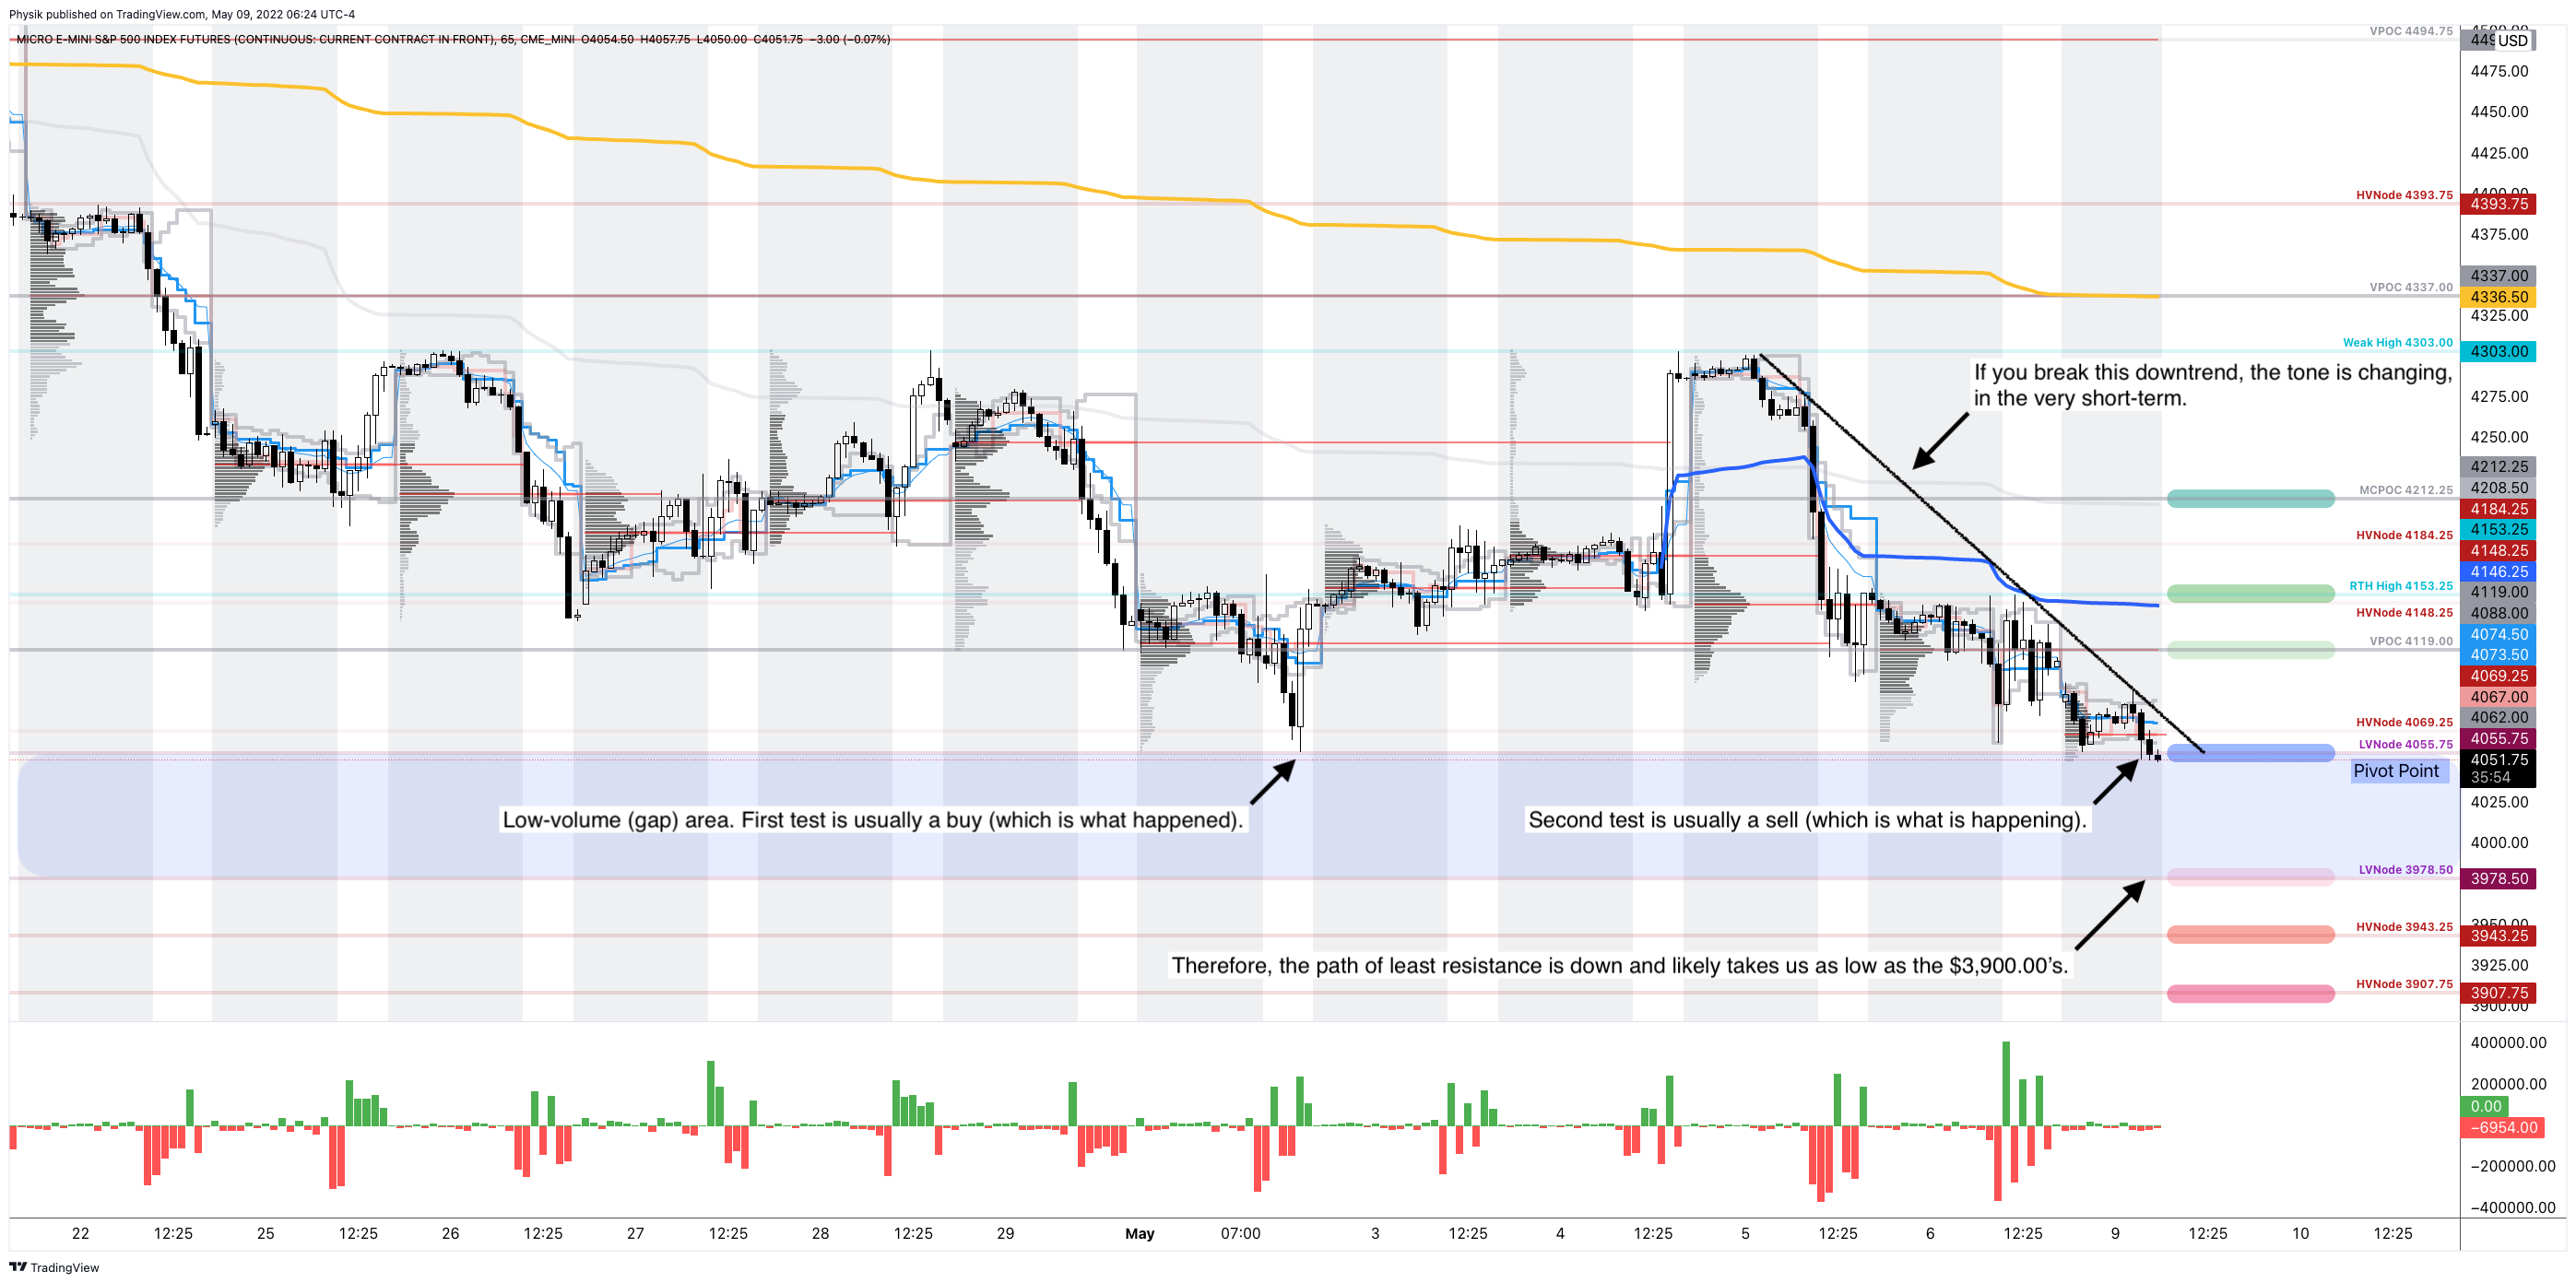
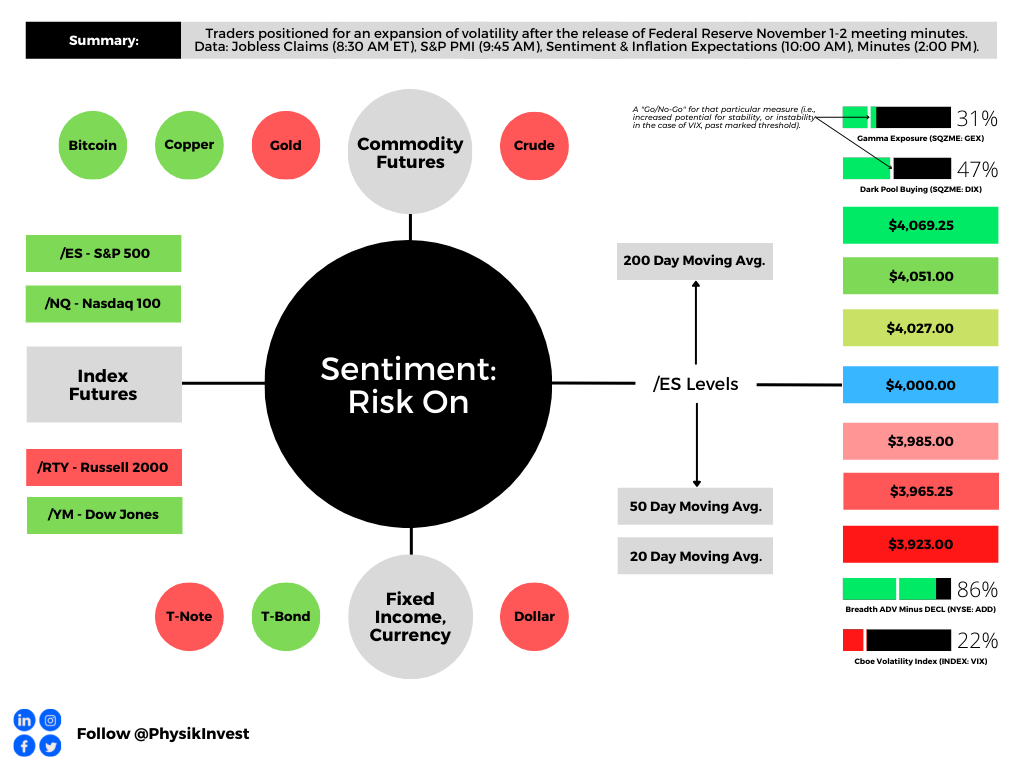
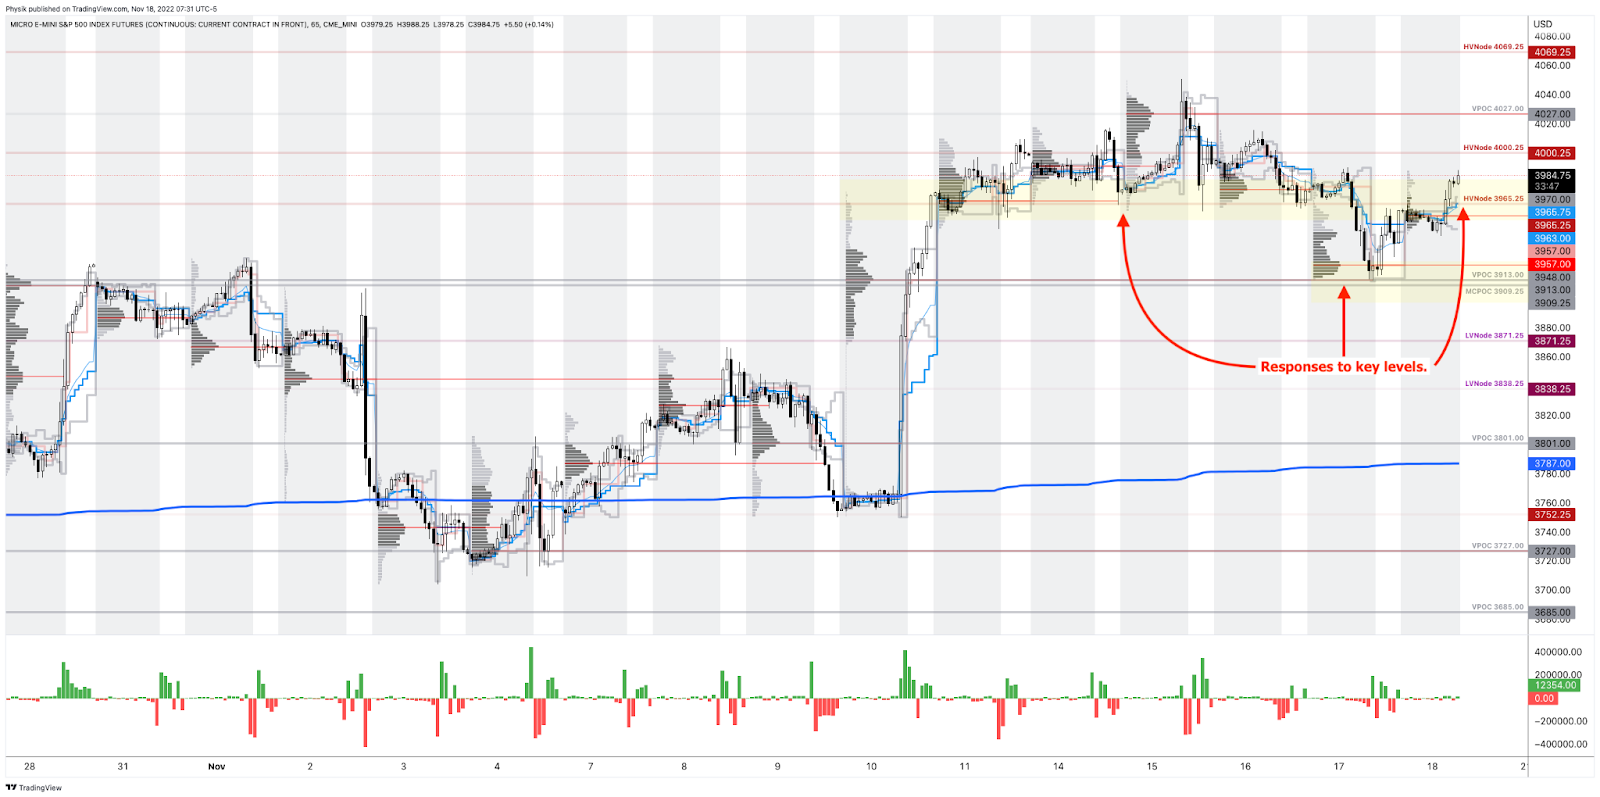
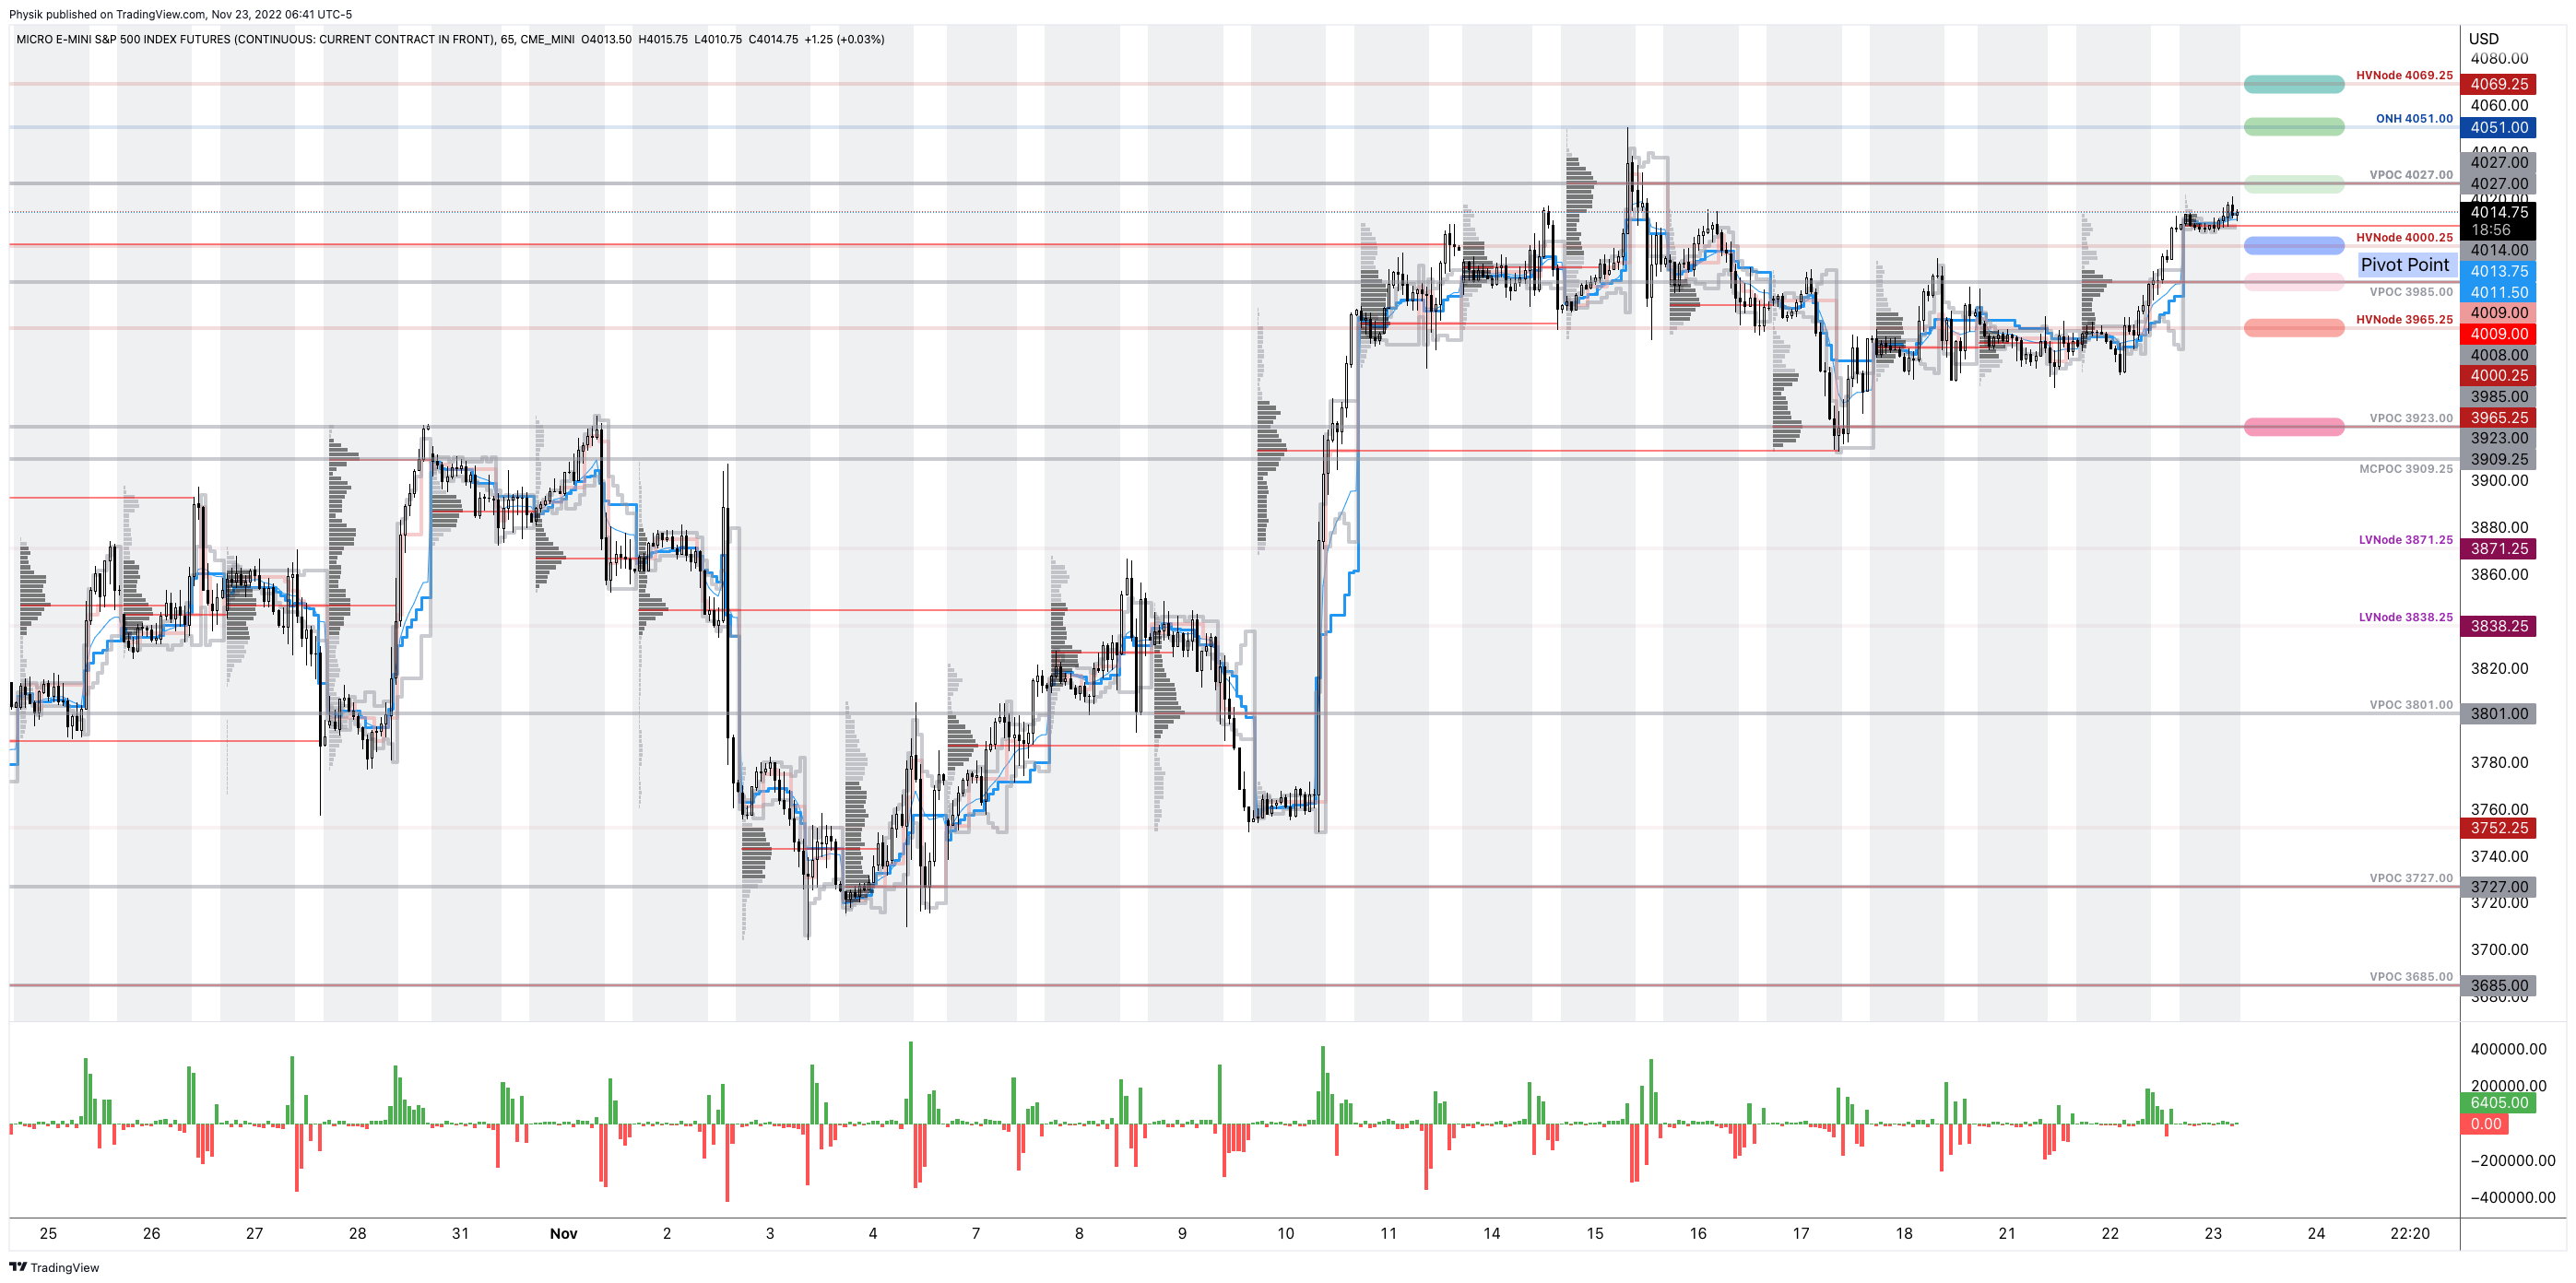
As of 6:45 AM ET, Wednesday’s regular session (9:30 AM – 4:00 PM ET), in the S&P 500, is likely to open in the middle part of a positively skewed overnight inventory, outside of the prior-range and -value, suggesting a potential for immediate directional opportunity.
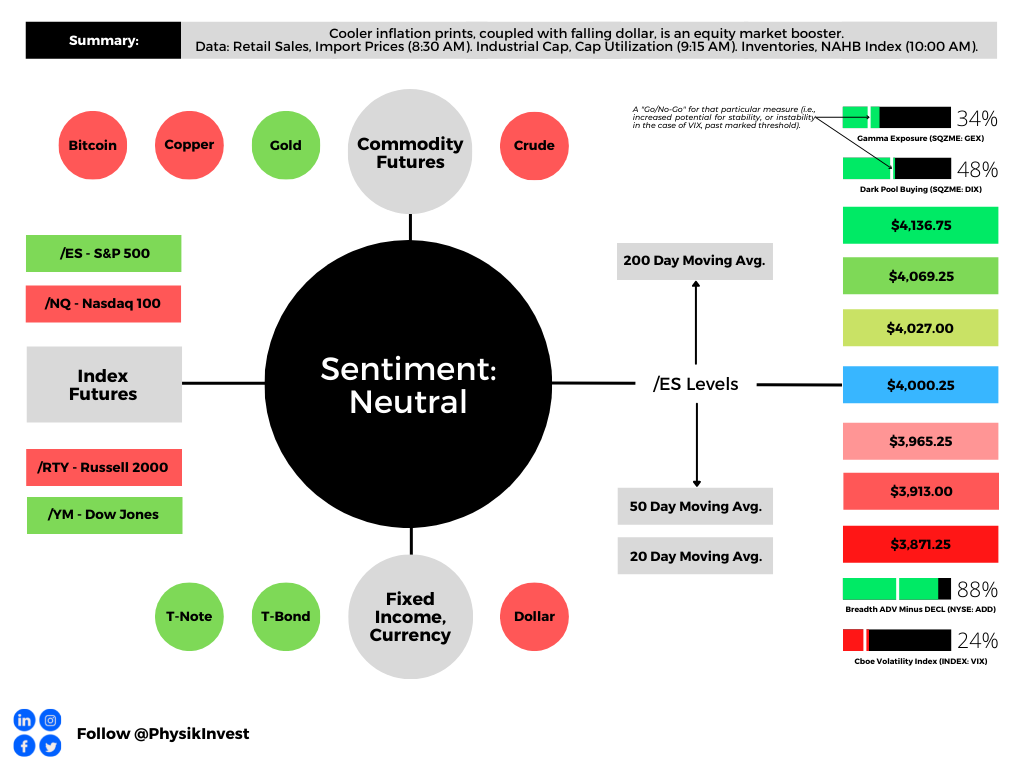
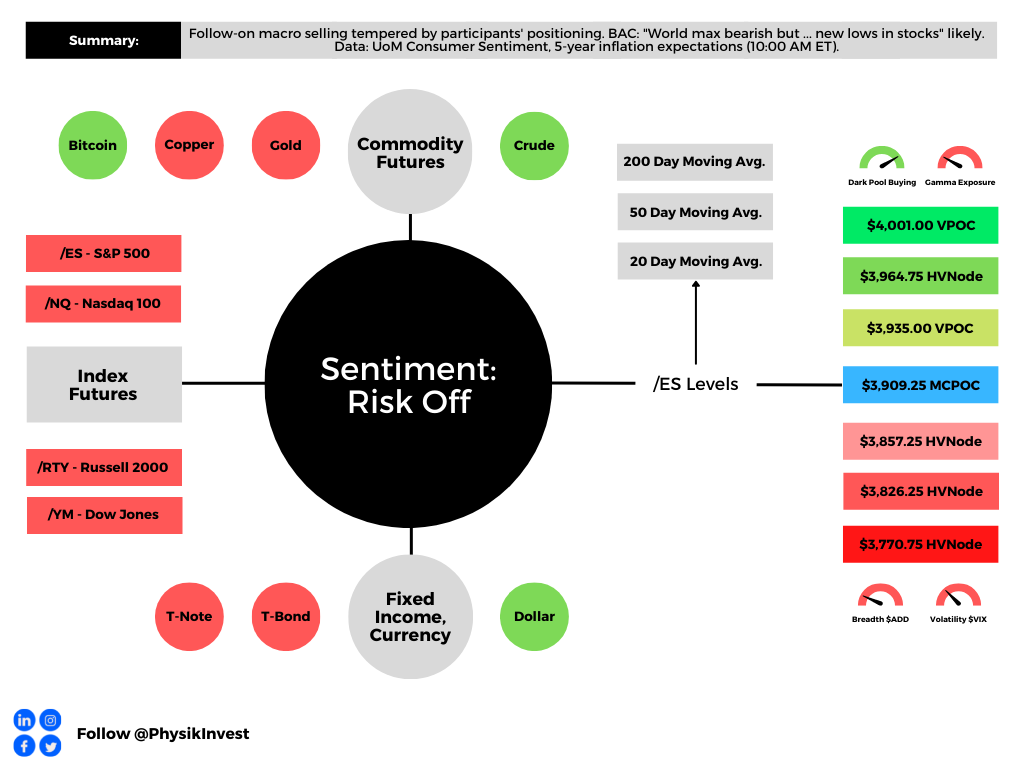
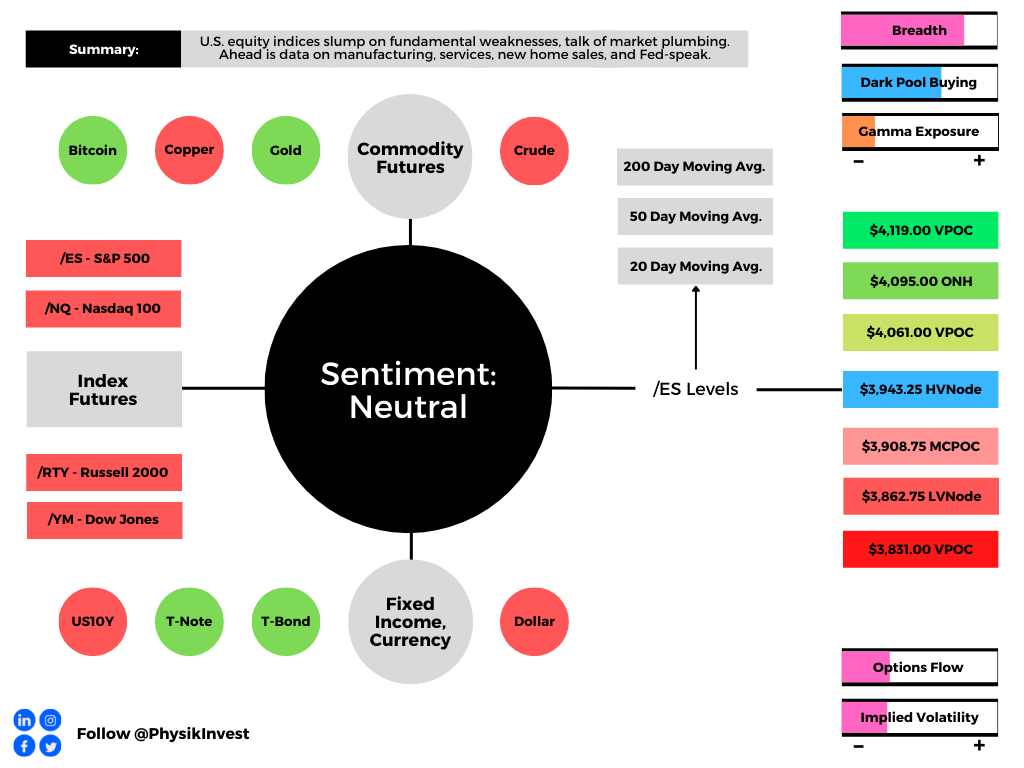
Our S&P 500 pivot for today is $4,000.25.
Key levels to the upside include $4,027.00, $4,051.00, and $4,069.25.
Key levels to the downside include $3,985.00, $3,965.25, and $3,923.00.
Click here to load today’s key levels into the web-based TradingView platform. All levels are derived using the 65-minute timeframe. New links are produced, daily.
Definitions
Volume Areas: A structurally sound market will build on areas of high volume (HVNodes). Should the market trend for long periods of time, it will lack sound structure, identified as low volume areas (LVNodes). LVNodes denote directional conviction and ought to offer support on any test.
If participants were to auction and find acceptance into areas of prior low volume (LVNodes), then future discovery ought to be volatile and quick as participants look to HVNodes for favorable entry or exit.
POCs: POCs are valuable as they denote areas where two-sided trade was most prevalent in a prior day session. Participants will respond to future tests of value as they offer favorable entry and exit.
MCPOCs: POCs are valuable as they denote areas where two-sided trade was most prevalent over numerous day sessions. Participants will respond to future tests of value as they offer favorable entry and exit.
About
After years of self-education, strategy development, mentorship, and trial-and-error, Renato Leonard Capelj began trading full-time and founded Physik Invest to detail his methods, research, and performance in the markets.
Capelj also writes options market analyses at SpotGamma and is a Benzinga journalist.
His past works include private discussions with ARK Invest’s Catherine Wood, investors Kevin O’Leary and John Chambers, the infamous Sam Bankman-Fried of FTX, former Bridgewater Associate Andy Constan, Kai Volatility’s Cem Karsan, The Ambrus Group’s Kris Sidial, the Lithuanian Delegation’s Aušrinė Armonaitė, among many others.
Contact
Direct queries to renato@physikinvest.com or Renato Capelj#8625 on Discord.
Disclaimer
Do not construe this newsletter as advice. All content is for informational purposes.