Categories
Commentary

Daily Brief For July 13, 2022

The daily brief is a free glimpse into the prevailing fundamental and technical drivers of U.S. equity market products. Join the 300+ that read this report daily, below!

Graphic updated 6:20 AM ET. Sentiment Neutral if expected /ES open is inside of the prior day’s range. /ES levels are derived from the profile graphic at the bottom of the following section. Levels may have changed since initially quoted; click here for the latest levels. SqueezeMetrics Dark Pool Index (DIX) and Gamma (GEX) calculations are based on where the prior day’s reading falls with respect to the MAX and MIN of all occurrences available. A higher DIX is bullish. At the same time, the lower the GEX, the more (expected) volatility. Learn the implications of volatility, direction, and moneyness. Breadth reflects a reading of the prior day’s NYSE Advance/Decline indicator. VIX reflects a current reading of the CBOE Volatility Index (INDEX: VIX) from 0-100.

Fundamental

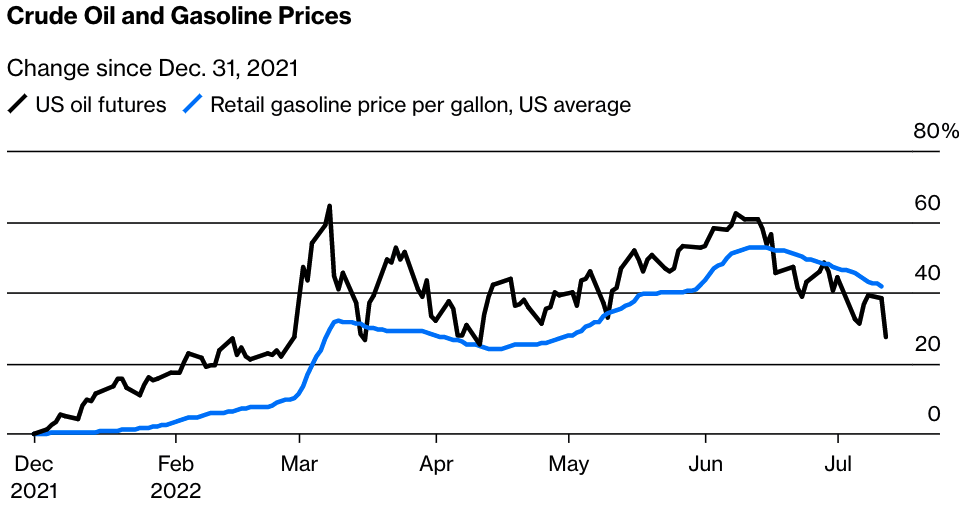
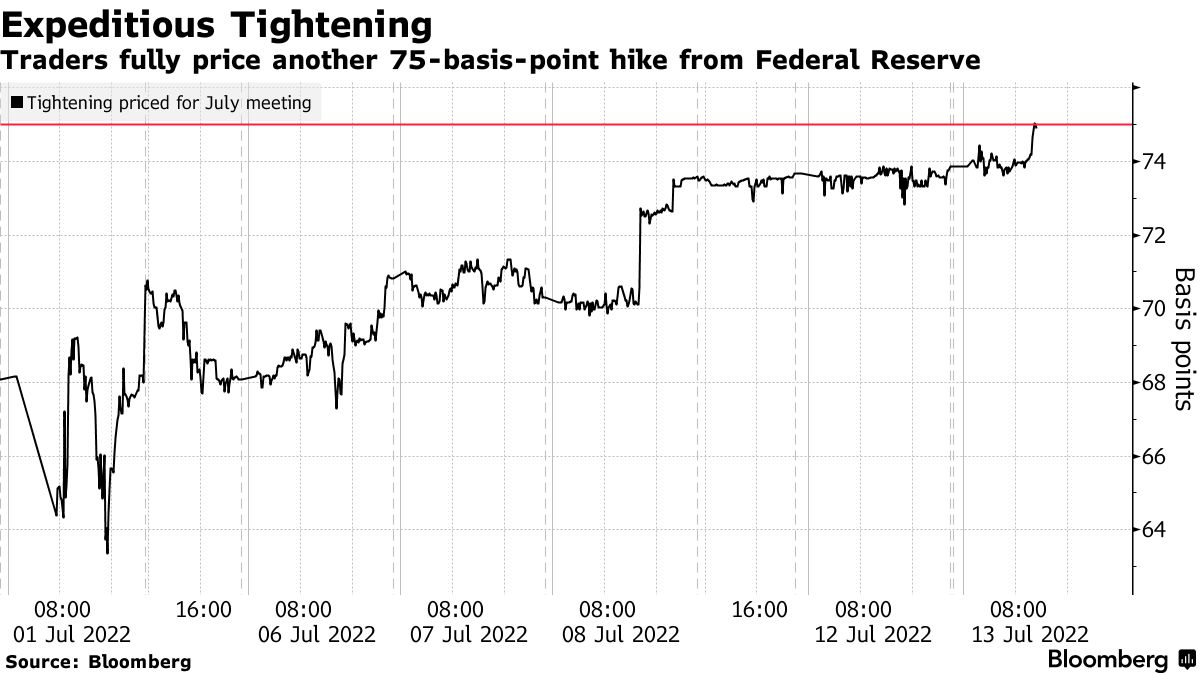
Key for Wednesday, July 13, are inflation figures – the CPI report – as this will drive perceptions regarding future Fed activity.

Expected is an 8.8% rise year-over-year (YoY) and 1.1% month-over-month (MoM). In May, these numbers were 8.6% and 1.0%, respectively. 

Graphic: Via Bloomberg. “The national average price for a gallon of gasoline retreated to $4.66 as of July 11, a decline of 7% from an all-time high of $5.02 a gallon on June 13. But that is not as large as the fall in oil prices, because fuel manufacturing is in such short supply. Refining now accounts for 26% of the cost of a gallon of gasoline, up from 14%.”

Core CPI (which excludes food and energy) is expected to rise by a rate lower than in April, 5.7% YoY and 0.5% MoM, respectively.

Mattering most is core inflation, which the Fed has more control over. If lower than expected, that may warrant some appetite for risk.

“If I’m right about June being the start of a string of lower core CPI prints, which is what the Fed wants to see, then I think comments from officials will quickly switch to a 50 basis-point hike for September and there were more calls for slowing to 25 basis points late in the year,” said Omair Sharif, founder of Inflation Insights LLC. 

On the other hand, if “higher than expected, we’ll feel this is definitely the peak,” said Tom Simons, money market economist at Jefferies Financial Group (NYSE: JEF).

Positioning

Carrying forward our July 12 narratives, here.

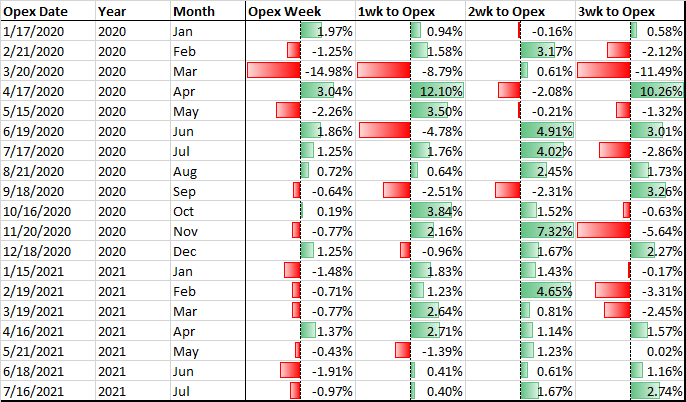
We can speculate as to where the market may move next, after the release of inflation figures, this week. What’s likely is that, even if the print is hot, the first move is to be structural, per Kai Volatility’s Cem Karsan.

“A function of inevitable rebalancing of dealer inventory post-event. The second move and final resolution, if you wait for it, is usually tied to the incremental effects on liquidity (QE/QT).”

Graphic: Retrieved from CrossBorder Capital. The “evidence of the huge Global liquidity squeeze. This is a major policy blunder building.”

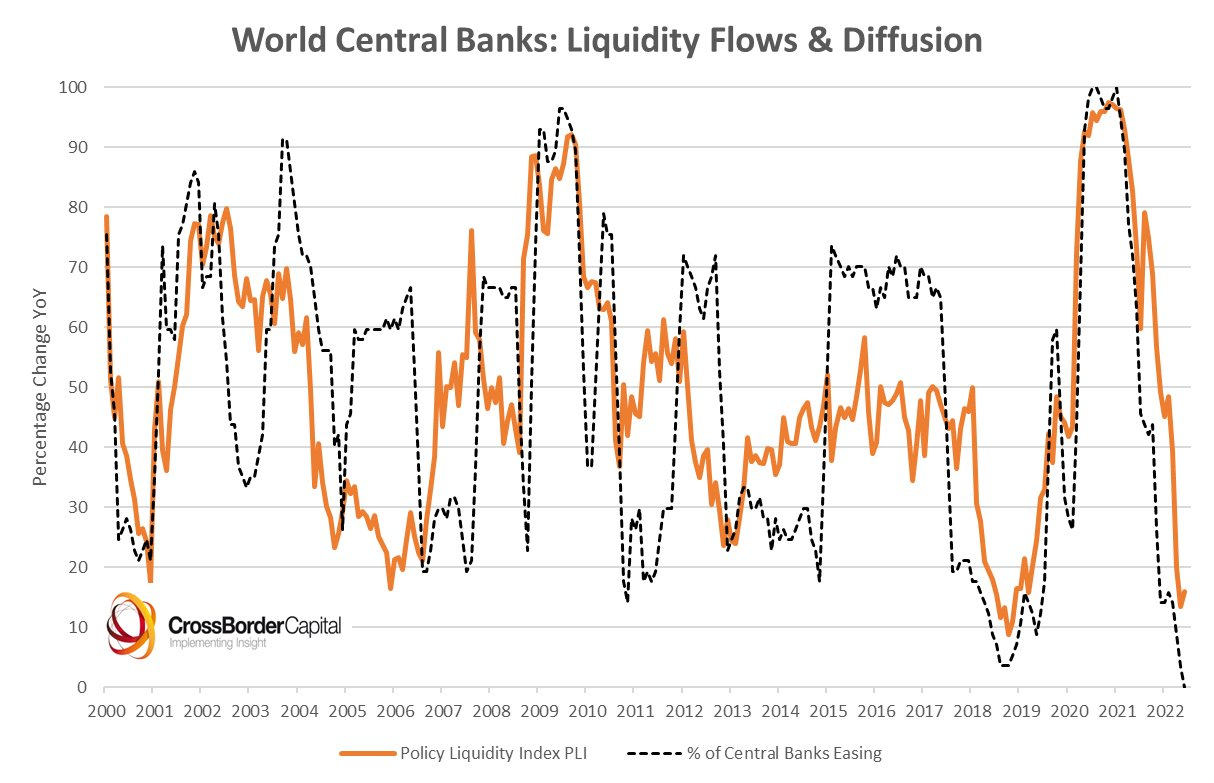
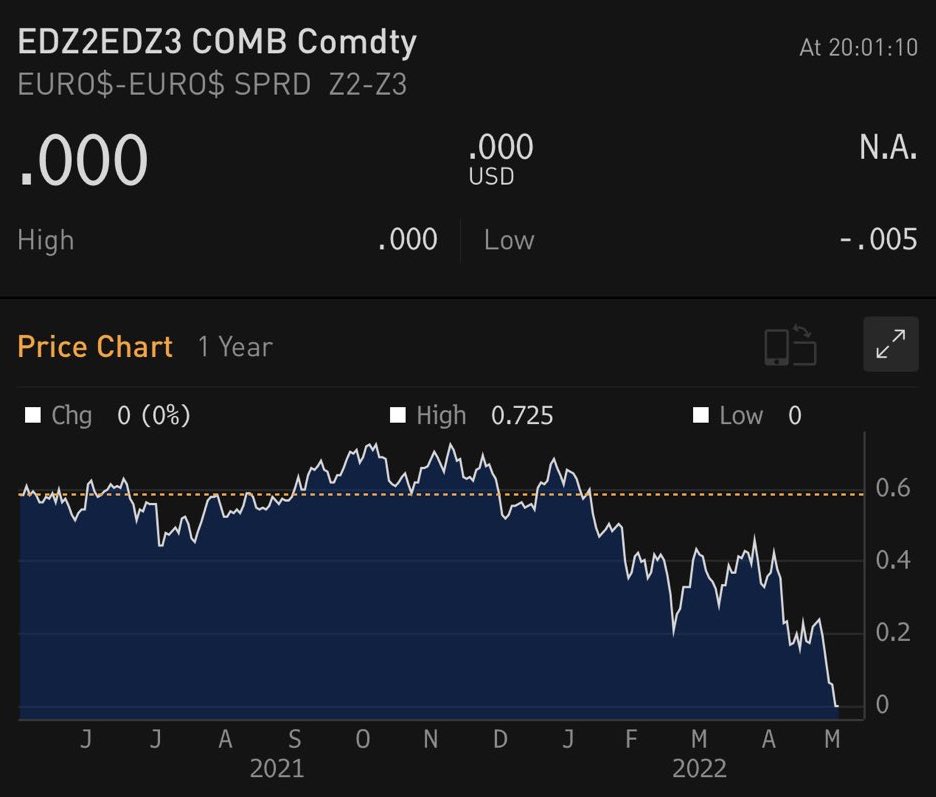
Rising inflation probably bolsters the Fed’s backing of a 75 basis point rate hike on July 27. So, don’t fight the Fed. Rising rates and the withdrawal of liquidity prompts a continued de-rate.

Graphic: Via Bloomberg. “Money markets are betting on a three quarter-percentage-point hike by Federal Reserve officials later this month, wagering the US will need to keep the screws on policy to tame inflation.”

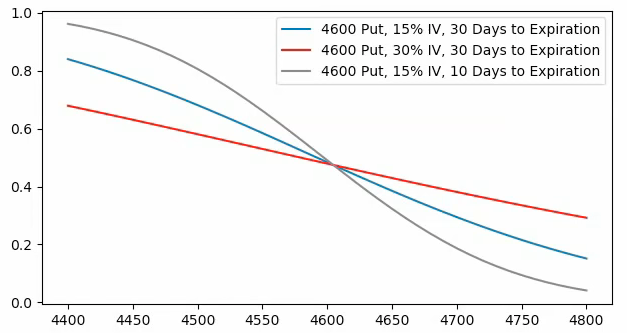
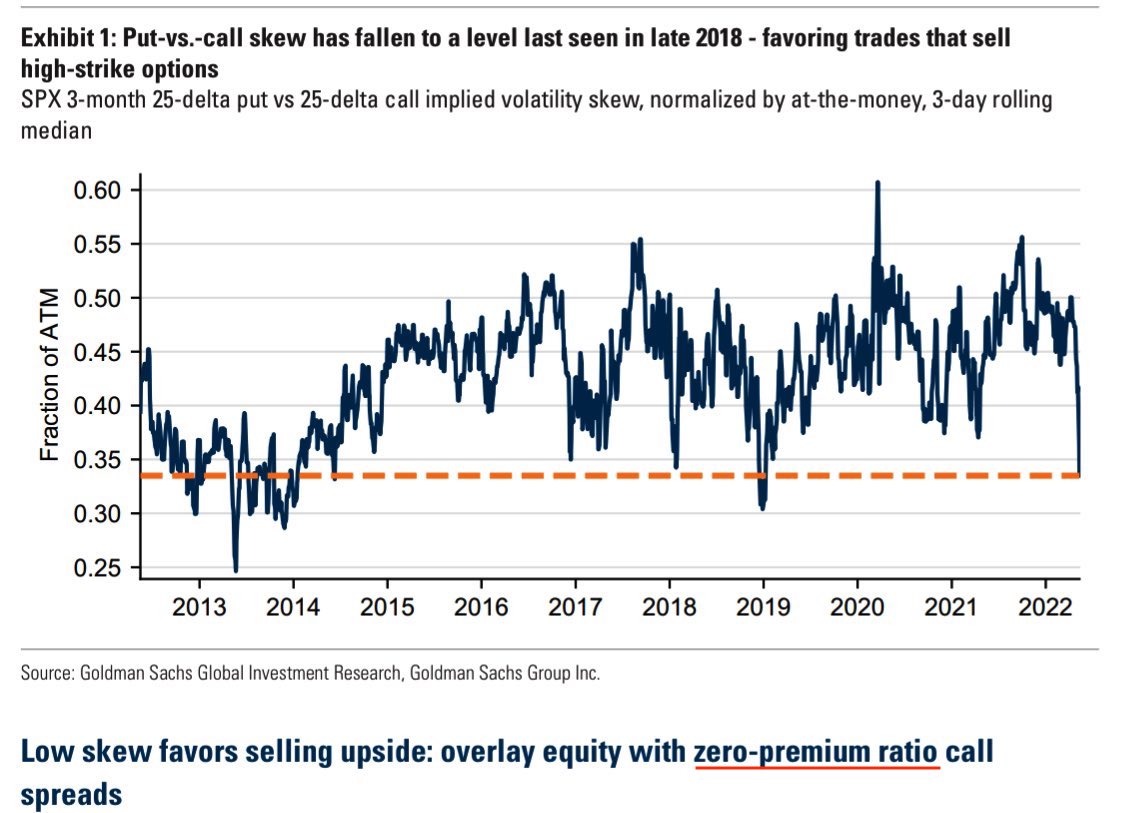
Knowing this, the “flattening in the downside fixed strike skew, while the upside wings [are] more smiley,” as described by JPMorgan Chase & Co (NYSE: JPM), has made for attractive low-cost spread opportunities, as talked about yesterday and in the July 8, 2022 letter.

Graphic: Shared by Benn Eifert of QVR Advisors.

The moral is as follows: own volatility where the market is likely to not expire. Sell it where the market is likely to expire. Just because implied (IVOL) volatility is at a high starting point does not mean it should be sold, blindly.

Read: Explanations and Applications – Moontower on Gamma.

Technical

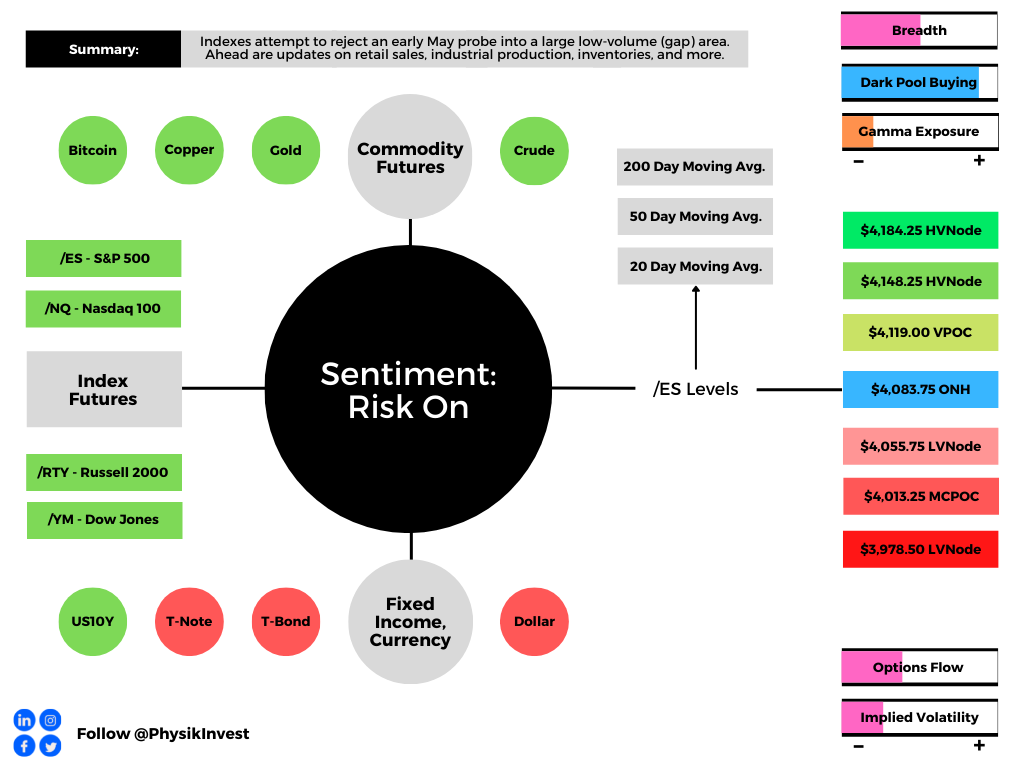
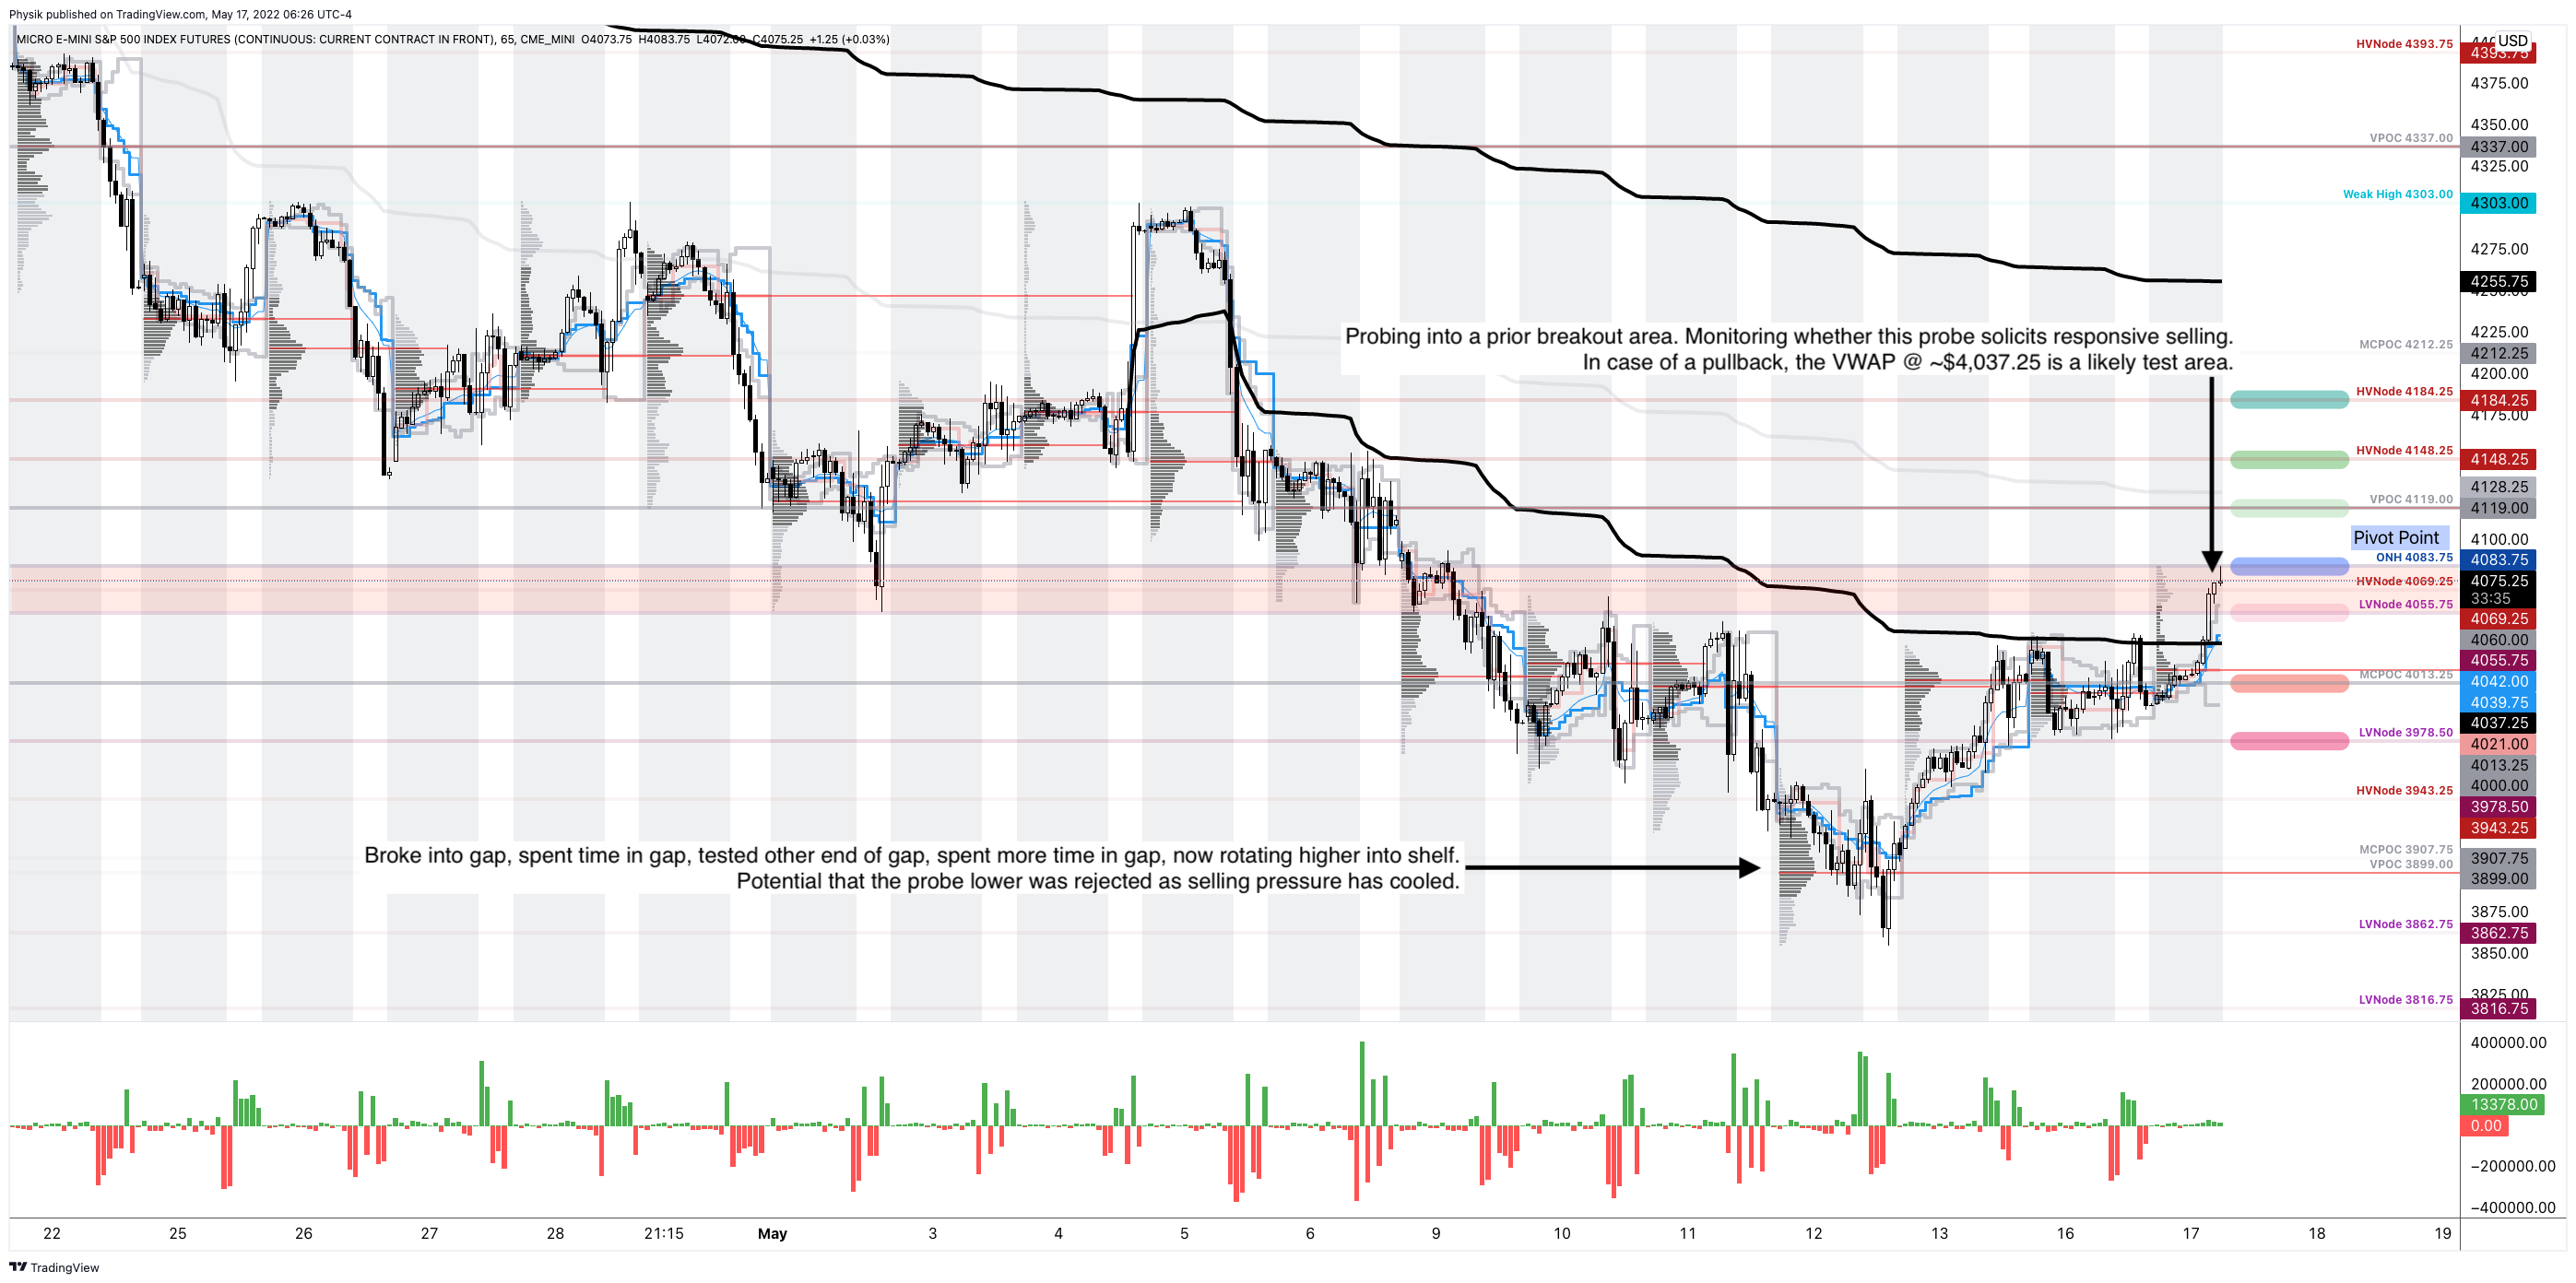
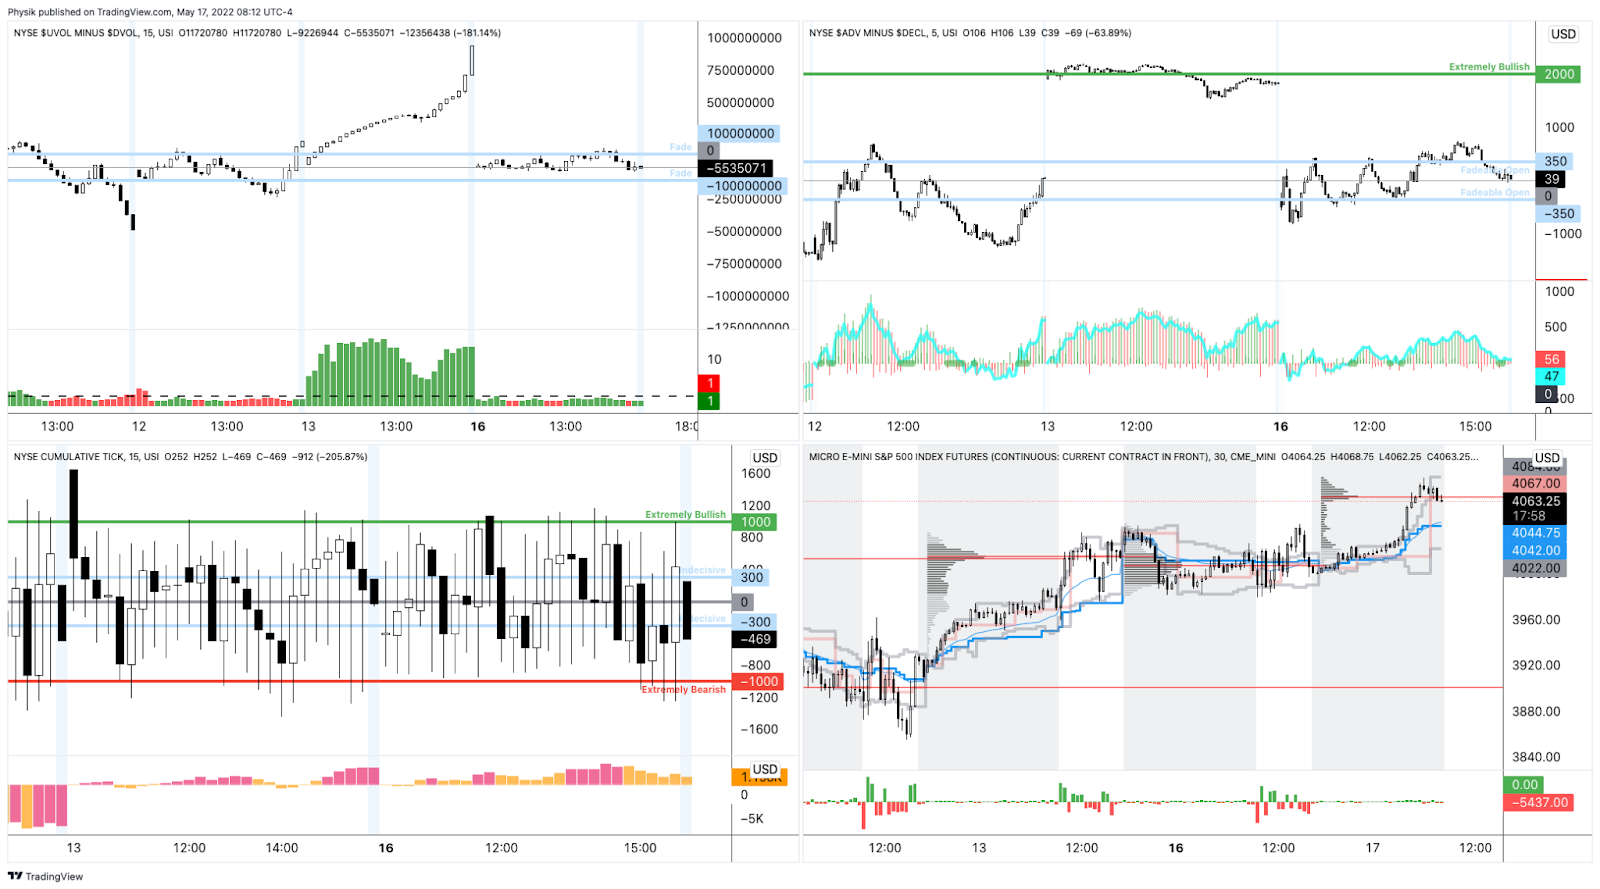
As of 6:20 AM ET, Wednesday’s regular session (9:30 AM – 4:00 PM ET), in the S&P 500, is likely to open in the middle part of a positively skewed overnight inventory, inside of prior-range and -value, suggesting a limited potential for immediate directional opportunity.

In the best case, the S&P 500 trades higher.

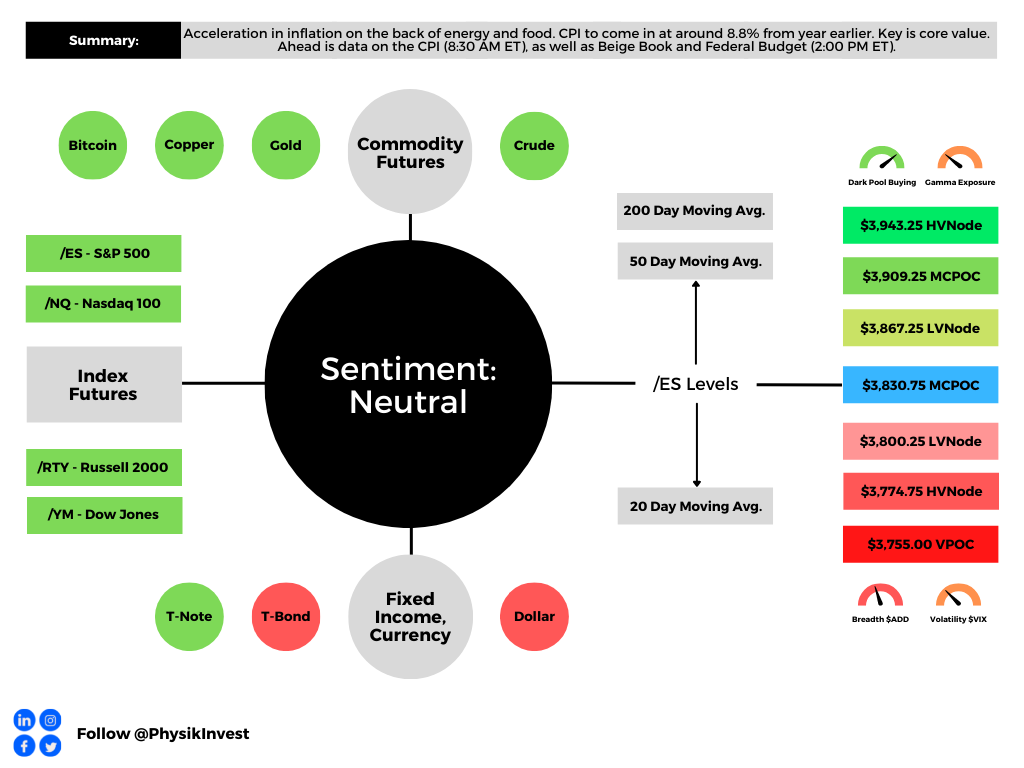
Any activity above the $3,830.75 MCPOC puts into play the $3,867.25 LVNode. Initiative trade beyond the LVNode could reach as high as the $3,909.25 MCPOC and $3,943.25 HVNode, or higher.

In the worst case, the S&P 500 trades lower.

Any activity below the $3,830.75 MCPOC puts into play the $3,800.25 LVNode. Initiative trade beyond the LVNode could reach as low as the $3,774.75 HVNode and $3,755.00 VPOC, or lower.

Click here to load today’s key levels into the web-based TradingView charting platform. Note that all levels are derived using the 65-minute timeframe. New links are produced, daily.
Graphic: Updated 7/12/2022. 65-minute profile chart of the Micro E-mini S&P 500 Futures.

Considerations: Responsiveness near key-technical areas (that are discernable visually on a chart), suggests technically-driven traders with short time horizons are very active. 

Such traders often lack the wherewithal to defend retests and, additionally, the type of trade may be indicative of the other time frame participants waiting for more information to initiate trades.

Definitions

Volume Areas: A structurally sound market will build on areas of high volume (HVNodes). Should the market trend for long periods of time, it will lack sound structure, identified as low volume areas (LVNodes). LVNodes denote directional conviction and ought to offer support on any test. 

If participants were to auction and find acceptance into areas of prior low volume (LVNodes), then future discovery ought to be volatile and quick as participants look to HVNodes for favorable entry or exit.

POCs: POCs are valuable as they denote areas where two-sided trade was most prevalent in a prior day session. Participants will respond to future tests of value as they offer favorable entry and exit.

MCPOCs: POCs are valuable as they denote areas where two-sided trade was most prevalent over numerous day sessions. Participants will respond to future tests of value as they offer favorable entry and exit.

Volume-Weighted Average Prices (VWAPs): A metric highly regarded by chief investment officers, among other participants, for quality of trade. Additionally, liquidity algorithms are benchmarked and programmed to buy and sell around VWAPs.

About

After years of self-education, strategy development, mentorship, and trial-and-error, Renato Leonard Capelj began trading full-time and founded Physik Invest to detail his methods, research, and performance in the markets.

Capelj also develops insights around impactful options market dynamics at SpotGamma and is a Benzinga reporter.

Some of his works include conversations with ARK Invest’s Catherine Wood, investors Kevin O’Leary and John Chambers, FTX’s Sam Bankman-Fried, former Bridgewater Associate Andy Constan, Kai Volatility’s Cem Karsan, The Ambrus Group’s Kris Sidial, among many others.

Disclaimer

In no way should the materials herein be construed as advice. Derivatives carry a substantial risk of loss. All content is for informational purposes only.

Categories
Commentary

Daily Brief For May 17, 2022

The daily brief is a free glimpse into the prevailing fundamental and technical drivers of U.S. equity market products. Join the 300+ that read this report daily, below!

What Happened

Overnight, equity index futures were higher. The S&P 500, in particular, probed the high end of the low-volume (gap) area it broke into on May 9, 2022.

The key is to monitor whether the S&P 500 is able to sustain the prices it discovered overnight. If so, then the odds that participants are, indeed, hammering out a bottom are heightened.

Ahead is data on retail sales (8:30 AM ET), industrial production and capacity utilization (9:15 AM ET), the NAHB home builders’ index, and business inventories (10:00 AM ET).

Fed-speak is scattered. At 9:15 AM ET, the Philadelphia Fed’s Patrick Harker speaks on health care. At 2:00 PM ET, Fed Chair Jerome Powell is interviewed by the WSJ. At 2:30 PM ET, the Cleveland Fed’s Loretta Mester talks at an inflation conference. And, lastly, at 6:45 PM ET, the Chicago Fed’s Charles Evans speaks.

Graphic updated 6:50 AM ET. Sentiment Risk-On if expected /ES open is above the prior day’s range. /ES levels are derived from the profile graphic at the bottom of the following section. Levels may have changed since initially quoted; click here for the latest levels. SqueezeMetrics Dark Pool Index (DIX) and Gamma (GEX) calculations are based on where the prior day’s reading falls with respect to the MAX and MIN of all occurrences available. A higher DIX is bullish. At the same time, the lower the GEX, the more (expected) volatility. Learn the implications of volatility, direction, and moneyness. SHIFT data used for S&P 500 (INDEX: SPX) options activity. Note that options flow is sorted by the call premium spent; if more positive, then more was spent on call options. Breadth reflects a reading of the prior day’s NYSE Advance/Decline indicator. VIX reflects a current reading of the CBOE Volatility Index (INDEX: VIX) from 0-100.

What To Expect

Fundamental: Out of all the news, it was noteworthy when Elon Musk broke with the prevailing opinion to declare the U.S. was facing a tough recession that would last up to 18 months. 

This is on the heels of a large “misallocation of capital,” he says, caused by the government printing “a zillion amount of more money than it had.”

Musk cautioned companies to watch their costs and cash flows, the latter of which we talked on the importance of in cycles where monetary conditions are tighter and there is less money to be had for corporates who are taking “the long view” and “competing on eyeballs and growth,” per Kai Volatility’s Cem Karsan who this letter’s writer spoke with last summer.

As Karsan puts it, over the last four decades, monetary policy was a go-to for supporting the economy. Money was sent to capital and that promoted deflation, ultimately creating “a disinterest and unimportance to cash flows.”

“Monetary policy has a velocity of almost zero, it goes directly to ‘Planet Palo Alto,’ and Palo Alto creates new technologies,” Moontower’s Kris Abdelmesih puts well in a summary of Karsan’s macro thesis.

“They’re sophisticated, futuristic people. They provide new self-driving cars and things getting delivered to your doorstep. They create supply … [and] does not increase demand. And so it is deflationary.”

Over the last years, in light of talk to address increasing inequality, money was sent to labor, so to speak, and that promoted inflation.

Moreover, today’s contractionary monetary policy is a blunt tool and is not equipped to “address the main problem which is a lack of supply to absorb the demand.”

Please read Moontower’s full write-up, here.

That’s sort of in accordance with comments we quoted Credit Suisse Group AG’s (NYSE: CS) Zoltan Pozsar making, yesterday. Essentially, “the Fed is pursuing demand destruction through negative wealth effects,” as the “central banks can only deal with nominal” chokepoints.

By that token, we must “[c]onsider at least the possibility that the extreme volatility and lack of liquidity [we] see in markets is by design, and the Fed will not be deterred by it, but rather that it will be emboldened by it in its singular pursuit of price stability.”

With even President Biden endorsing the closure of the “wealth window,” Karsan believes corporations will have to worry about making money again.

“These cycles are a lot shorter than the monetary supply-side cycles but they tend to be very bad for multiples and great for economic growth.”

With that in mind, there is no escape. Even the traditional bond-stock relationship – the 60/40 framework – is at risk of being upended.

Graphic: Via Andy Constan of Damped Spring Advisors. “Zero rate hikes in 2023. Clearly, a recession is being priced in.” Per Bloomberg, a Bank of America Corporation (NYSE: BAC) survey puts the Fed put (a pivot) at $3,529.00 in the S&P 500.

Positioning: Measures of implied volatility came in. That’s significant since participants have a lot of exposure to put options.

Further, we see liquidity providers being short those puts. As volatility continues to come in, the exposure of those options to direction (delta) compresses. 

As a result, liquidity providers will taper some of their negative delta short stock and futures hedges to that positive delta put position.

Graphic: Via SpotGamma. “SPX prices X-axis. Option delta Y-axis. When the factors of implied volatility and time change, hedging ratios change. For instance, if SPX is at $4,700.00 and IV jumps 15% (all else equal), the dealer may sell an additional 0.2 deltas to hedge their exposure to the addition of a positive 0.2 delta. The graphic is for illustrational purposes, only.”

Those delta hedging flows with respect to changes in volatility (vanna) are on top of what has historically been a front-running of the bullish flow associated with the delta decay of options, particularly with respect to time (charm), into options expirations (OPEX). 

Graphic: @pat_hennessy breaks down returns for the S&P 500, categorized by the week relative to OPEX. 

Notwithstanding, though proxies for buying and this hedging of existing options positioning, at the surface, appear to point to positively (skewed) forward returns, we have concern over the level at which from implied volatility is dropping from, and the general divergence between the volatility realized and implied, talked about yesterday.

Basically, as SpotGamma says, there’s not as much “stored energy to catalyze a rally.” 

SqueezeMetrics adds

The Cboe Volatility Index (INDEX: VIX) compressing, while dealer gamma exposure is “more negative than it’s been in years is not how you get sustained rallies–it’s how you get energy for bigger downside moves.”

Therefore, we continue to focus on participating in upside with as little debit risk as possible, via the use of complex strategies, further validated by quoted research.

Graphic: Via Goldman Sachs Group Inc. The VIX’s “high starting point leaves vol high overall, and we like strategies with a short volatility bias, including put selling and 1×2 call spread overlays.”

Technical: As of 6:30 AM ET, Tuesday’s regular session (9:30 AM – 4:00 PM ET), in the S&P 500, will likely open in the upper part of a positively skewed overnight inventory, outside of prior-range and -value, suggesting a potential for immediate directional opportunity.

In the best case, the S&P 500 trades higher; activity above the $4,083.75 overnight high (ONH) puts in play the $4,119.00 untested point of control (VPOC). Initiative trade beyond the VPOC could reach as high as the $4,148.25 and $4,184.25 high volume nodes (HVNodes), or higher.

In the worst case, the S&P 500 trades lower; activity below the $4,083.75 ONH puts in play the $4,055.75 low volume area (LVNode). Initiative trade beyond the LVNode could reach as low as the $4,013.25 micro composite point of control (MCPOC) and $3,978.50 LVNode, or lower.

Click here to load today’s key levels into the web-based TradingView charting platform. Note that all levels are derived using the 65-minute timeframe. New links are produced, daily.
Graphic: 65-minute profile chart of the Micro E-mini S&P 500 Futures.

Considerations: A push-and-pull between the largest of S&P 500 weights.

For instance, Apple Inc (NASDAQ: AAPL) is clinging to its prior trend.

Graphic: Via Bloomberg.

All the while products like Amazon Inc (NASDAQ: AMZN), are trading into key supports.

Graphic: Via Bloomberg.

We continue to monitor our market internals and (large) changes in positioning (e.g., open interest builds at higher prices further out in time) that will provide further validation to this most recent S&P 500 reversal.

Graphic: Market Internals as pioneered by (a mentor of mine) Peter Reznicek. Current reads of breadth (top charts), in particular, are uninspiring. An advance you do not short has an advance-decline line that’s pegged at +2,000, coupled with a Tick (bottom left) that has trouble closing below 0 for nearly the entirety of a session. Caution.

What People Are Saying

Definitions

Overnight Rally Highs (Lows): Typically, there is a low historical probability associated with overnight rally-highs (lows) ending the upside (downside) discovery process.

Volume Areas: A structurally sound market will build on areas of high volume (HVNodes). Should the market trend for long periods of time, it will lack sound structure, identified as low volume areas (LVNodes). LVNodes denote directional conviction and ought to offer support on any test. 

If participants were to auction and find acceptance into areas of prior low volume (LVNodes), then future discovery ought to be volatile and quick as participants look to HVNodes for favorable entry or exit.

POCs: POCs are valuable as they denote areas where two-sided trade was most prevalent in a prior day session. Participants will respond to future tests of value as they offer favorable entry and exit.

MCPOCs: POCs are valuable as they denote areas where two-sided trade was most prevalent over numerous day sessions. Participants will respond to future tests of value as they offer favorable entry and exit.

About

After years of self-education, strategy development, mentorship, and trial-and-error, Renato Leonard Capelj began trading full-time and founded Physik Invest to detail his methods, research, and performance in the markets.

Capelj also develops insights around impactful options market dynamics at SpotGamma and is a Benzinga reporter.

Some of his works include conversations with ARK Invest’s Catherine Wood, investors Kevin O’Leary and John Chambers, FTX’s Sam Bankman-Fried, Kai Volatility’s Cem Karsan, The Ambrus Group’s Kris Sidial, among many others.

Disclaimer

In no way should the materials herein be construed as advice. Derivatives carry a substantial risk of loss. All content is for informational purposes only.