Categories
Commentary

Daily Brief For September 21, 2022

The daily brief is a free glimpse into the prevailing fundamental and technical drivers of U.S. equity market products. Join the 900+ that read this report daily, below!

Graphic updated 7:00 AM ET. Sentiment Neutral if expected /ES open is inside of the prior day’s range. /ES levels are derived from the profile graphic at the bottom of the following section. Levels may have changed since initially quoted; click here for the latest levels. SqueezeMetrics Dark Pool Index (DIX) and Gamma (GEX) calculations are based on where the prior day’s reading falls with respect to the MAX and MIN of all occurrences available. A higher DIX is bullish. At the same time, the lower the GEX, the more (expected) volatility. Learn the implications of volatility, direction, and moneyness. Breadth reflects a reading of the prior day’s NYSE Advance/Decline indicator. VIX reflects a current reading of the CBOE Volatility Index (INDEX: VIX) from 0-100.

Administrative

Short and to the point, today, after yesterday’s detailed letter on inflation, monetary policy action, and beyond. Good luck, everyone!

Fundamental

Ongoing is a “messy divorce” between large powers. We have talked about this in the past.

In the news was Putin’s mobilization of troops and renewed warning of a nuclear threat. This is a day after Biden said the US would defend Taiwan against China. In response, Mao Ning, the Chinese foreign ministry spokesperson, said this:

“The US remarks seriously violate the one-China principle … and send a severely wrong signal to the separatist forces of Taiwan independence. China strongly deplores and rejects it and has made solemn complaints with the US side.”

“We will do our utmost to strive for the prospect of peaceful reunification with the utmost sincerity, while we will not tolerate any activities aimed at splitting China and reserve the option to take all necessary measures.”

The aforementioned do more to shift “the pillars of the low inflation world” – de-globalization and populism – which the Federal Reserve (Fed) has a limited toolkit to solve for.

Pending is a large “L”-shaped recession to slow inflation, generate negative wealth effects, lower demand, and position for a recovery that will likely be “fiscally funded industrial policy.”

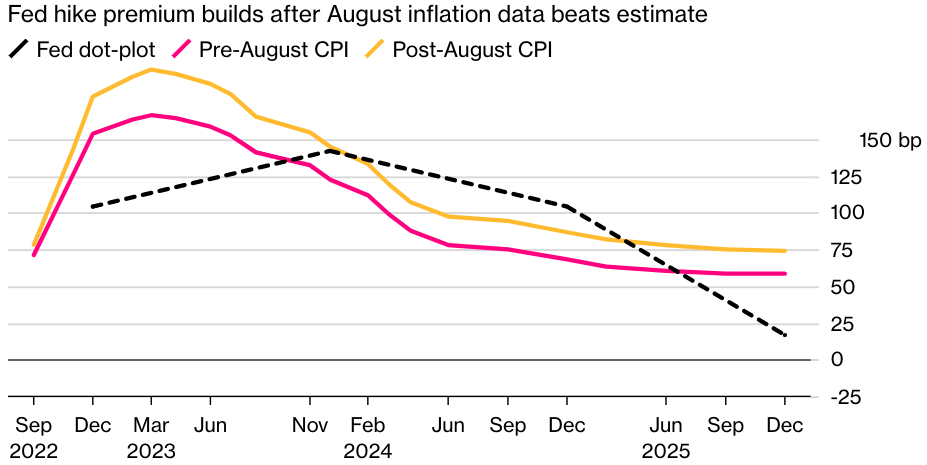
Shifting to today, the Federal Reserve is to step up its efforts to tame inflation by raising interest rates to the highest level since 2008. The consensus calls for up to a 75 basis point rate hike. 

Bloomberg economist Anna Wong, Andrew Husby, and Eliza Winger put forth:

“Powell will emphasize the committee’s determination to hold rates higher for longer. He will be more forthcoming in acknowledging the likely pain involved in bringing down inflation. He may opt not to say that the committee plans to downshift the pace of rate hikes.”

Positioning

Yesterday, we briefly talked about post-event moves which are often positive and driven by the structural “rebalancing of dealer inventory,” per Kai Volatility’s Cem Karsan.

“In the past four Fed Days, the benchmark index has climbed an average of roughly 1.4% on all days, with more than 2% gains on three of the four,” said Bloomberg’s John Authers. Adding, “the S&P 500 has averaged a gain of more than 1% on Fed Days over the last 10 meetings.”

Graphic: Retrieved from Bloomberg. Via the Bespoke Investment Group.

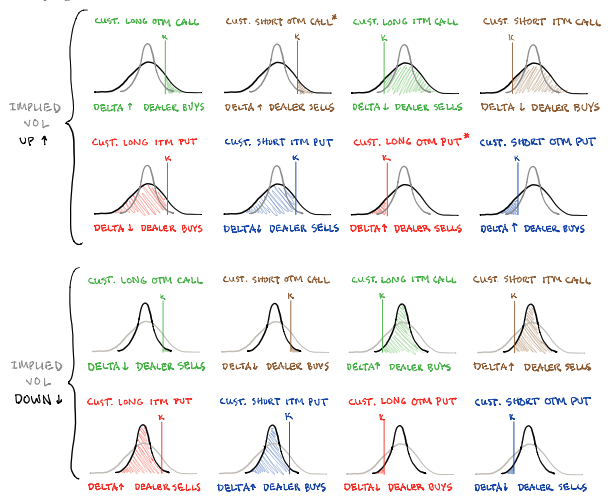
Basically, into the event, traders have demanded protection and bid implied volatility (IVOL).

Graphic: Retrieved from SpotGamma. 

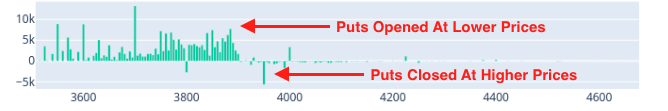
Should fears be assuaged, the supply of that protection should decrease IVOL, this is what may provide markets a boost.

Graphic: Retrieved from SqueezeMetrics.

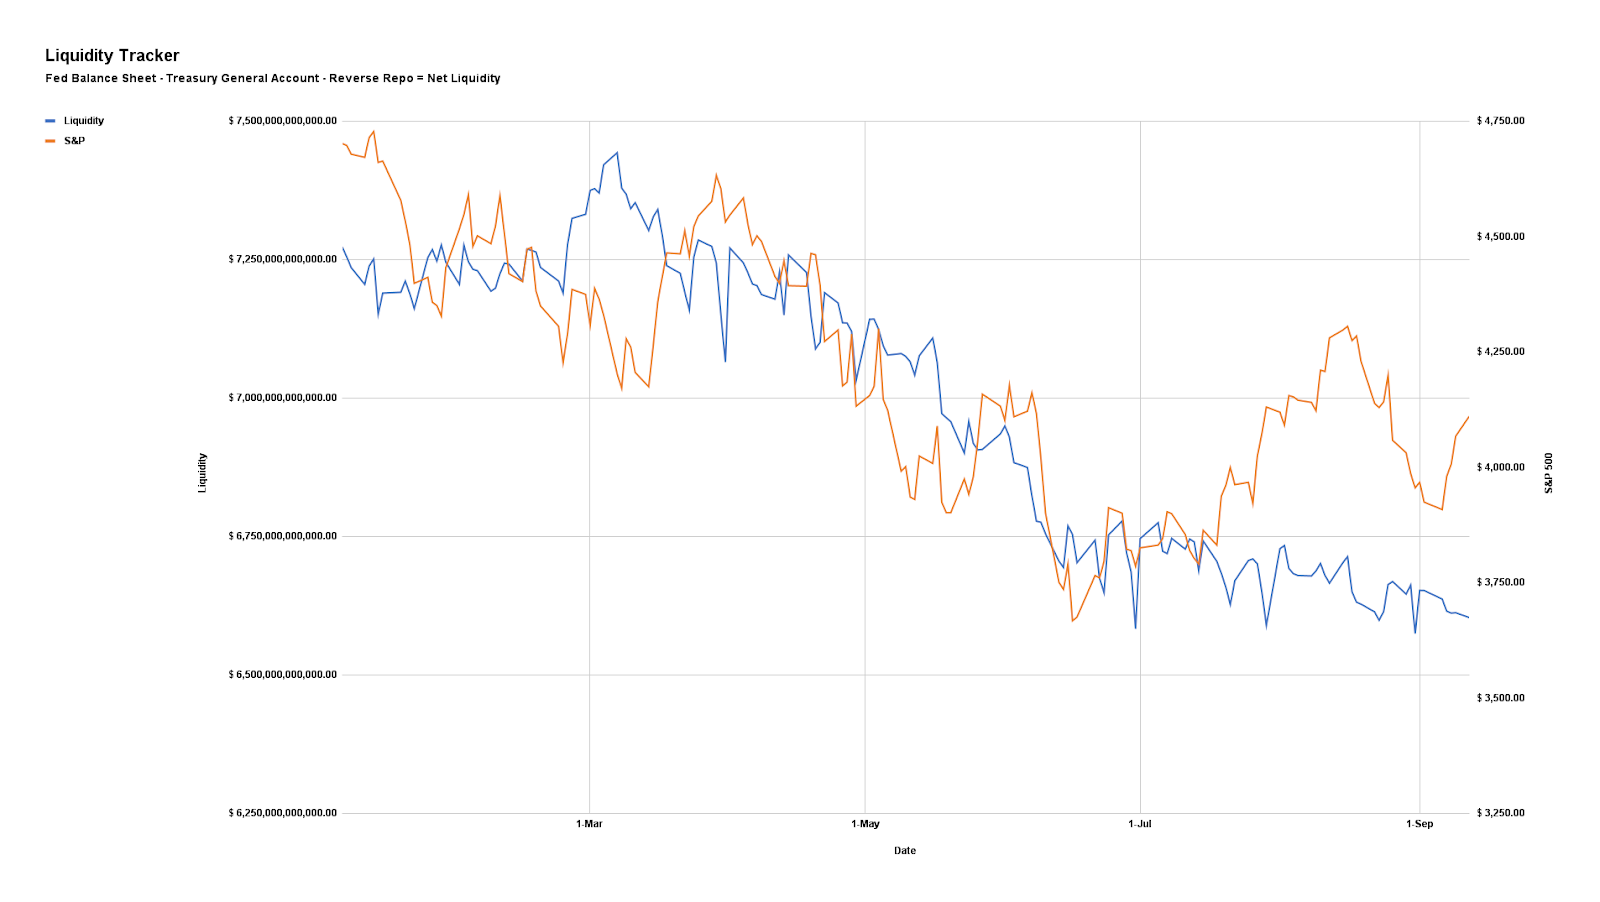
From thereon, the “second move and final resolution, if you wait for it, is usually tied to the incremental effects on liquidity (QE/QT).”

In the case of the latter, per The Ambrus Group’s Kris Sidial, “[o]utright tails in single stocks continue to be ‘cheap’ relative to what you are seeing in the broad market.”

“Market is discounting any sort of crash risk. Which seems reasonable granted that a lot of the current macro theme is geared towards a longer-term effect.”

Graphic: Retrieved from Bloomberg. Taken from Kris Sidial. “January 2022 was a time that was associated with really low vol (VIX = ~12). Consumer Staples Select Sector SPDR Fund (NYSE: XLP) 1M 80MNY tails today are only 4 vols over where they were during that time.”

Technical

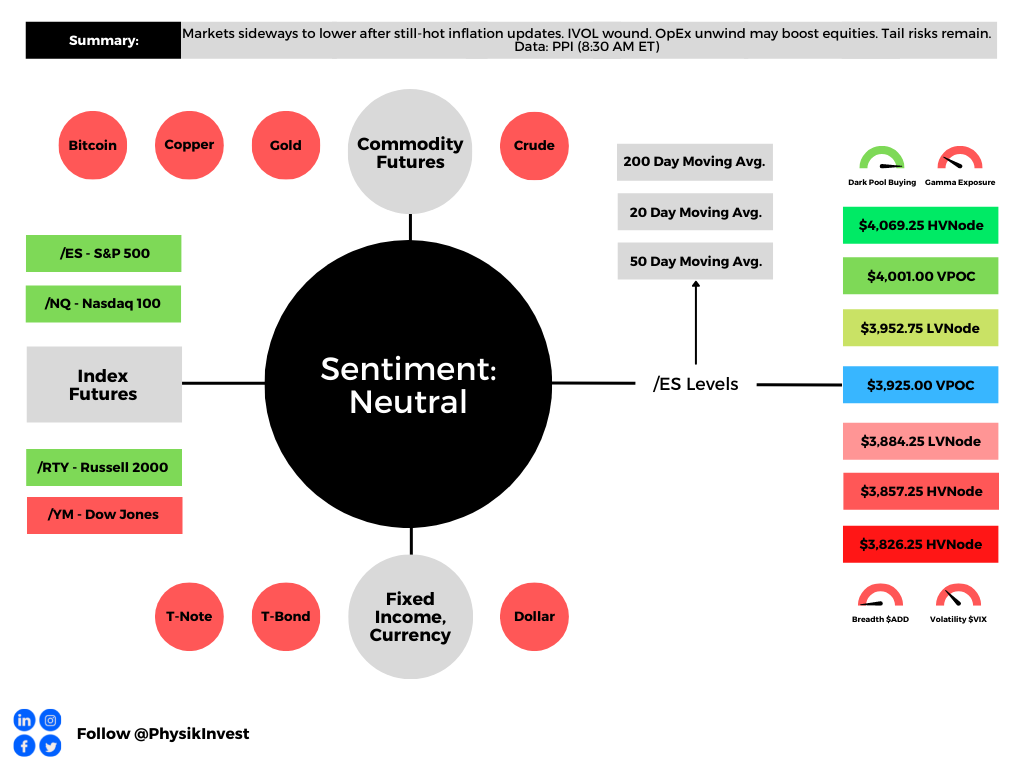
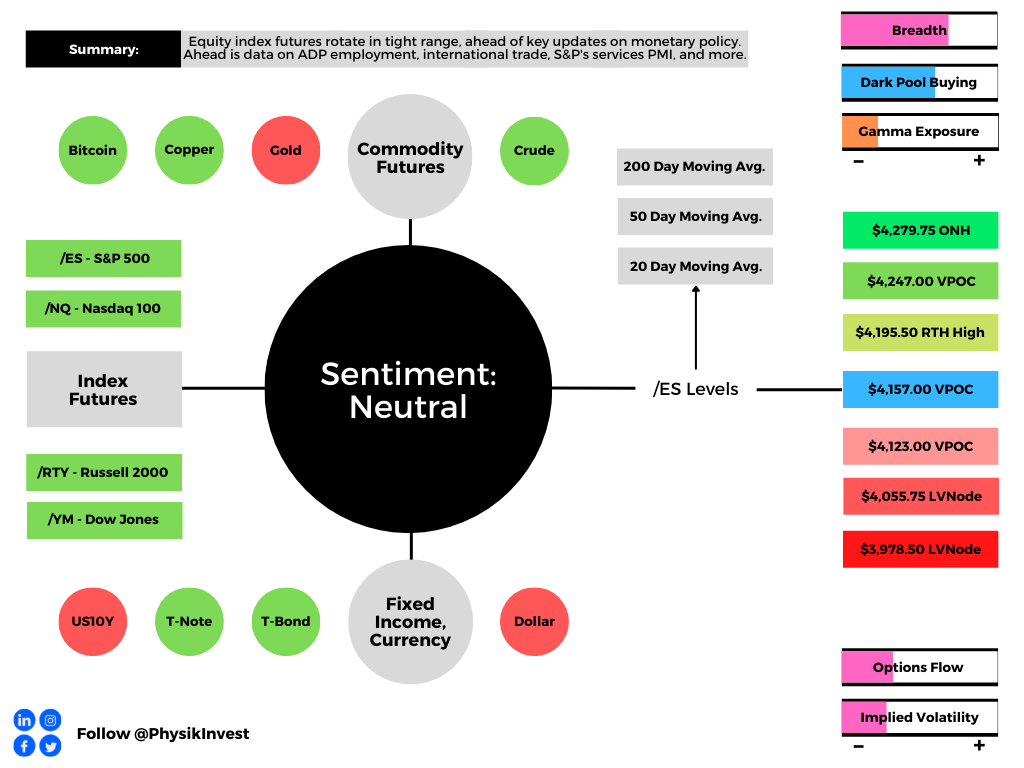
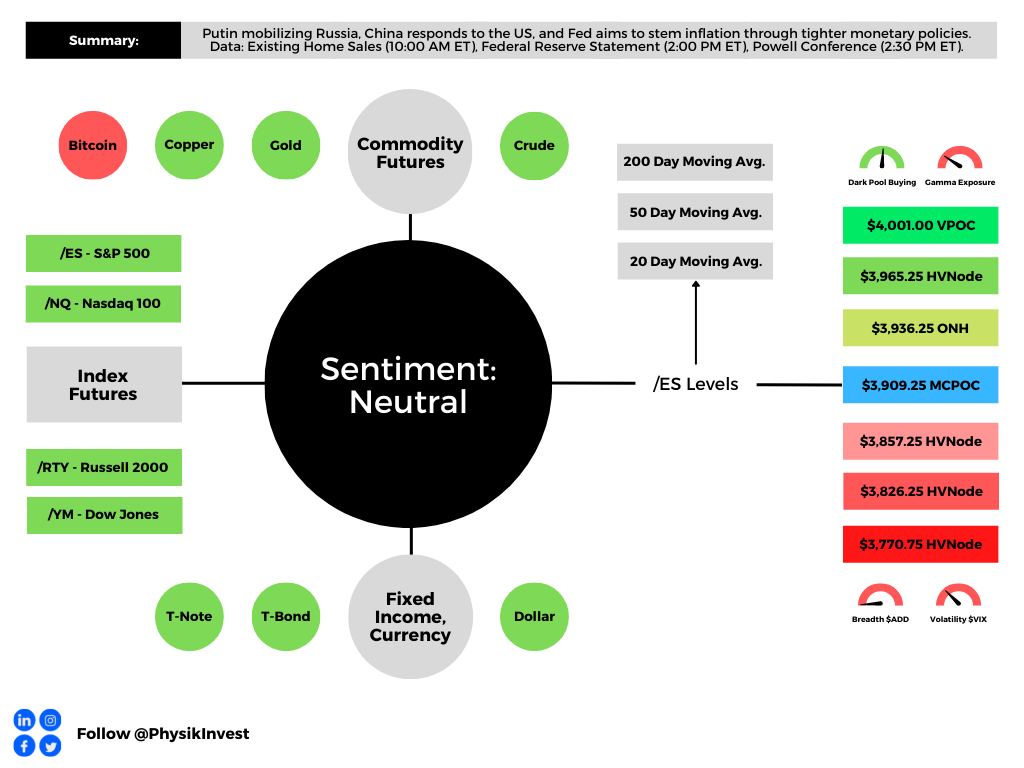
As of 7:00 AM ET, Wednesday’s regular session (9:30 AM – 4:00 PM ET), in the S&P 500, is likely to open in the upper part of a negatively skewed overnight inventory, inside of prior-range and -value, suggesting a limited potential for immediate directional opportunity.

In the best case, the S&P 500 trades higher.

Any activity above the $3,909.25 MCPOC puts into play the $3,936.25 ONH. Initiative trade beyond the ONH could reach as high as the $3,965.25 HVNode and $4,001.00 VPOC, or higher.

In the worst case, the S&P 500 trades lower.

Any activity below the $3,909.25 MCPOC puts into play the $3,857.25 HVNode. Initiative trade beyond the latter could reach as low as the $3,826.25 and $3,770.75 HVNode, or lower.

Click here to load today’s key levels into the web-based TradingView charting platform. Note that all levels are derived using the 65-minute timeframe. New links are produced, daily.
Graphic: 65-minute profile chart of the Micro E-mini S&P 500 Futures.

Definitions

Volume Areas: A structurally sound market will build on areas of high volume (HVNodes). Should the market trend for long periods of time, it will lack sound structure, identified as low volume areas (LVNodes). LVNodes denote directional conviction and ought to offer support on any test. 

If participants were to auction and find acceptance into areas of prior low volume (LVNodes), then future discovery ought to be volatile and quick as participants look to HVNodes for favorable entry or exit.

POCs: POCs are valuable as they denote areas where two-sided trade was most prevalent in a prior day session. Participants will respond to future tests of value as they offer favorable entry and exit.

MCPOCs: POCs are valuable as they denote areas where two-sided trade was most prevalent over numerous day sessions. Participants will respond to future tests of value as they offer favorable entry and exit.

About

After years of self-education, strategy development, mentorship, and trial-and-error, Renato Leonard Capelj began trading full-time and founded Physik Invest to detail his methods, research, and performance in the markets.

Capelj also develops insights around impactful options market dynamics at SpotGamma and is a Benzinga reporter.

Some of his works include conversations with ARK Invest’s Catherine Wood, investors Kevin O’Leary and John Chambers, FTX’s Sam Bankman-Fried, ex-Bridgewater Associate Andy Constan, Kai Volatility’s Cem Karsan, The Ambrus Group’s Kris Sidial, among many others.

Disclaimer

In no way should the materials herein be construed as advice. Derivatives carry a substantial risk of loss. All content is for informational purposes only.

Categories
Commentary

Daily Brief For September 14, 2022

The daily brief is a free glimpse into the prevailing fundamental and technical drivers of U.S. equity market products. Join the 900+ that read this report daily, below!

Graphic updated 8:00 AM ET. Sentiment Neutral if expected /ES open is inside the prior day’s range. /ES levels are derived from the profile graphic at the bottom of the following section. Levels may have changed since initially quoted; click here for the latest levels. SqueezeMetrics Dark Pool Index (DIX) and Gamma (GEX) calculations are based on where the prior day’s reading falls with respect to the MAX and MIN of all occurrences available. A higher DIX is bullish. At the same time, the lower the GEX, the more (expected) volatility. Learn the implications of volatility, direction, and moneyness. Breadth reflects a reading of the prior day’s NYSE Advance/Decline indicator. VIX reflects a current reading of the CBOE Volatility Index (INDEX: VIX) from 0-100.

Fundamental

A sell-off spurred by a higher-than-expected Consumer Price Index (CPI) hit nearly all assets.

Graphic: Retrieved from Bloomberg.

Expected was an 8.1% rise year-over-year (YoY) and a 0.1% fall month-over-month (MoM). Core CPI (excludes food and energy) was to rise by 6.1% YoY and 0.3% MoM, respectively.

Officially, the headline number rose to 8.3%. The core CPI rose 6.3% YoY and 0.6% MoM, meaning the March peak remains (6.5% YoY, then).

It’s the case, essentially, that “[a]ll measures came in above forecasts. Shelter, food and medical care were among the largest contributors to price growth,” per Bloomberg.

Graphic: Retrieved from Bloomberg.

The data, which “illustrates a strong labor market and weakening consumer spending,” in total, bolsters the case for interest rates to rise by “three-quarters of a percentage point.”

Bloomberg’s Anna Wong and Andrew Husby add: “[W]ages have now become the top driver of inflation. With Fed officials already highly concerned about a potential wage-price spiral, the central bank is likely to keep hiking in the first half of 2023.”

Graphic: Retrieved from Bloomberg.

The selling hit growth and technology, hard. These areas are far more responsive to changes in rates as there is promise embedded in their stock prices, too. When rates rise, prices are hit as the value of future earnings looks far less attractive versus higher-yielding or less-risky assets.

“Multiple compression will continue as long as we have sticky inflation,” said Marija Veitmane of State Street Corp (NYSE: STT). “Profits will crater. We still see a lot of downside on equities.”

Beyond risk assets, rising interest rates increase the cost of financing leaving households with less money to spend (or more hesitant to spend money), and this leads a decline in demand. Accordingly, business profits and economic growth may decline, too.

Graphic: Retrieved from Danielle DiMartino Booth.

A conversation between Joseph Wang and Andy Constan, which we shall unpack in coming letters, deserves a listen. At its core, financial markets sold, primarily, on the “flow” of liquidity this year. Read the coming letters for more.

Graphic: Via Physik Invest. Data compiled by @jkonopas623. Fed Balance Sheet data, here. Treasury General Account Data, here. Reverse Repo data, here. NL = BS – TGA – RRP.

Positioning

Traders sought shorter-dated equity put (downside) protection, in size, heading into Tuesday’s decline. Prior to the market open, Tuesday, we said that some “‘massive hedging activity’ feels ‘unsettling’” given what the “reaction to that protection entails should markets drop lower and [implied volatility] increase, accordingly.”

Graphic: Retrieved from SqueezeMetrics. Learn the implications of volatility, direction, and moneyness.

From thereon, options were repriced as markets sold and IVOL increased.

As I well put in a SpotGamma note last night, “it’s the case that [out-of-the-money] options went from having very little Delta (exposure to direction) to a lot more Delta. If we maintain the assumption that liquidity providers are short those puts, a positive delta trade, then those liquidity providers sold futures and stock, a negative Delta trade.”

In short, options out of the money are highly sensitive to changes in direction and IVOL, which there was a lot of, yesterday. Those options quickly went from having little value to a lot of value. If you’re short that exposure, and don’t want to lose money, you have to sell something, and the latter is what compounded the selling.

From hereon, as we said, a lot of the exposure demanded is short-dated. Should that exposure not be rolled forward in time, and allowed to expire, “SPX/ES dealers [who] are well hedged,” will unwind their hedges which may drive bullishness “through OpEx (options expiration),” says Kai Volatility Cem Karsan.

Notwithstanding, this “has [the] potential to drive a tail post” OpEx. In [the] tech/meme market melt-up of 2020-2021, positioning was [the] exact opposite.”

Technical

As of 8:10 AM ET, Wednesday’s regular session (9:30 AM – 4:00 PM ET), in the S&P 500, is likely to open in the lower part of a balanced overnight inventory, inside of prior-range and -value, suggesting a limited potential for immediate directional opportunity.

In the best case, the S&P 500 trades higher.

Any activity above the $3,952.00 VPOC puts into play the $3,952.75 LVNode. Initiative trade beyond the LVNode could reach as high as the $4,001.00 VPOC and $4,069.25 HVNode, or higher.

In the worst case, the S&P 500 trades lower.

Any activity below the $3,952.00 VPOC puts into play the $3,884.25 LVNode. Initiative trade beyond the LVNode could reach as low as the $3,857.25 and $3,826.25 HVNode, or lower.

Click here to load today’s key levels into the web-based TradingView charting platform. Note that all levels are derived using the 65-minute timeframe. New links are produced, daily.
Graphic: 65-minute profile chart of the Micro E-mini S&P 500 Futures.

Definitions

Volume Areas: A structurally sound market will build on areas of high volume (HVNodes). Should the market trend for long periods of time, it will lack sound structure, identified as low volume areas (LVNodes). LVNodes denote directional conviction and ought to offer support on any test. 

If participants were to auction and find acceptance into areas of prior low volume (LVNodes), then future discovery ought to be volatile and quick as participants look to HVNodes for favorable entry or exit.

POCs: POCs are valuable as they denote areas where two-sided trade was most prevalent in a prior day session. Participants will respond to future tests of value as they offer favorable entry and exit.

MCPOCs: POCs are valuable as they denote areas where two-sided trade was most prevalent over numerous day sessions. Participants will respond to future tests of value as they offer favorable entry and exit.

About

After years of self-education, strategy development, mentorship, and trial-and-error, Renato Leonard Capelj began trading full-time and founded Physik Invest to detail his methods, research, and performance in the markets.

Capelj also develops insights around impactful options market dynamics at SpotGamma and is a Benzinga reporter.

Some of his works include conversations with ARK Invest’s Catherine Wood, investors Kevin O’Leary and John Chambers, FTX’s Sam Bankman-Fried, ex-Bridgewater Associate Andy Constan, Kai Volatility’s Cem Karsan, The Ambrus Group’s Kris Sidial, among many others.

Disclaimer

In no way should the materials herein be construed as advice. Derivatives carry a substantial risk of loss. All content is for informational purposes only.

Categories
Commentary

Daily Brief For May 4, 2022

The Daily Brief is a free glimpse into the prevailing fundamental and technical drivers of U.S. equity market products. Join the 200+ that read this report daily, below!

What Happened

Overnight, equity index futures were quiet, auctioning sideways-to-higher, ahead of updates on monetary policies.

A check on some naive measures suggests we’re in for an expansion of range (i.e., heightened realized volatility) in the coming session(s). Key, today, are Federal Open Market Committee (FOMC) updates (2:00 PM ET) and a news conference (2:30 PM ET). 

The expectation is a 50 basis point hike and balance sheet contraction with run-off caps of $95 billion. If the action is in line with expectations (priced in), the reaction is likely to be positive.

Today’s economic calendar includes, also, a release of the Automatic Data Processing Inc’s (NASDAQ: ADP) employment report (8:15 AM ET), international trade balance (8:30 AM ET), S&P Global Inc’s (NYSE: SPGI) U.S. services PMI (9:45 AM ET), and the ISM services index (10:00 AM ET). 

Graphic updated 7:00 AM ET. Sentiment Neutral if expected /ES open is inside of the prior day’s range. /ES levels are derived from the profile graphic at the bottom of the following section. Levels may have changed since initially quoted; click here for the latest levels. SqueezeMetrics Dark Pool Index (DIX) and Gamma (GEX) calculations are based on where the prior day’s reading falls with respect to the MAX and MIN of all occurrences available. A higher DIX is bullish. At the same time, the lower the GEX, the more (expected) volatility. Learn the implications of volatility, direction, and moneyness. SHIFT data used for S&P 500 (INDEX: SPX) options activity. Note that options flow is sorted by the call premium spent; if more positive, then more was spent on call options. Breadth reflects a reading of the prior day’s NYSE Advance/Decline indicator. VIX reflects a current reading of the CBOE Volatility Index (INDEX: VIX) from 0-100.

What To Expect

Fundamental: Expected is front-loaded tightening, by the Federal Reserve (Fed), today.

The consensus is anchored around a 50 basis-point hike in May and no adjustments to the Reverse Repo Rate (RRP) or Interest on Reserve Balances (IORB), says Nordea Bank (OTC: NRDBY) research. The Fed may opt, also, to initiate a 75 basis-point hike in June.

“We believe that after the FOMC hikes by a half-point in May and presents a detailed plan to reduce the Fed balance sheet,” imminently, says Anna Wong, Yelena Shulyatyeva, Andrew Husby, and Eliza Winger of Bloomberg. 

“Powell will avoid definitive guidance about the size of future hikes, as policymakers assess how the runoff is affecting the economy in coming months.”

Graphic: Via Nordea research. Heightened inflation, exacerbated by sticky supply pressures and the conflict in Ukraine, and trends in demand have played into a tough talk on monetary policies.

As noted before, the key (risk) is the statements on the Fed’s balance sheet and the (imminent) process to shrink it through quantitative tightening (QT).

Graphic: Via Mish Talk. “The Fed expanded QE aggressively for years. But nearly all of that expansion was longer-dated securities as the [] chart shows. If the Fed had short-term securities it could reduce its balance sheet simply by runoff. Instead, the Fed will aggressively have to sell securities, especially MBS, if it really wants to reduce its balance sheet as quickly as it has implied.

Per Nordea, QT is likely to consist of a 3-month phase-in period and run-off caps of $95 billion (i.e., $60 billion on U.S. Treasuries [USTs] and $35 billion in mortgage-backed securities [MBSs]), effectively lowering the Fed’s balance sheet by $670 billion by year-end.

Graphic: Via Bloomberg and Mitsubishi UFJ Financial Group Inc (NYSE: MUFG) U.S. Macro Strategy.

This is alongside the realization that “1Q may be the last good quarter of earnings as higher costs and increased recession risks weigh on future growth,” Morgan Stanley’s (NYSE: MS) Mike Wilson explains.

Graphic: Via Royal Bank of Canada (NYSE: RY) U.S. Equity Strategy and Bloomberg.

Market weakness in the past weeks was the result of “growing evidence that growth is slowing faster than most investors believe,” Wilson adds, and “the market is currently so oversold, any good news [such as Fed action being as expected] could lead to a vicious bear market rally.”

“We can’t rule anything out in the short term but we want to make it clear this bear market is far from complete.”

Positioning: Borrowing from yesterday’s letter, as little has changed, bets on the direction are concentrated in negative delta (long puts, short calls). The exposure is short-dated and highly sensitive to changes in implied volatility and direction.

Graphic: SqueezeMetrics on “how IV, direction, and moneyness cause option dealers to buy or sell the underlying.”

This exposure’s roll-off and compression in volatility ought to coincide with liquidity provider support to markets (i.e., relief of pressure from hedges to concentrated options positioning).

Per Kai Volatility’s Cem Karsan, on a Fed day, “the first move tends to be structural. A function of the inevitable rebalancing of dealer inventory post-event. The second move and final resolution, if you wait for it, is usually tied to the incremental effects on liquidity (QE/QT).”

Validation of the latter (move) ought to be confirmed by participants’ new concentration of bets. In other words, if participants start to concentrate their bets at higher prices, further out in time, that confirms (changing sentiment) and (improves) the odds of sustained follow-through.

If not, it’s likely that prices, after a short-term relief, will succumb to fundamental weaknesses.

Technical: As of 7:00 AM ET, Wednesday’s regular session (9:30 AM – 4:00 PM ET), in the S&P 500, will likely open in the upper part of a balanced overnight inventory, just inside of prior-range and -value, suggesting a limited potential for immediate directional opportunity.

In the best case, the S&P 500 trades higher; activity above the $4,157.00 untested point of control (VPOC) puts in play the $4,195.50 regular trade high (RTH High). Initiative trade beyond the RTH High could reach as high as the $4,247.00 VPOC and $4,279.75 overnight high (ONH), or higher.

In the worst case, the S&P 500 trades lower; activity below the $4,157.00 VPOC puts in play the $4,123.00 VPOC. Initiative trade beyond the $4,123.00 VPOC could reach as low as the $4,055.75 and $3,978.50 low volume areas (LVNodes), or lower.

Click here to load today’s key levels into the web-based TradingView charting platform. Note that all levels are derived using the 65-minute timeframe. New links are produced, daily.
Graphic: 65-minute profile chart of the Micro E-mini S&P 500 Futures.

What People Are Saying

Definitions

Overnight Rally Highs (Lows): Typically, there is a low historical probability associated with overnight rally-highs (lows) ending the upside (downside) discovery process.

Volume Areas: A structurally sound market will build on areas of high volume (HVNodes). Should the market trend for long periods of time, it will lack sound structure, identified as low volume areas (LVNodes). LVNodes denote directional conviction and ought to offer support on any test. 

If participants were to auction and find acceptance into areas of prior low volume (LVNodes), then future discovery ought to be volatile and quick as participants look to HVNodes for favorable entry or exit.

POCs: POCs are valuable as they denote areas where two-sided trade was most prevalent in a prior day session. Participants will respond to future tests of value as they offer favorable entry and exit.

Volume-Weighted Average Prices (VWAPs): A metric highly regarded by chief investment officers, among other participants, for quality of trade. Additionally, liquidity algorithms are benchmarked and programmed to buy and sell around VWAPs.

About

After years of self-education, strategy development, mentorship, and trial-and-error, Renato Leonard Capelj began trading full-time and founded Physik Invest to detail his methods, research, and performance in the markets.

Capelj also develops insights around impactful options market dynamics at SpotGamma and is a Benzinga reporter.

Some of his works include conversations with ARK Invest’s Catherine Wood, investors Kevin O’Leary and John Chambers, FTX’s Sam Bankman-Fried, Kai Volatility’s Cem Karsan, The Ambrus Group’s Kris Sidial, among many others.

Disclaimer

In no way should the materials herein be construed as advice. Derivatives carry a substantial risk of loss. All content is for informational purposes only.