The daily brief is a free glimpse into the prevailing fundamental and technical drivers of U.S. equity market products. Join the 1,200+ that read this report daily, below!
Administrative
This letter’s author is ramping up coverage and returning to speed after a short hiatus. Today’s focus will be on adding to the “Positioning” section of Monday’s letter.
Positioning
After some late-October weakness that is coinciding with the Federal Reserve’s (Fed) decision to raise rates, stocks are tame. This is heading into midterm elections, today, and inflation updates, Thursday.
Republicans are likely to add to their control of the House and Senate.
Having fewer Democrats in Congress would lower “the odds of fiscal measures [that would] embolden a hawkish Federal Reserve.”
This is a boon for stocks.
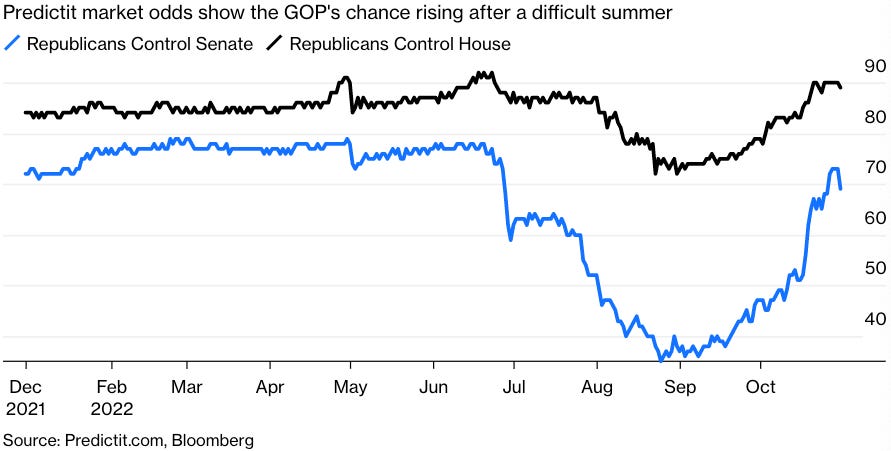
Indeed, Wells Fargo & Co (NYSE: WFC) strategists found a “GOP-controlled Senate historically is associated with superior equity returns.”
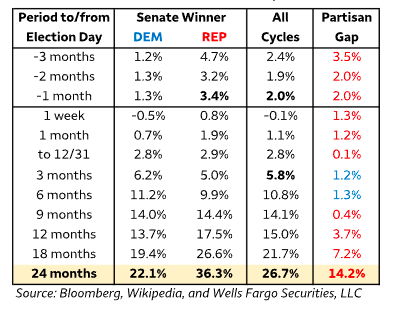
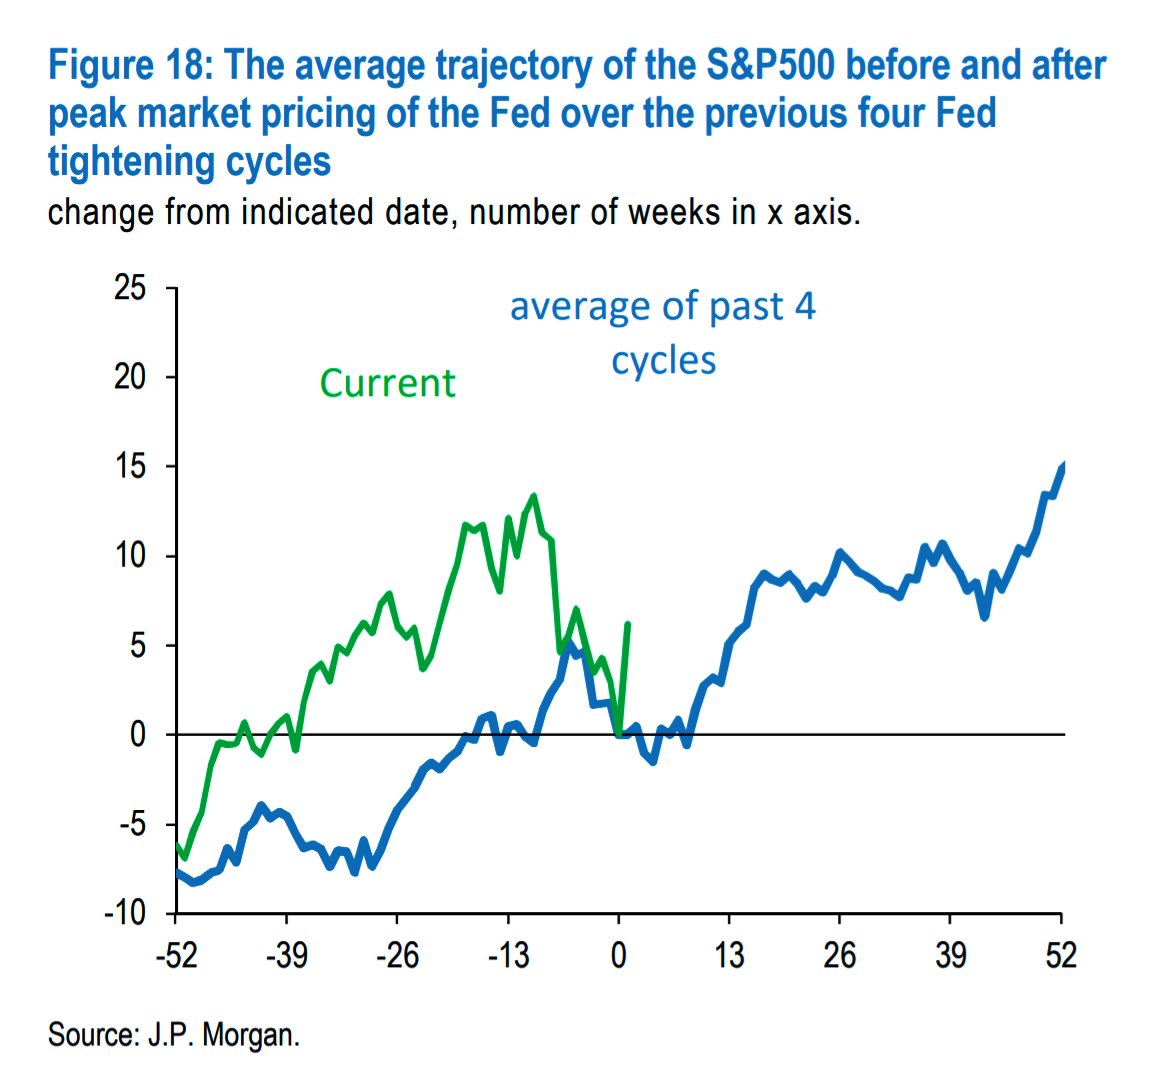
In spite of recessions, even, the S&P 500, a year after midterms, often netted positive 20% or so returns Citigroup Inc (NYSE: C) strategists add.
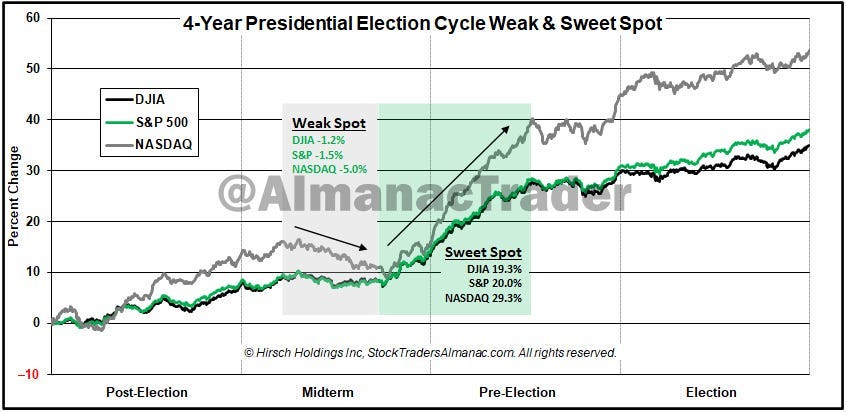
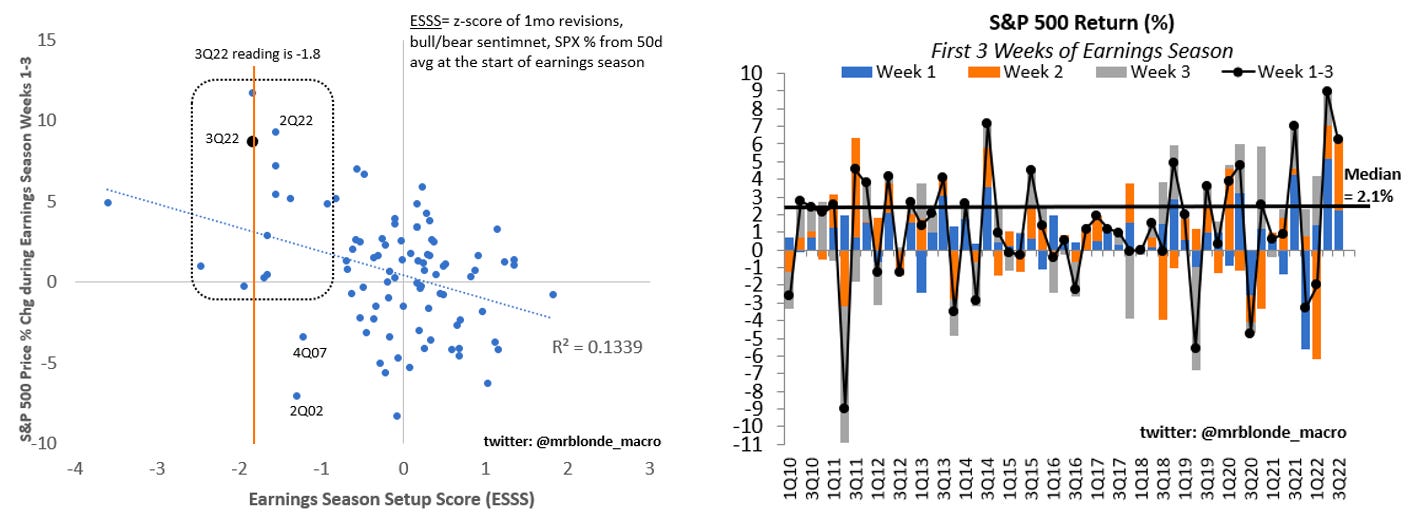
A post-election bump is on top of the general positiveness of equity performance during the earnings season and periods of strong pessimism as we have today.
Why all the potential positivity over this short period?
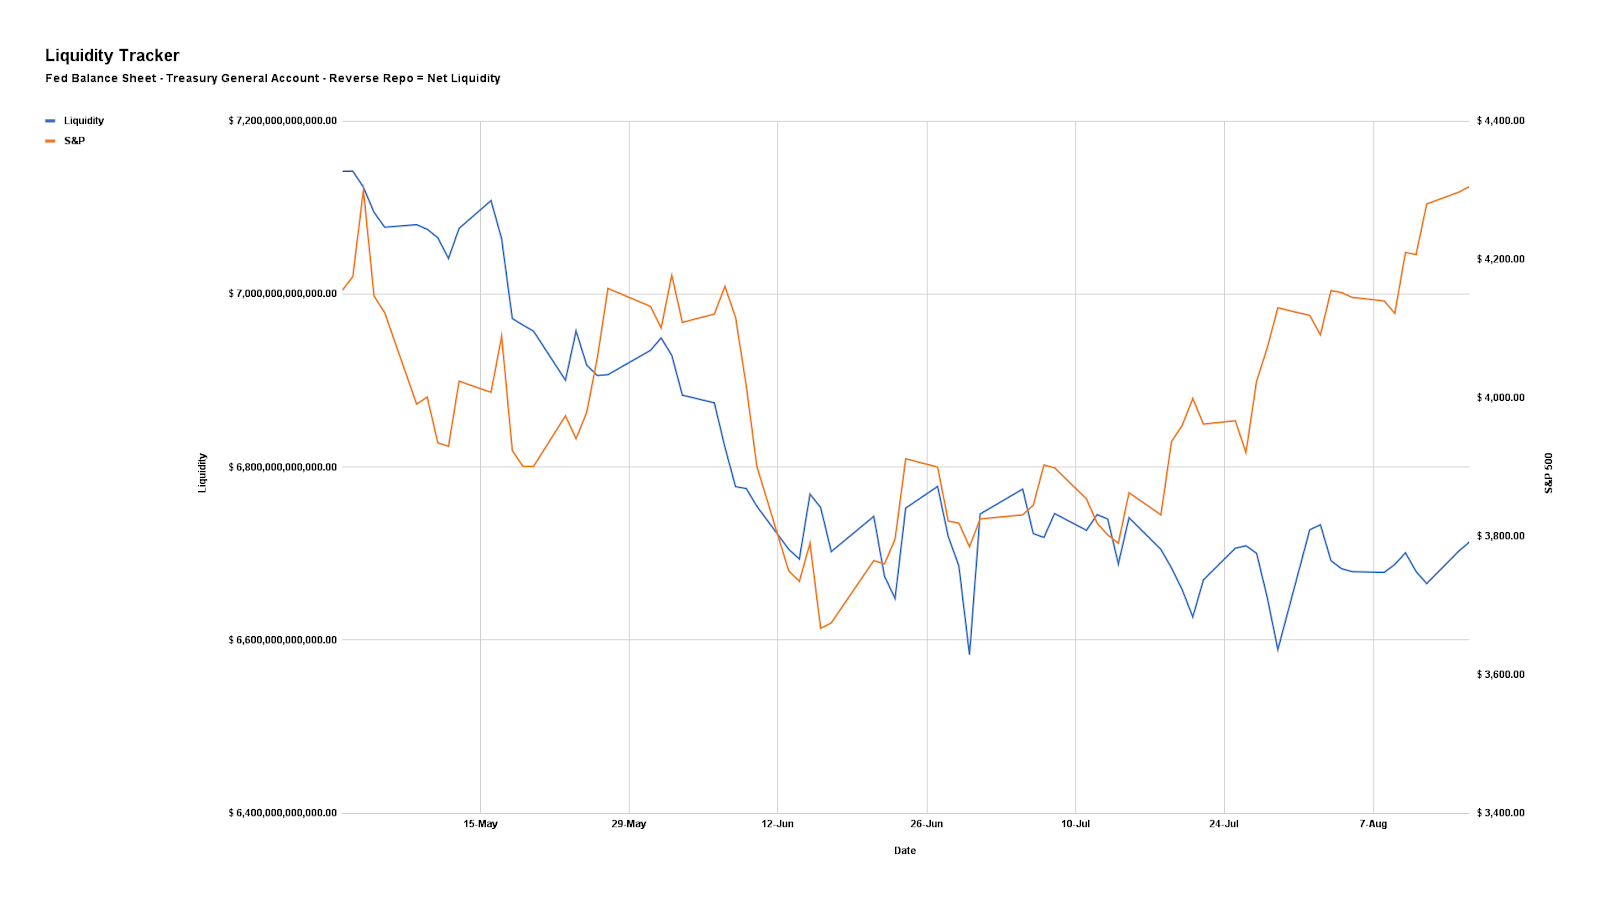
The aforementioned events are happening during a period wherein market liquidity eases (i.e., the holiday season).
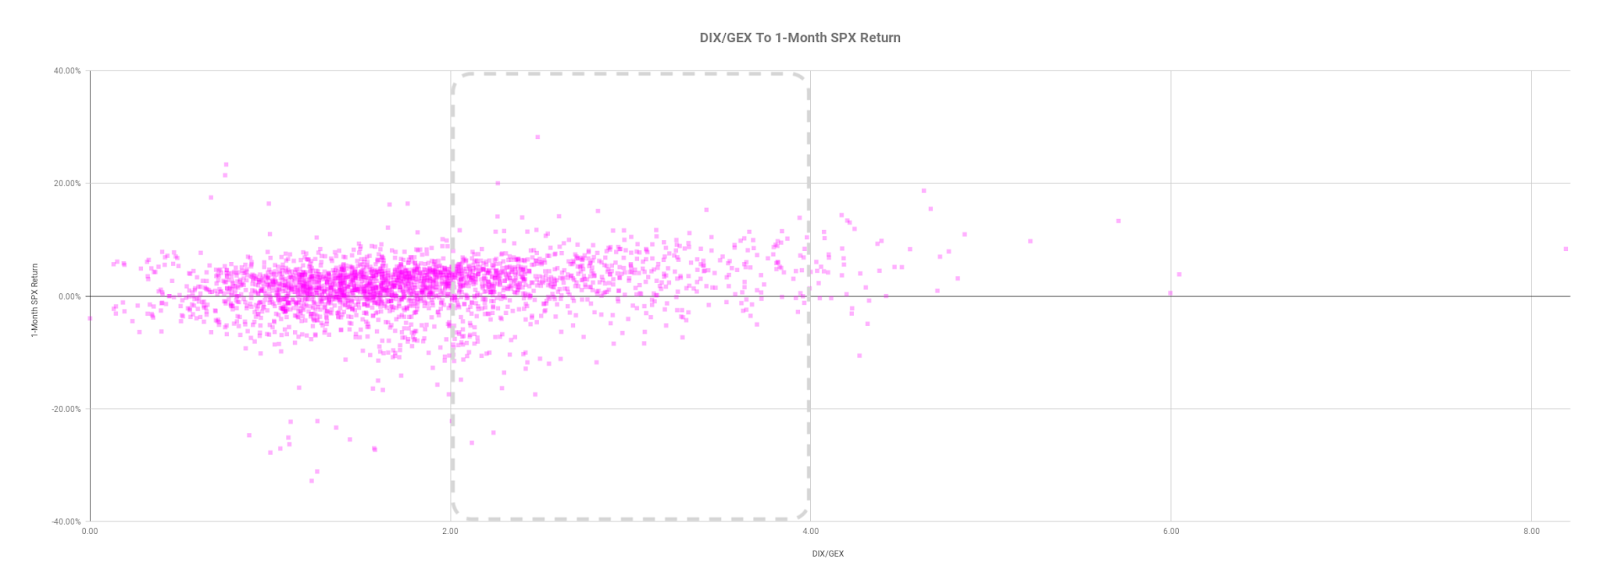
It’s during this period, from a positioning perspective, the effects of decay (which we discuss more below) accelerate, and a lack of liquidity, according to Kai Volatility’s Cem Karsan, makes markets sensitive to positive-leaning flows.
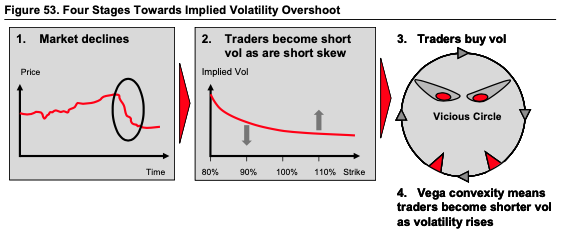
Pessimism and hedging may indirectly give rise to bullishness. Why is that?
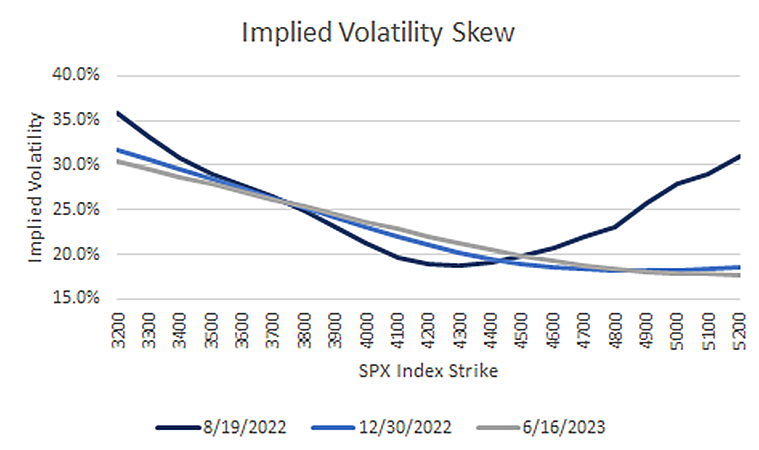
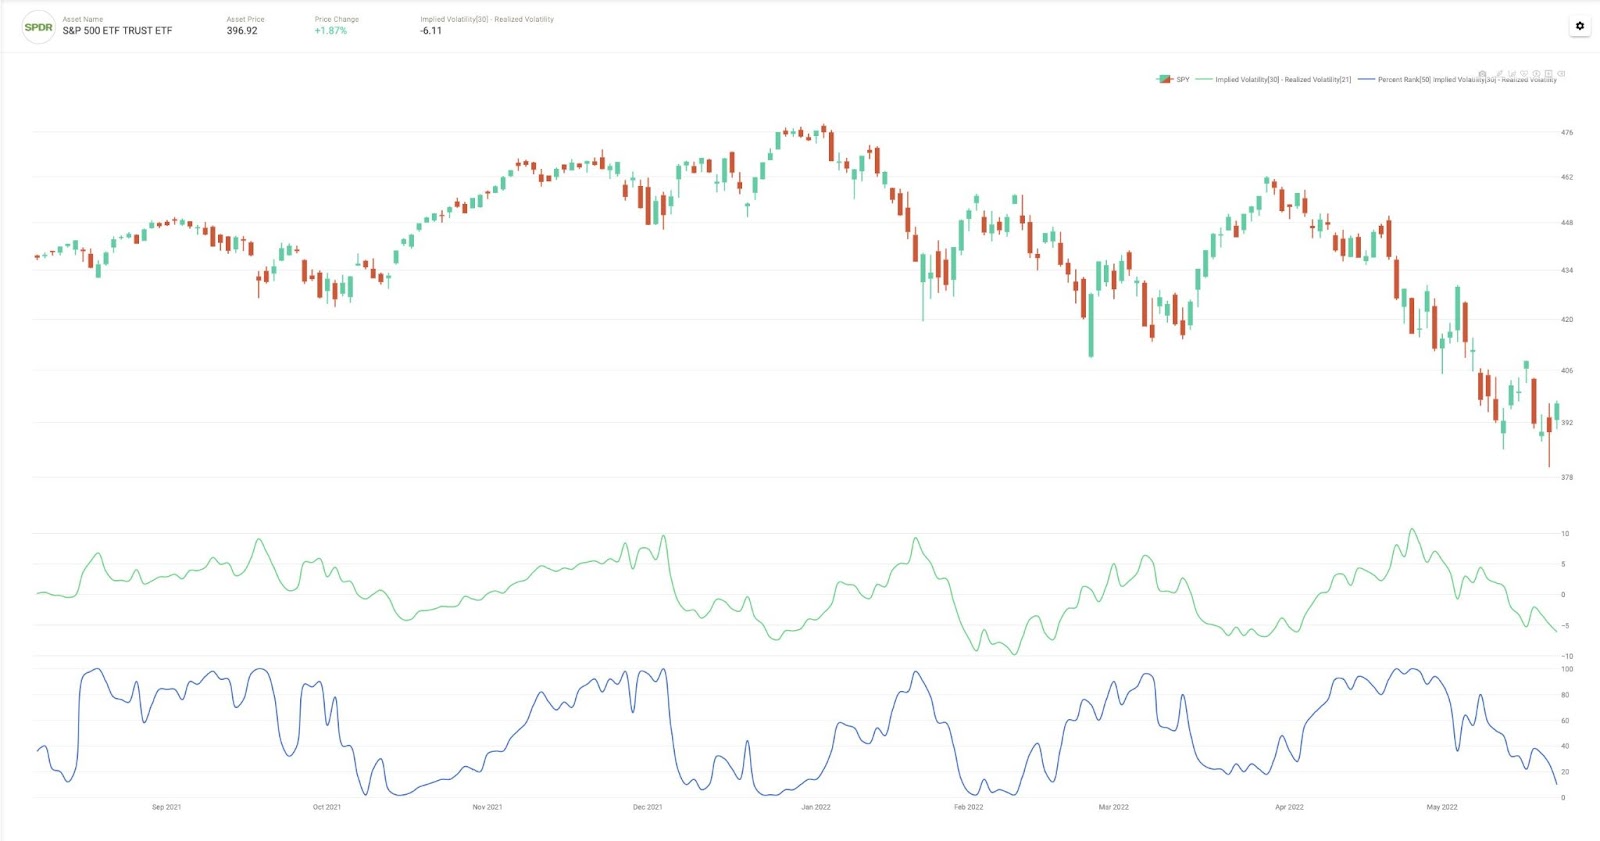
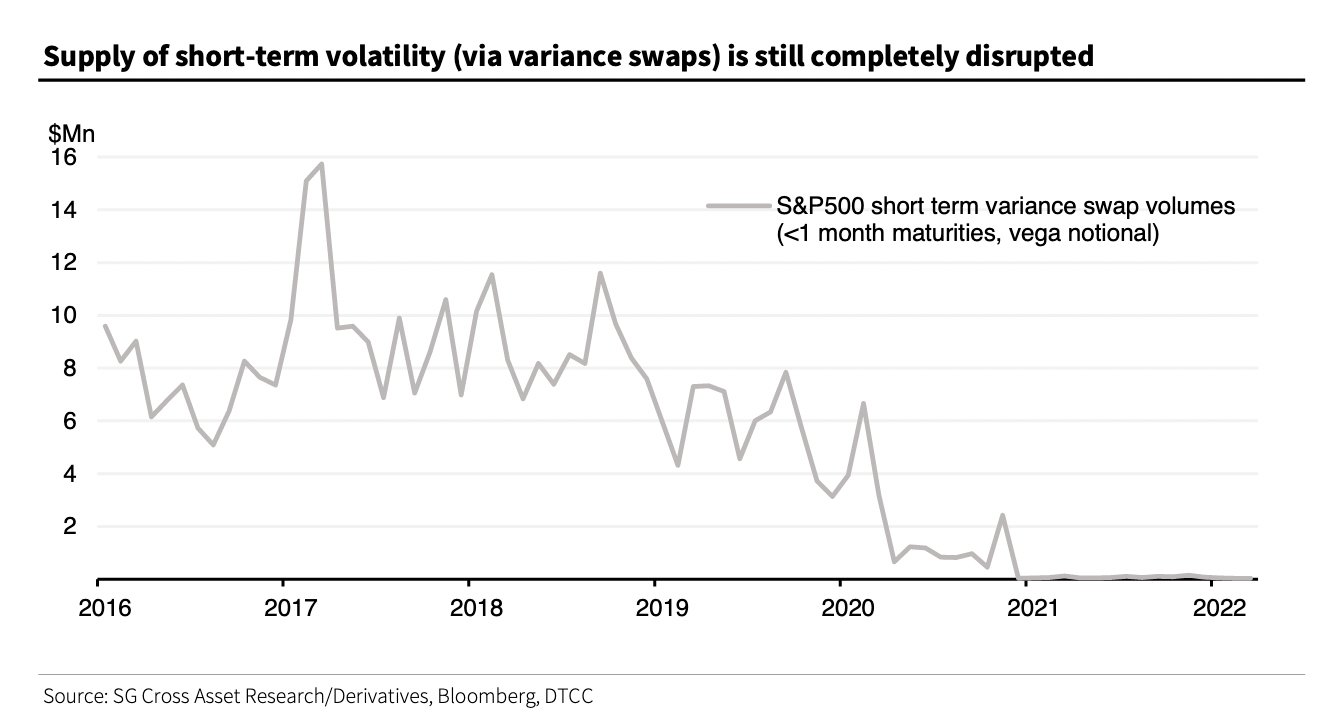
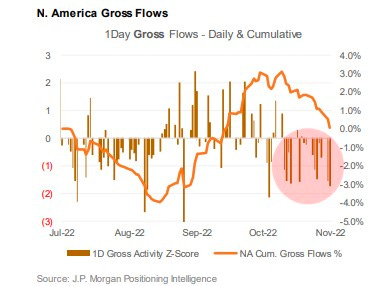
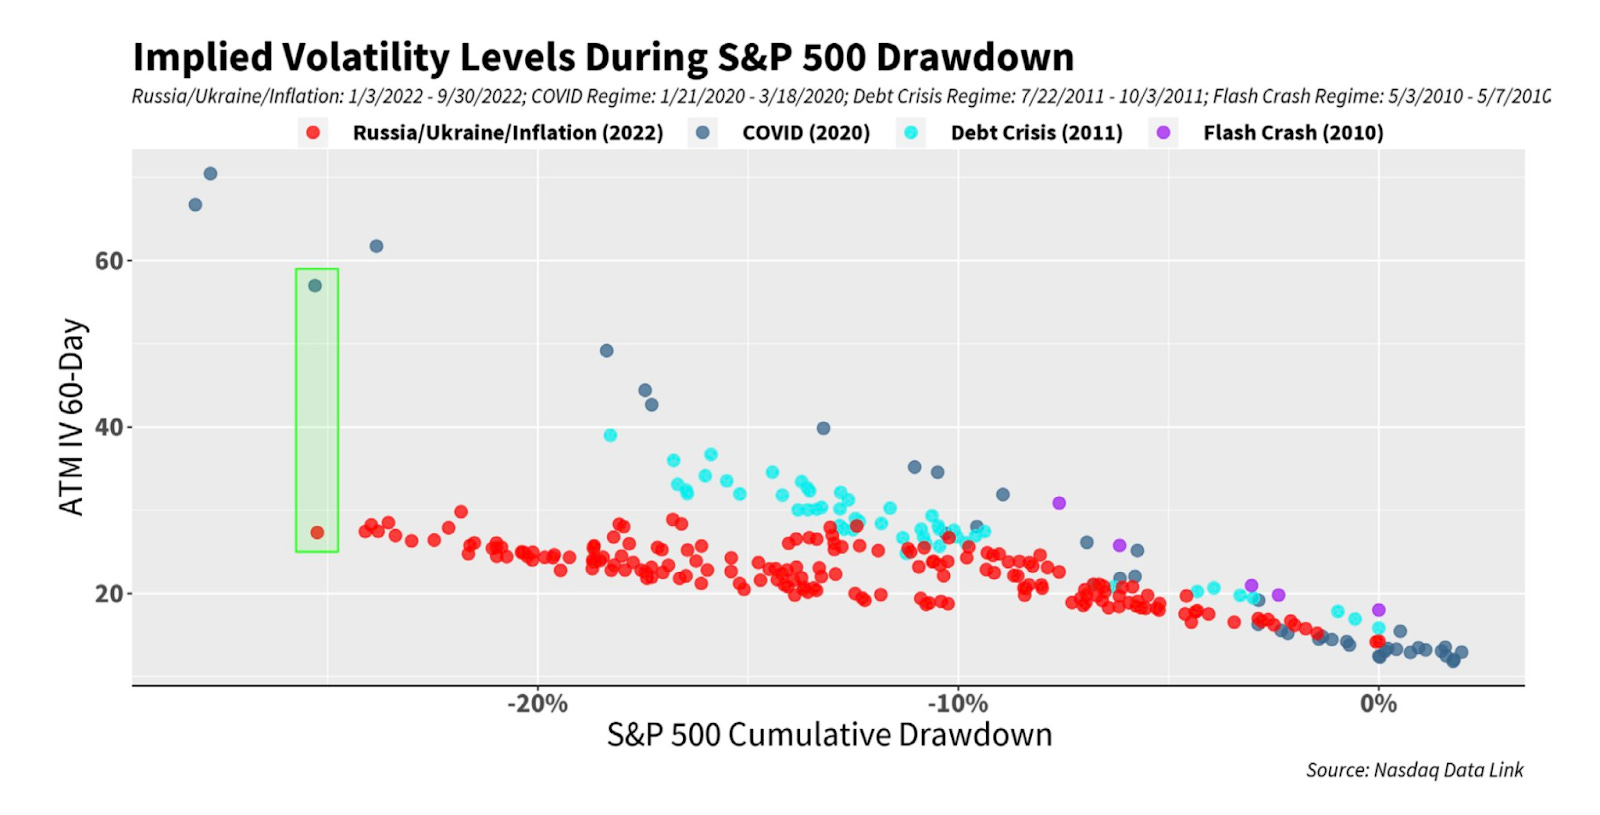
Demand for options exposures, especially across shorter time horizons, evidenced by heightened implied volatility (IVOL) at the front end (see below), has indirectly added to the pressures of de-grossing, as observed.

Though positioning is generally thin, as we also talked about in yesterday’s newsletter, thus reducing the impact of the hedging of this positioning, demand remains “strong,” per Karsan, and “dealers are short that volatility.”
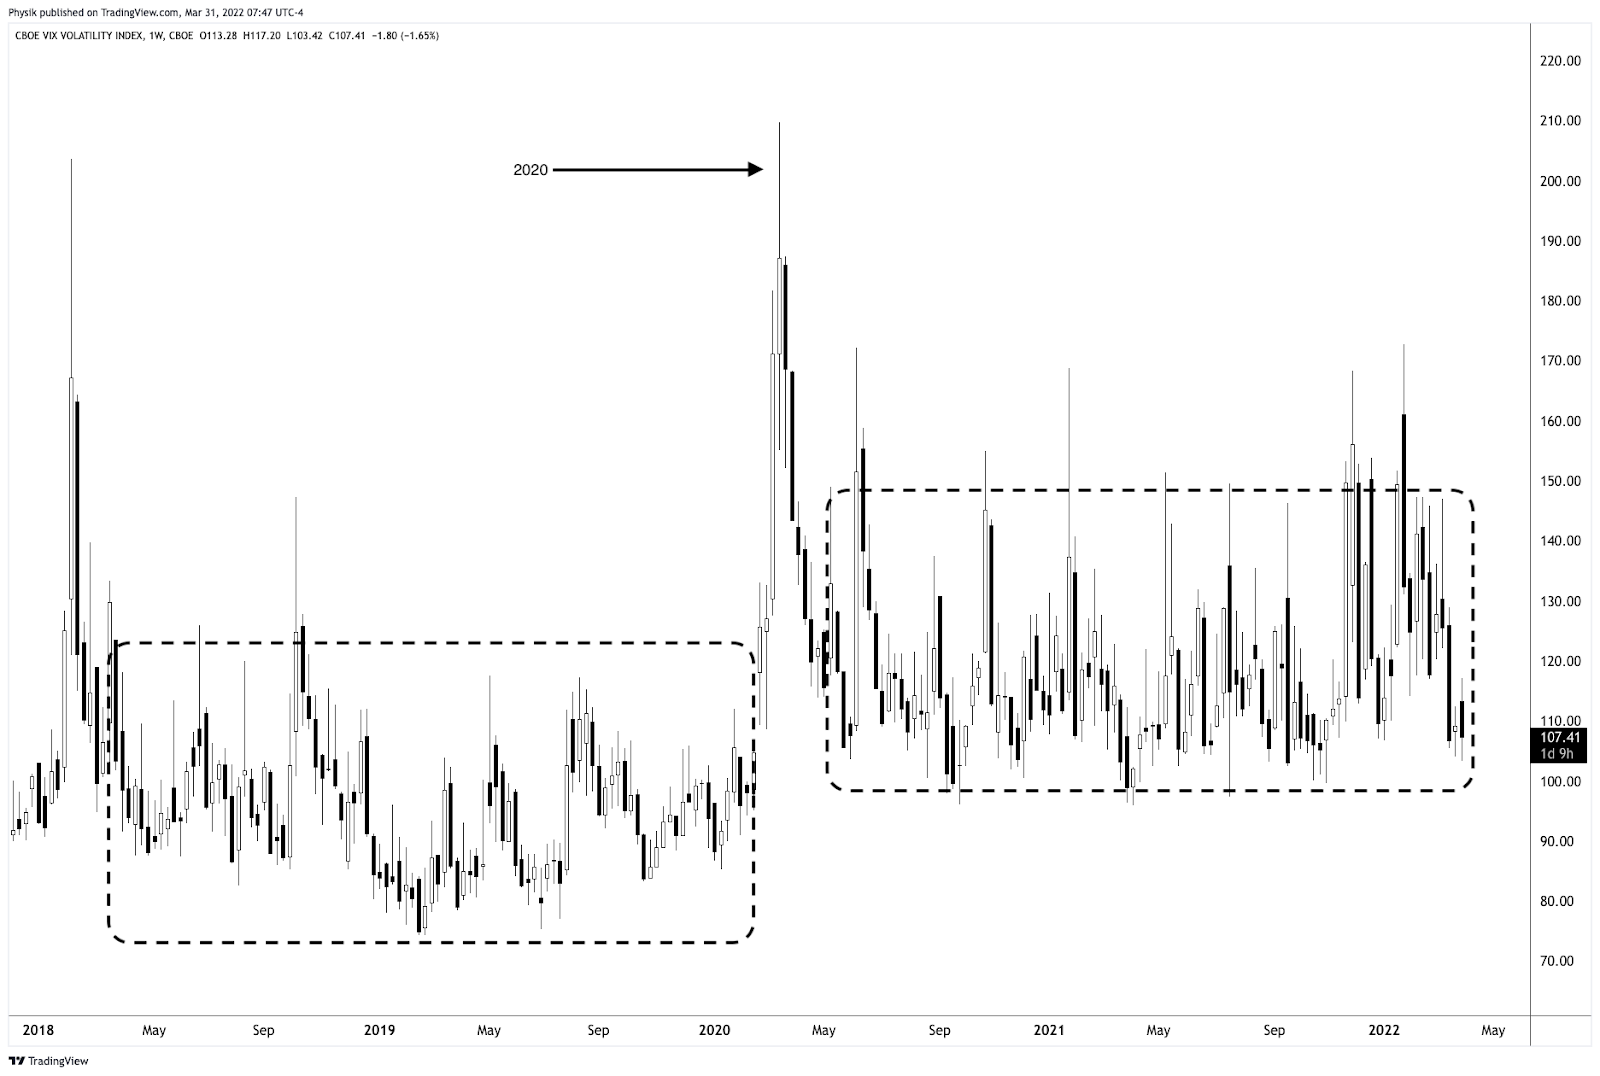
Derivatives strategists at the likes of the Royal Bank of Canada (NYSE: RY) agree with Karsan’s remarks; Amy Wu Silverman said that the Cboe Volatility Index’s (INDEX: VIX) elevation was the result of demand for hedges after October options expiry.
“Part of today’s move at least is a function of new positions. There is likely demand for future months since we just went through October options expiry,” she said. “Part of it is a function of the ‘floor’ of a new volatility regime.”
So, what’s the point to make?
For IVOL measures to remain wound, something bad needs to happen, in short.
Otherwise, per SpotGamma, a “decline in IVOL … can aid in a push-and-pull that actually serves to … resist far-reaching weakness” and keep selling orderly.
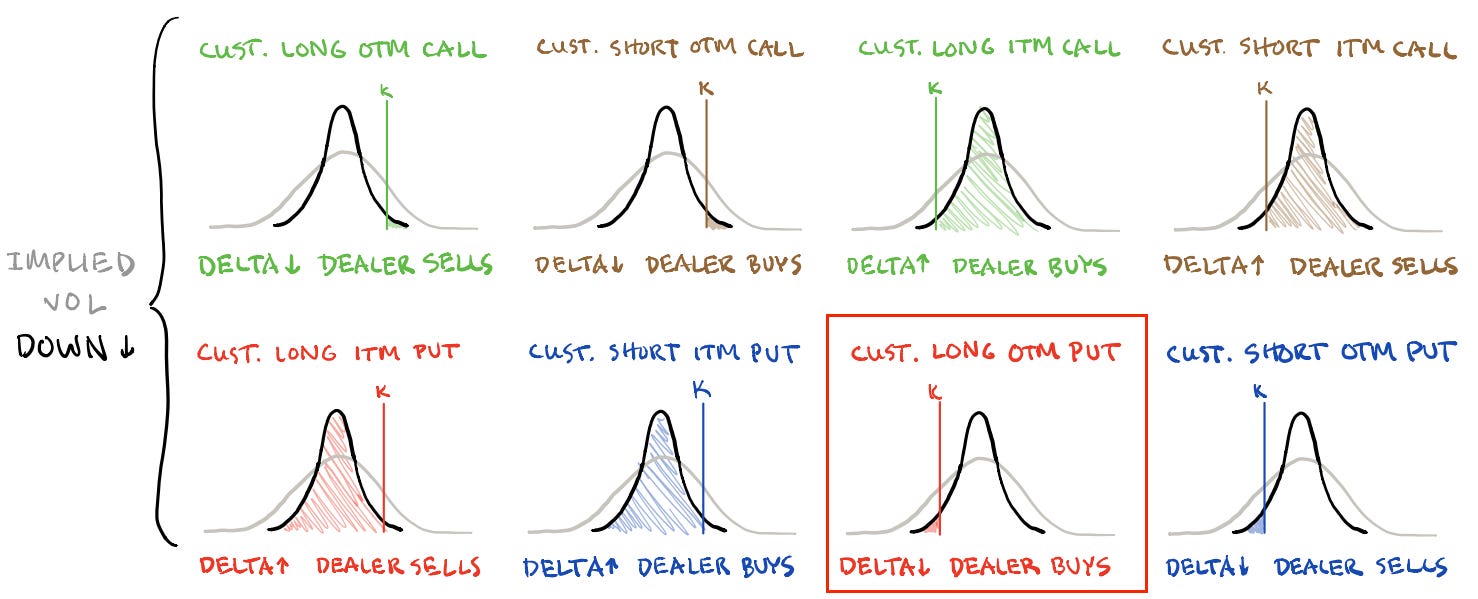
That’s because, from here, the removal of the protection that’s been demanded in the past days and weeks compounds the sped-up effects of Charm.
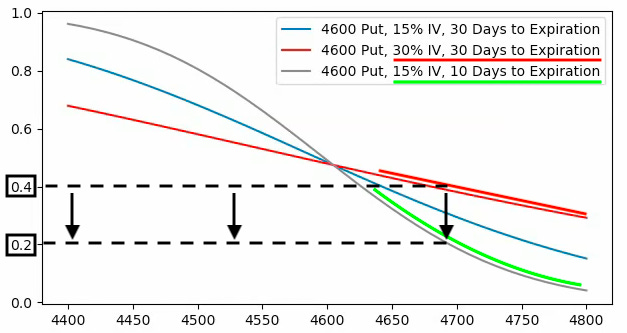
Charm, which is the change in options Delta (i.e., exposure to direction) with respect to changes in time, “drives a positive window or seasonality”; “the reduction in time” and “lack of liquidity” make markets more sensitive to those positive flows.
In the long term, however, weakness is here to stay. Poor IVOL performance and little skew also likely set the stage for a post-holiday tail. More on this, later.
Technical
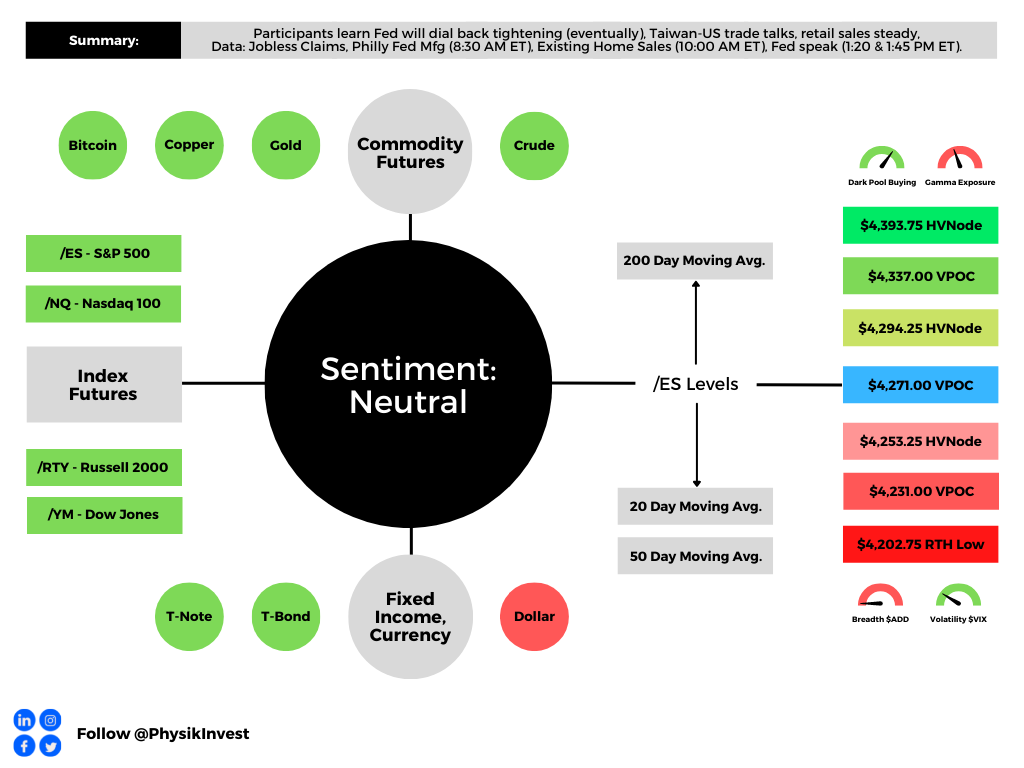
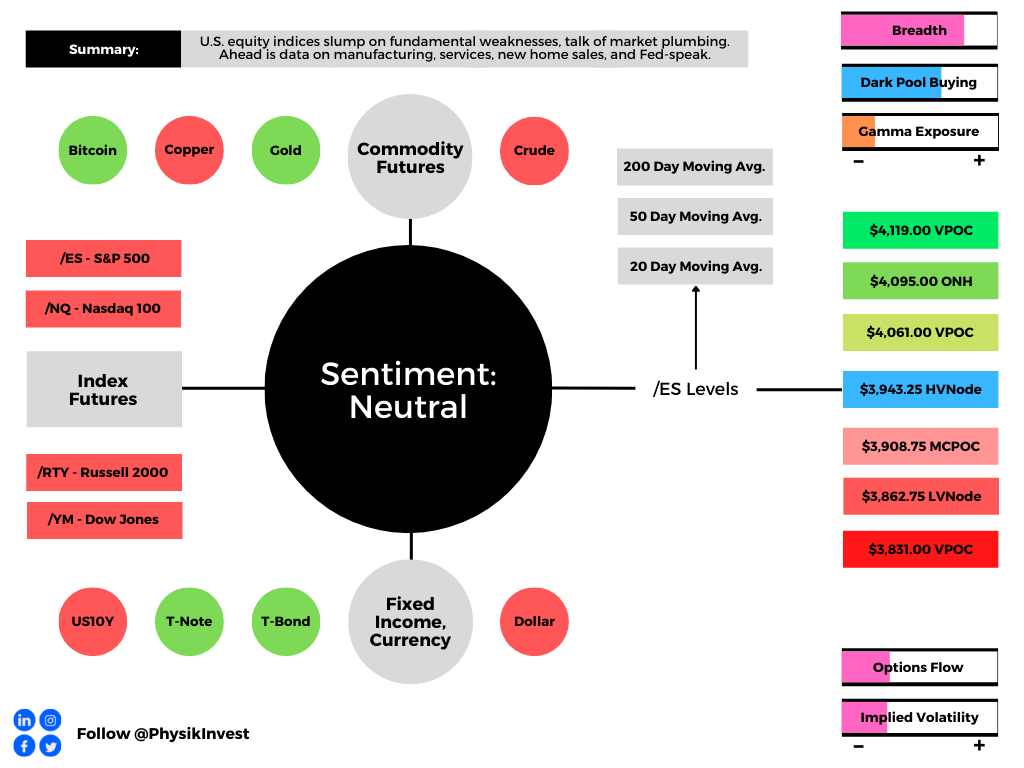
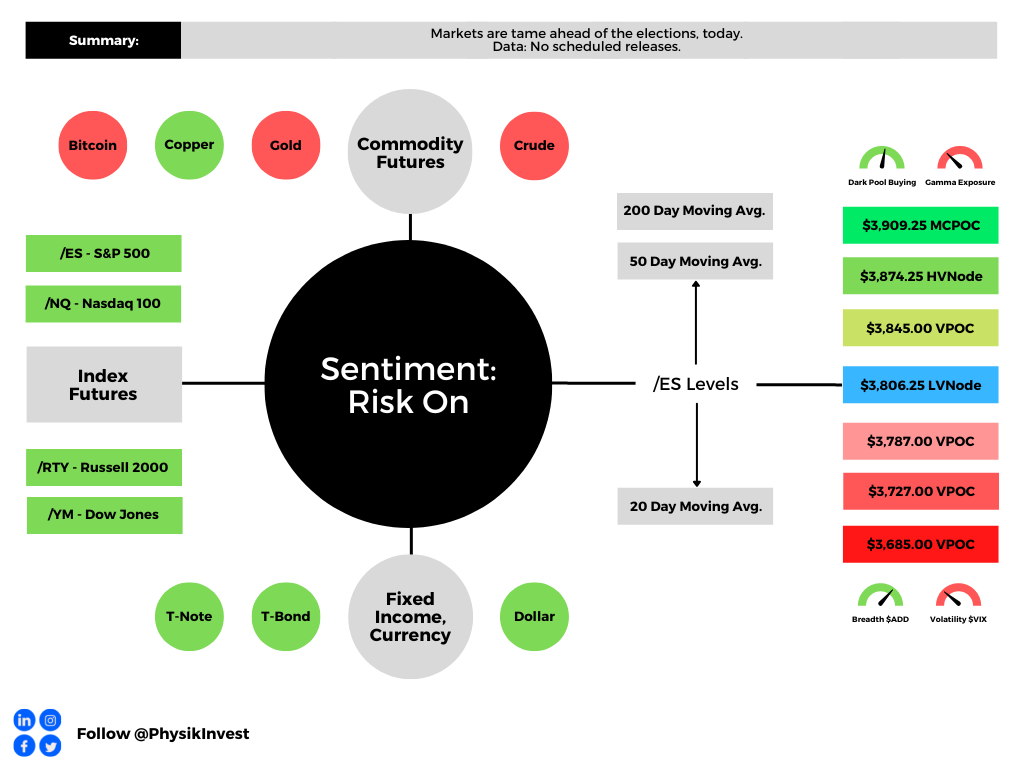
As of 6:45 AM ET, Tuesday’s regular session (9:30 AM – 4:00 PM ET), in the S&P 500, is likely to open in the upper part of a positively skewed overnight inventory, just outside of prior-range and -value, suggesting a limited potential for immediate directional opportunity.
In the best case, the S&P 500 trades higher.
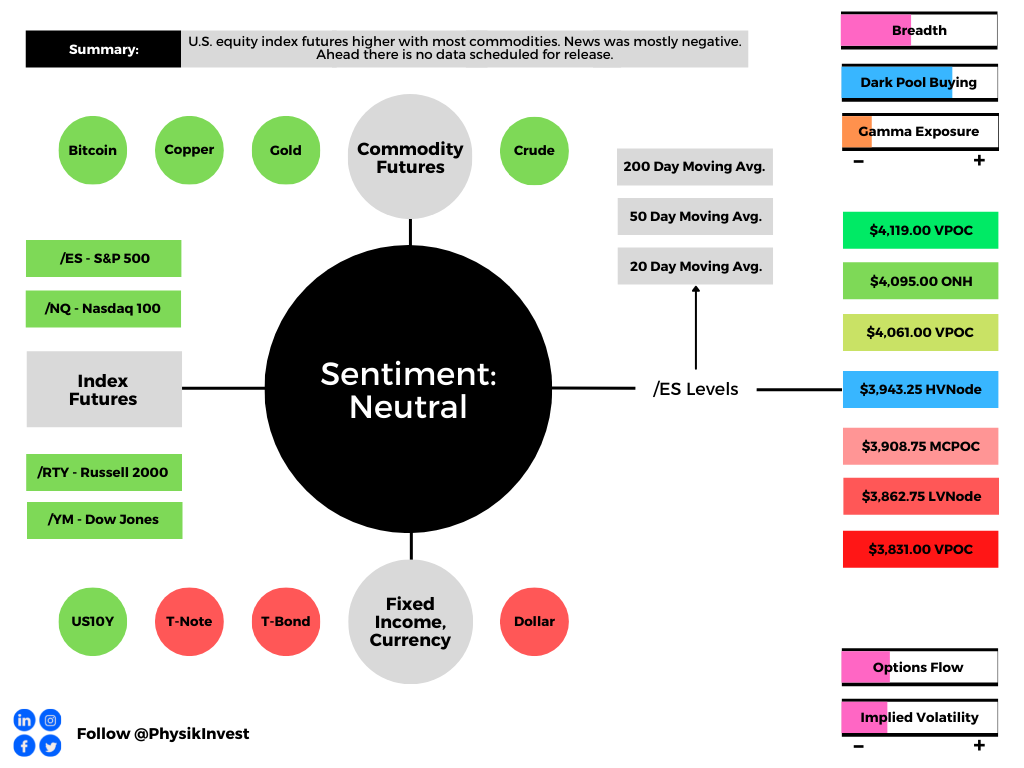
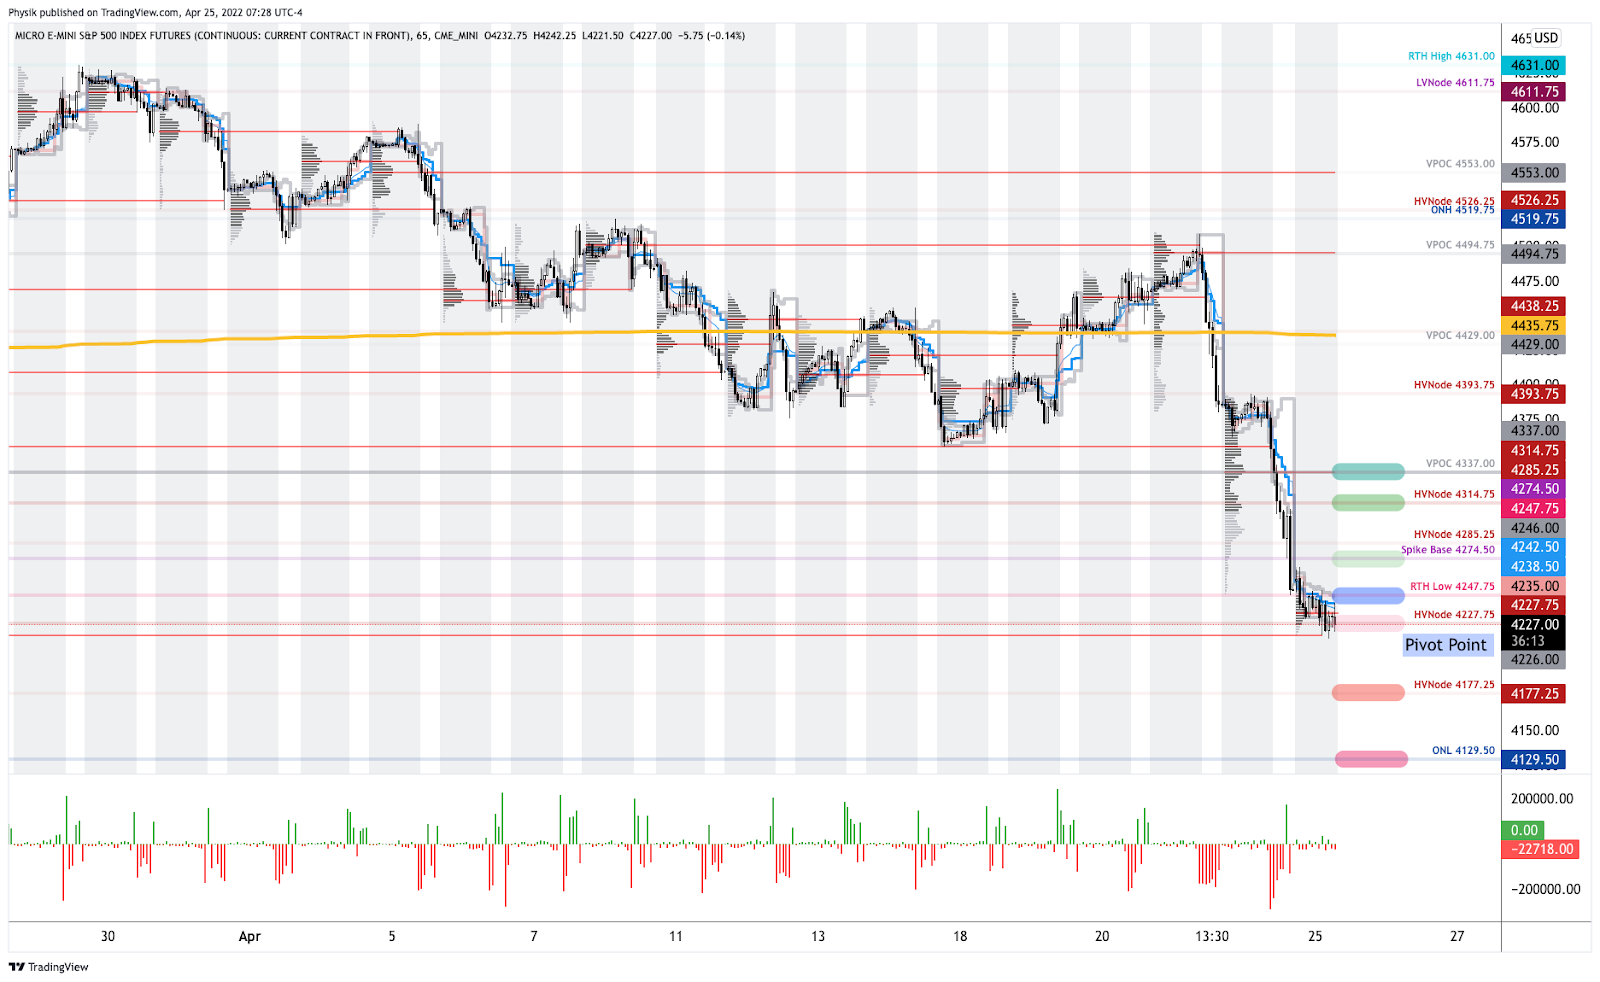
If above the $3,806.25 LVNode, the $3,845.00 VPOC is in play. Initiative trade beyond the latter could reach as high as the $3,874.25 HVNode and $3,909.25 MCPOC, or higher.
In the worst case, the S&P 500 trades lower.
If above the $3,806.25 LVNode, the $3,787.00 VPOC is in play. Initiative trade beyond the latter could reach as low as the $3,727.00 and $3,685.00 VPOC, or lower.
Click here to load today’s key levels into the web-based TradingView charting platform. Note that all levels are derived using the 65-minute timeframe. New links are produced, daily.
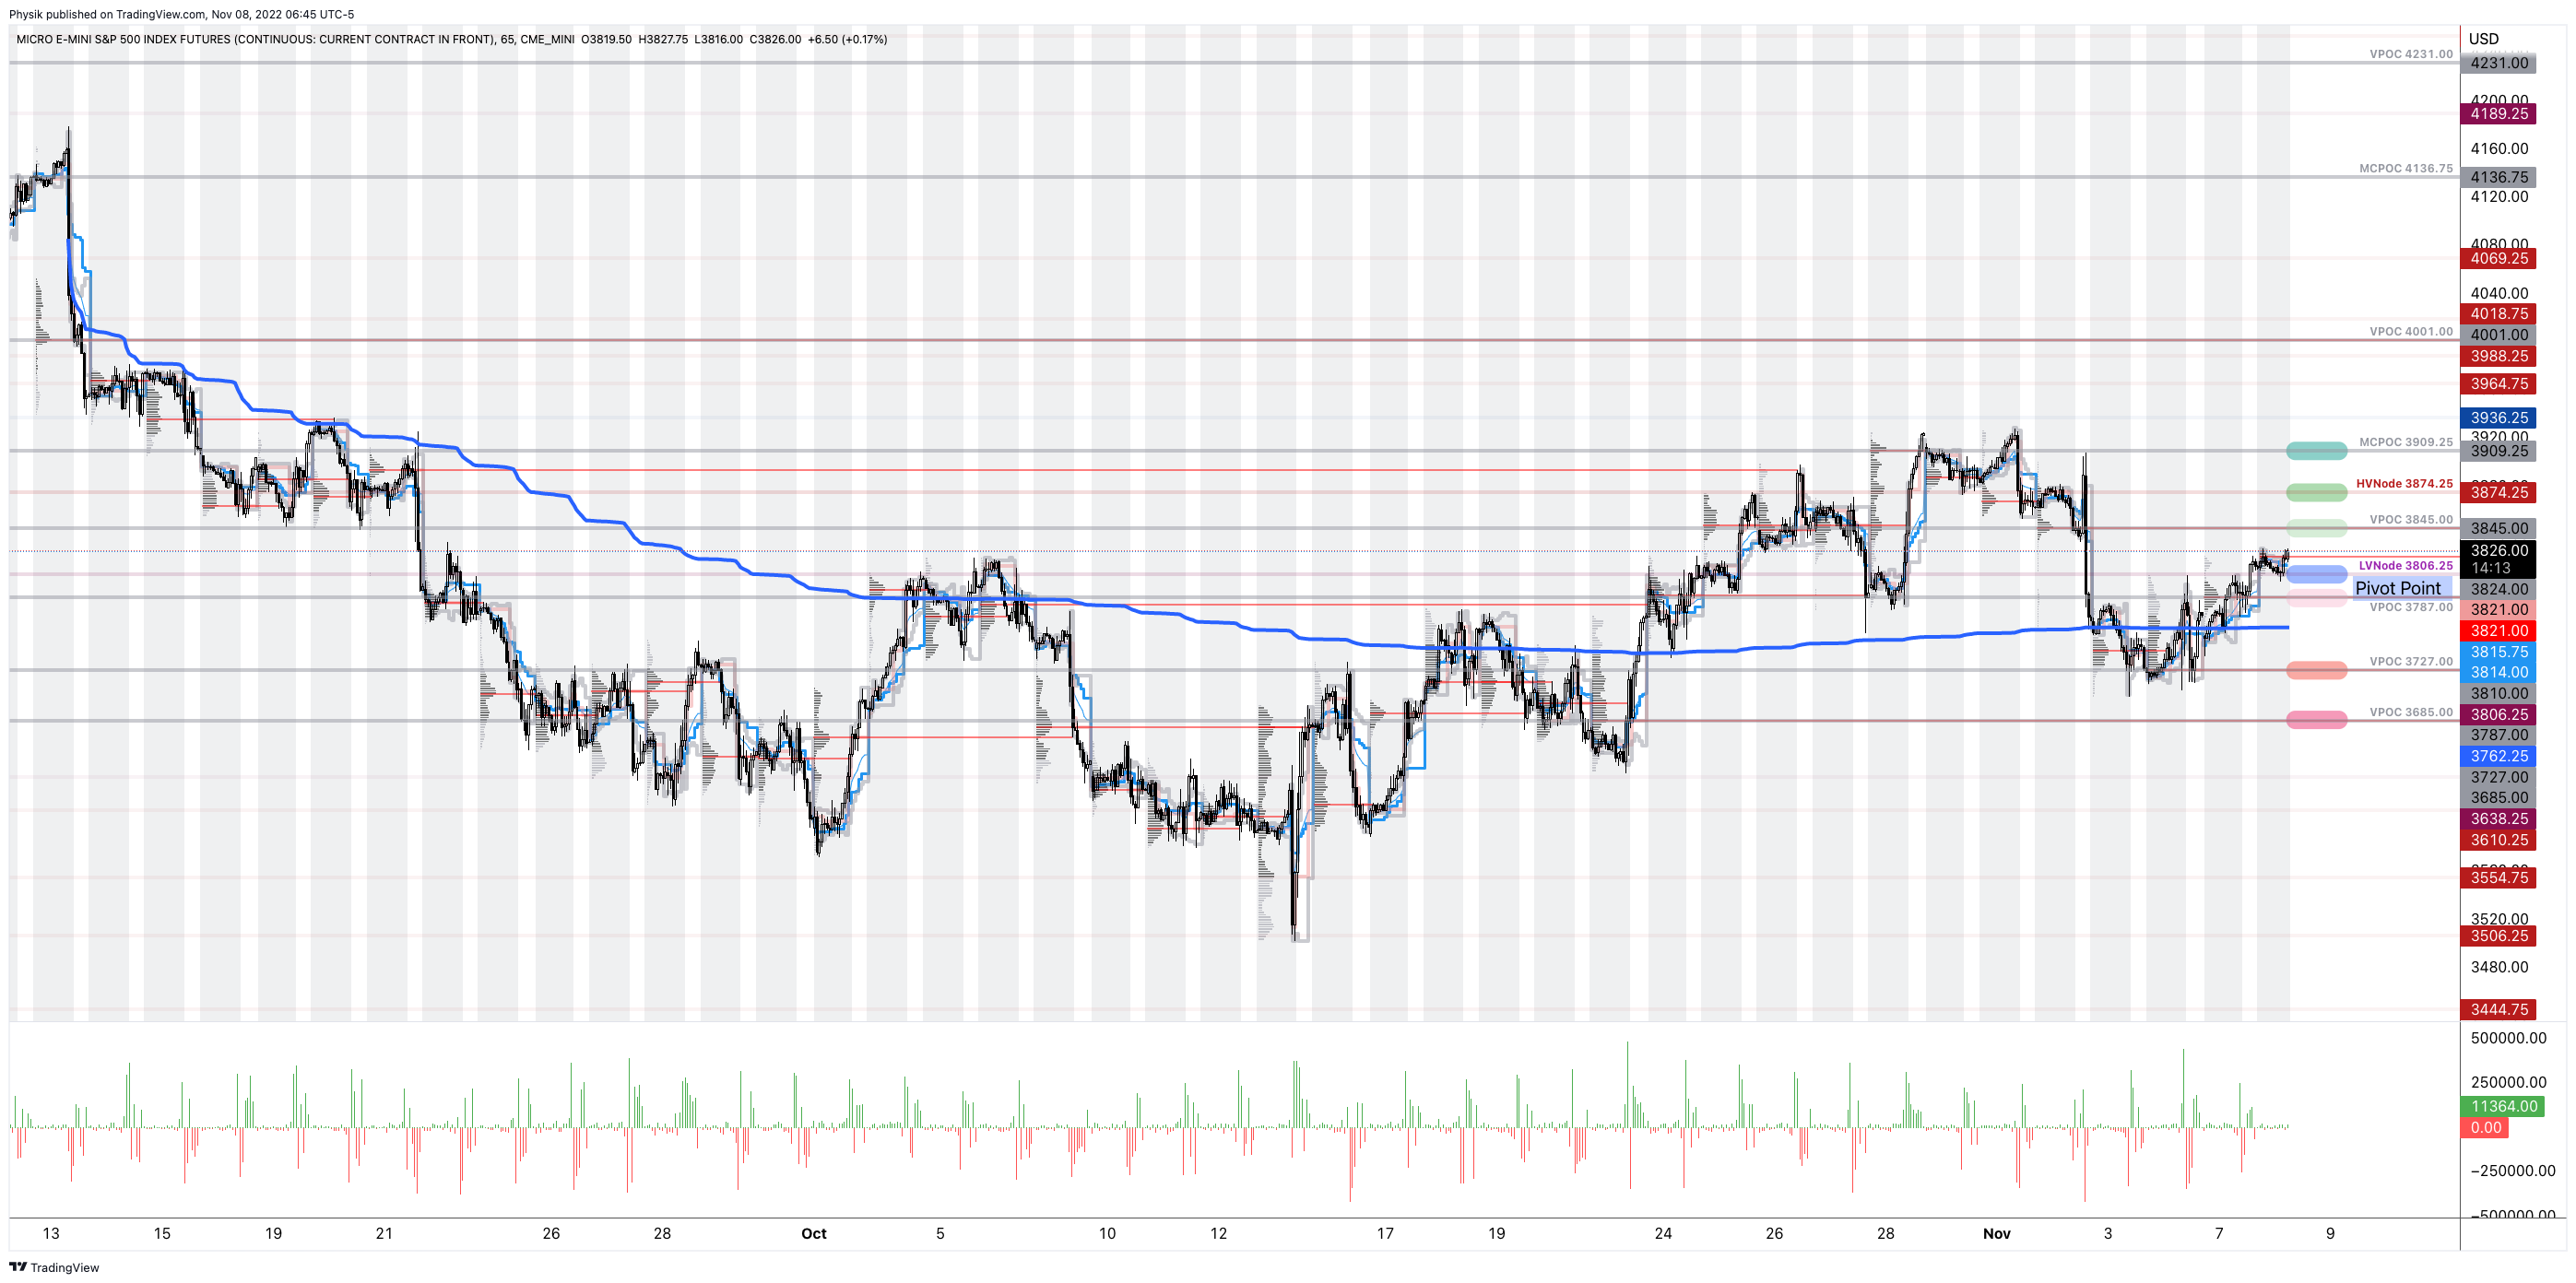
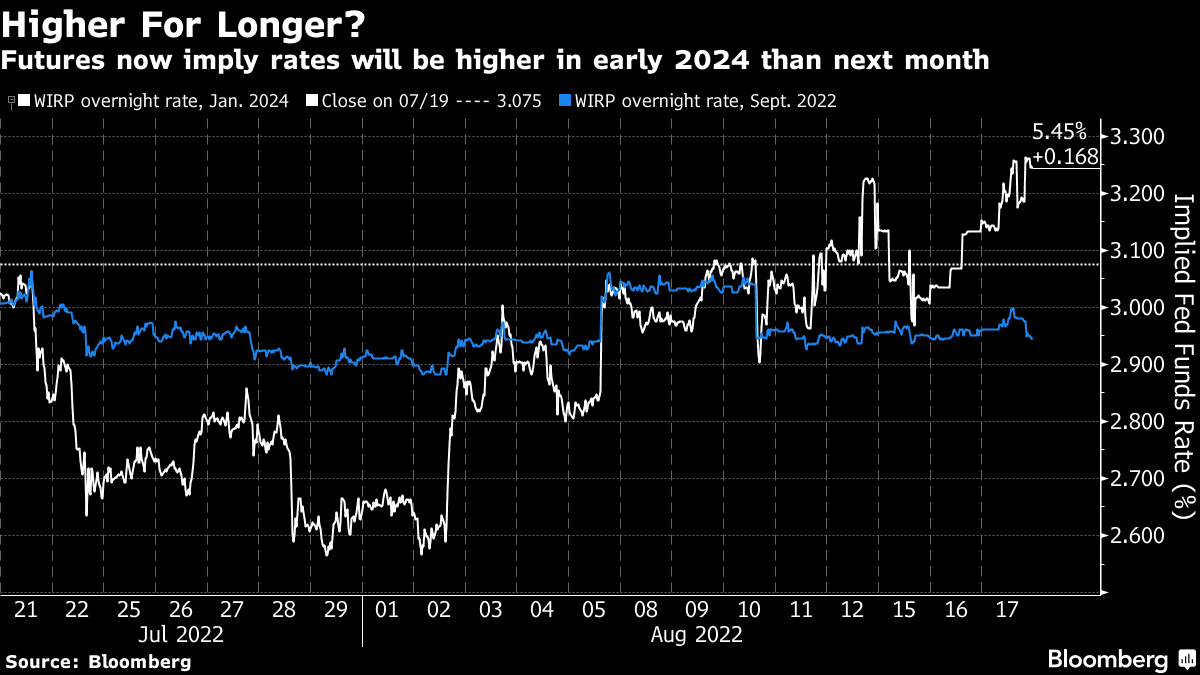
Considerations: Futures tied to the S&P 500 are trading within close proximity to a blue line in the above graphic. This blue line depicts a volume-weighted average price (VWAP) anchored to price action following the release of consumer price data on September 13, 2022.
The VWAP metric is highly regarded by chief investment officers, among other participants, for the quality of trade. Additionally, liquidity algorithms are benchmarked and programmed to buy and sell around VWAPs.
Should the S&P 500 auction away from this level, and come back to it, a prudent response is to fade. If the price is above the VWAP, and it auctions lower, into the VWAP, traders would buy. On the other hand, if the price is below the VWAP, and it auctions higher, into the VWAP, sell.
At this time, the S&P 500 is near VWAP offering traders lower (directional) opportunities.
Definitions
Volume Areas: A structurally sound market will build on areas of high volume (HVNodes). Should the market trend for long periods of time, it will lack sound structure, identified as low volume areas (LVNodes). LVNodes denote directional conviction and ought to offer support on any test.
If participants were to auction and find acceptance into areas of prior low volume (LVNodes), then future discovery ought to be volatile and quick as participants look to HVNodes for favorable entry or exit.
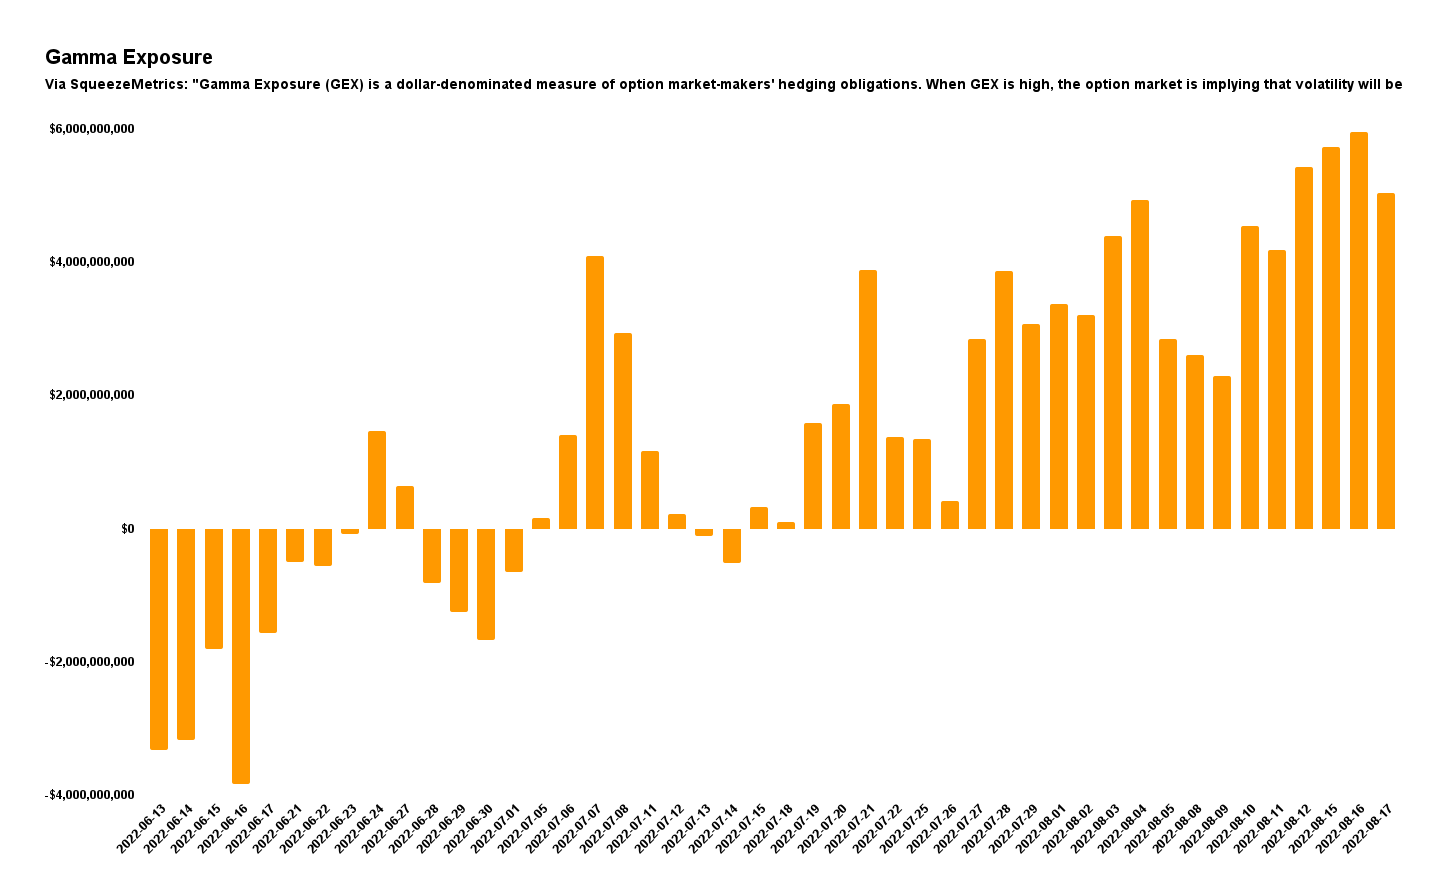
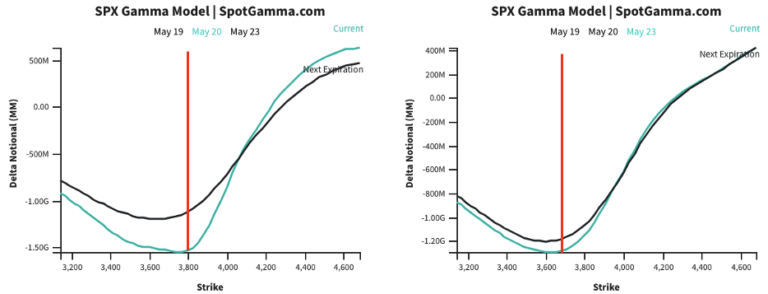
Gamma: Gamma is the sensitivity of an option to changes in the underlying price. Dealers that take the other side of options trades hedge their exposure to risk by buying and selling the underlying. When dealers are short-gamma, they hedge by buying into strength and selling into weakness. When dealers are long-gamma, they hedge by selling into strength and buying into weakness. The former exacerbates volatility. The latter calms volatility.
Vanna: The rate at which the delta of an option changes with respect to volatility.
Charm: The rate at which the delta of an option changes with respect to time.
POCs: POCs are valuable as they denote areas where two-sided trade was most prevalent in a prior day session. Participants will respond to future tests of value as they offer favorable entry and exit.
MCPOCs: POCs are valuable as they denote areas where two-sided trade was most prevalent over numerous day sessions. Participants will respond to future tests of value as they offer favorable entry and exit.
About
After years of self-education, strategy development, mentorship, and trial-and-error, Renato Leonard Capelj began trading full-time and founded Physik Invest to detail his methods, research, and performance in the markets.
Capelj also develops insights around impactful options market dynamics at SpotGamma and is a Benzinga reporter.
Some of his works include conversations with ARK Invest’s Catherine Wood, investors Kevin O’Leary and John Chambers, FTX’s Sam Bankman-Fried, ex-Bridgewater Associate Andy Constan, Kai Volatility’s Cem Karsan, The Ambrus Group’s Kris Sidial, among many others.
Disclaimer
In no way should the materials herein be construed as advice. Derivatives carry a substantial risk of loss. All content is for informational purposes only.