
The daily brief is a free glimpse into the prevailing fundamental and technical drivers of U.S. equity market products. Join the 300+ that read this report daily, below!
What Happened
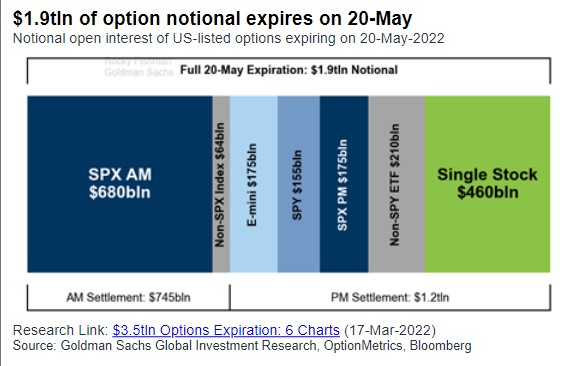
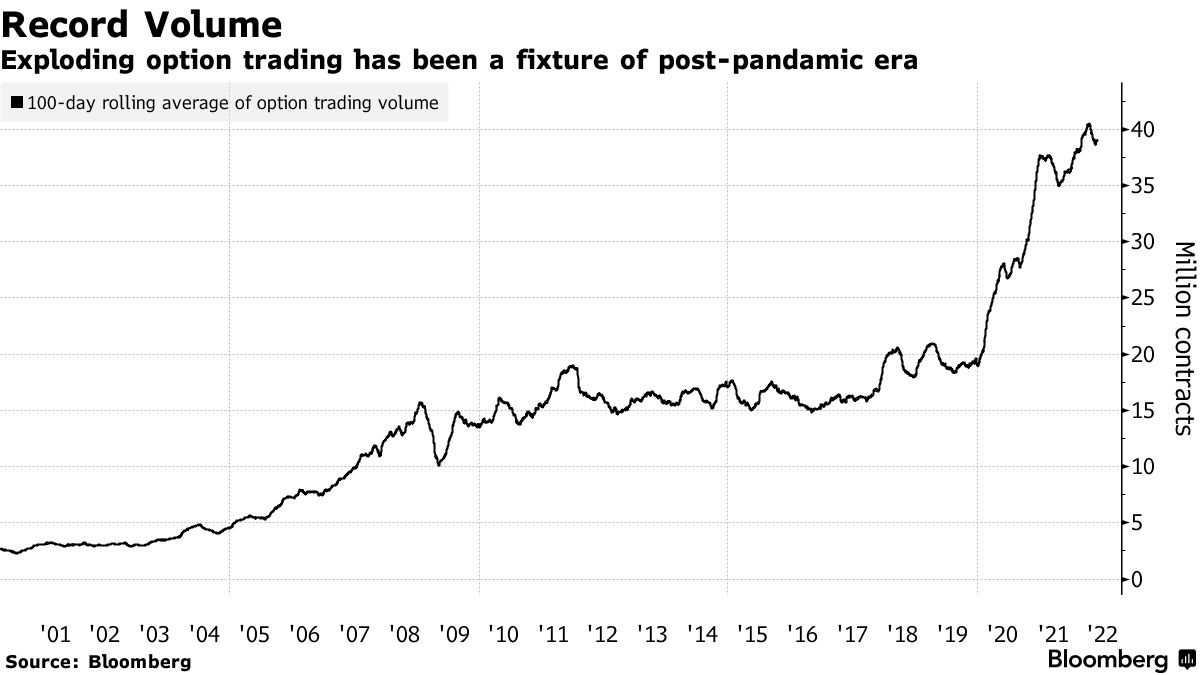
Ahead of a $1.9 trillion options expiration, which we unpack later in the letter, the equity index and commodity futures, as well as yields, were bid.
This activity was on the heels of good news coming from overseas. China lowered prime rates on the five-year by a record to boost mortgages and loans amid an ongoing pandemic slump.
In other news, China warned the U.S. over a ‘dangerous situation’ forming over Taiwan, and the U.S. is set to block Russian debt payments, raising concerns of default.
This is as Russian forces, per Michael Horowitz of Le Beck Int’l, broke “Ukrainian defenses west of Popasna in the Donbass, … a tactical success for Russia, the first in a very long time.”
Ahead, there is no data scheduled for release. Enjoy your Friday!
What To Expect
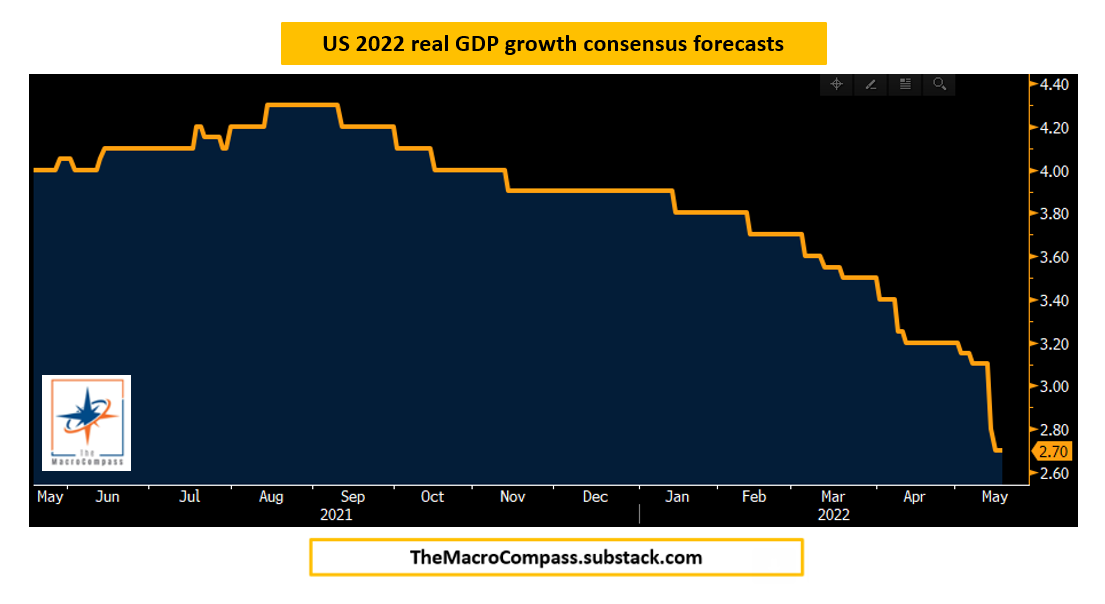
Fundamental: Fundamentally, the narrative remains the same, albeit there has been a rise in concern over global growth given persistent supply chokepoints and a commitment to reducing liquidity and credit.
Moody’s Corporation’s (NYSE: MCO) Mark Zandi explains “the odds that the economy will suffer a downturn beginning in the next 12 months at one in three with uncomfortable near-even odds of a recession in the next 24 months.”
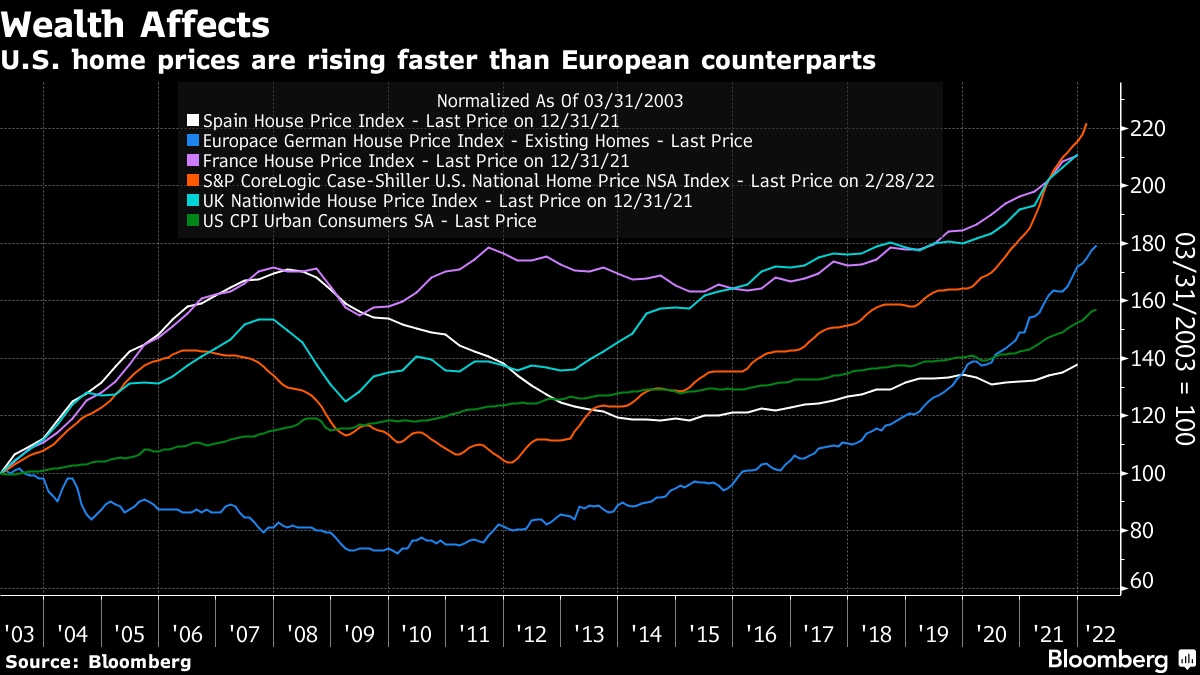
Per Bloomberg’s John Authers, U.S. housing is slowing down in the context of still-heightened sales. Data on home building suggests builders “aren’t running scared” while chokepoints still are feeding into support for house prices.
“Now, with inflation rising, the Fed is more concerned about wealth effects,” Authers explained.
“The rise in asset prices has made a lot of people wealthier and encouraged them to spend accordingly. It’s also stoked inequality. A fall in home values would be helpful at this point,” and it’s something the Fed is keen on “pursuing,” as talked about in letters earlier this week.
Positioning: Friday marks the roll off of $460 billion of derivatives across single stocks and $855 billion of S&P 500-linked contracts, according to a Bloomberg report quoting Goldman Sachs Group Inc (NYSE: GS) research.
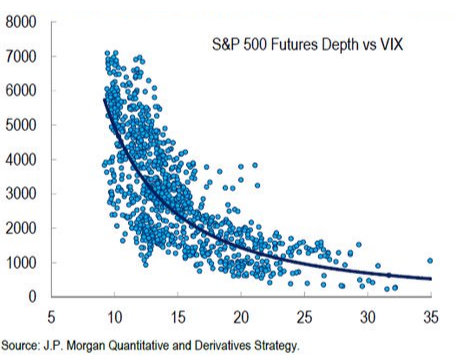
Into this event, participants are hedged and volatility remains well-supplied, due in part to suppressive volatility selling, as well as passive flows supporting the largest index constituents.
Consequently, the market’s descent has been orderly and not exacerbated by the demand for hedges and associated repricings of volatility.
This was expected, per Kai Volatility Cem Karsan’s commentary published in December 2021.
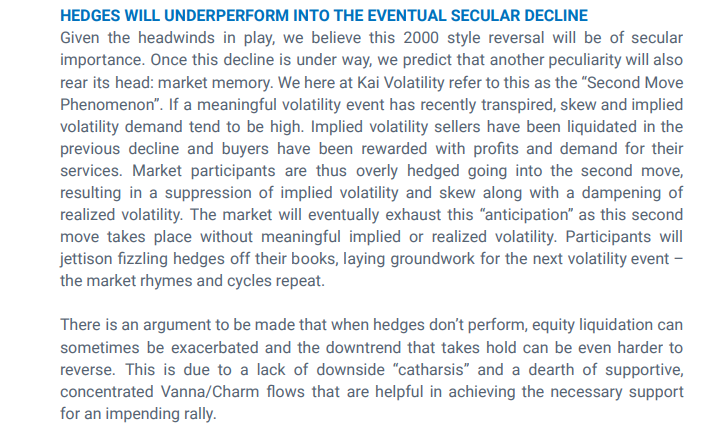
“If a meaningful volatility event has recently transpired [e.g., COVID-19], implied volatility demand tends to be high,” as sellers of it were liquidated in previous declines and “buyers have been rewarded with profits and demand for their services.”
“Market participants are thus overly hedged going into the second move, resulting in the suppression of implied volatility and skew along with a dampening of realized volatility.”
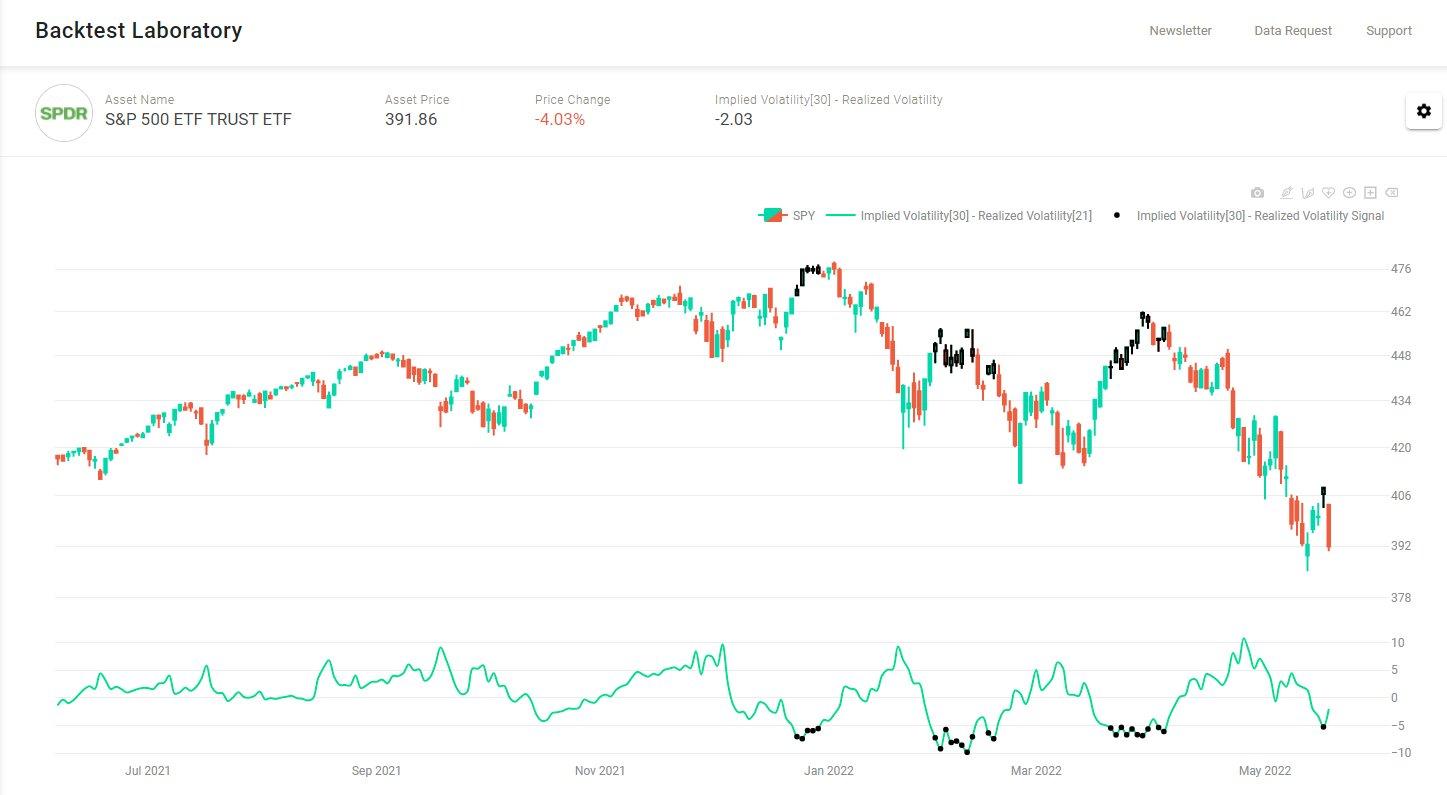
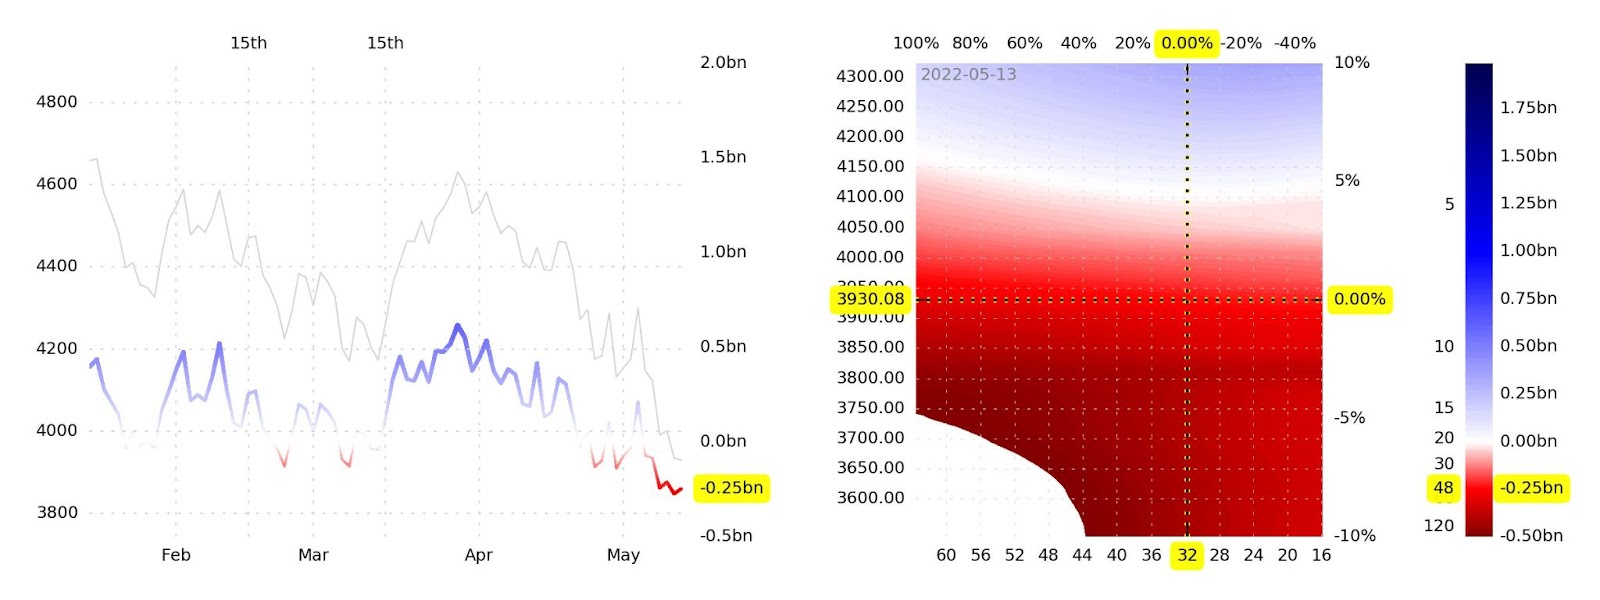
Given the aforementioned supply and demand dynamic, as well as illiquidity, we continue to observe a “divergence in the volatility (movement of underlying equity market up and down) realized, versus that which is implied by options activity,” SpotGamma says.
“For some of these reasons – tempered measures of implied volatility – the market’s missing a lot of the ‘stored energy’ or ‘vanna fuel’ that’s helped support it in past periods of turmoil.”
So, barring changes in fundamentals, the catalysts to a potential rally are few and far between, and we elaborated on this in an earlier commentary.
Heading into Friday, Bloomberg quotes the $4,000.00 S&P 500 (INDEX: SPX) strike having “93,000 open positions set to run out, … includ[ing] 41,024 calls and 52,269 puts.”
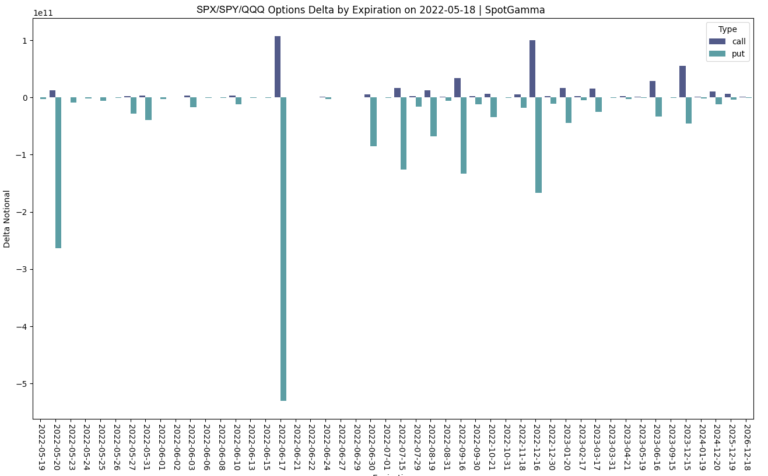
An open well below $4,000.00 means that this expiration will coincide with the removal of a lot of in-the-money put-delta. That means, post-expiration, per SpotGamma, “market makers will be free to buy back stocks to cover the short exposures that are no longer needed.”
“Any ultimate rally off of Opex, we’d consider to be short covering, and subject to swift reversals into the end of next week.”
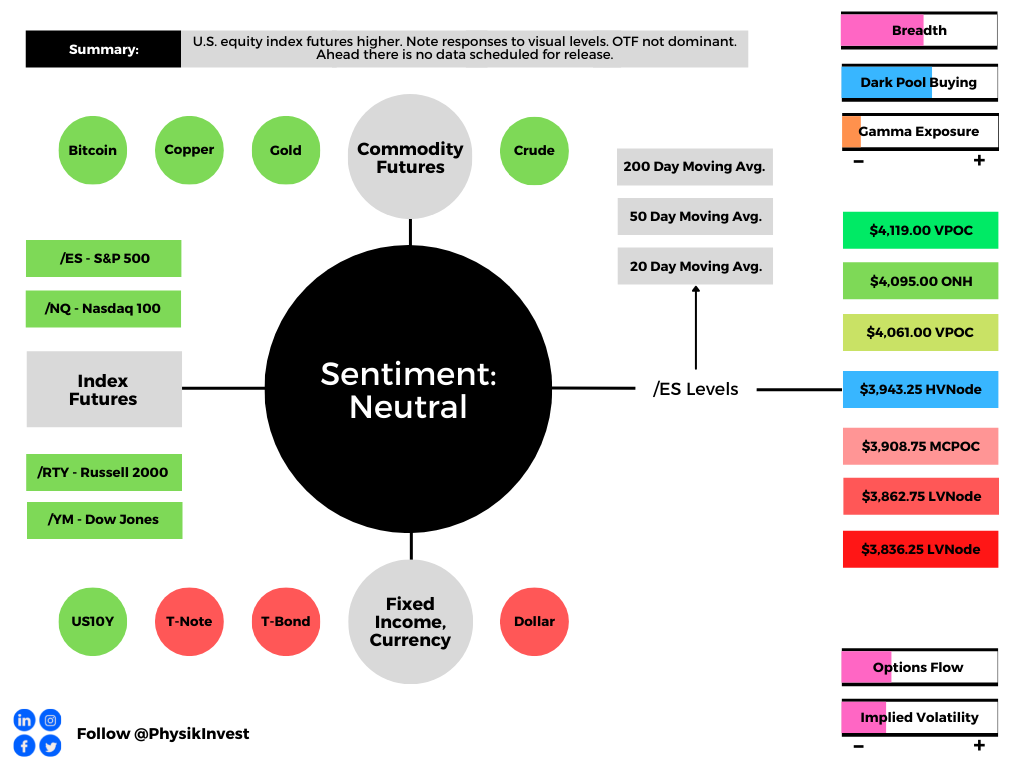
Technical: As of 6:30 AM ET, Friday’s regular session (9:30 AM – 4:00 PM ET), in the S&P 500, will likely open in the upper part of a positively skewed overnight inventory, just inside of prior-range and -value, suggesting a limited potential for immediate directional opportunity.
In the best case, the S&P 500 trades higher; activity above the $3,943.25 high volume area (HVNode) puts in play the $4,061.00 untested point of control (VPOC). Initiative trade beyond the VPOC could reach as high as the $4,095.00 overnight high (ONH) and $4,119.00 VPOC, or higher.
In the worst case, the S&P 500 trades lower; activity below the $3,943.25 HVNode puts in play the $3,908.75 micro composite point of control (MCPOC). Initiative trade beyond the MCPOC could reach as low as the $3,862.75 and $3,836.25 low volume areas (LVNodes), or lower.
Click here to load today’s key levels into the web-based TradingView charting platform. Note that all levels are derived using the 65-minute timeframe. New links are produced, daily.

Considerations: Push-and-pull, as well as responsiveness near key-technical areas (discernable visually on a chart), suggests technically-driven traders with shorter time horizons are (becoming) active.
Such traders often lack the wherewithal to defend retests.
Large participants (who often move by committee) seldom respond to key technical inflections. It is their activity that often results in poor reliability of our technical levels.
Sometimes, the better trade is to wait for the larger participants’ entry and use the expansion of the range as a confirmation of a new trend.
Definitions
Overnight Rally Highs (Lows): Typically, there is a low historical probability associated with overnight rally-highs (lows) ending the upside (downside) discovery process.
Volume Areas: A structurally sound market will build on areas of high volume (HVNodes). Should the market trend for long periods of time, it will lack sound structure, identified as low volume areas (LVNodes). LVNodes denote directional conviction and ought to offer support on any test.
If participants were to auction and find acceptance into areas of prior low volume (LVNodes), then future discovery ought to be volatile and quick as participants look to HVNodes for favorable entry or exit.
POCs: POCs are valuable as they denote areas where two-sided trade was most prevalent in a prior day session. Participants will respond to future tests of value as they offer favorable entry and exit.
MCPOCs: POCs are valuable as they denote areas where two-sided trade was most prevalent over numerous day sessions. Participants will respond to future tests of value as they offer favorable entry and exit.
About
After years of self-education, strategy development, mentorship, and trial-and-error, Renato Leonard Capelj began trading full-time and founded Physik Invest to detail his methods, research, and performance in the markets.
Capelj also develops insights around impactful options market dynamics at SpotGamma and is a Benzinga reporter.
Some of his works include conversations with ARK Invest’s Catherine Wood, investors Kevin O’Leary and John Chambers, FTX’s Sam Bankman-Fried, Kai Volatility’s Cem Karsan, The Ambrus Group’s Kris Sidial, among many others.
Disclaimer
In no way should the materials herein be construed as advice. Derivatives carry a substantial risk of loss. All content is for informational purposes only.


2 replies on “Daily Brief For May 20, 2022”
[…] weaknesses, from a positioning perspective, via Benzinga. Check out, if interested. Alternatively, read Friday’s in-depth letter, […]
[…] equity index futures softened after what appeared to be continued covering of shorts into Monday’s close. Commodities were mixed, bonds higher, and implied volatility […]