Physik Invest’s Daily Brief is read free by thousands of subscribers. Join this community to learn about the fundamental and technical drivers of markets.
Fundamental
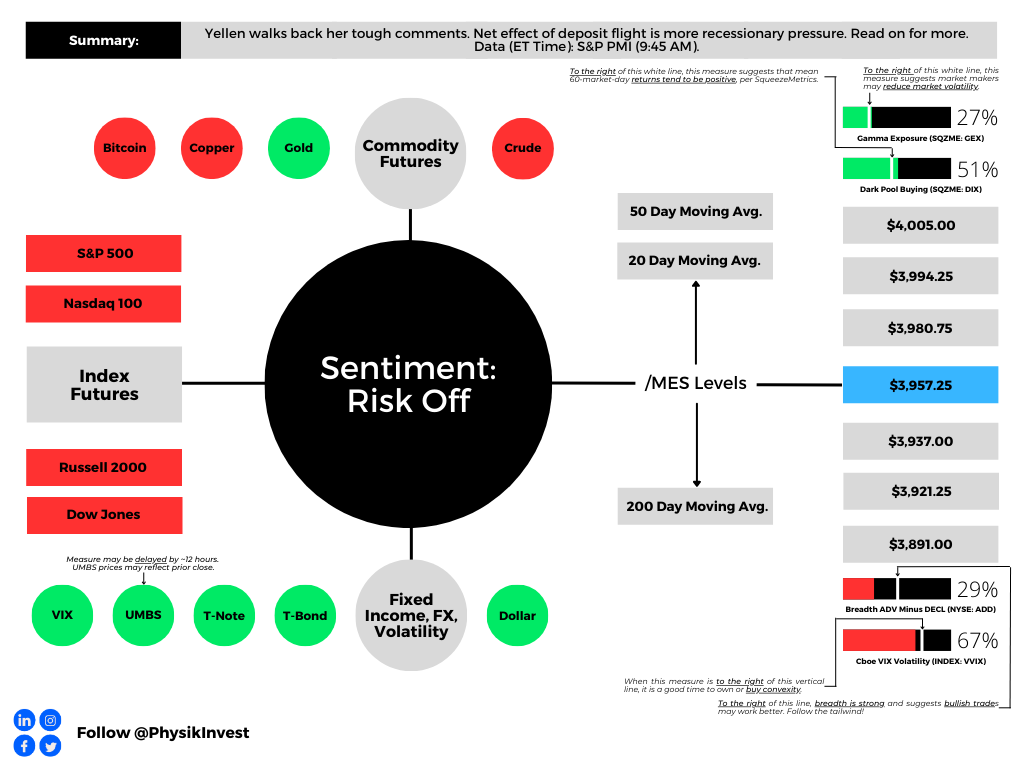
Our Daily Brief for 3/23 discussed reactions to the Federal Reserve’s (Fed) interest rate decision being countered by Treasury secretary Janet Yellen’s deposit guarantee comments. Accordingly, doom and gloom are in full bloom prompting Yellen to walk back her toughness and tell lawmakers that regulators would protect the banking system if warranted. However, this did little to assuage markets, hence the neutral-to-risk-off sentiment this morning.
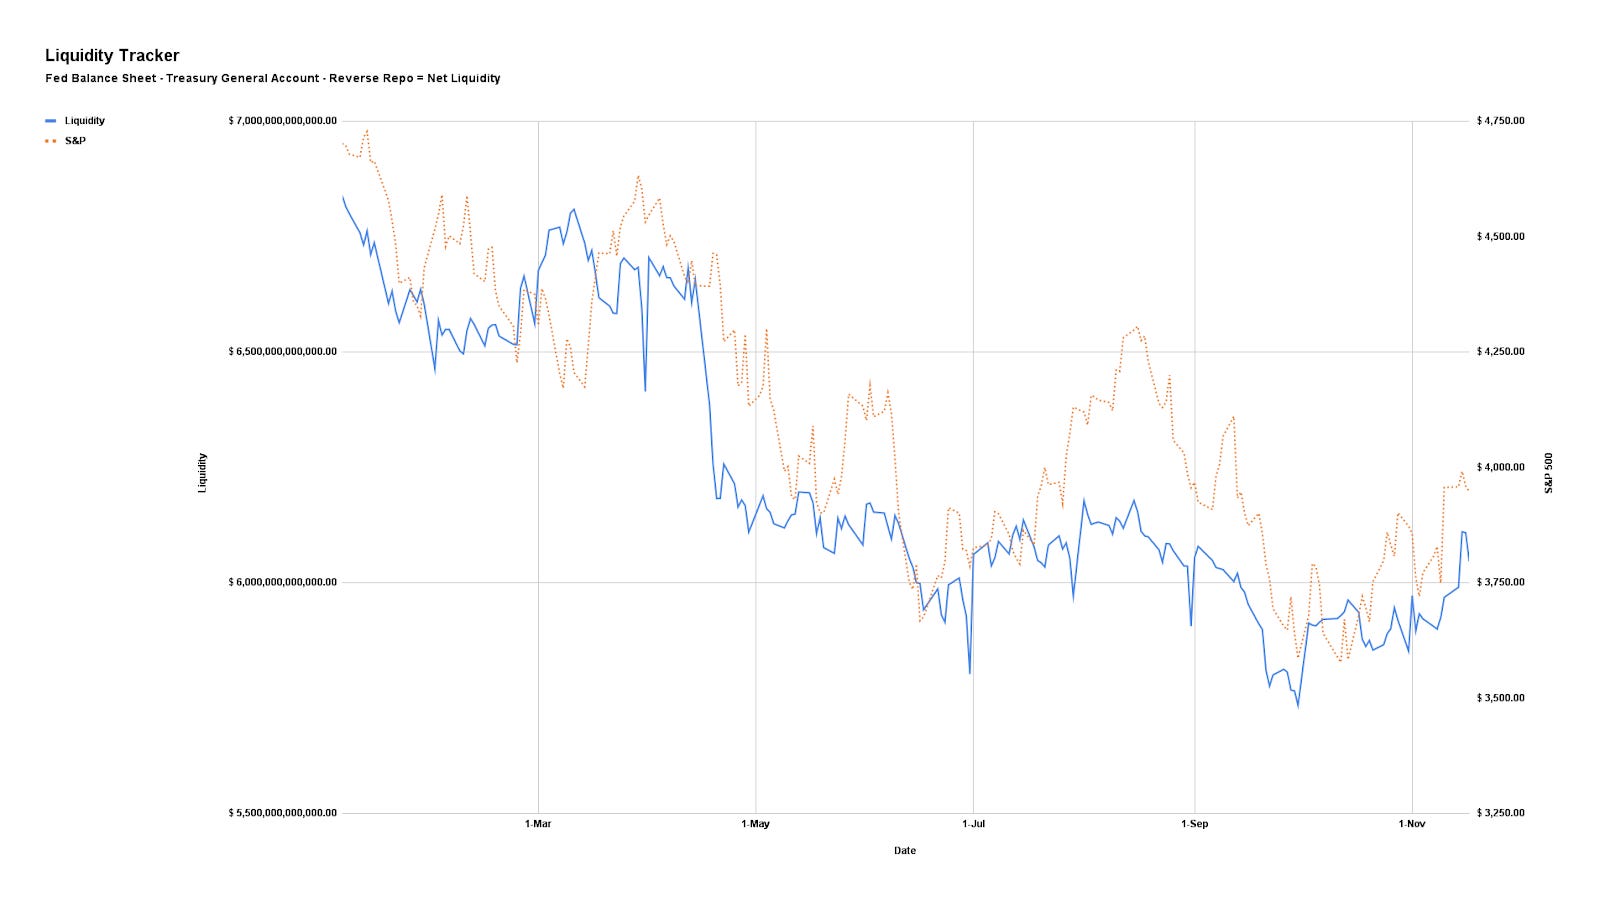
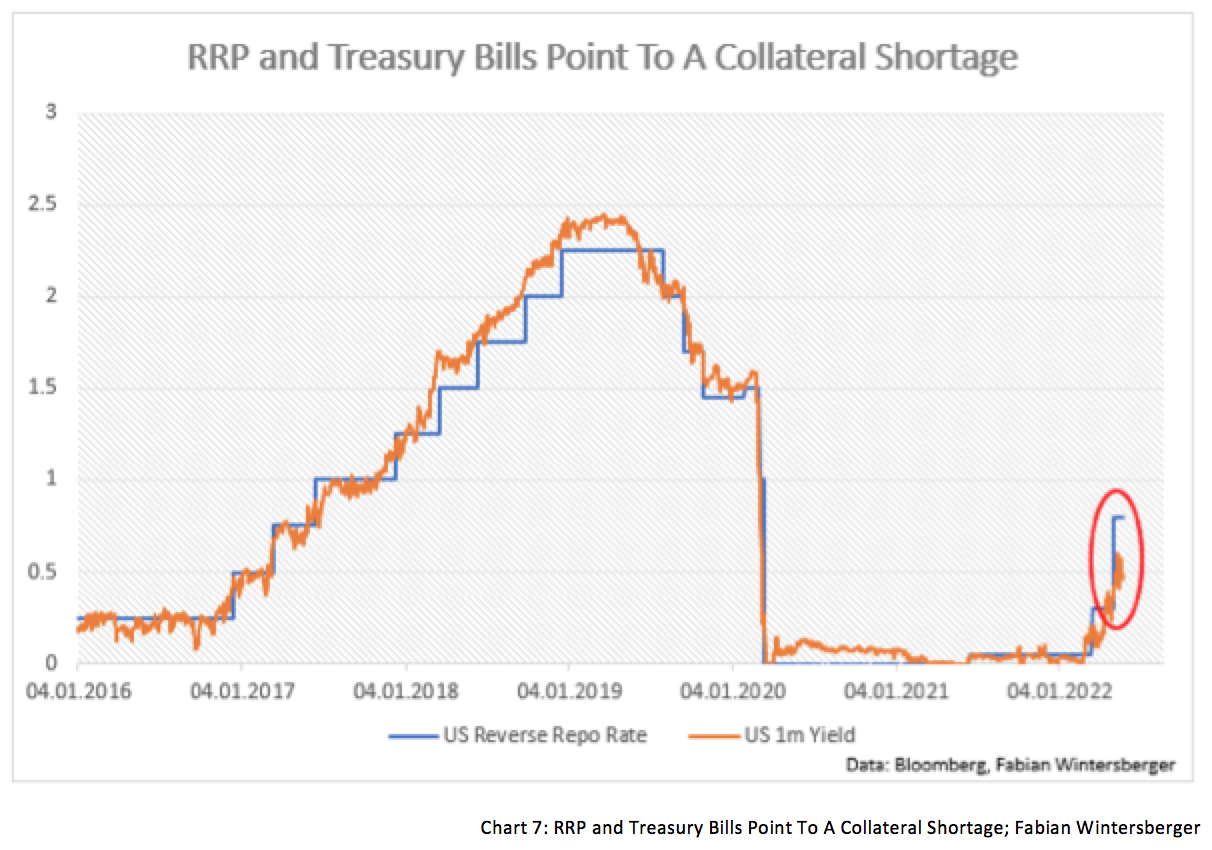
Based on the Fed’s Overnight Reverse Repo (RRP) and Bank Term Funding Program (BTFP), as well as money-market flows, strategists believe the deposit flight has not stabilized. To explain, policymakers intervened on the heels of the banking crisis in a way that’s not to be confused with quantitative easing or QE (i.e., flow of capital into markets). The Fed’s balance sheet swelled (from the discount window, the new bank funding facilities, and spillover from the FDIC insurance backstop). The balance sheet has continued to swell while money market funds and the RRP facility see big inflows.
Strategists like Andreas Steno Larsen allege that the maturity of 3-month T-bills and deposit flights partly drives this swell.

Rather than being used to boost liquidity (i.e., “lend or to finance trading activities,” as discussed in previous letters, including 9/20), reserves are being sterilized. “The Fed’s actions to stem the banking crisis are beginning to accelerate the effects of [quantitative tightening or] QT, causing money velocity to drop and intensifying the tightening of financial conditions,” Bloomberg’s Simon White reports. “In the coming weeks and months, we are likely to see reserves leaving the high-velocity world of smaller banks, where they were being lent out more, to the effectively zero-velocity black-hole of” money-market funds and RRP.

JPMorgan Chase & Co (NYSE: JPM) validates this view. They think the Fed’s rate hikes and QT have coincided with funds going to money-market funds and larger banks. They add that the banking crisis has accelerated this movement.
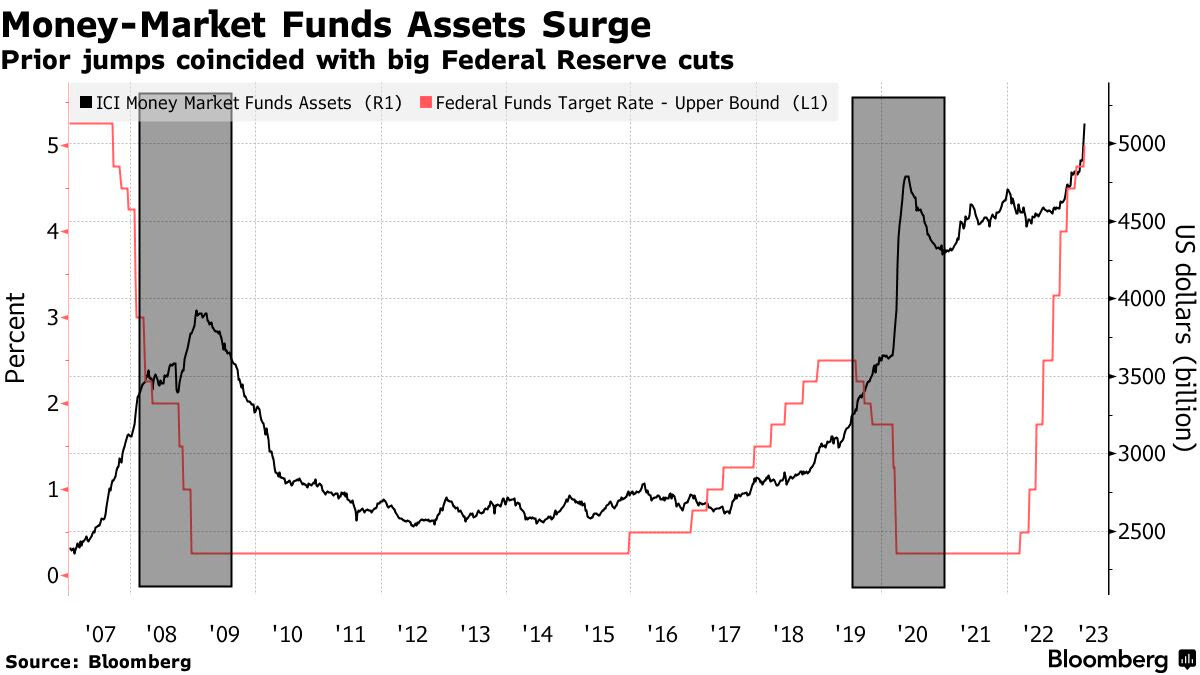
“Deposit movements could cause banks to be cautious on lending, with mid- and small-size banks playing a large role in US lending,” thus exacerbating recessionary pressures, they note. Bank of America Corporation (NYSE: BAC) strategists add that investors should sell equities after the last rate hike to sidestep “the biggest declines.”
Positioning
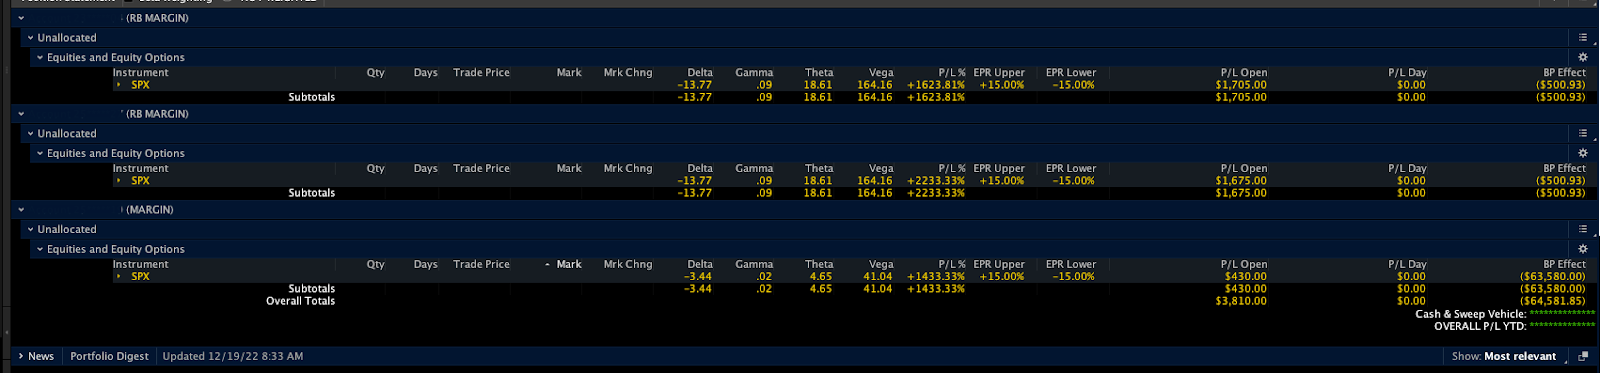
Brief positioning update.
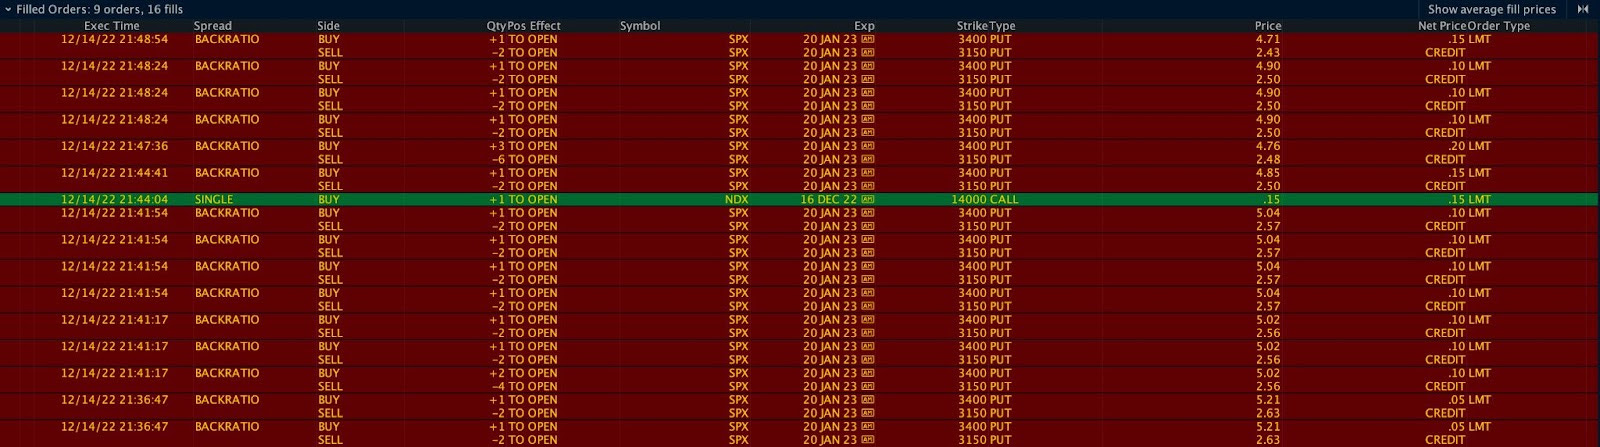
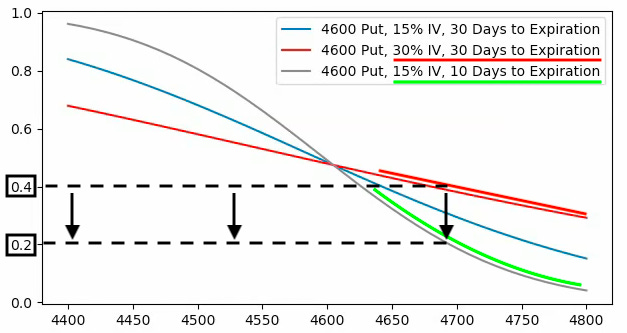
As proposed in previous letters, low- or zero-cost call options structures have worked and may continue to work.
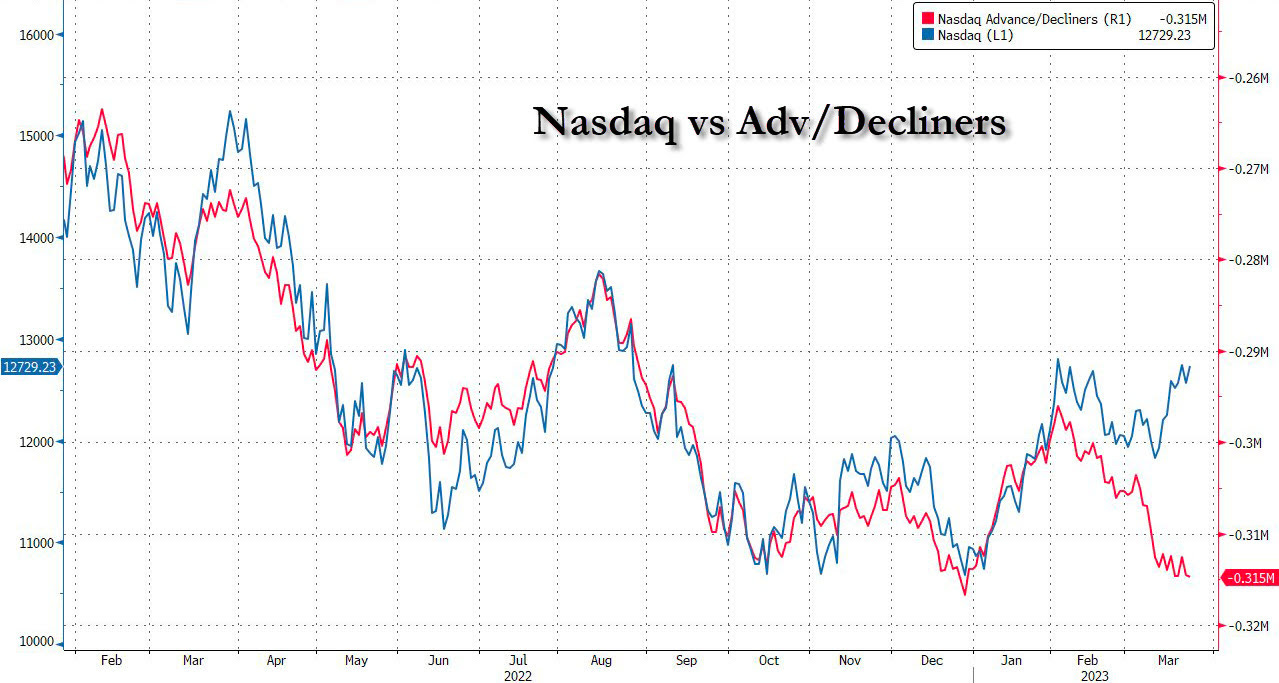
Notwithstanding, look for opportunities to play the downside as markets trade higher into a “more combustible” position. Attractive bear put spread trades are showing in the previously depressed Nasdaq 100, where boosts have, in part, been the result of “volatility compression and options decay.” If you’re participating in the Nasdaq, at least you have breadth on your side.
Technical
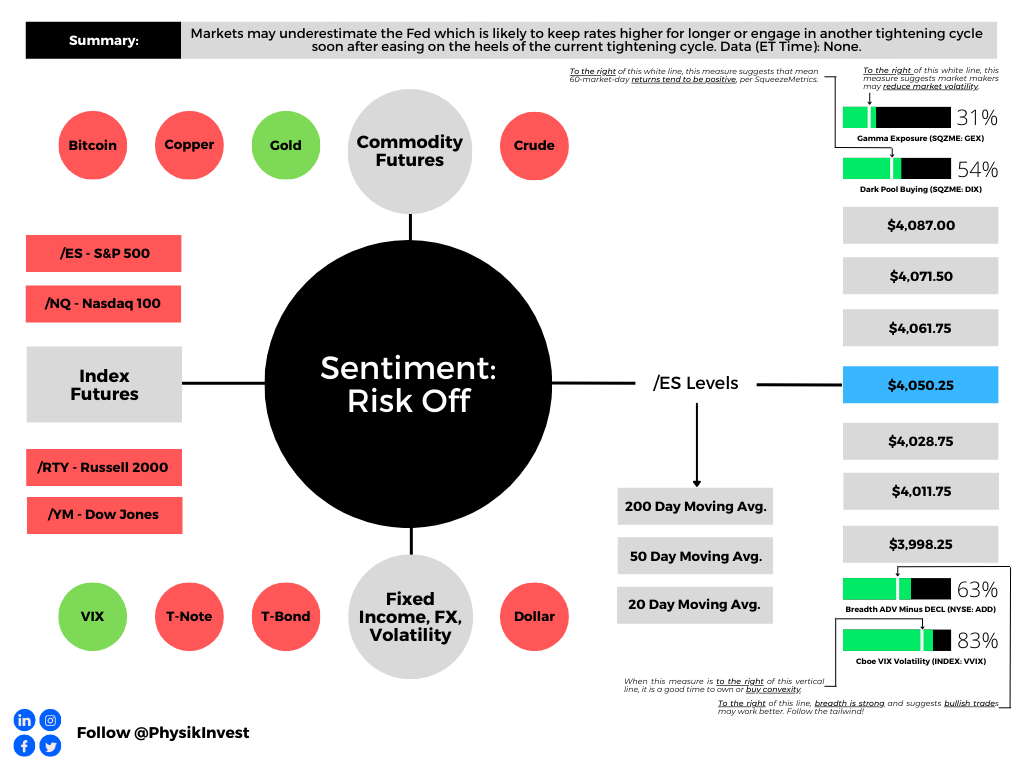
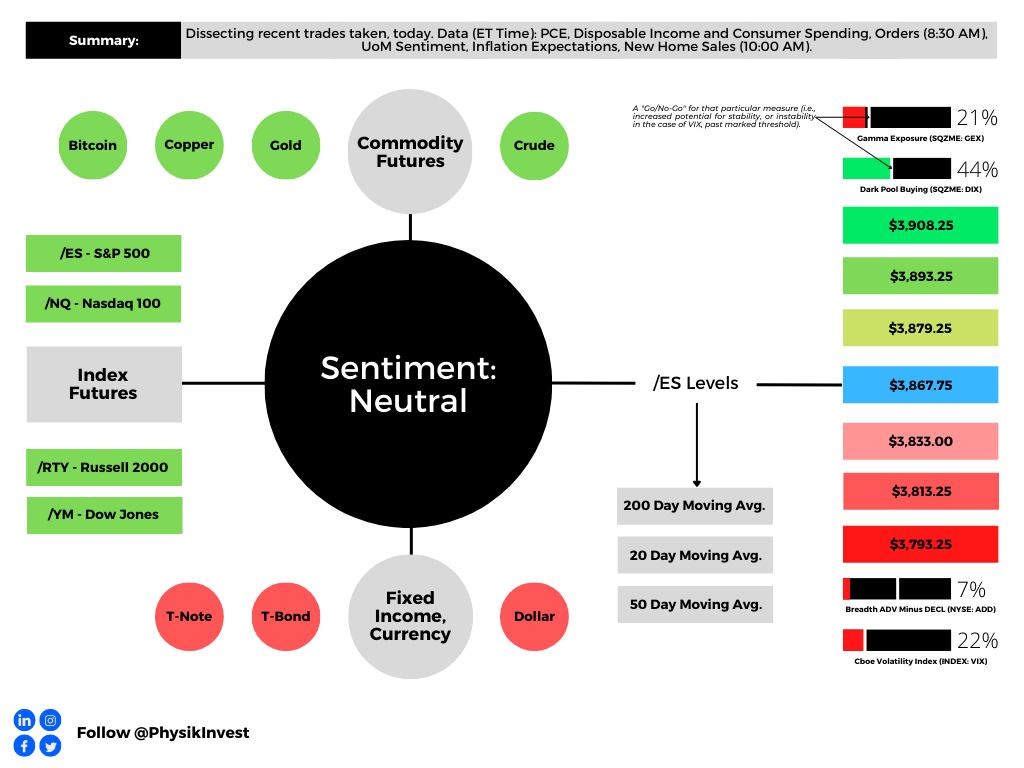
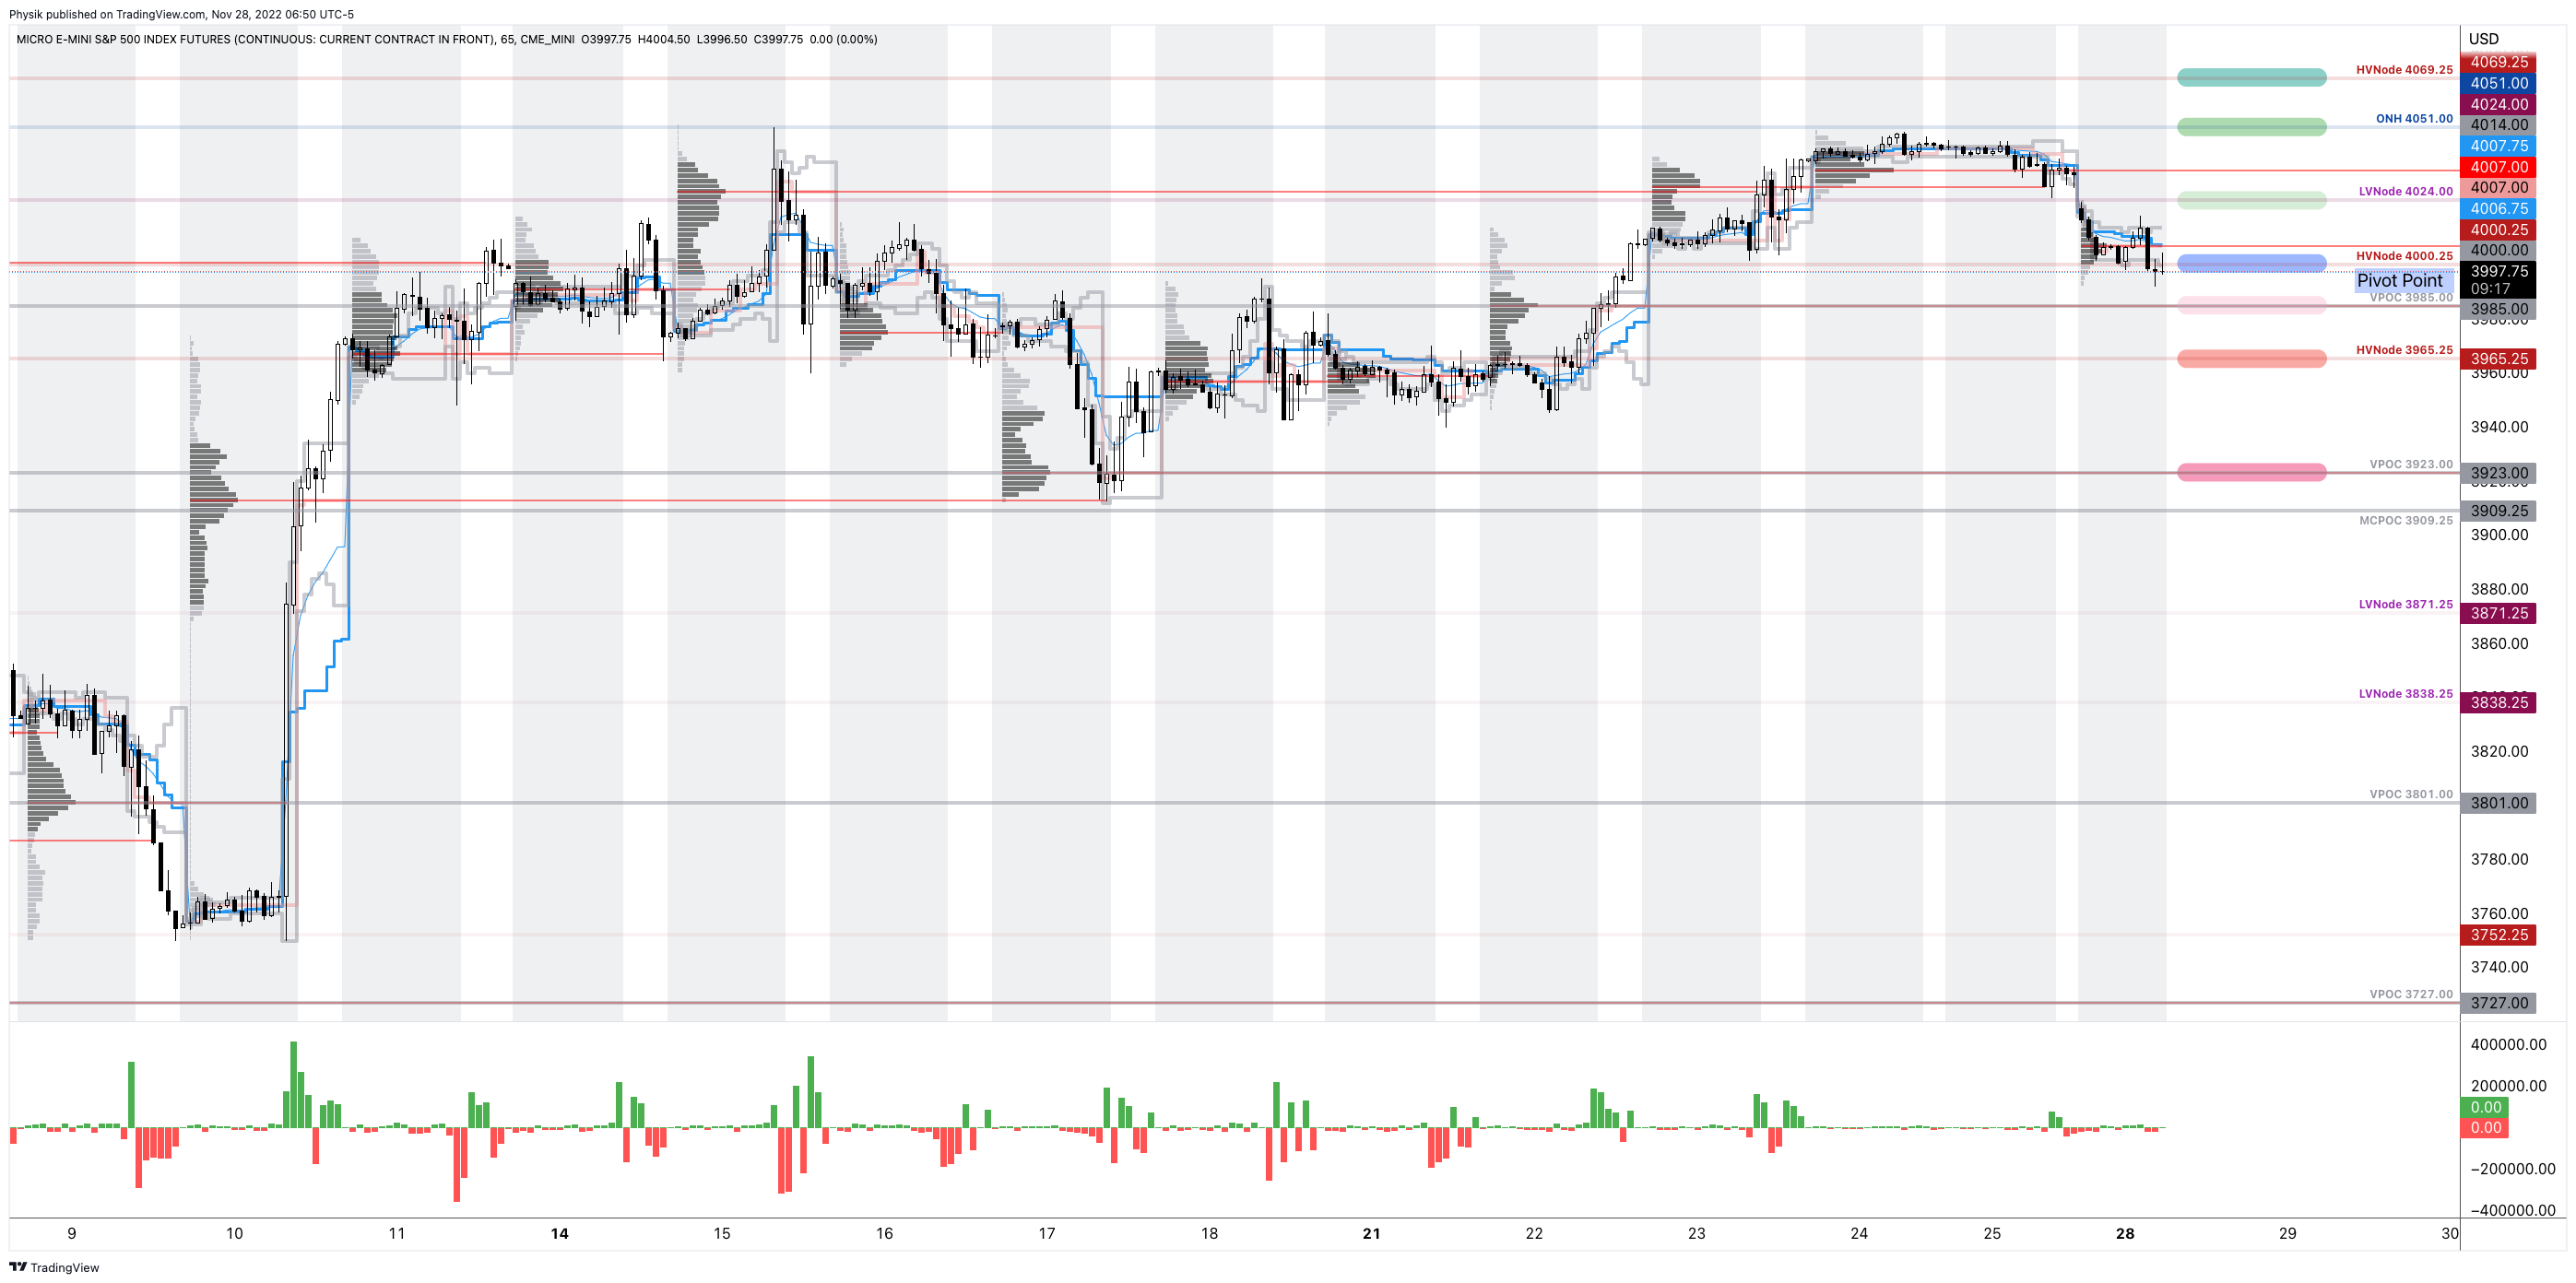
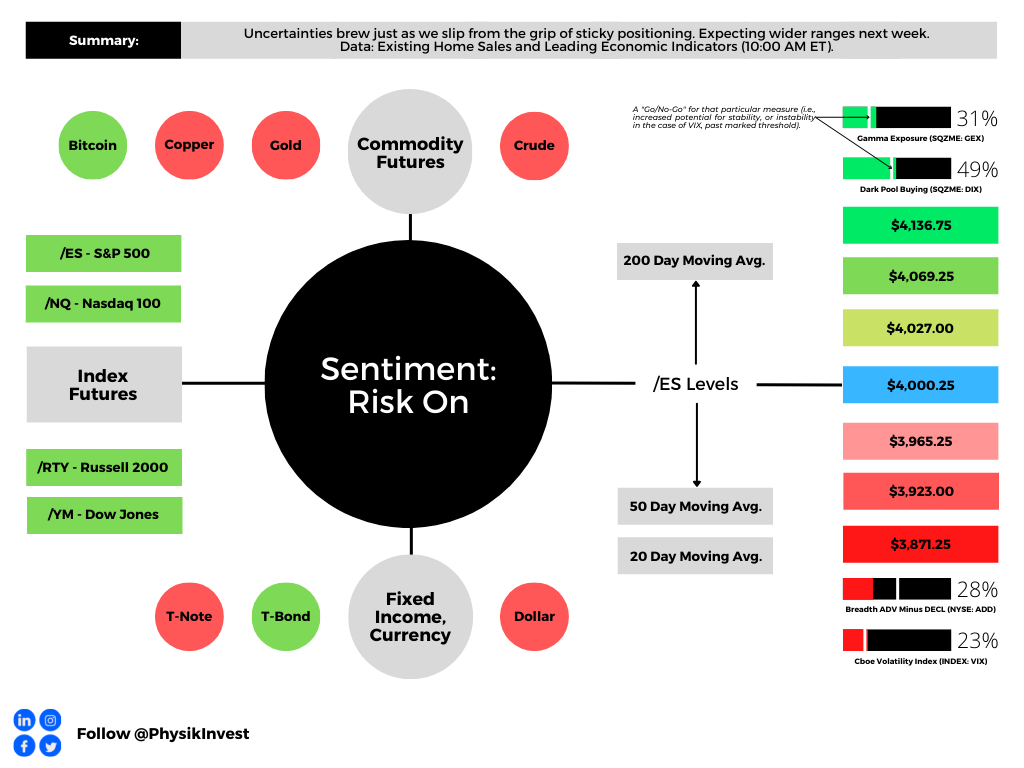
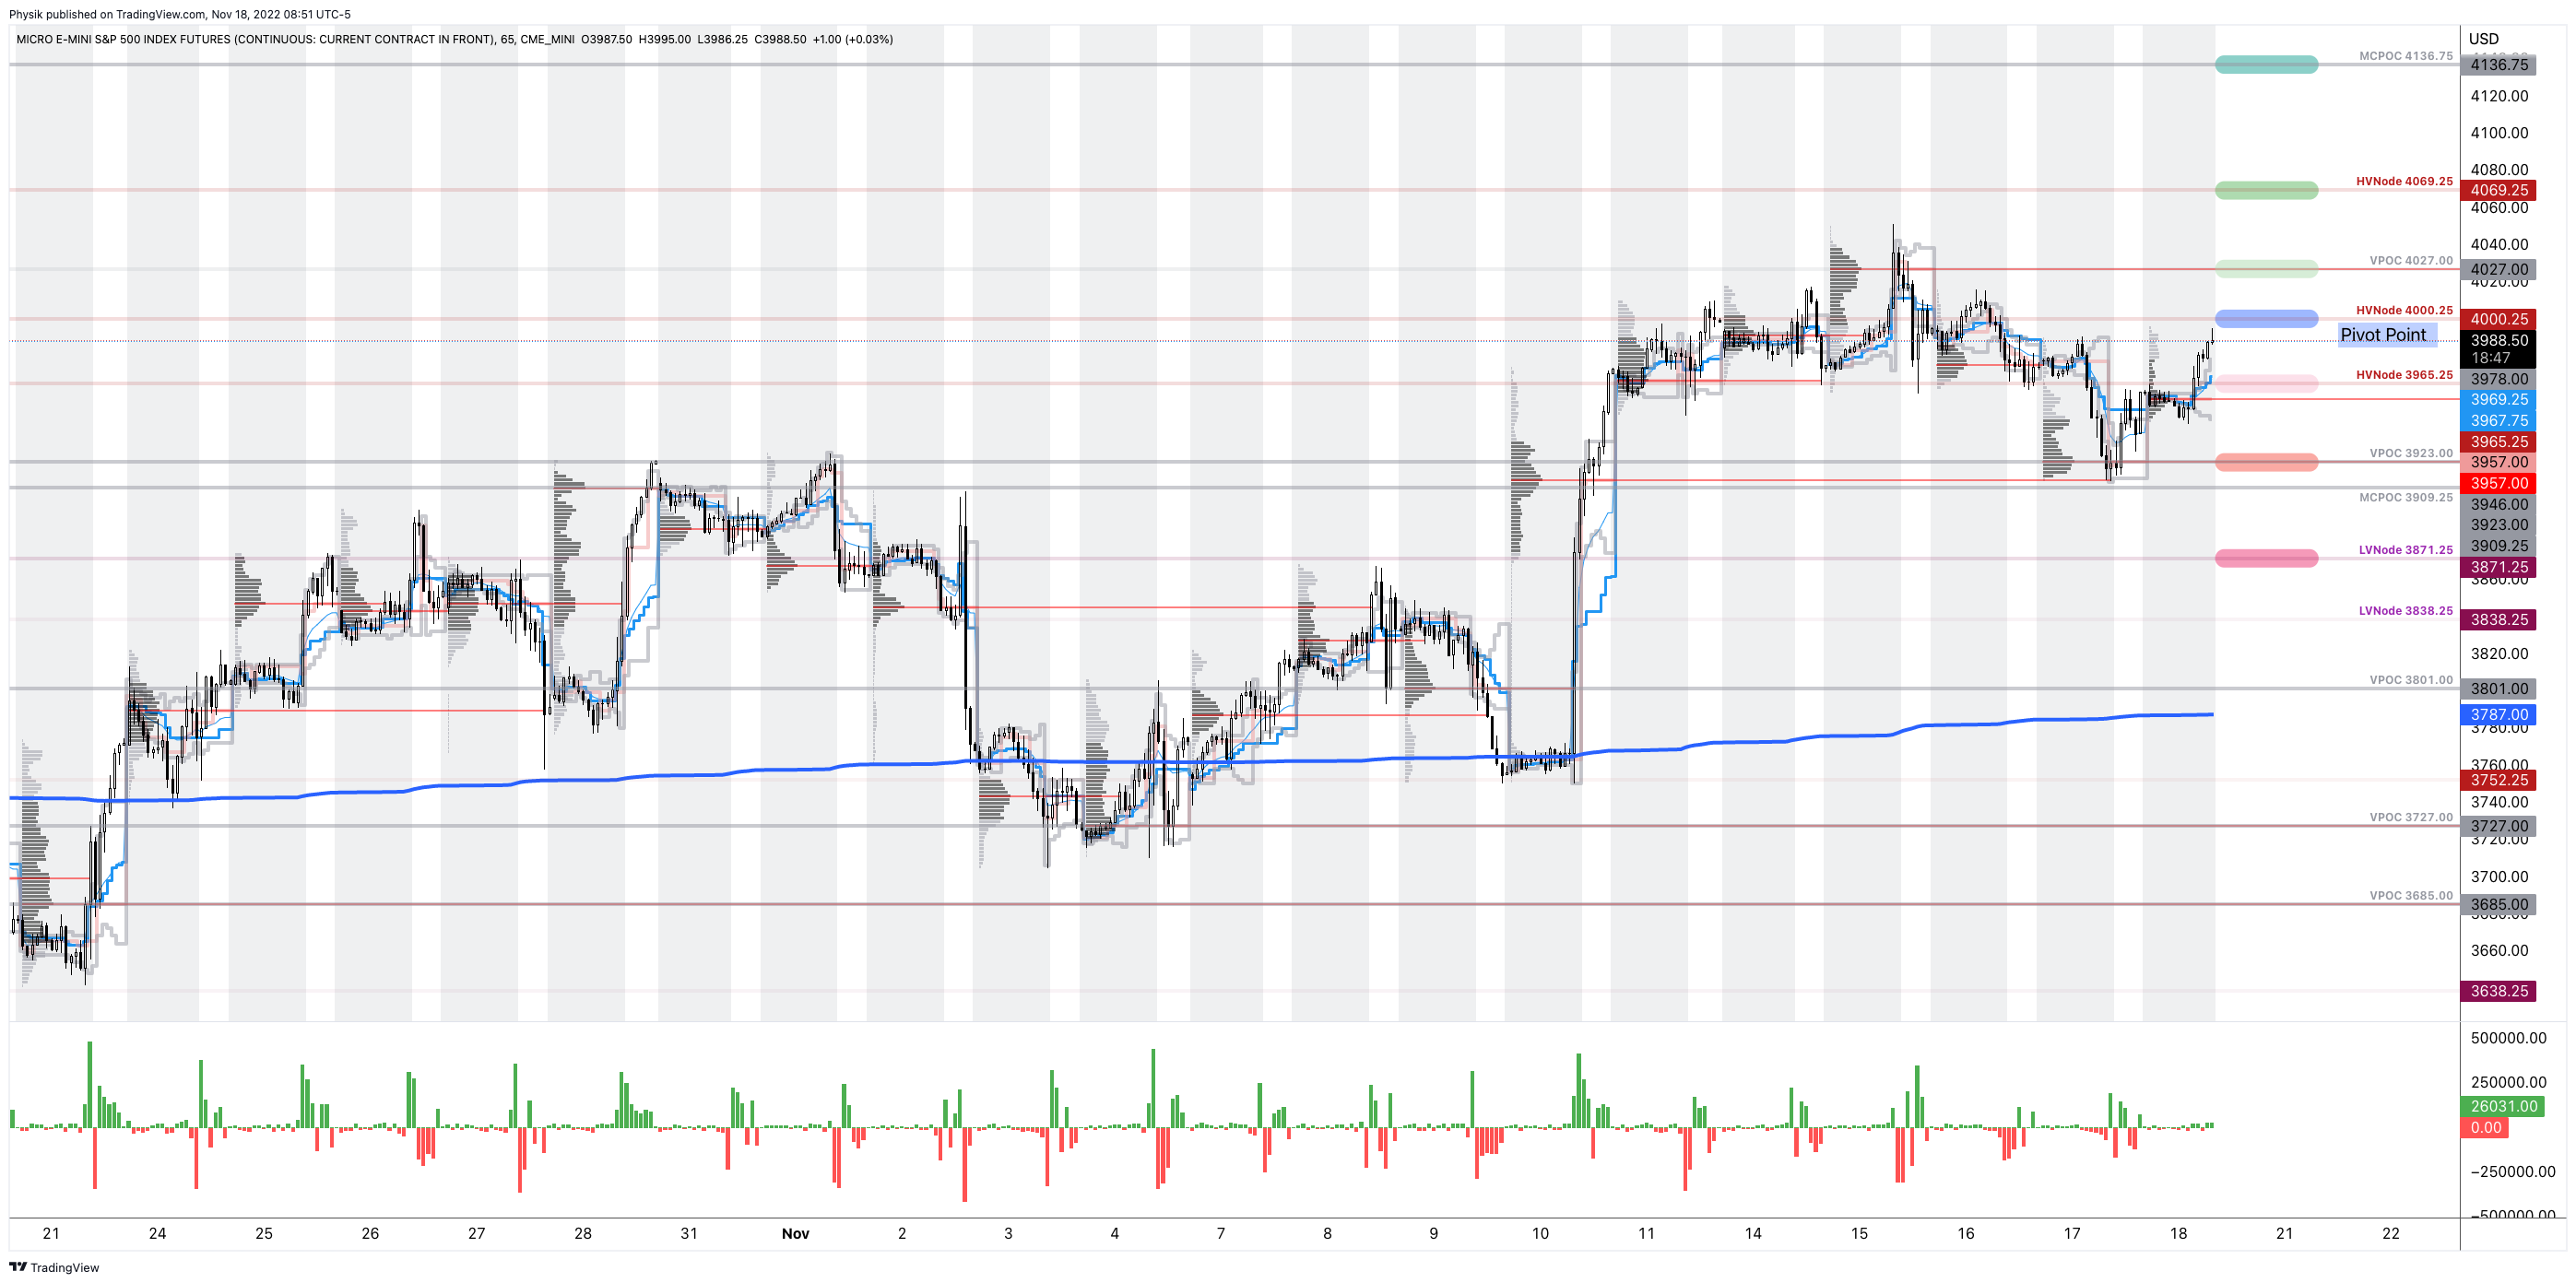
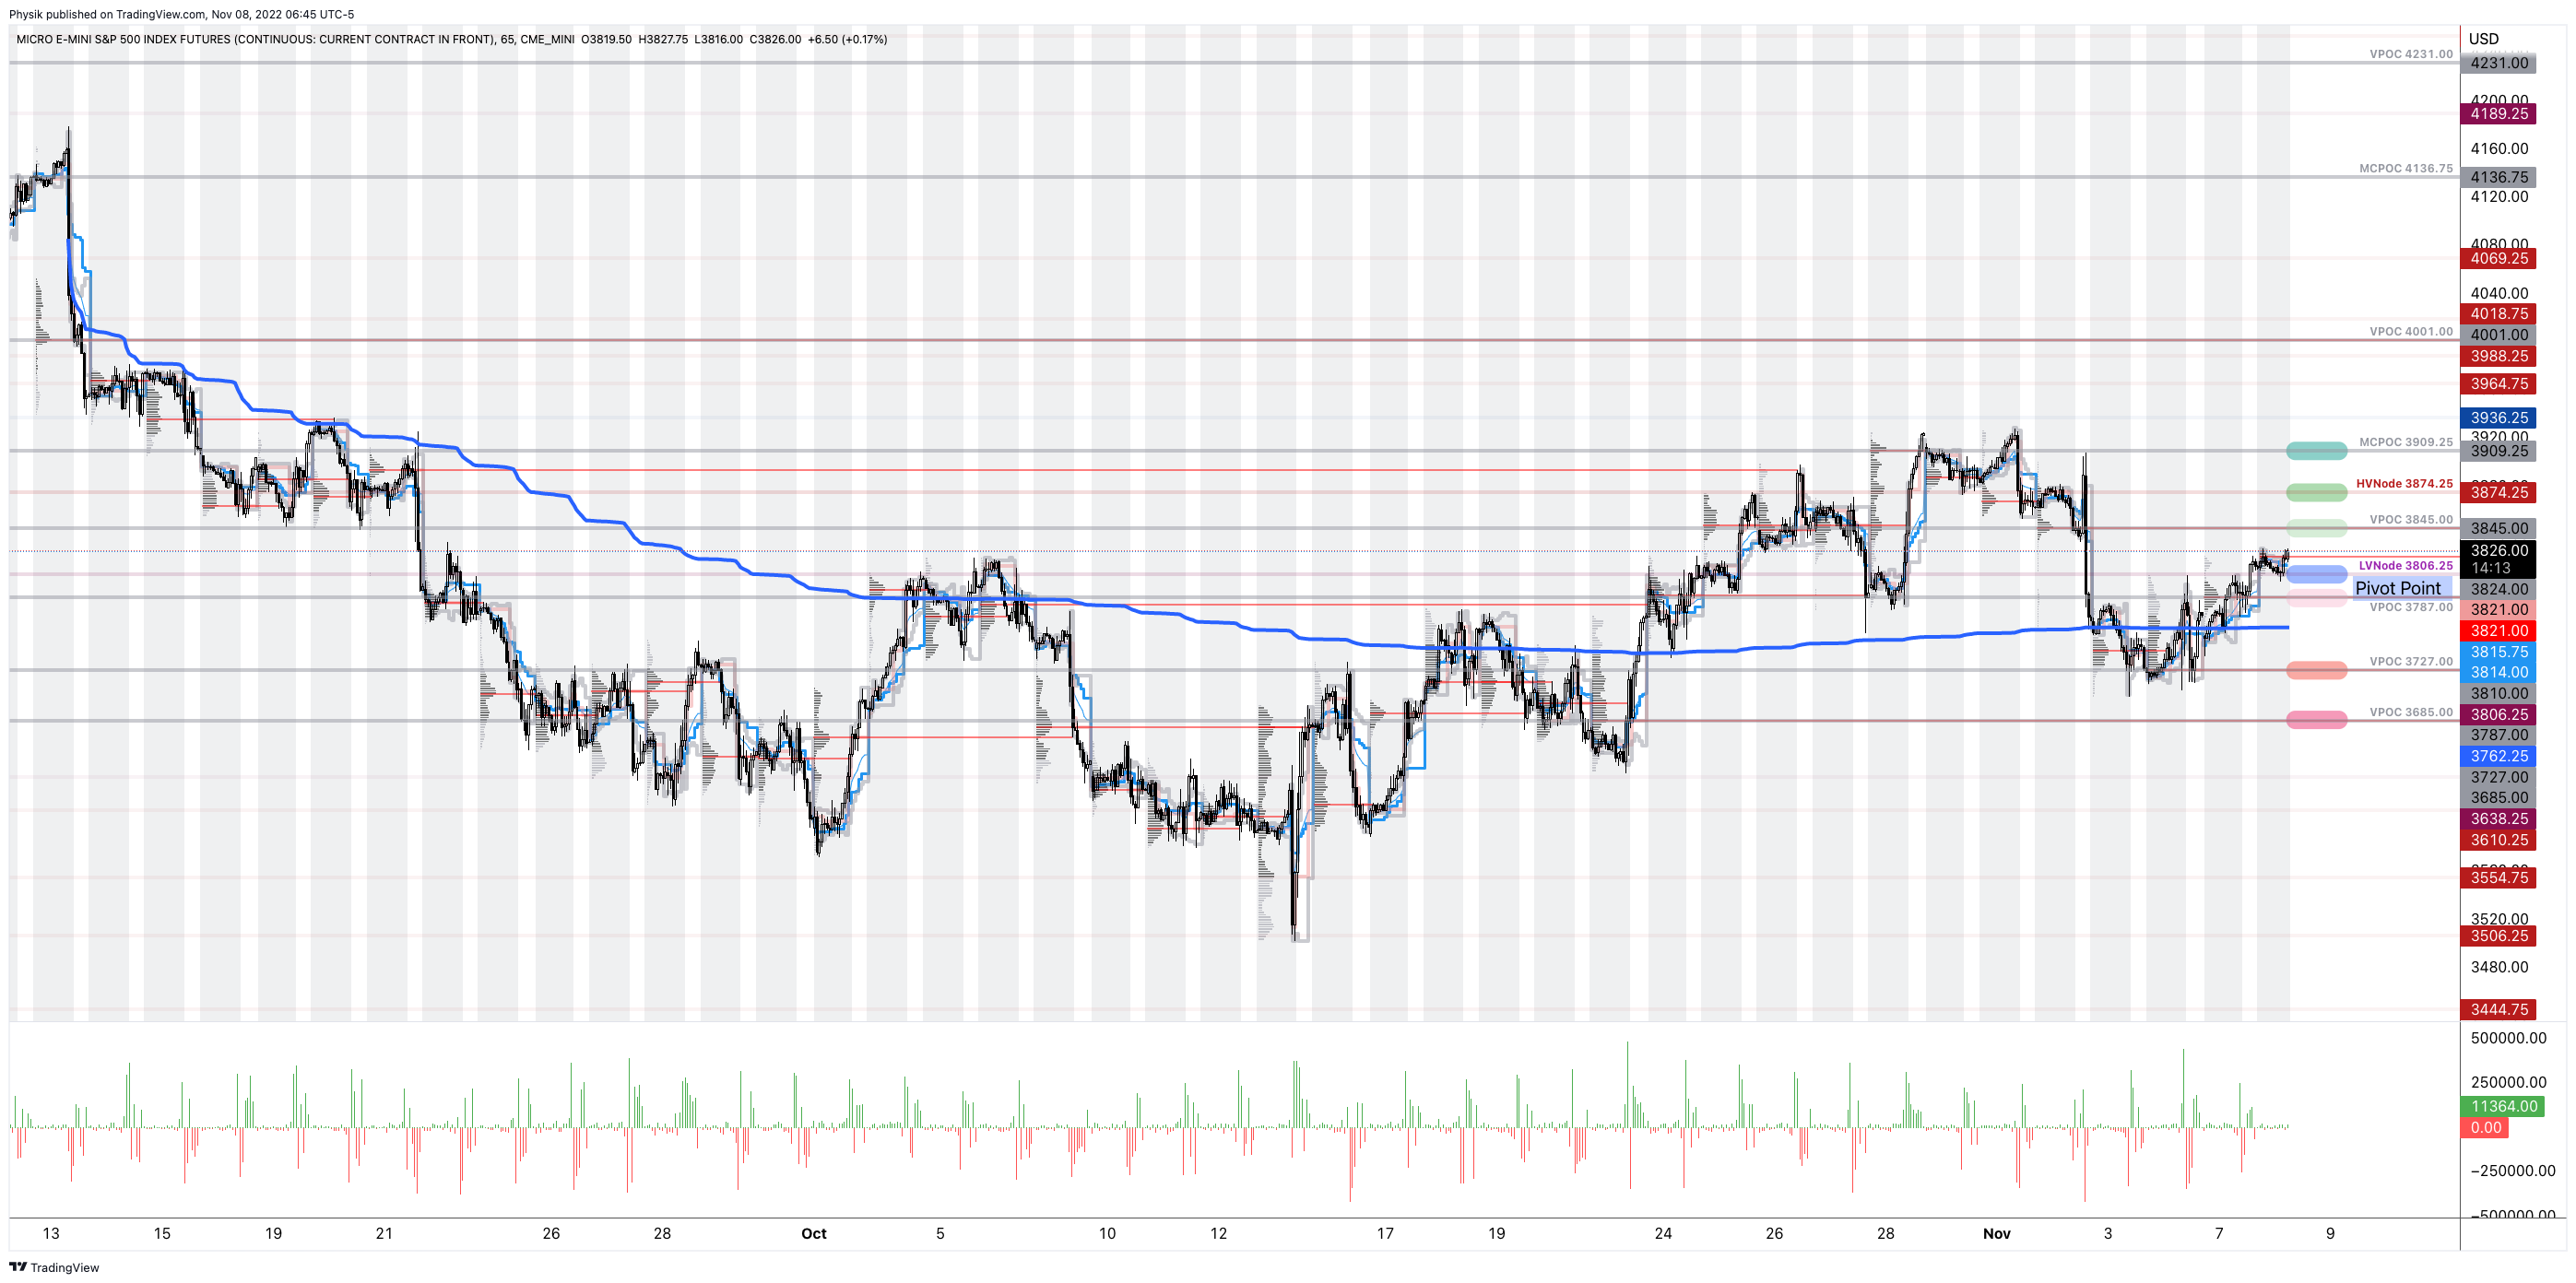
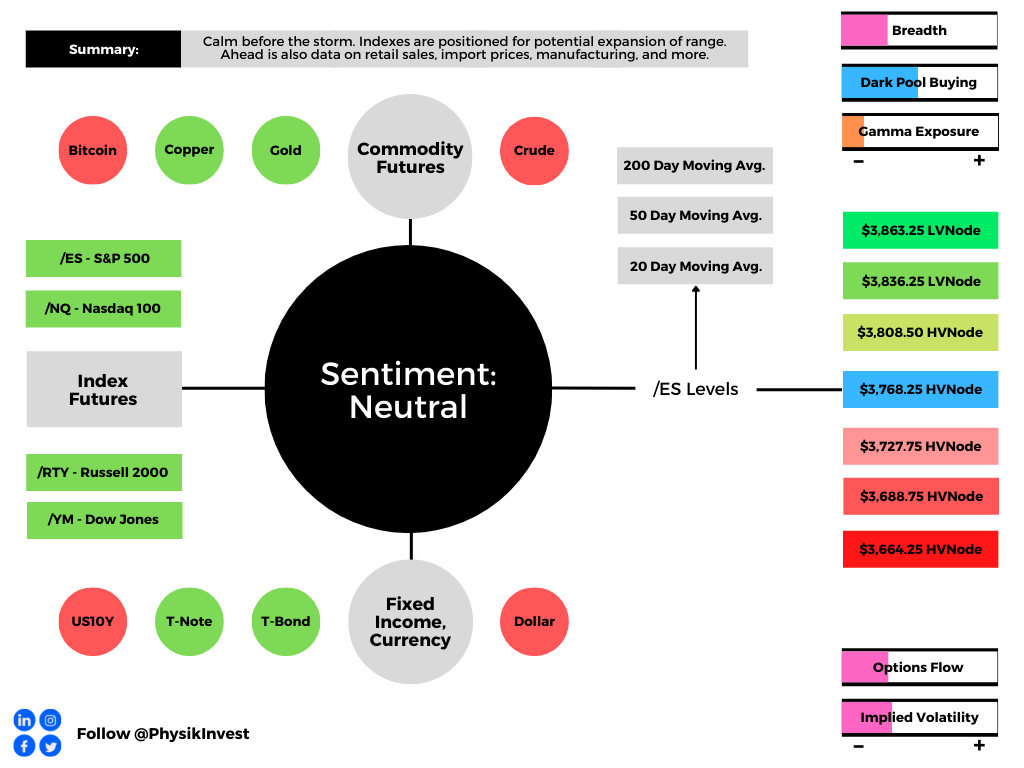
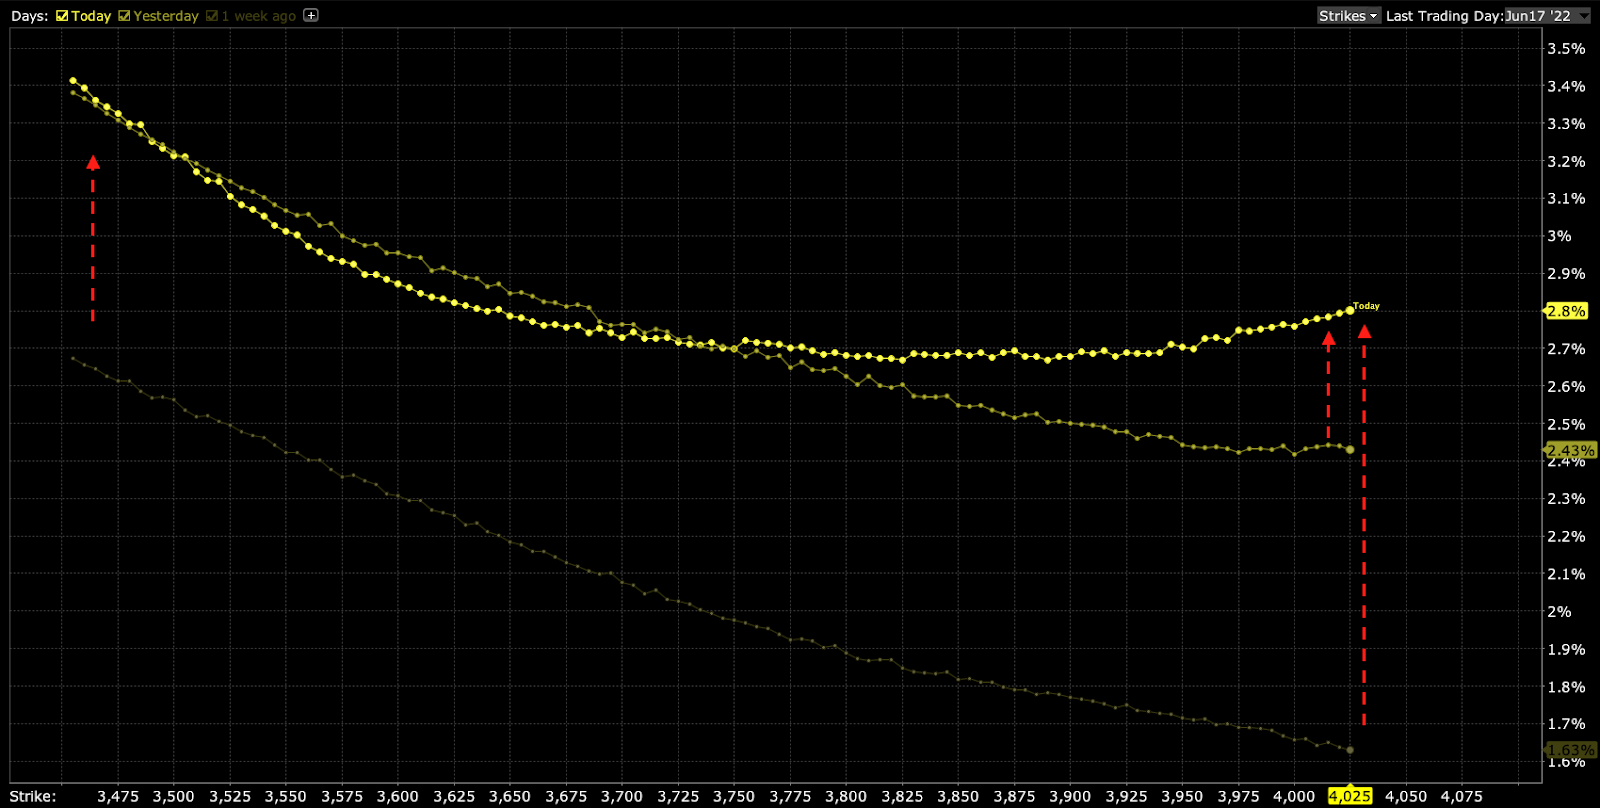
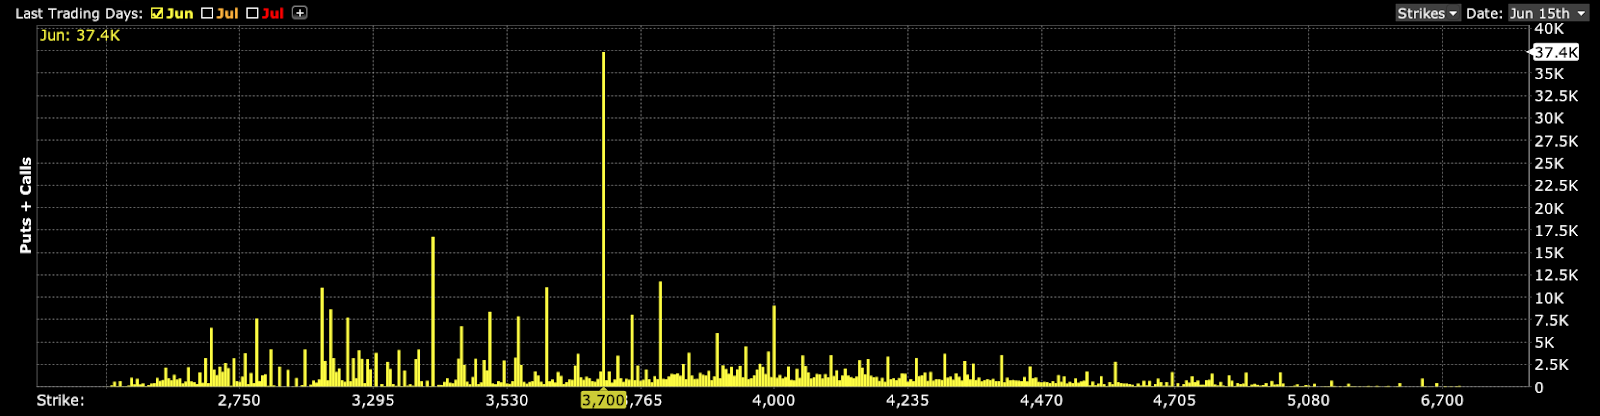
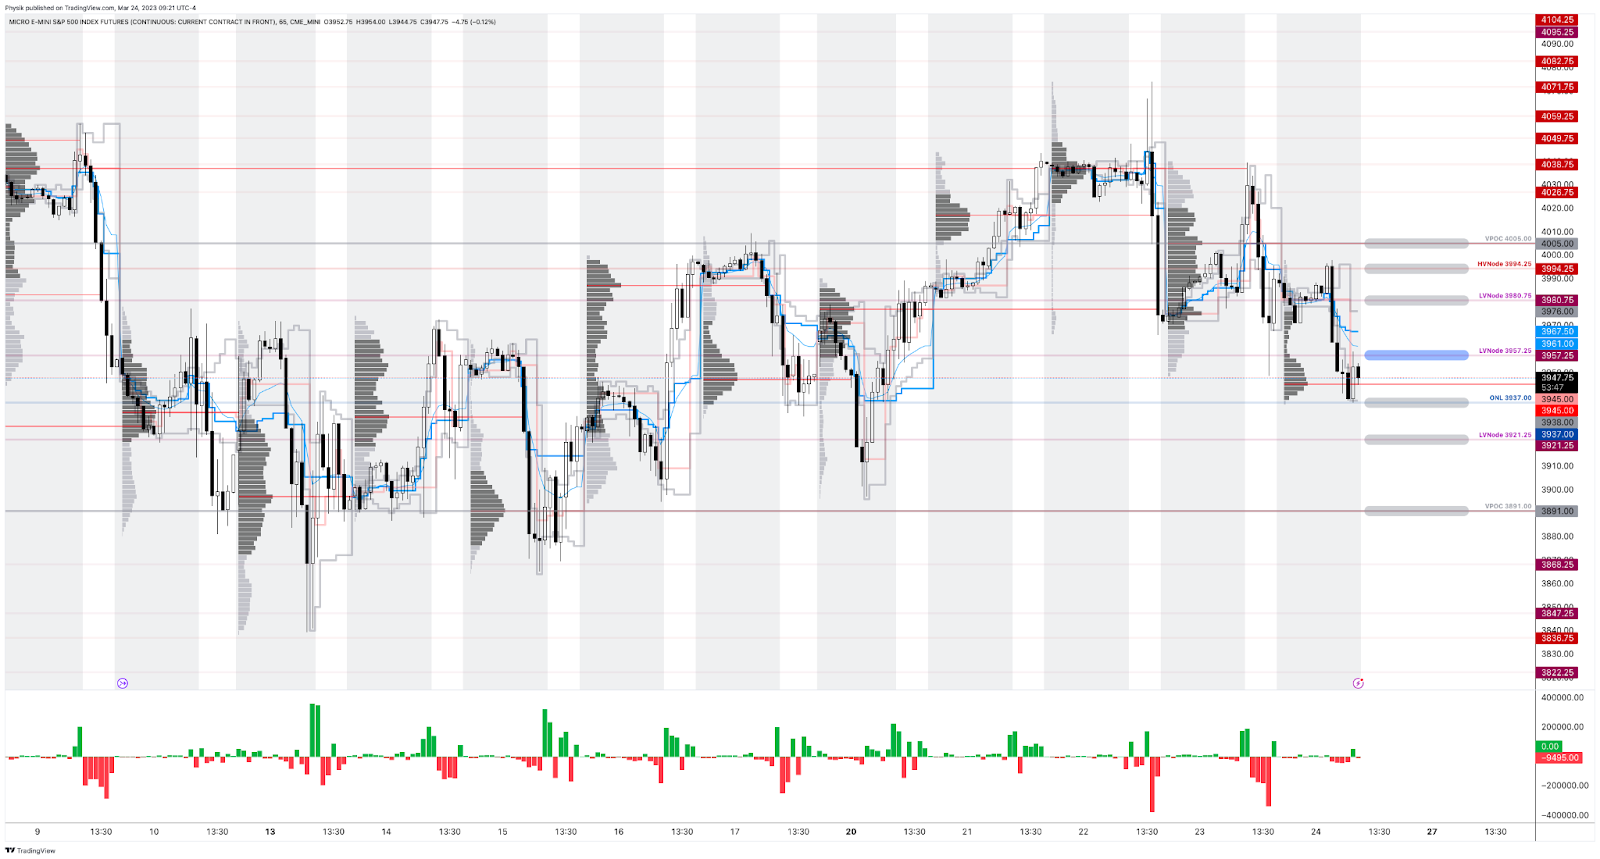
As of 9:20 AM ET, Friday’s regular session (9:30 AM – 4:00 PM ET) in the S&P 500 will likely open in the lower part of a negatively skewed overnight inventory, outside of the prior day’s range, suggesting a potential for immediate directional opportunity.
The S&P 500 pivot for today is $3,957.25.
Key levels to the upside include $3,980.75, $3,994.25, and $4,005.00.
Key levels to the downside include $3,937.00, $3,921.25, and $3,891.00.
Disclaimer: Click here to load the updated key levels via the web-based TradingView platform. New links are produced daily. Quoted levels likely hold, barring an exogenous development.
Definitions
Overnight Rally Highs (Lows): Typically, there is a low historical probability associated with overnight rally-highs (lows) ending the upside (downside) discovery process.
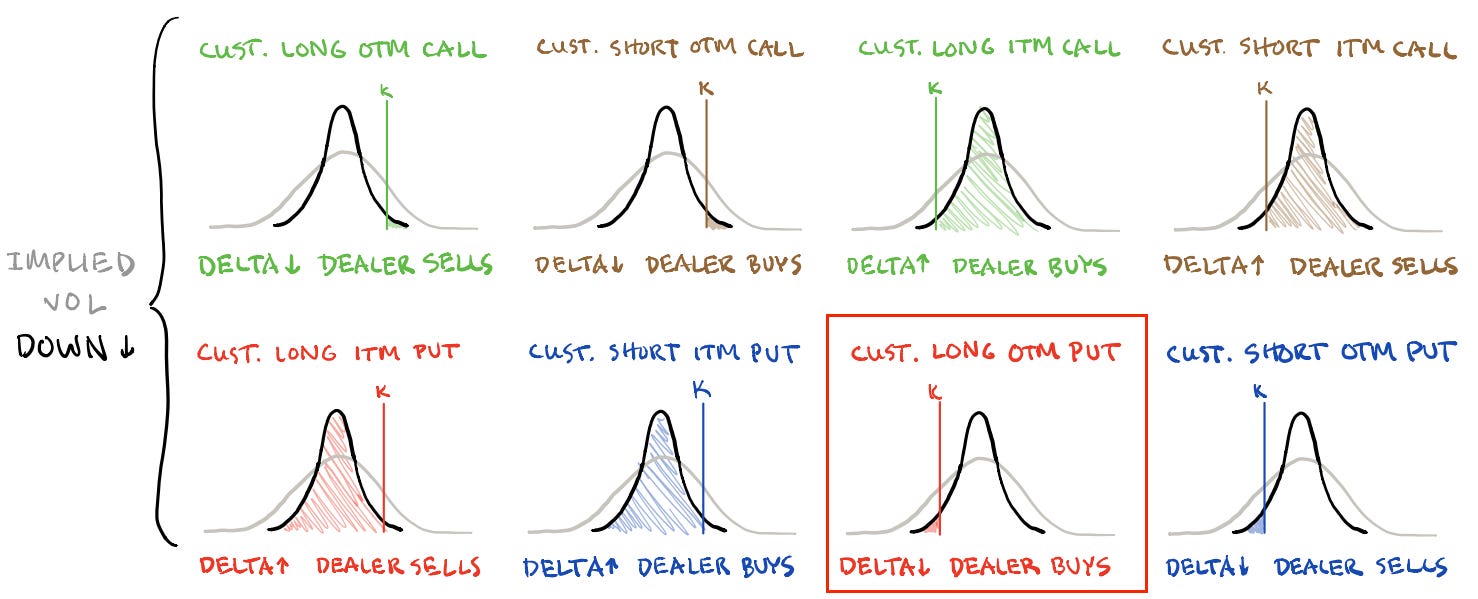
Volume Areas: Markets will build on areas of high-volume (HVNodes). Should the market trend for some time, this will be identified by a low-volume area (LVNodes). The LVNodes denote directional conviction and ought to offer support on any test.
If participants auction and find acceptance in an area of a prior LVNode, then future discovery ought to be volatile and quick as participants look to the nearest HVNodes for more favorable entry or exit.
POCs: Areas where two-sided trade was most prevalent in a prior day session. Participants will respond to future value tests as they offer favorable entry and exit.
About
The author, Renato Leonard Capelj, spends the bulk of his time at Physik Invest, an entity through which he invests and publishes free daily analyses to thousands of subscribers. The analyses offer him and his subscribers a way to stay on the right side of the market.
Separately, Capelj is an accredited journalist with past works including interviews with investor Kevin O’Leary, ARK Invest’s Catherine Wood, FTX’s Sam Bankman-Fried, North Dakota Governor Doug Burgum, Lithuania’s Minister of Economy and Innovation Aušrinė Armonaitė, former Cisco chairman and CEO John Chambers, and persons at the Clinton Global Initiative.
Connect
Direct queries to renato@physikinvest.com. Find Physik Invest on Twitter, LinkedIn, Facebook, and Instagram. Find Capelj on Twitter, LinkedIn, and Instagram. Only follow the verified profiles.
Calendar
You may view this letter’s content calendar at this link.
Disclaimer
Do not construe this newsletter as advice. All content is for informational purposes. Capelj and Physik Invest manage their own capital and will not solicit others for it.