Editor’s Note: The Daily Brief is a free glimpse into the prevailing fundamental and technical drivers of U.S. equity market products. Join the 200+ that read this report daily, below!
What Happened
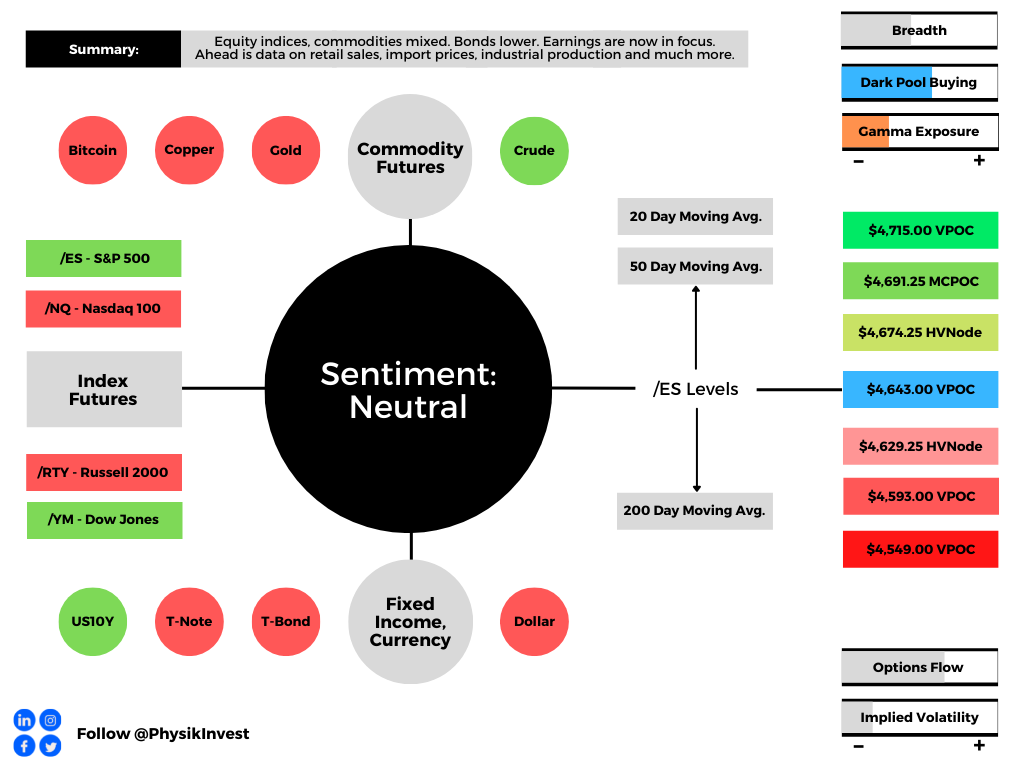
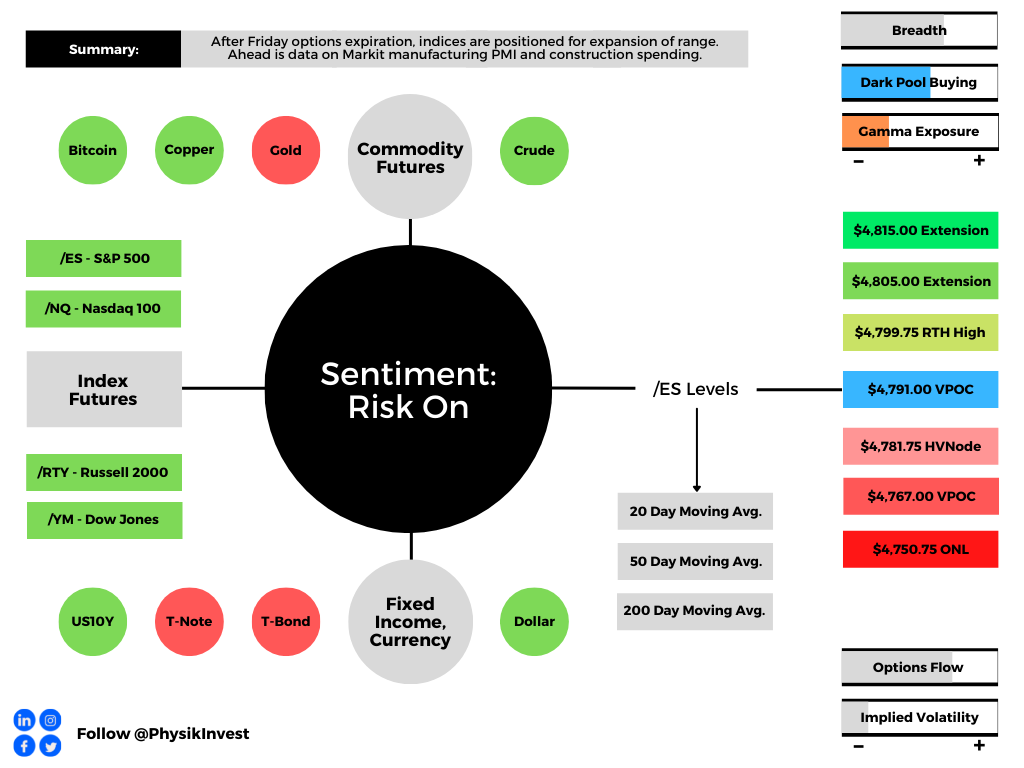
Overnight, equity index futures auctioned back up into range after a spike lower from multi-day balance. The overnight response, higher, happened after Russian Foreign Minister Sergei Lavrov agreed to meet U.S. Secretary of State Antony Blinken for talks in Europe next week.
Ahead is data on existing home sales and leading economic indicators (10:00 AM ET), as well as Fed-speak by Christopher Waller (10:15 AM ET), John Williams (11:00 AM ET), and Lael Brainard (1:30 PM ET).
In observance of Washington’s Birthday, markets are closed Monday, February 21, 2022.
What To Expect
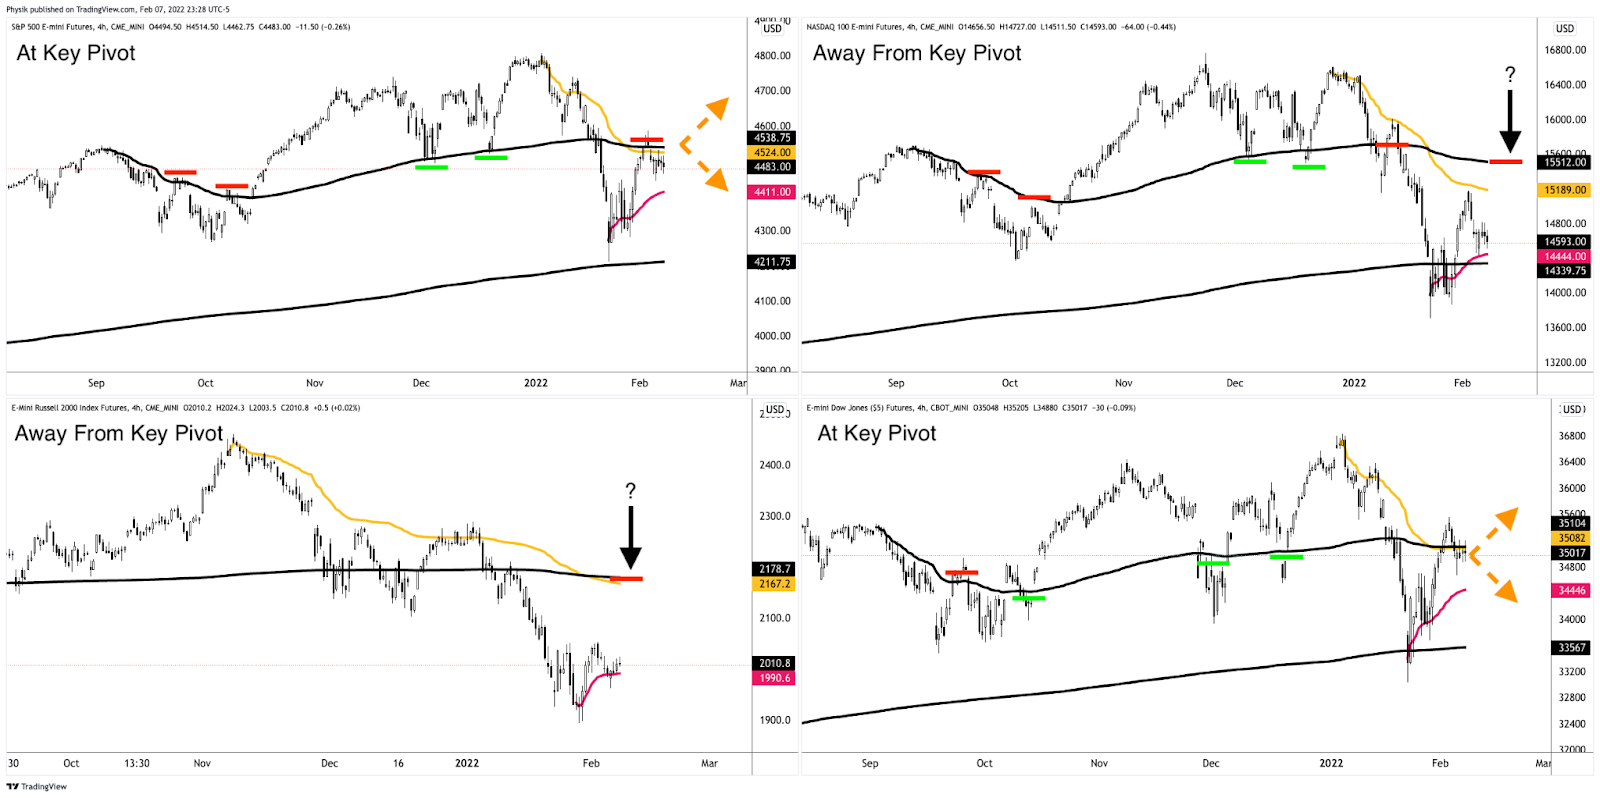
Fundamental: Given the persistence of mechanical responses to key levels, visually-driven, weaker-handed participants (which seldom bear the wherewithal to defend retests) carry a heavier hand in recent price discovery.
The takeaway is that the larger, other time frame (OTF) participants are waiting for more information before committing to substantial expansion of range via large sales or buys.
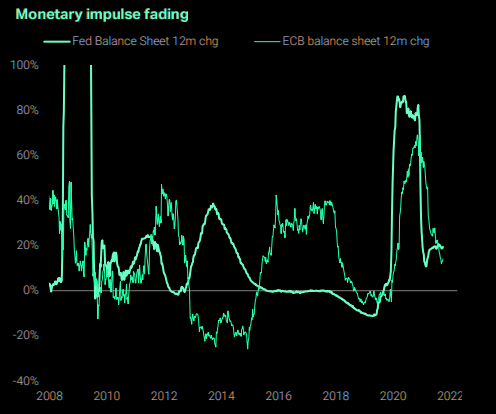
Information the OTFs are seeking to process and position themselves in accordance with are (but not limited to) geopolitical tensions and contractionary monetary policy.
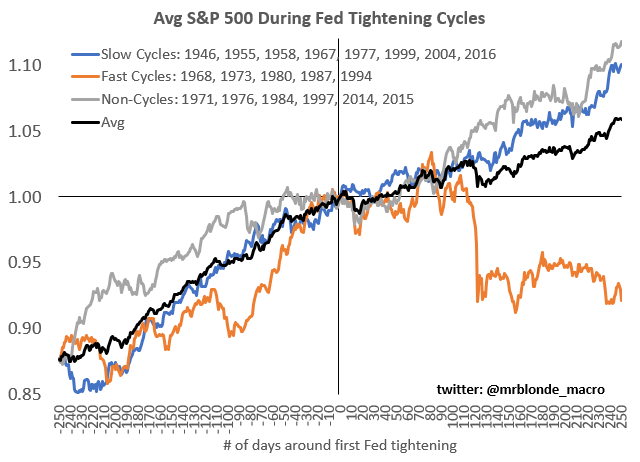
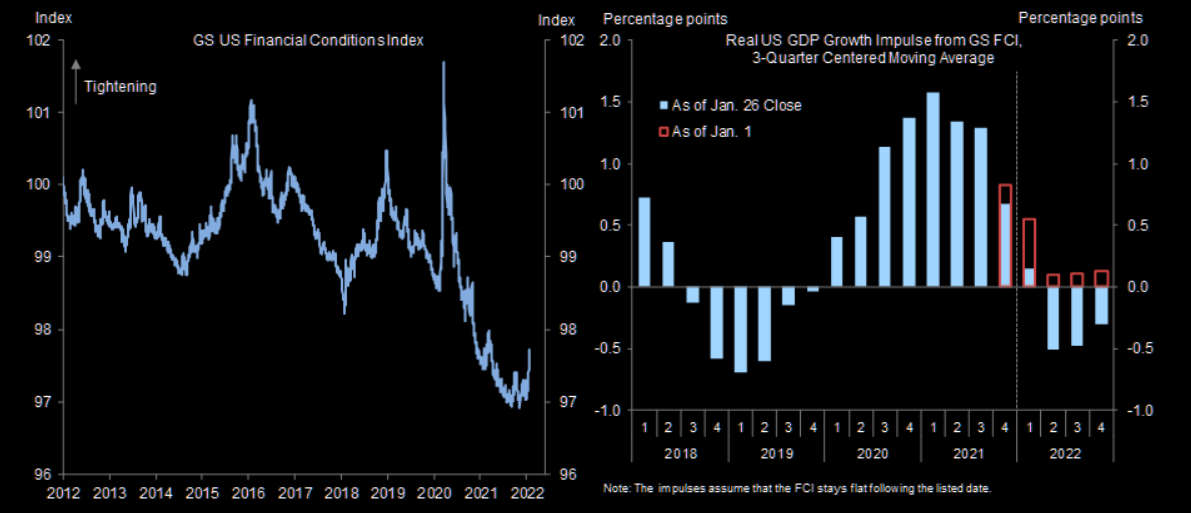
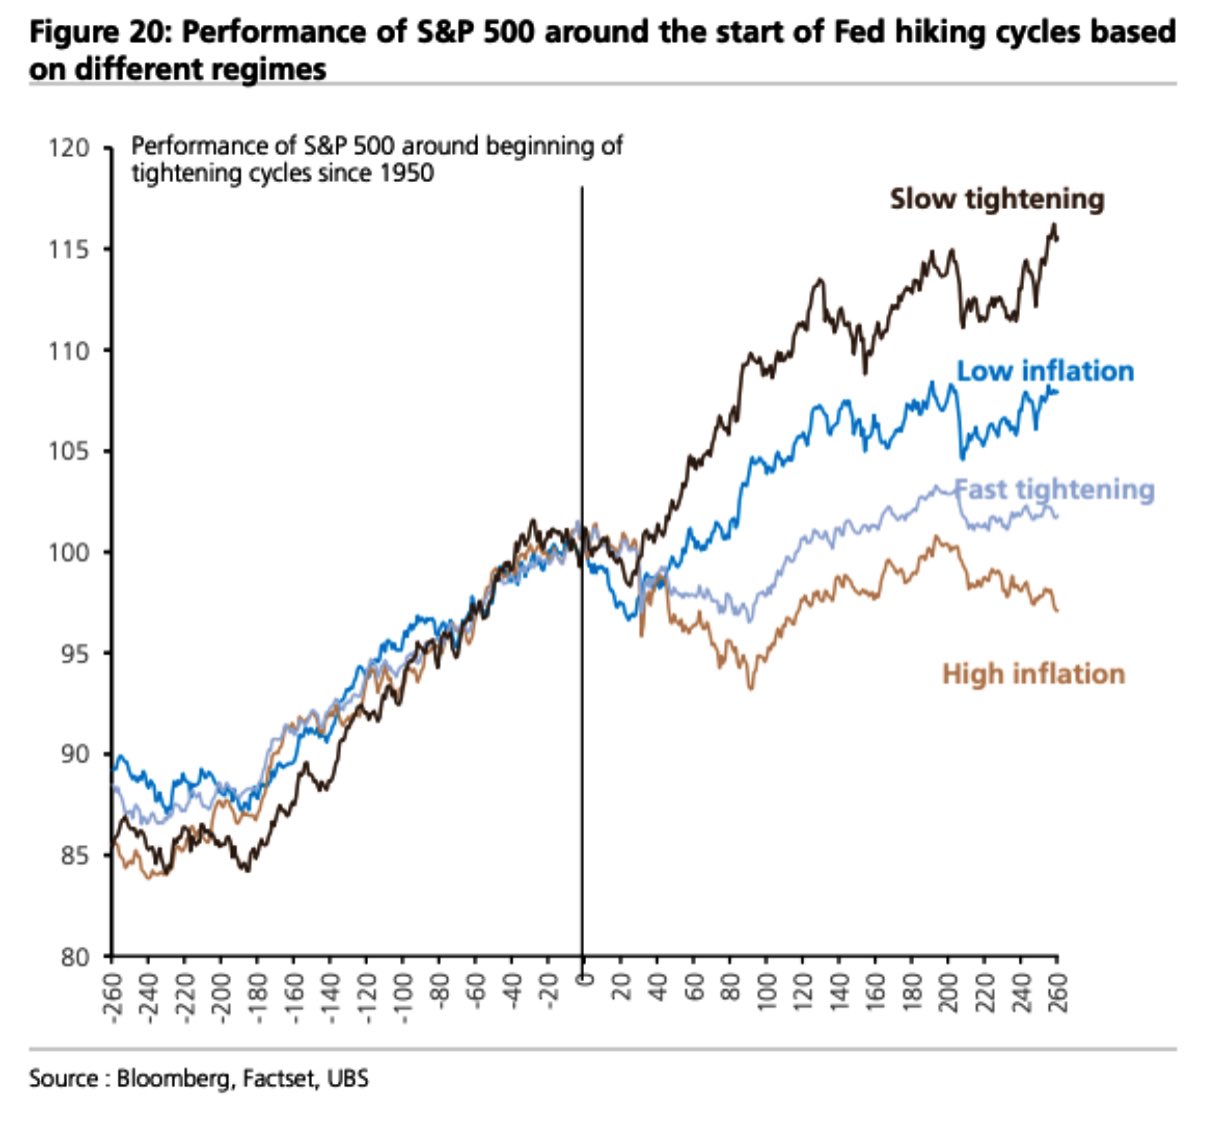
Thursday’s commentary went in-depth on the implications of more severe Fed-action. Mainly, to slow inflation and rid the market of excesses, “a Volcker moment” is needed a strategist said.
The Ambrus Group’s Kris Sidial, and others, expressed their differing sentiments on the issue, given that equities are so intertwined with consumer savings.
“There is no way the fed looks to use additional volatility as a policeman,” he explained. “It’s one of those things that sounds ok in theory but will not work in real-world applications.”
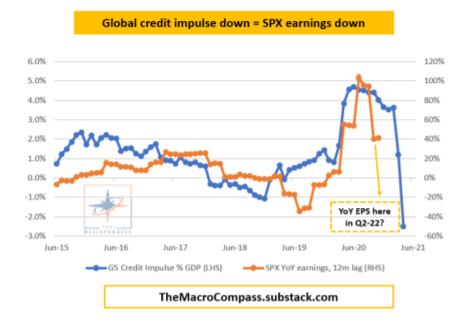
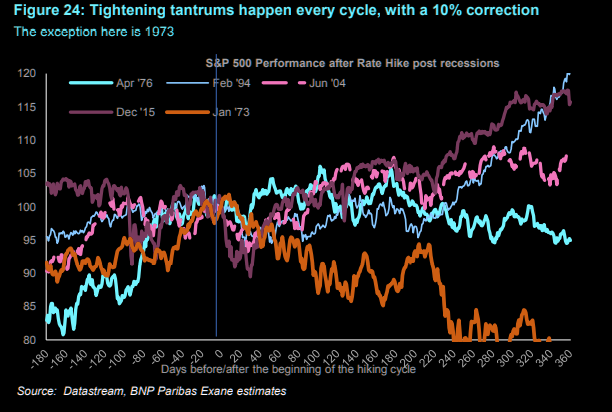
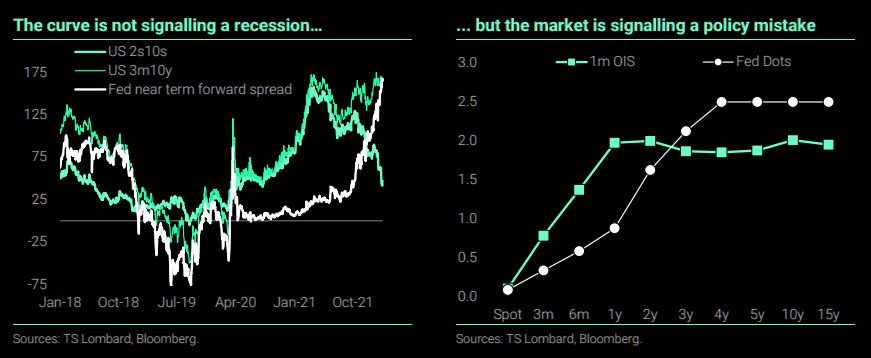
As Moody’s Corporation (NYSE: MCO) puts well, “This cycle is unlike any recent one and, while there are a ton of reasons to be optimistic about the U.S. economy’s near-term prospects, there are also reasons to worry that a recession isn’t far off on the horizon.”
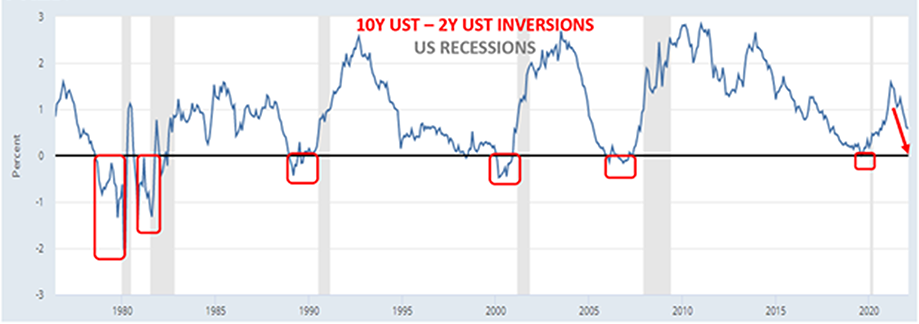
“If the Fed is forced to raise the fed funds rate above its neutral rate to tame inflation, the stage will be set for recession. Also, some Fed officials believe they are falling further behind the curve, which could lead to a more aggressive tightening cycle, a recipe for an economic downturn in 2023 or 2024.”
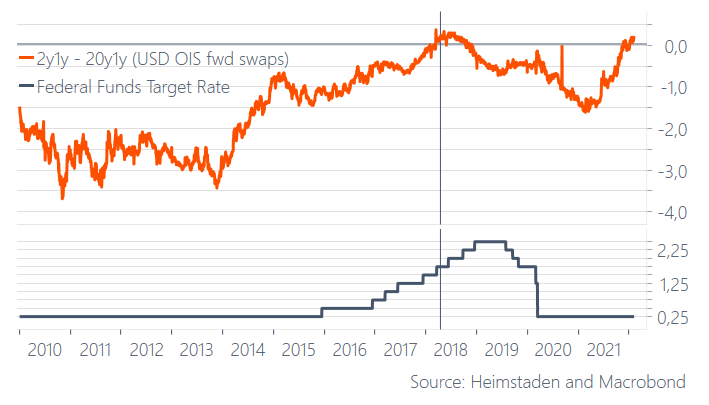
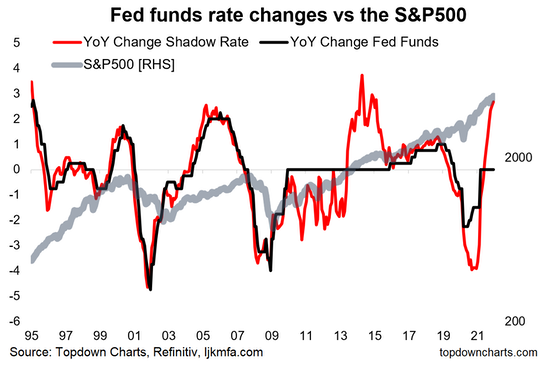
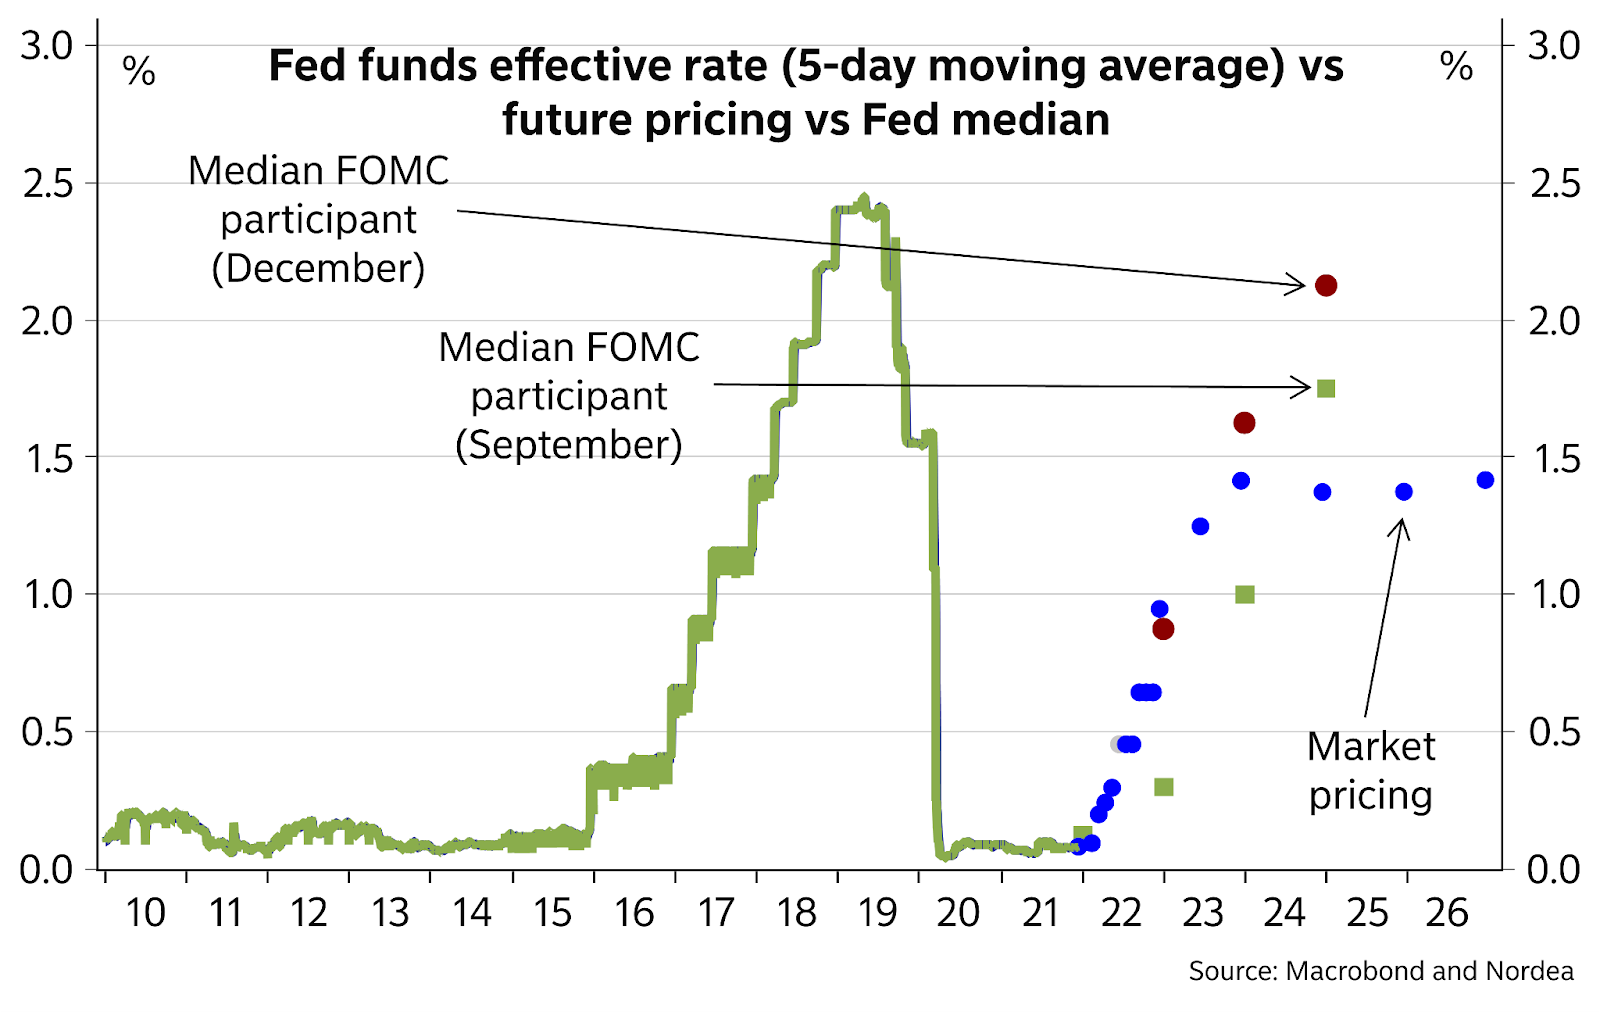
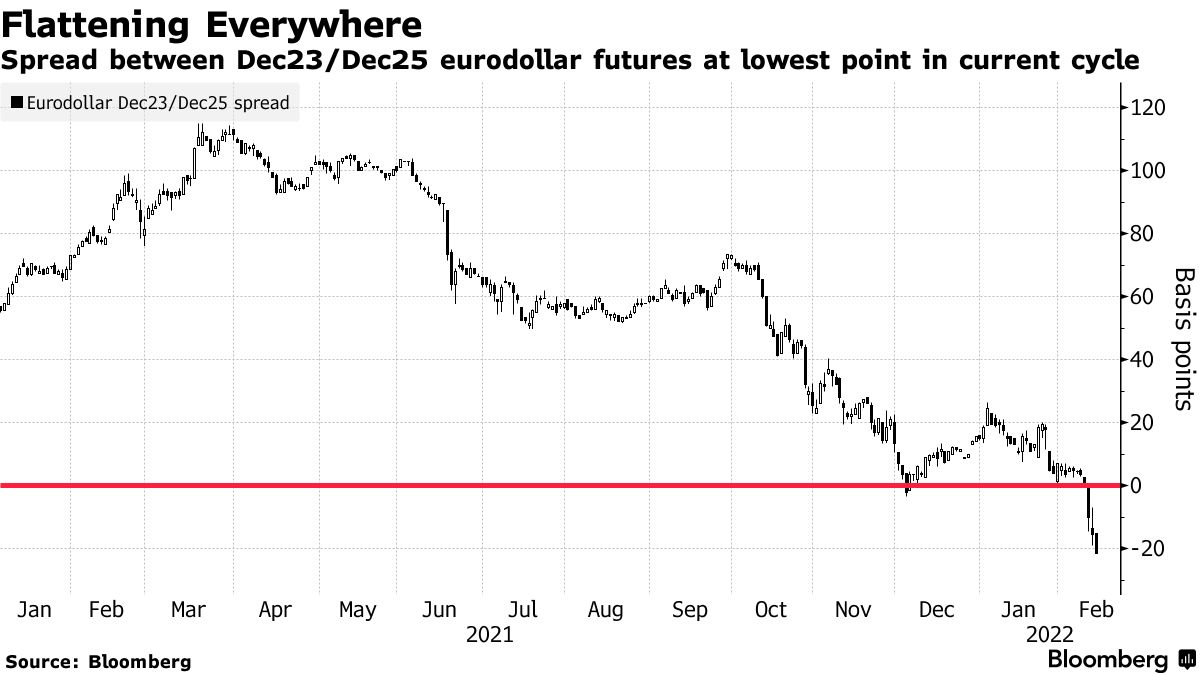
Based on this sentiment, investors have already bet – via the eurodollar futures contract – on the Fed reversing its tightening course in late 2023. The current baseline calls for four 25-basis point rate hikes this year.

“We, therefore, think that the more likely path is a longer series of 25-basis point increases in the target range for the fed funds rate and we may need to add an additional rate hike to our baseline forecast in March,” Moody’s says in response to more hawkish pricings as a result of market focus on comments by hawkish regional Fed presidents.
On that note, Mark Haefele, chief investment officer at UBS Group AG’s (NYSE: UBS) Global Wealth Management arm says that “Despite the recent volatility, it’s important to remember that we are still in an environment of robust economic and earnings growth.”
“Our base case we expect upside for equity markets over the balance of the year.”
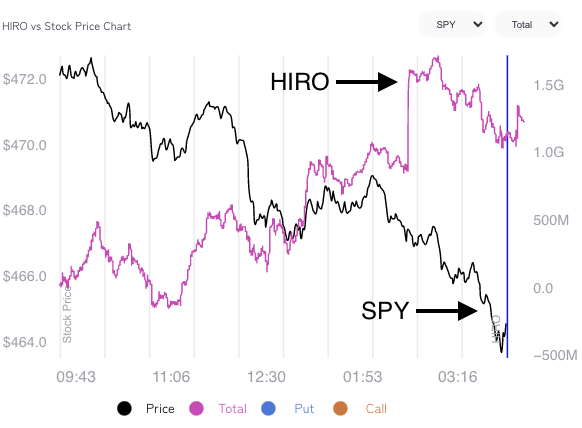
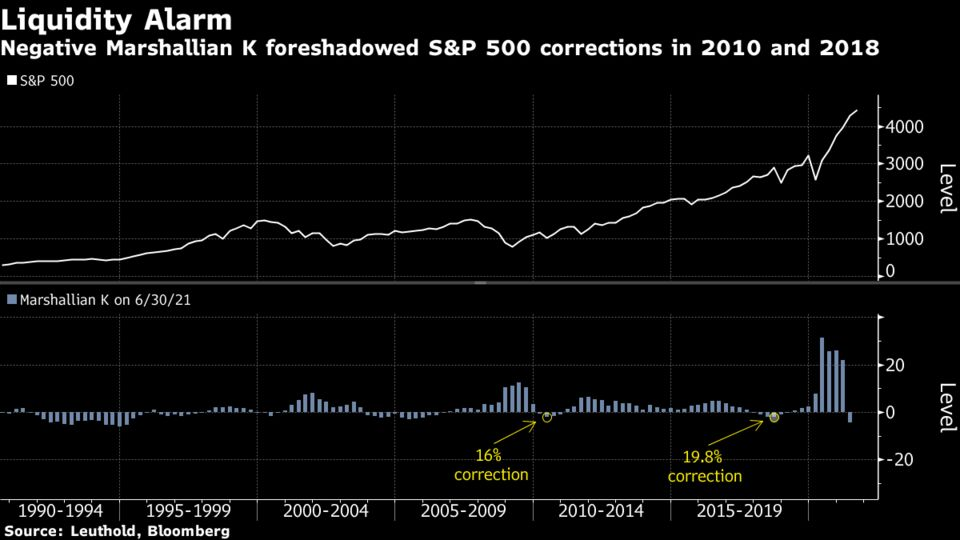
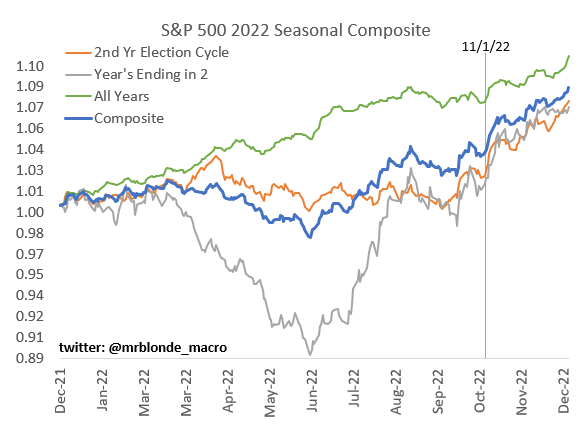
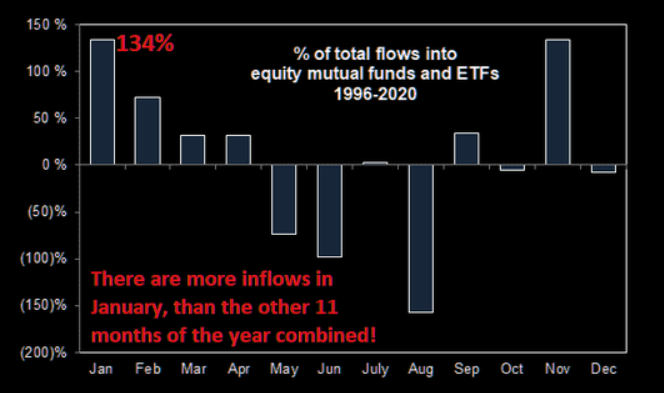
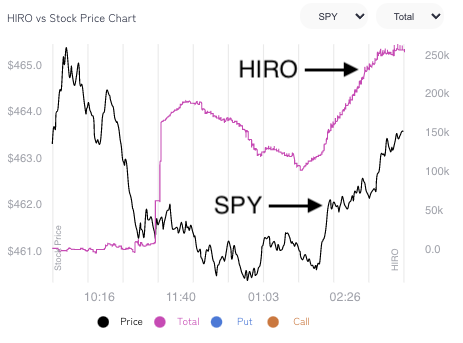
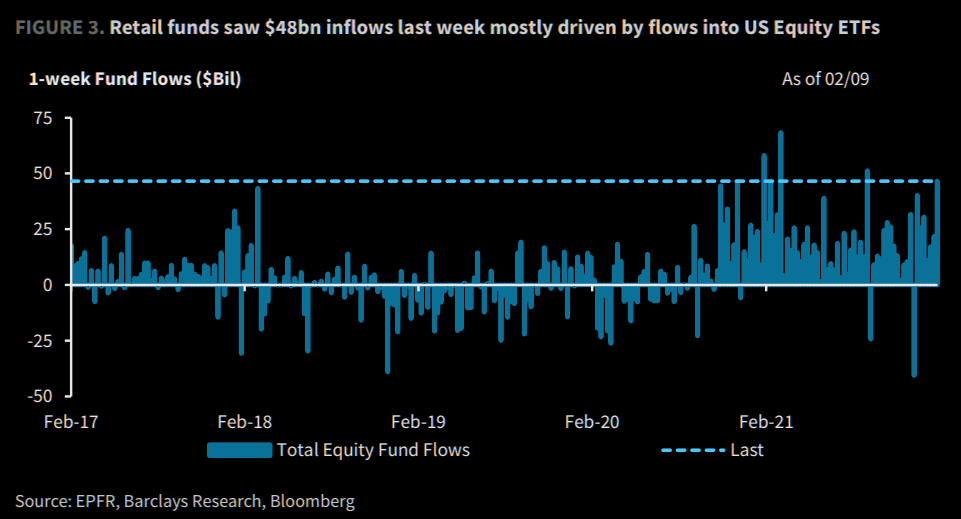
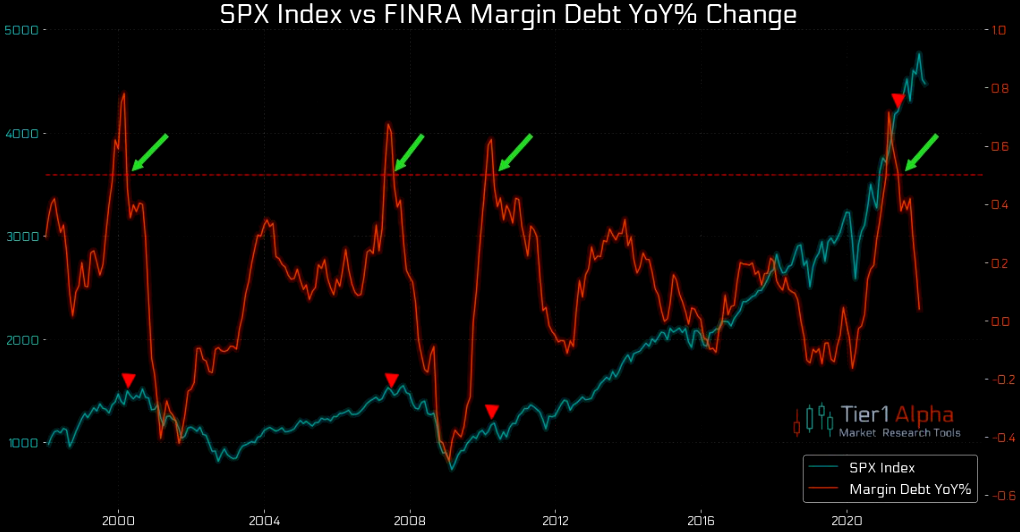
Positioning: Passive buying flows persist alongside a drop in bearish sentiment readings.
This action is in the face of a collapse in margin debt.
In the credit markets, investment-grade spreads are at some of their widest levels since 2020. Per Bloomberg, put option (bets on the downside) open interest in corporate bond ETFs is at an all-time high.
“Rotate into credit now,” Chris Sheldon, the co-head of credit and markets at KKR, explained, taking a contrarian view. “As the rate volatility plays through the market segment, we think high yield could become more attractive very quickly.”
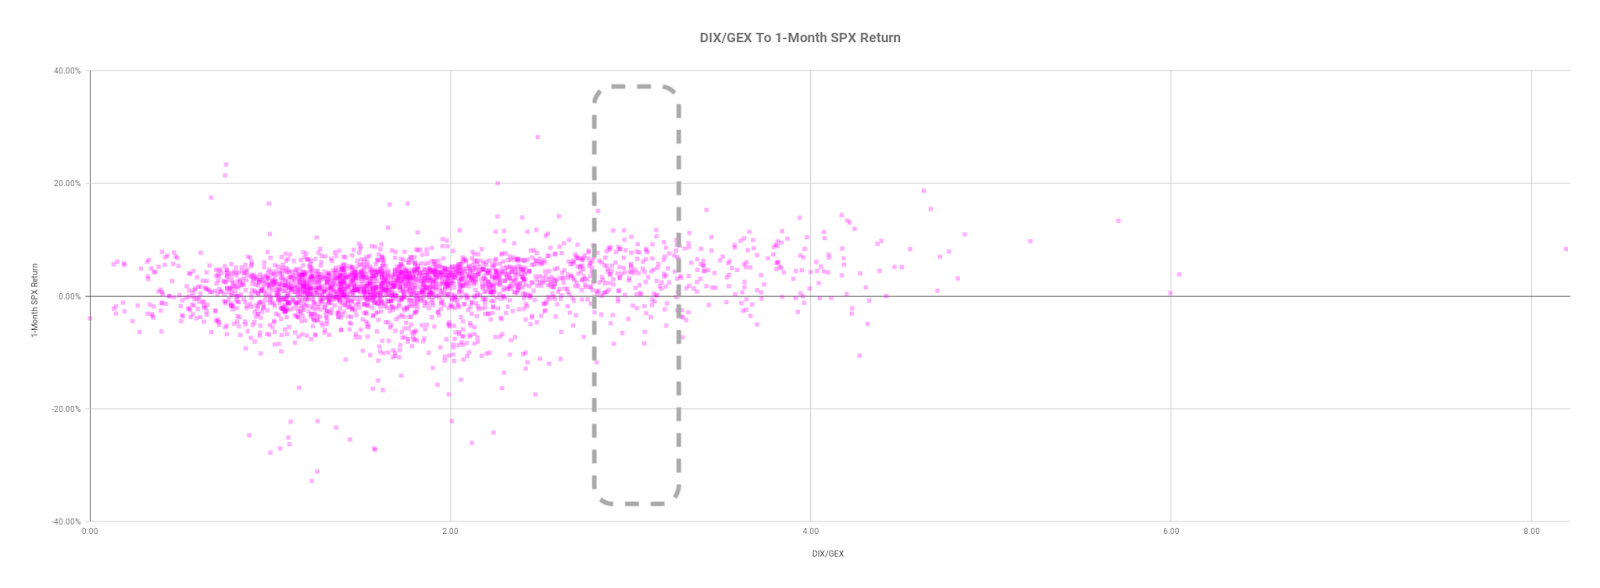
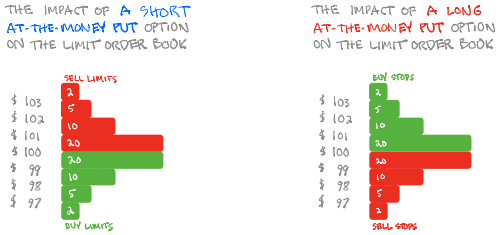
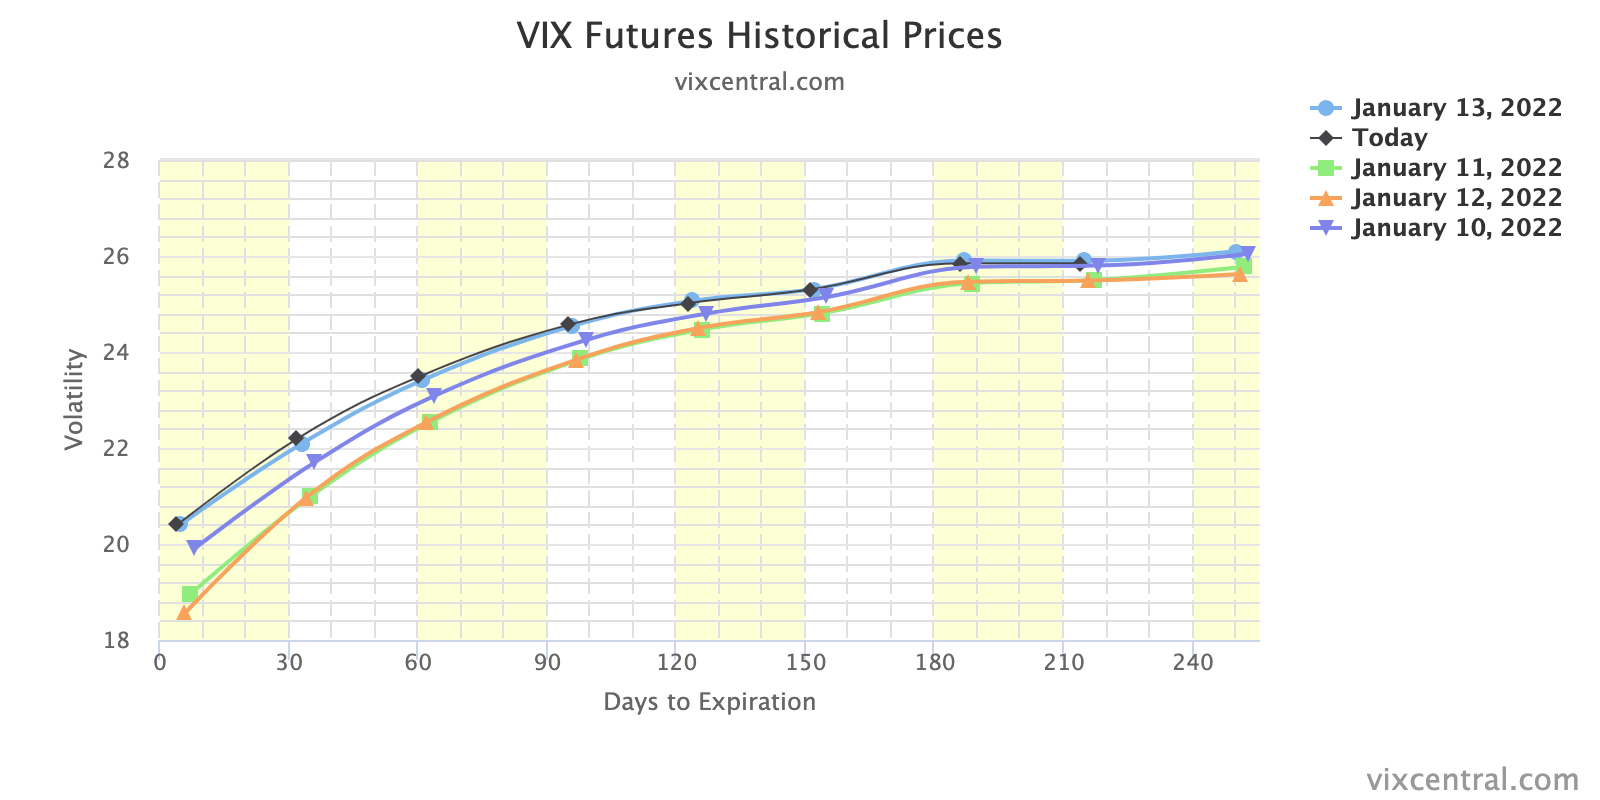
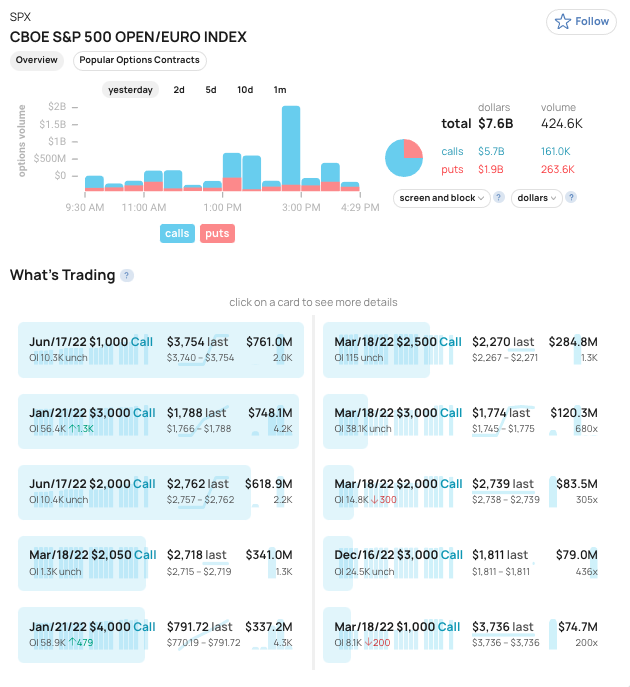
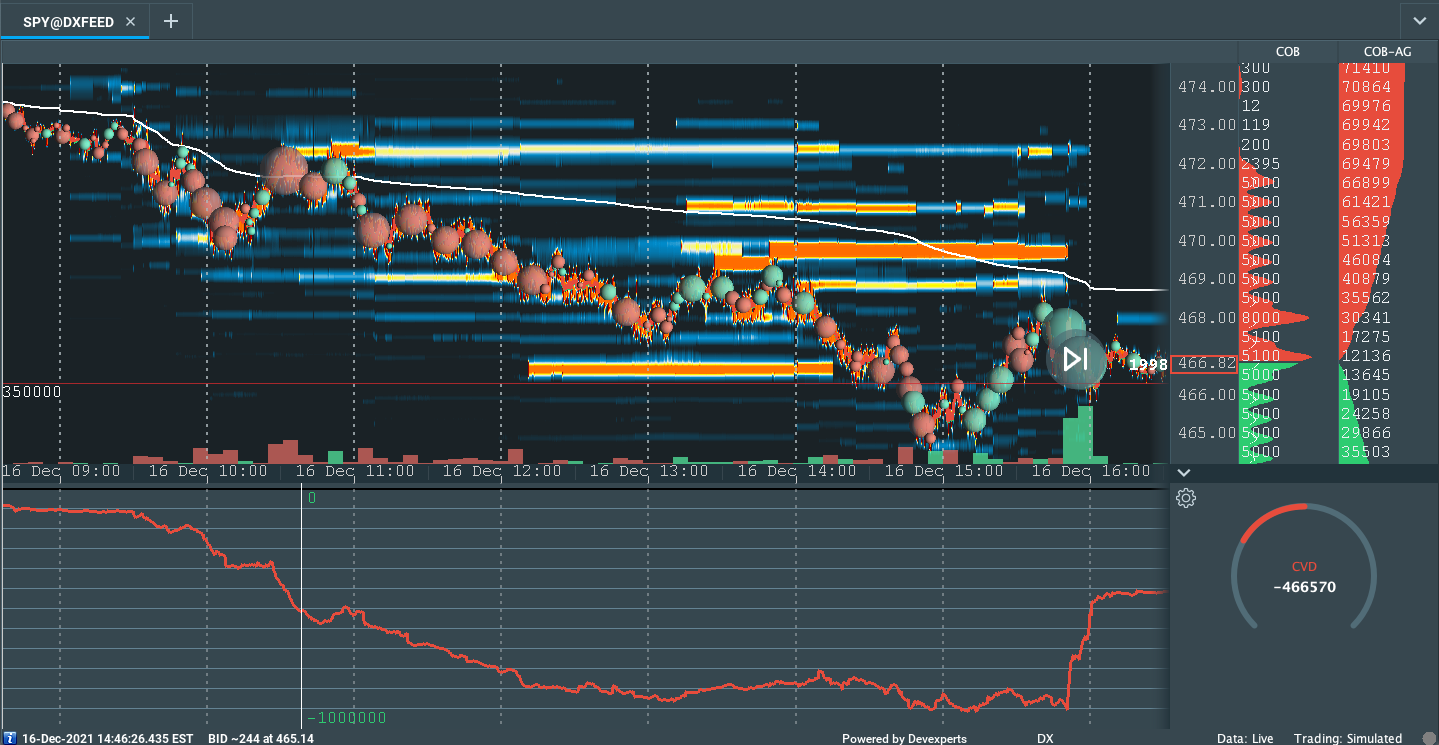
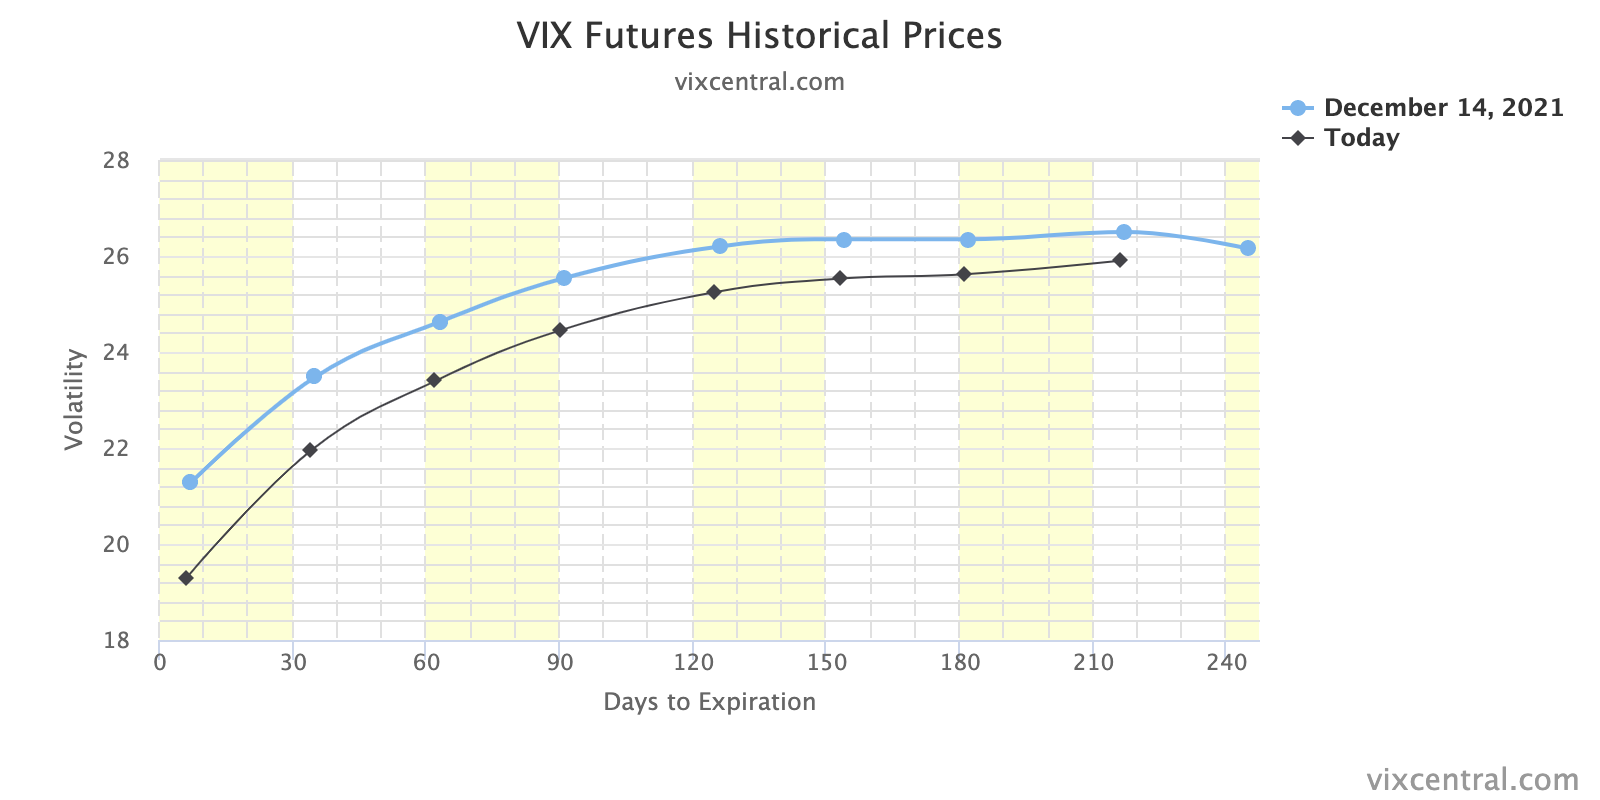
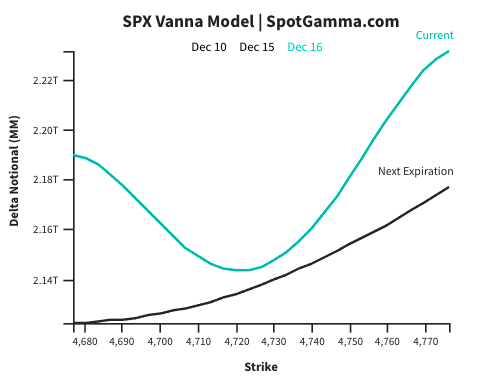
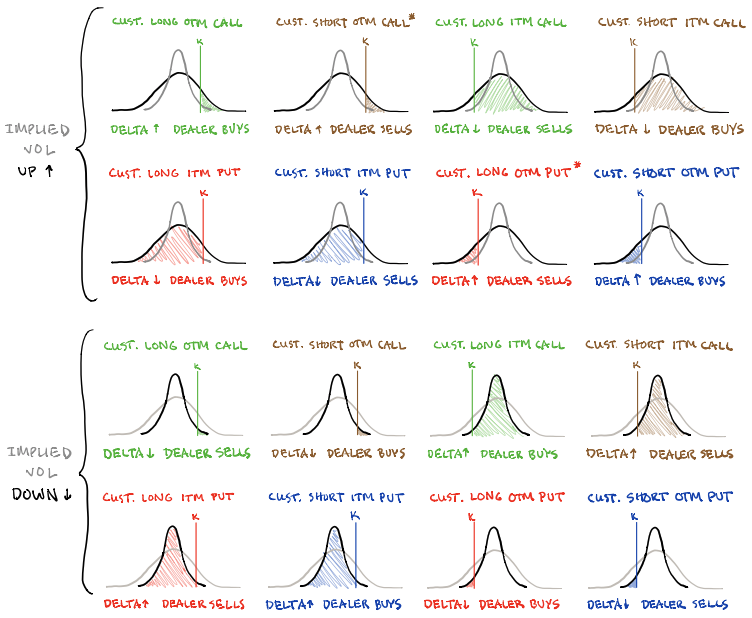
On the single-stock and index-level, options positioning suggests participants should continue to brace for volatility. Participants’ demand for protection (negative delta exposure) has left counterparties (dealers taking the other side and warehousing risk) adding negative delta exposure linearly (via stock and futures sales) to hedge.
To note, owning an option offers someone positive exposure to gamma or convexity (to have profits multiplied if the direction is correct, all else equal). On the other side, though, participants who are short gamma or convexity may have their losses multiplied if incorrect.
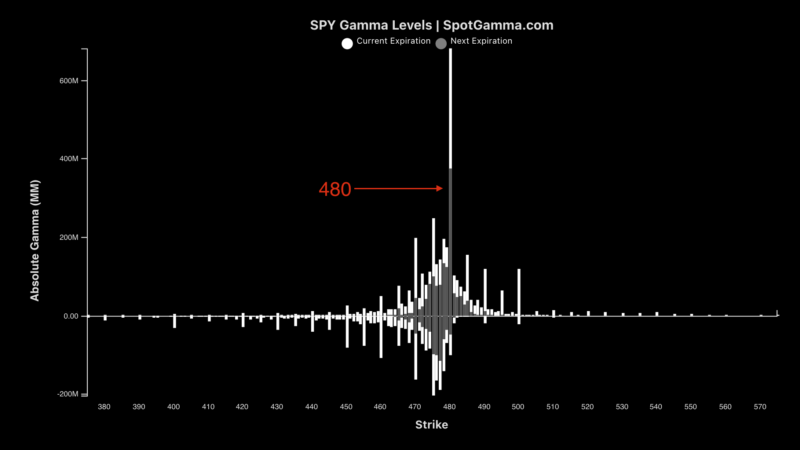
Making some naive assumptions on the build-in interest in options strikes at lower prices, we may surmise that dealers are exposed to increased negative gamma exposure.
To hedge this, if volatility were to remain unchanged, dealers must sell (buy) into weakness (strength) to hedge increasing (decreasing) negative gamma exposure. If volatility rises (drops), then more stock and futures must be sold (bought/covered).
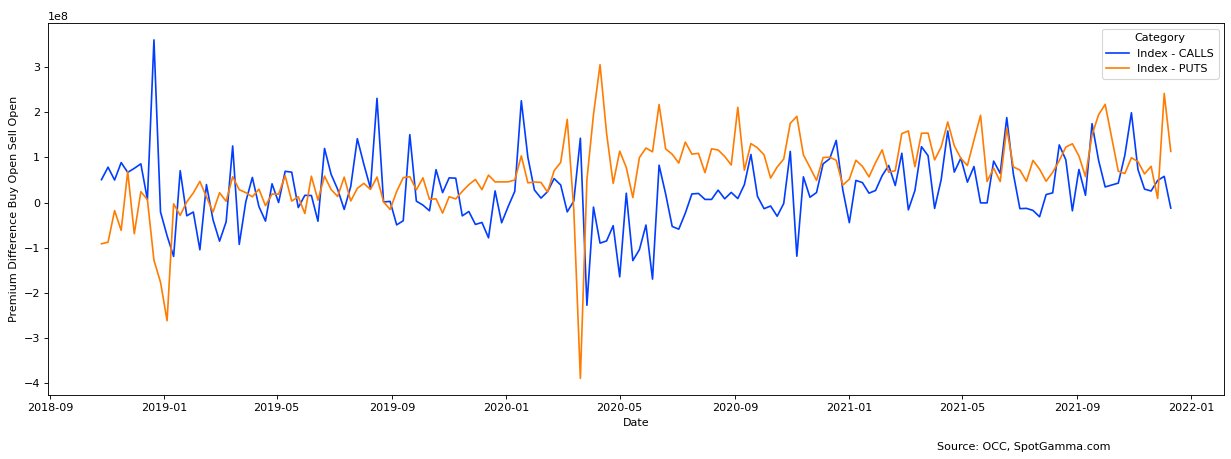
The monthly options expiration (OPEX) will coincide with the removal of lots of put-heavy exposures. This will decrease the dealers’ positive exposure to delta and make gamma exposures less negative.
Therefore, absent some exogenous event that increases demand for protection, again, there is the potential for strength, post-OPEX. That’s when that real-money buying, alluded to above, may resolve in higher prices.
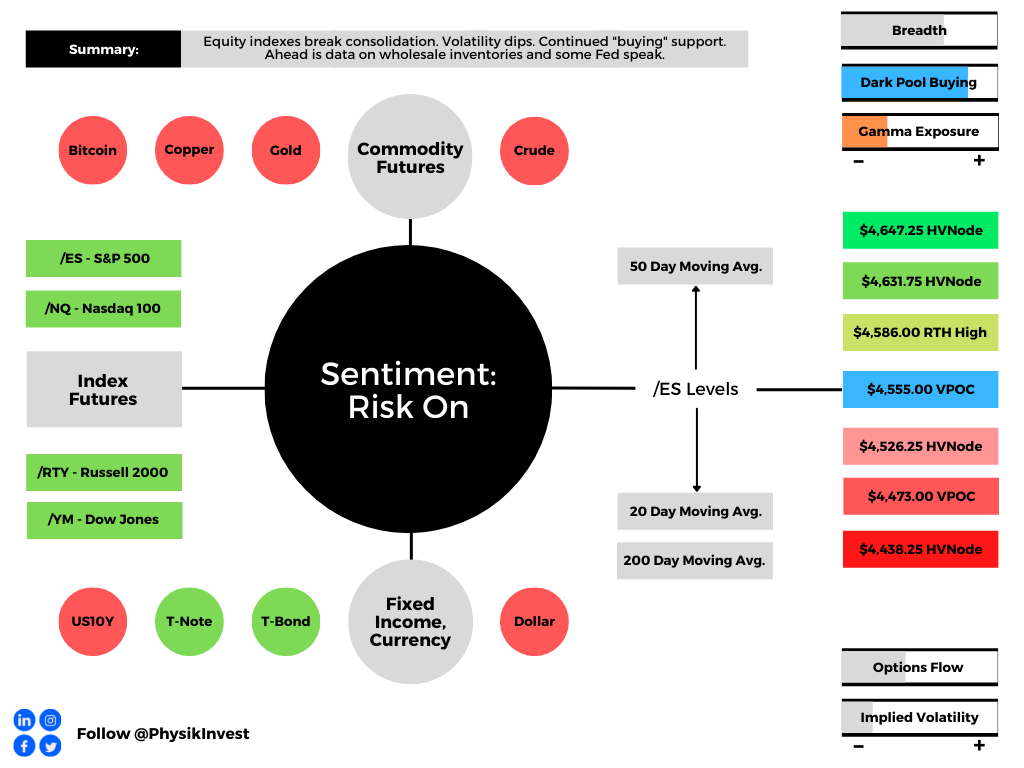
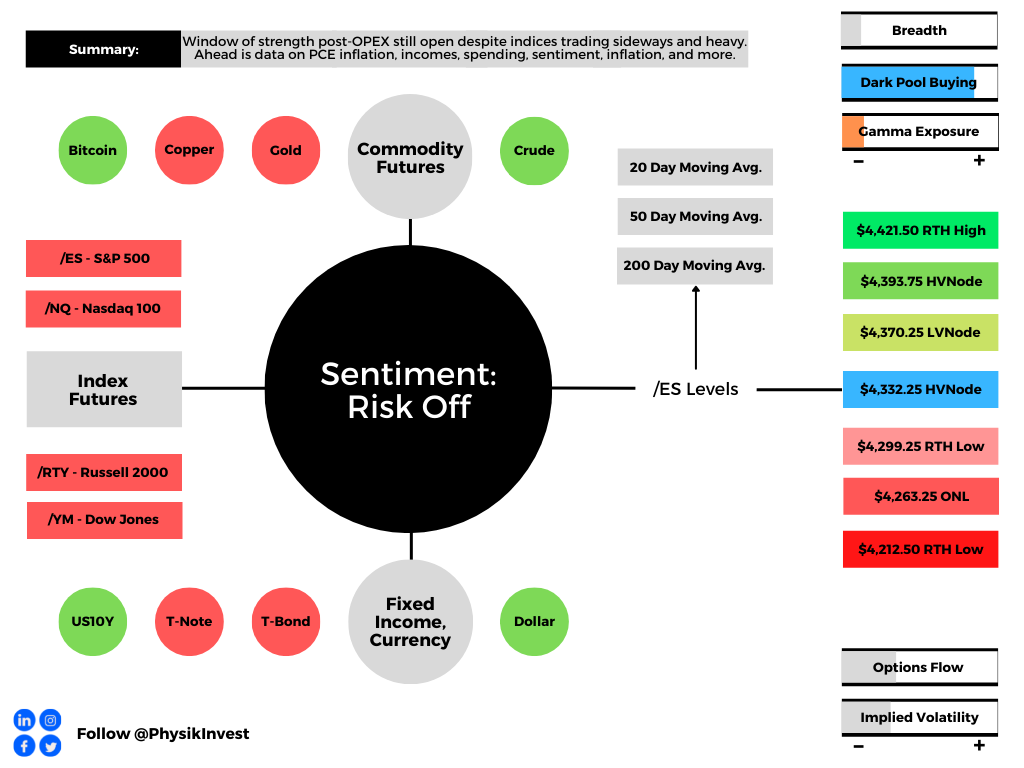
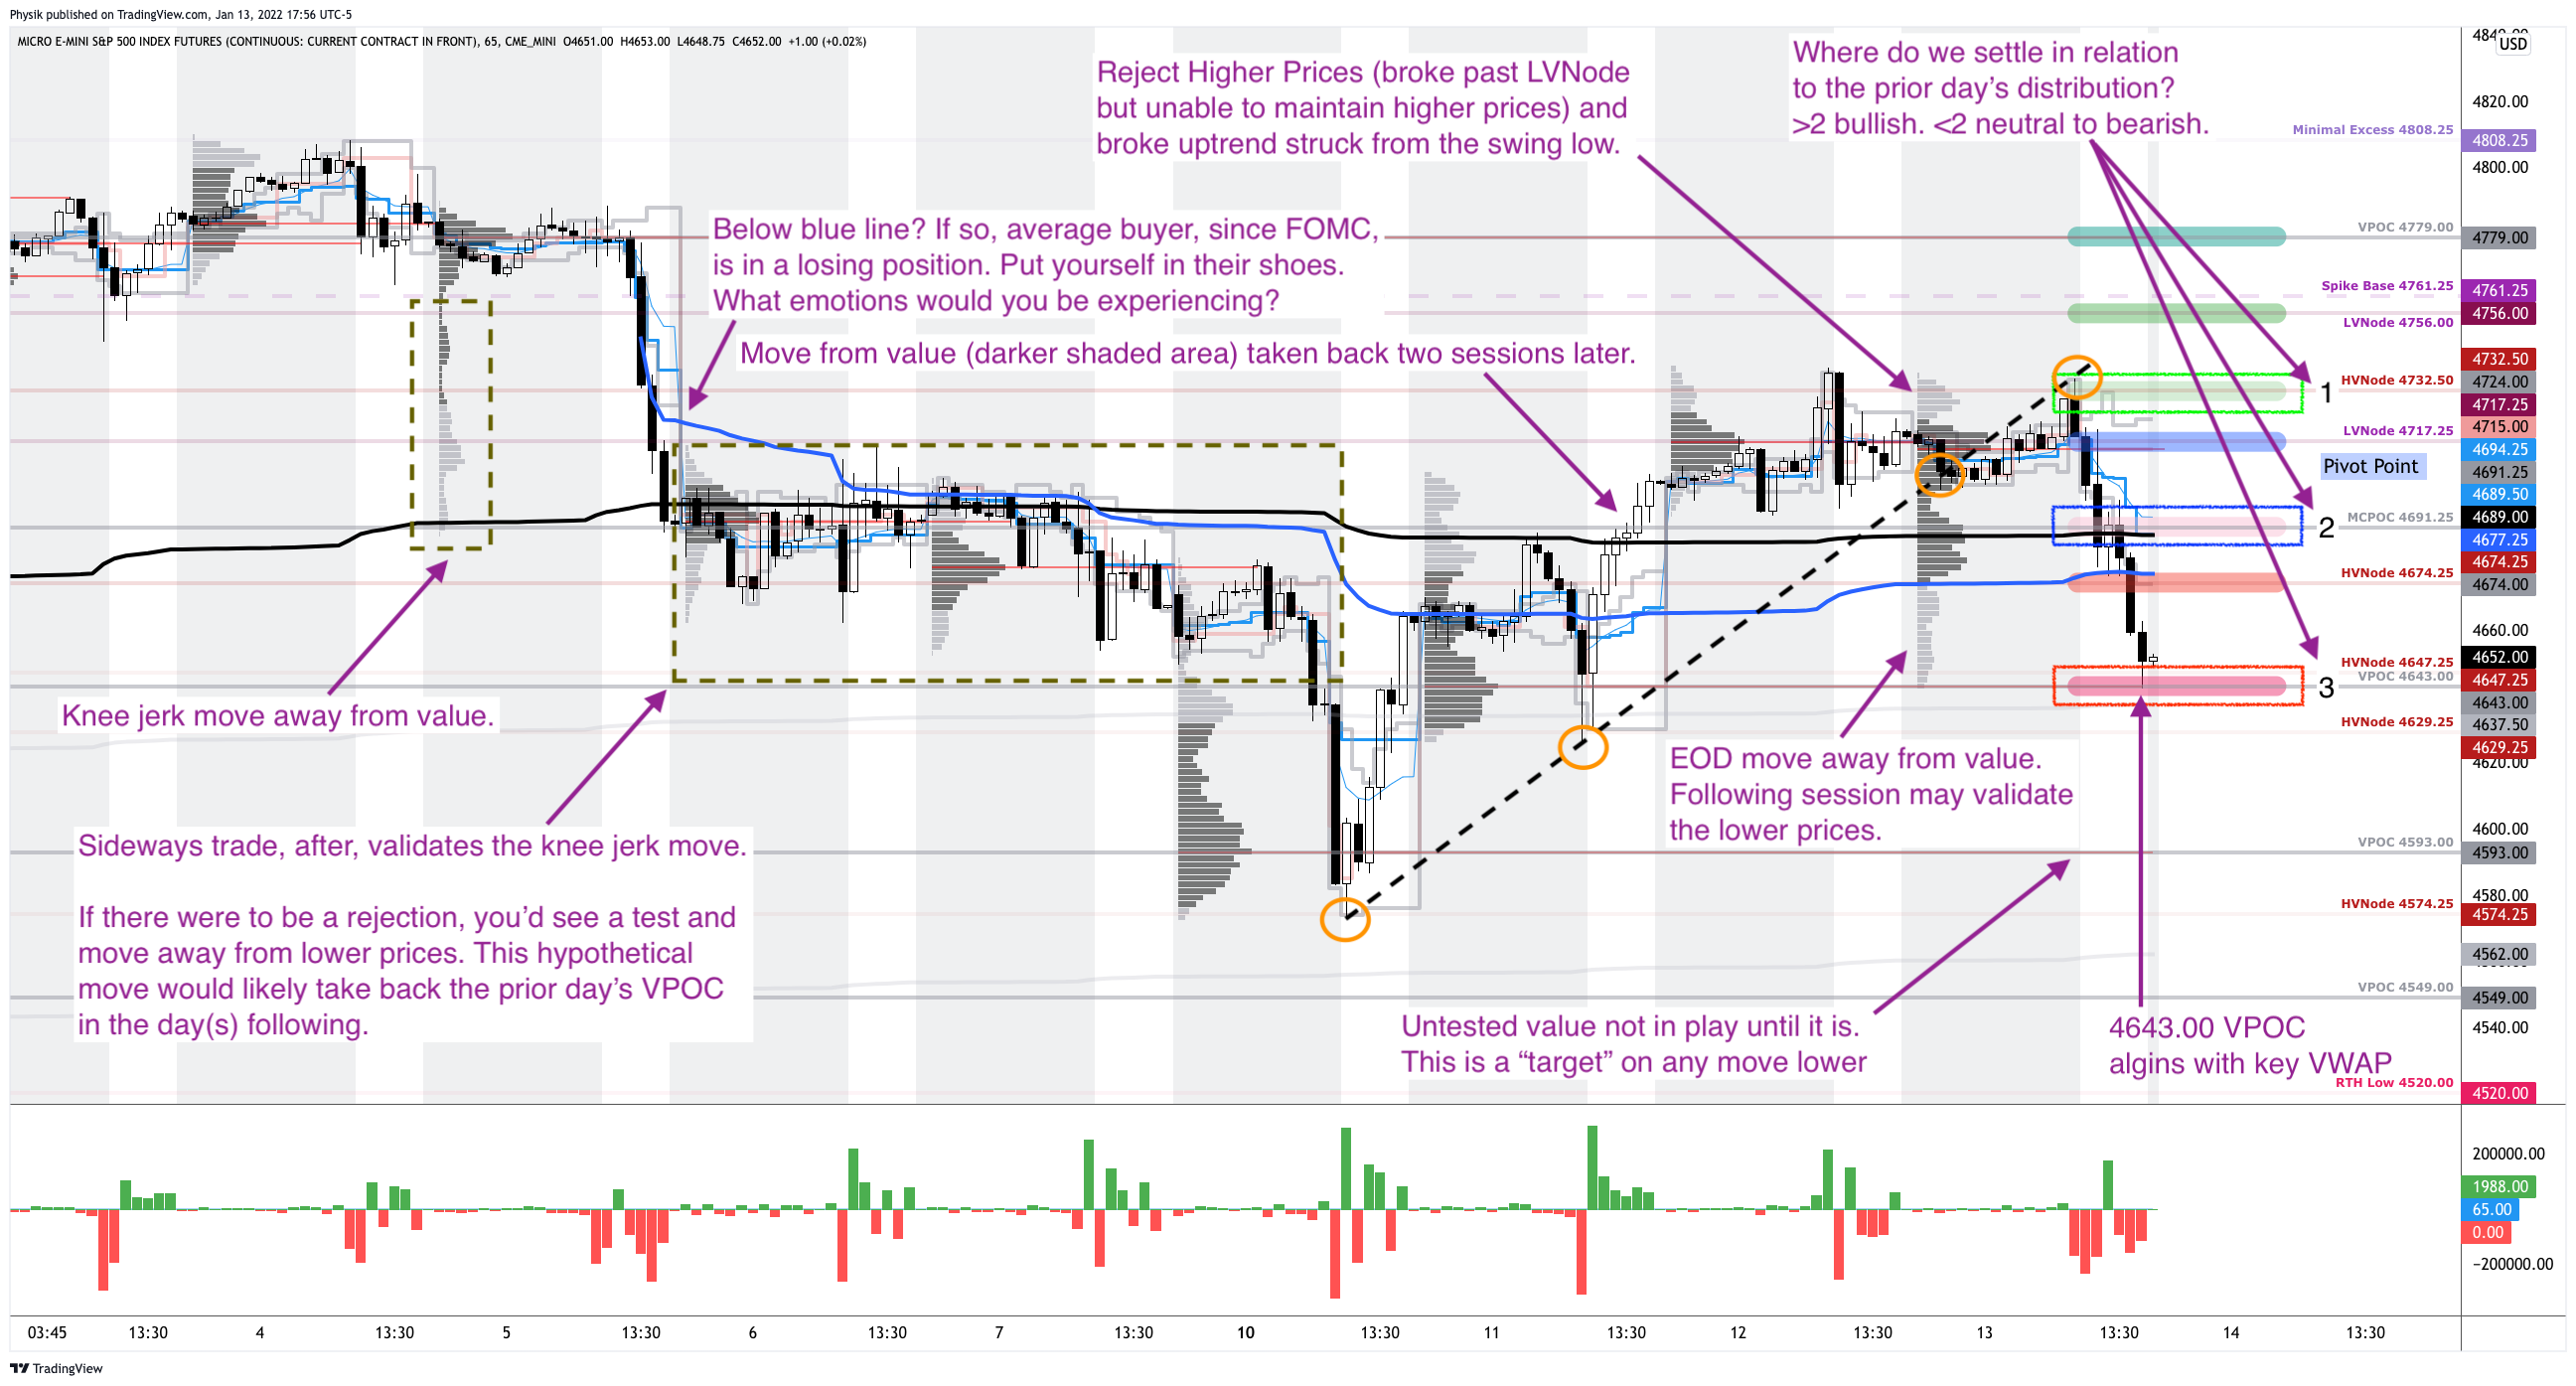
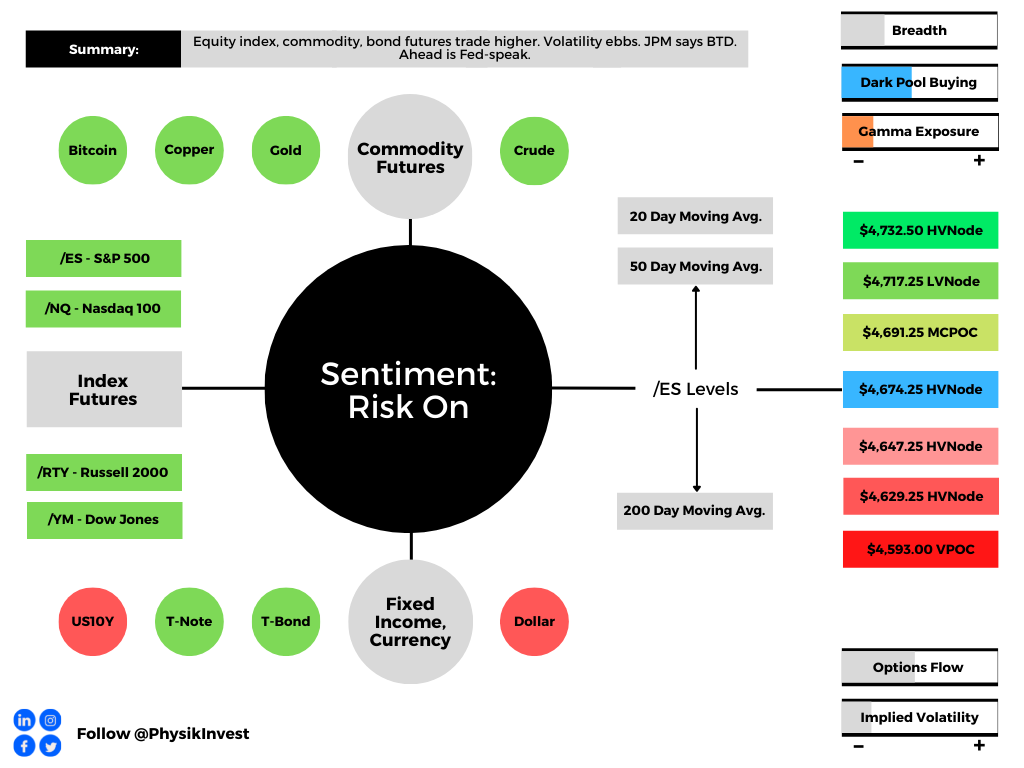
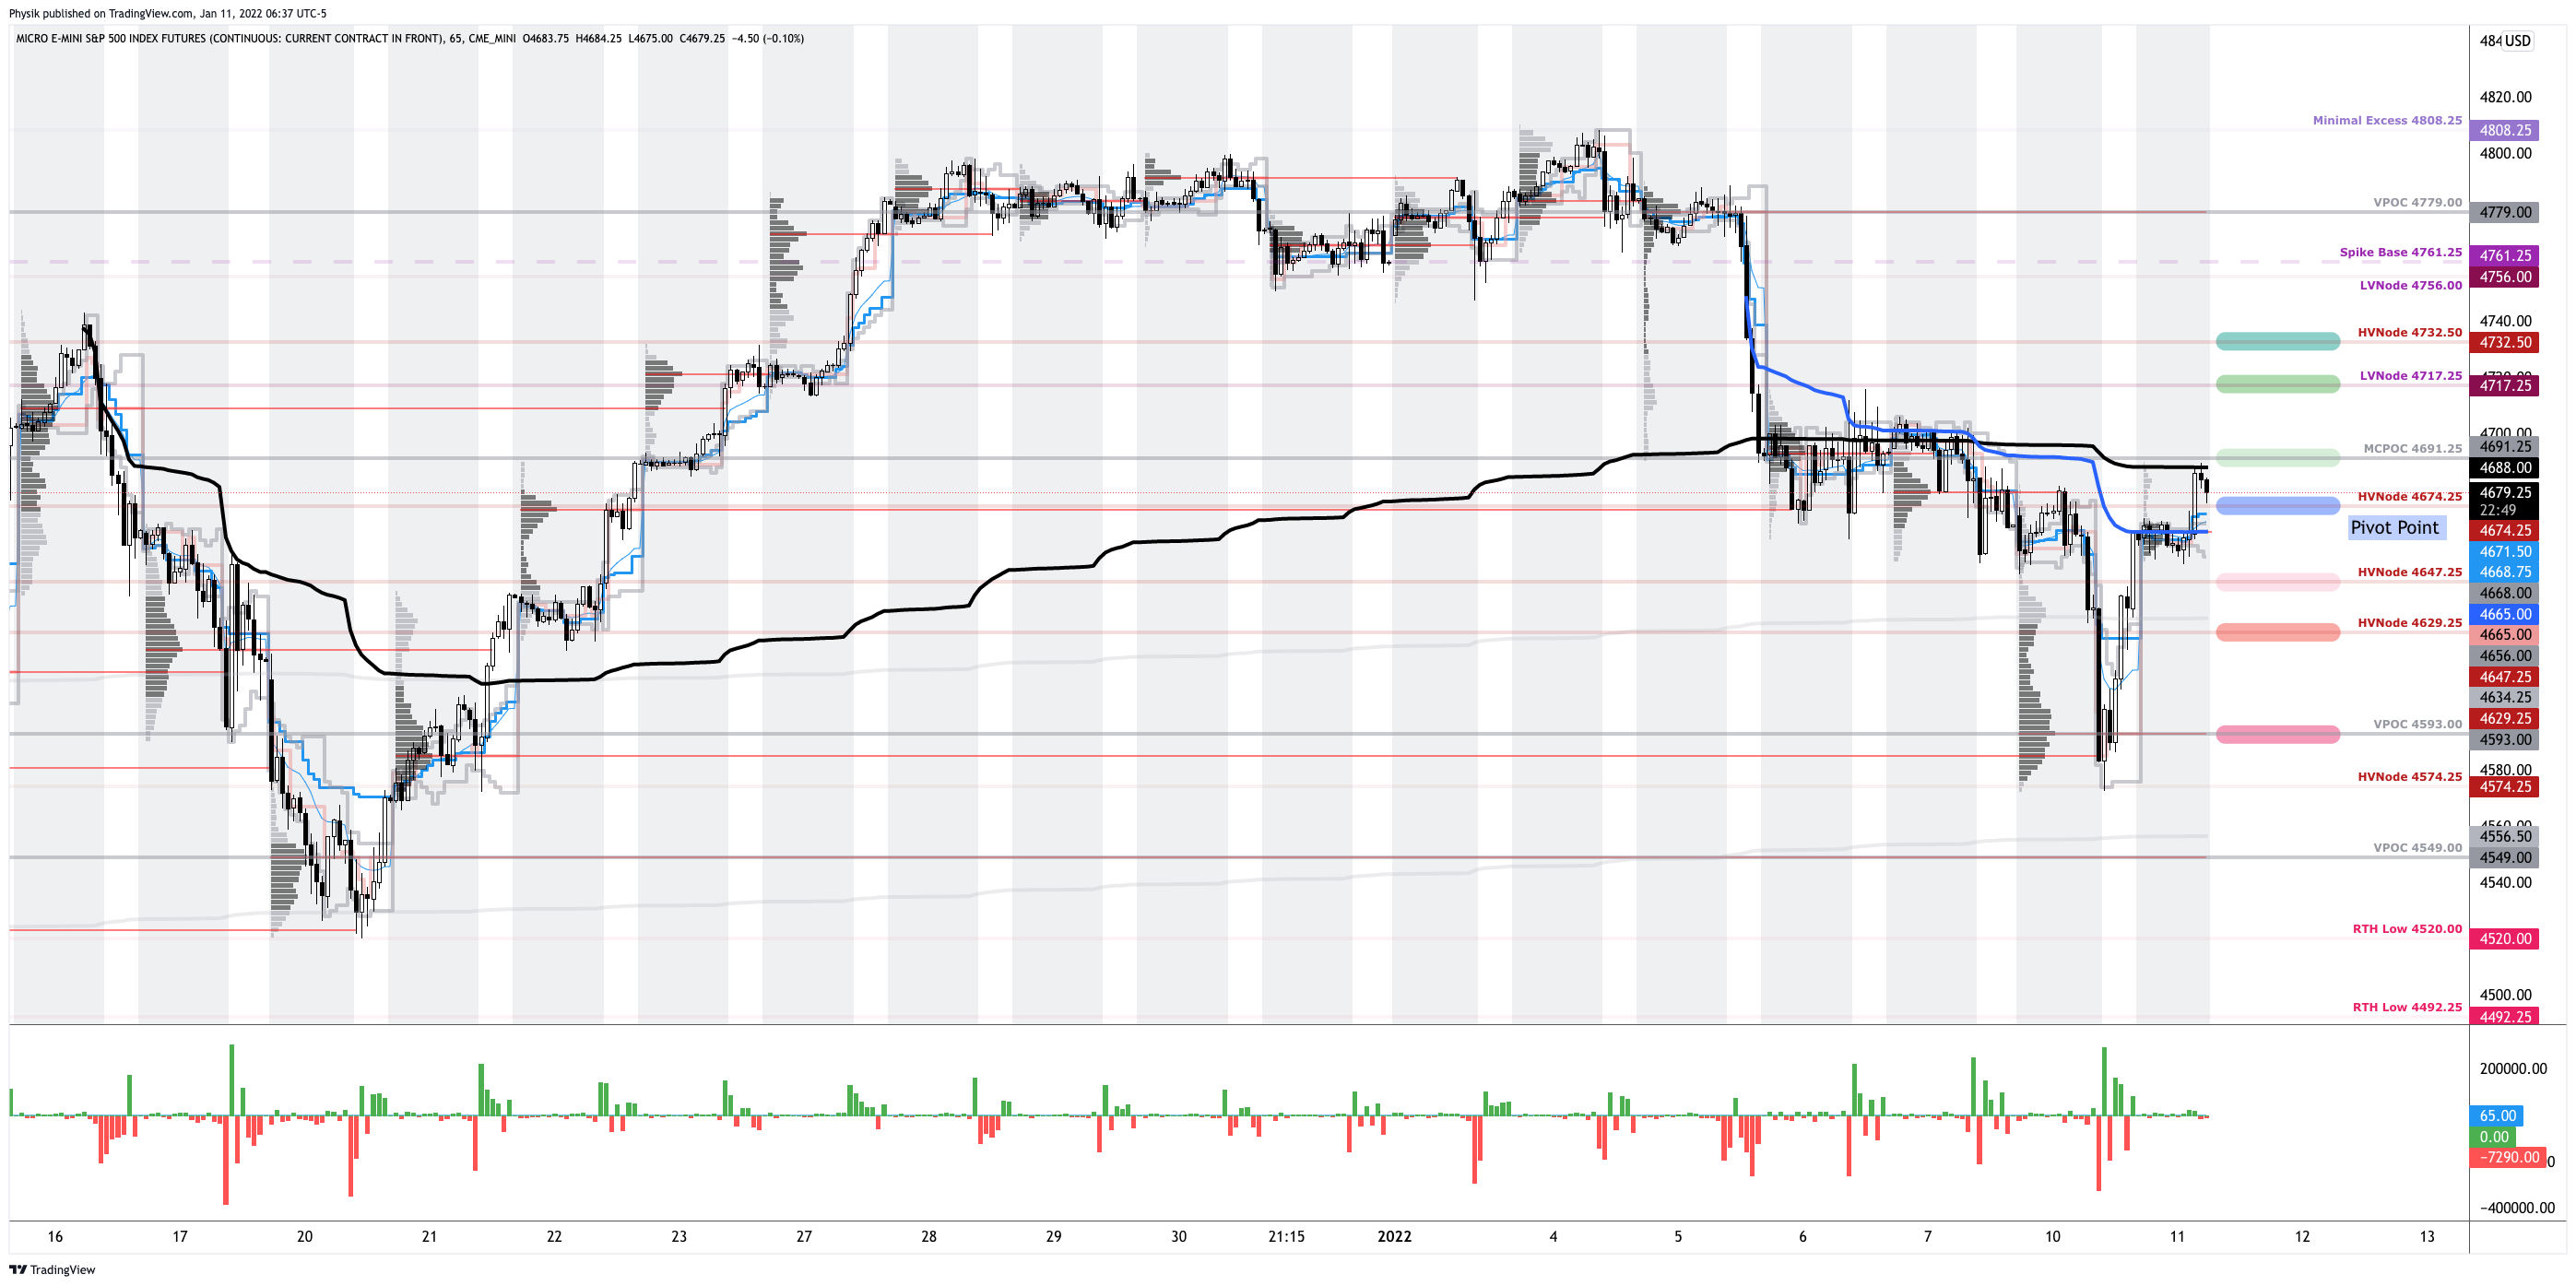
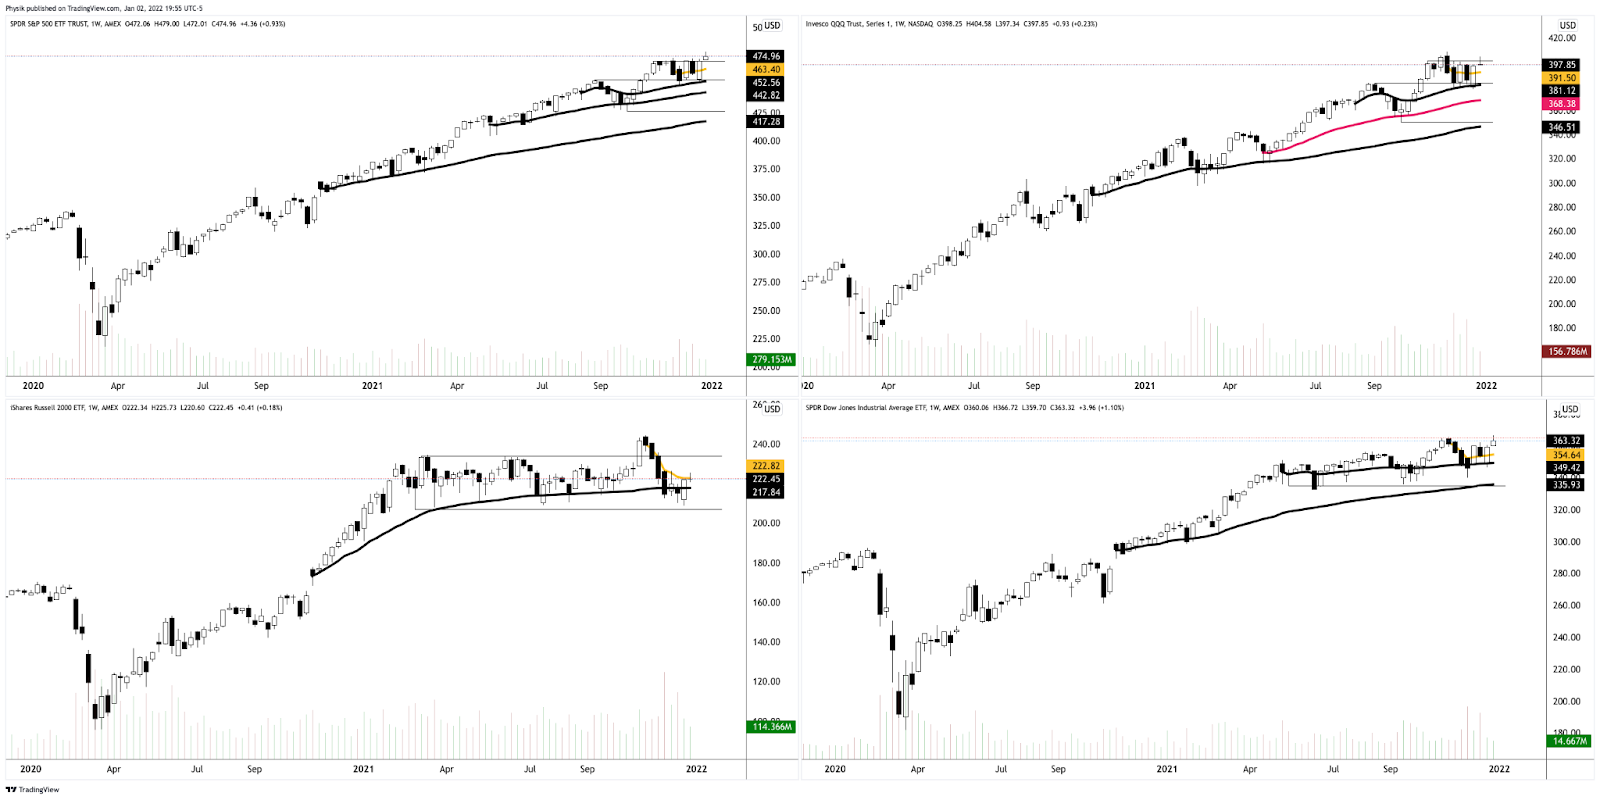
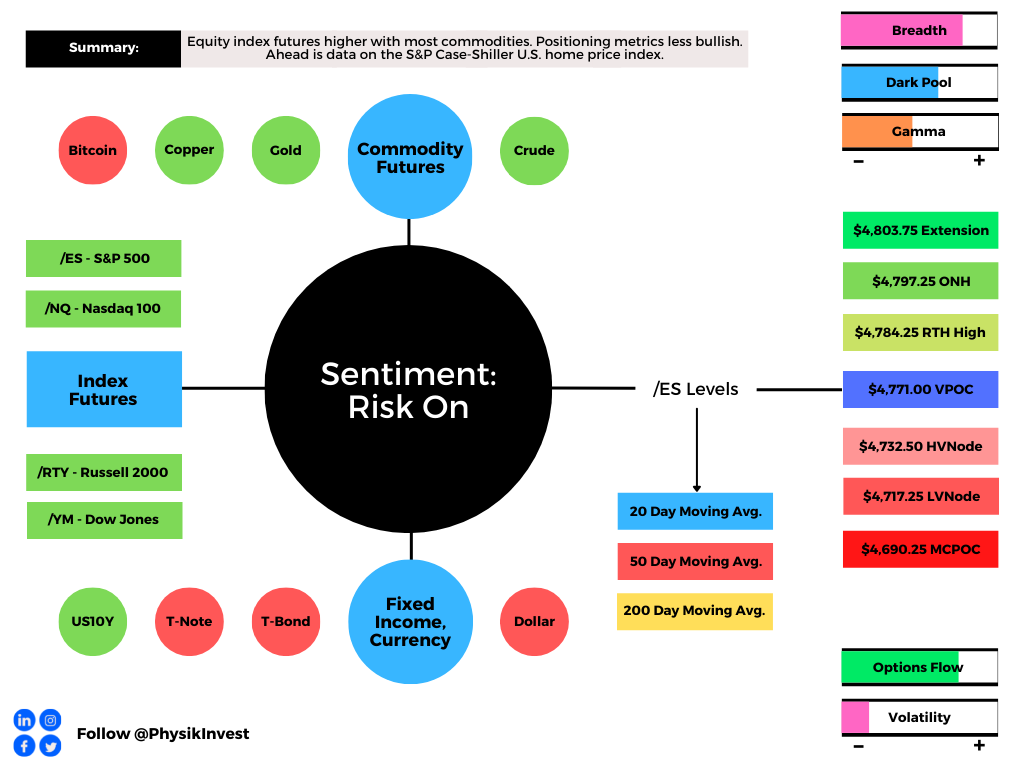
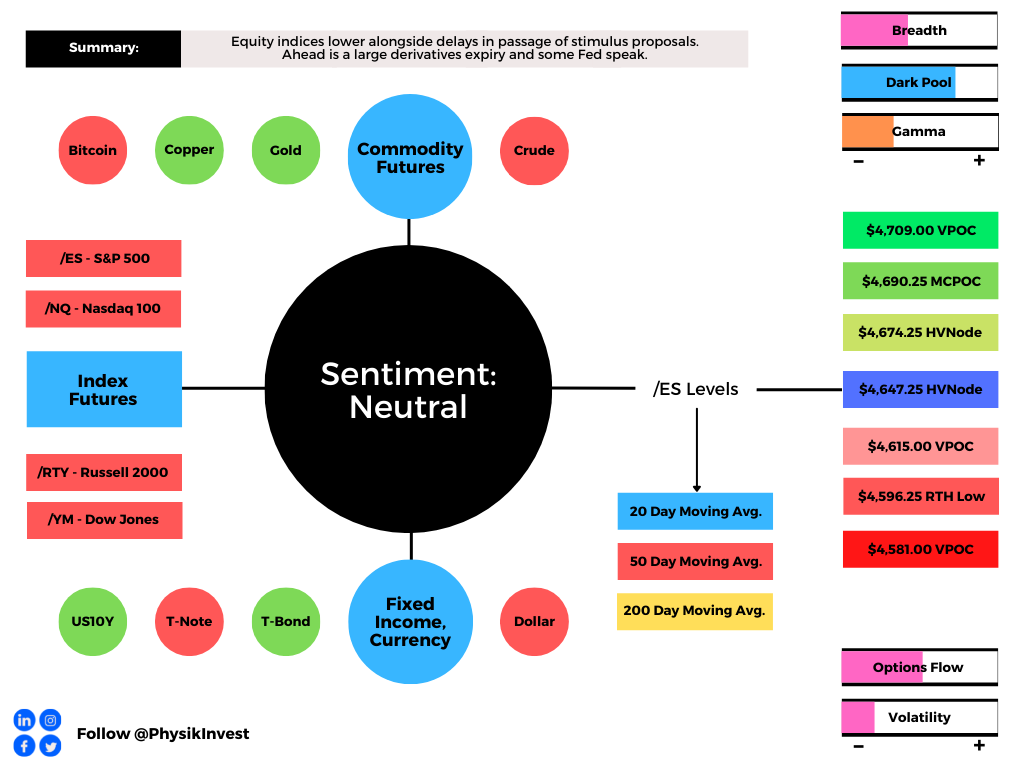
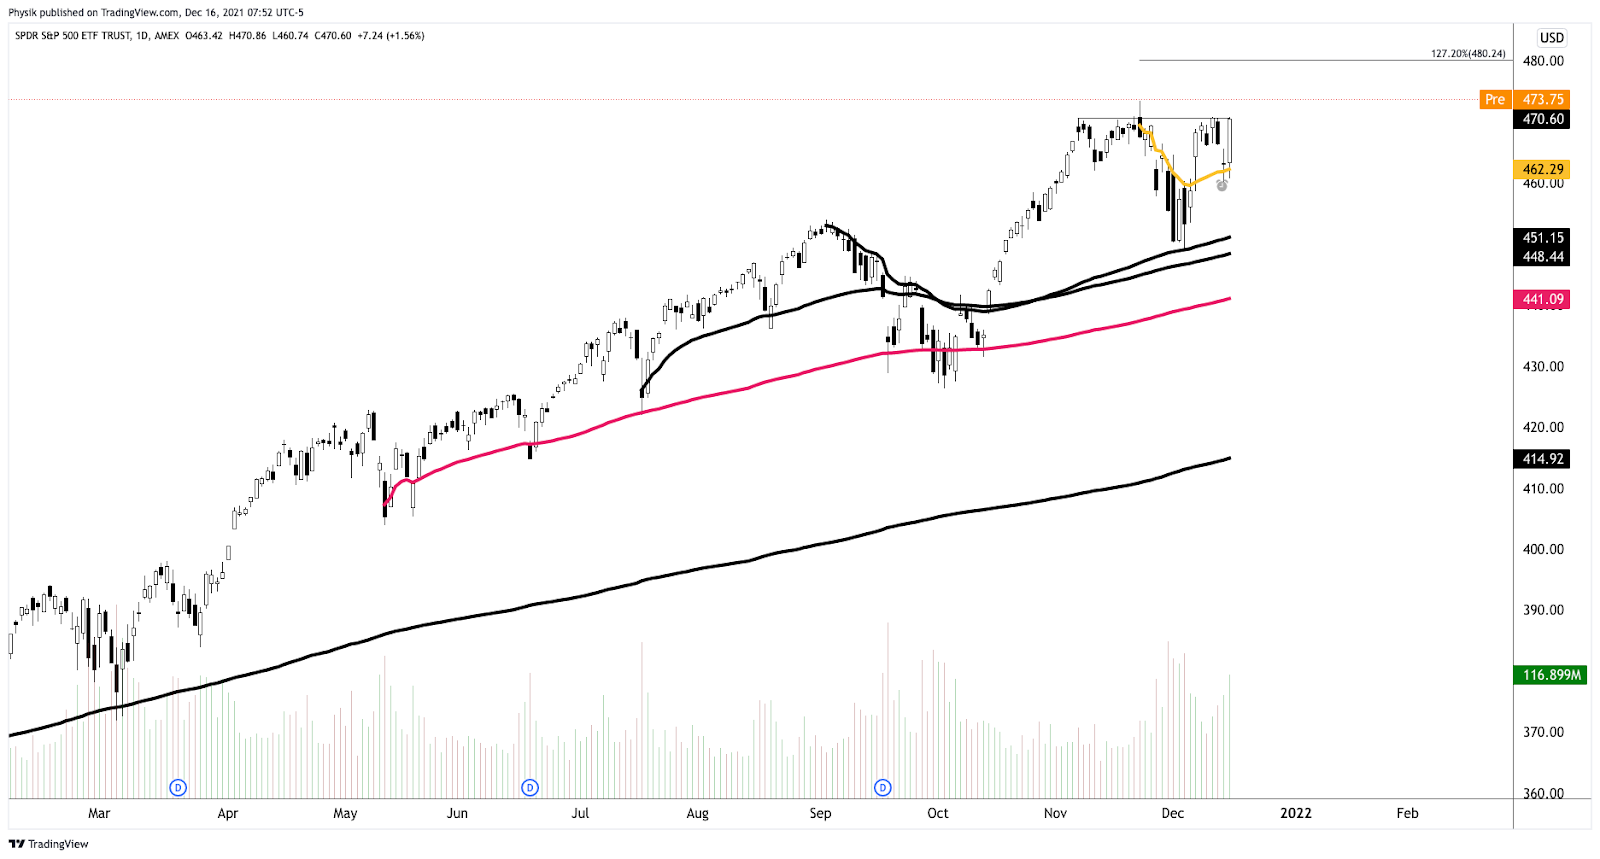
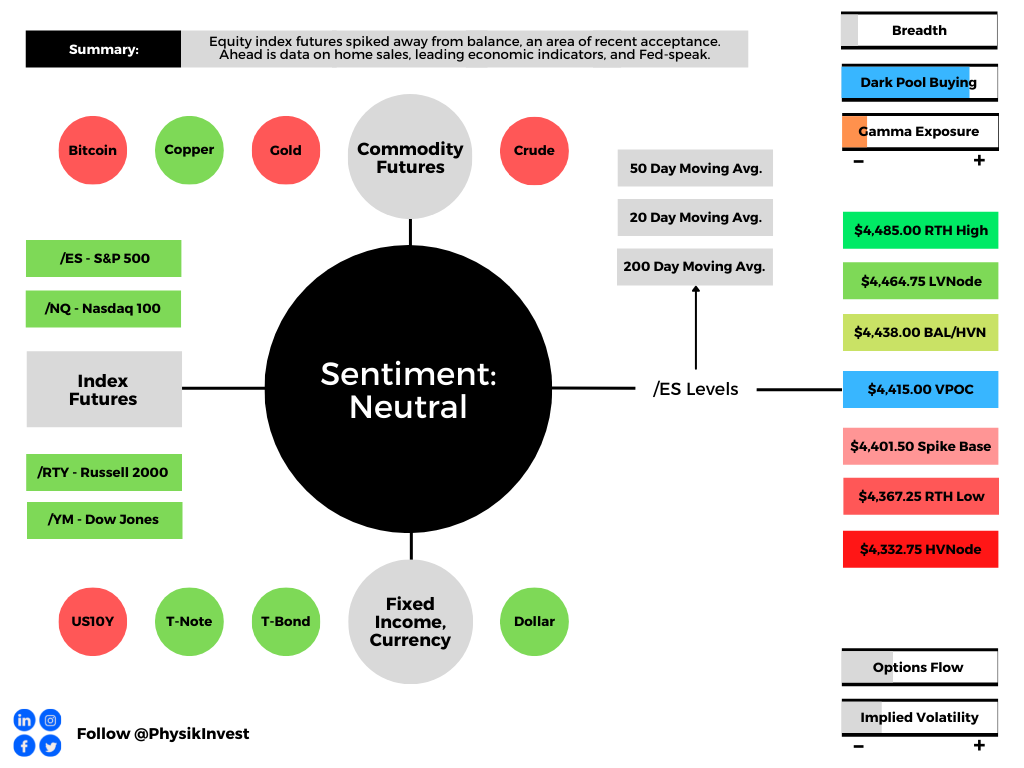
Technical: As of 6:30 AM ET, Friday’s regular session (9:30 AM – 4:00 PM ET), in the S&P 500, will likely open in the middle part of a positively skewed overnight inventory, inside of prior-range and -value, suggesting a limited potential for immediate directional opportunity.
Spikes: Spikes mark the beginning of a break from value. Spikes higher (lower) are validated by trade at or above (below) the spike base (i.e., the origin of the spike).
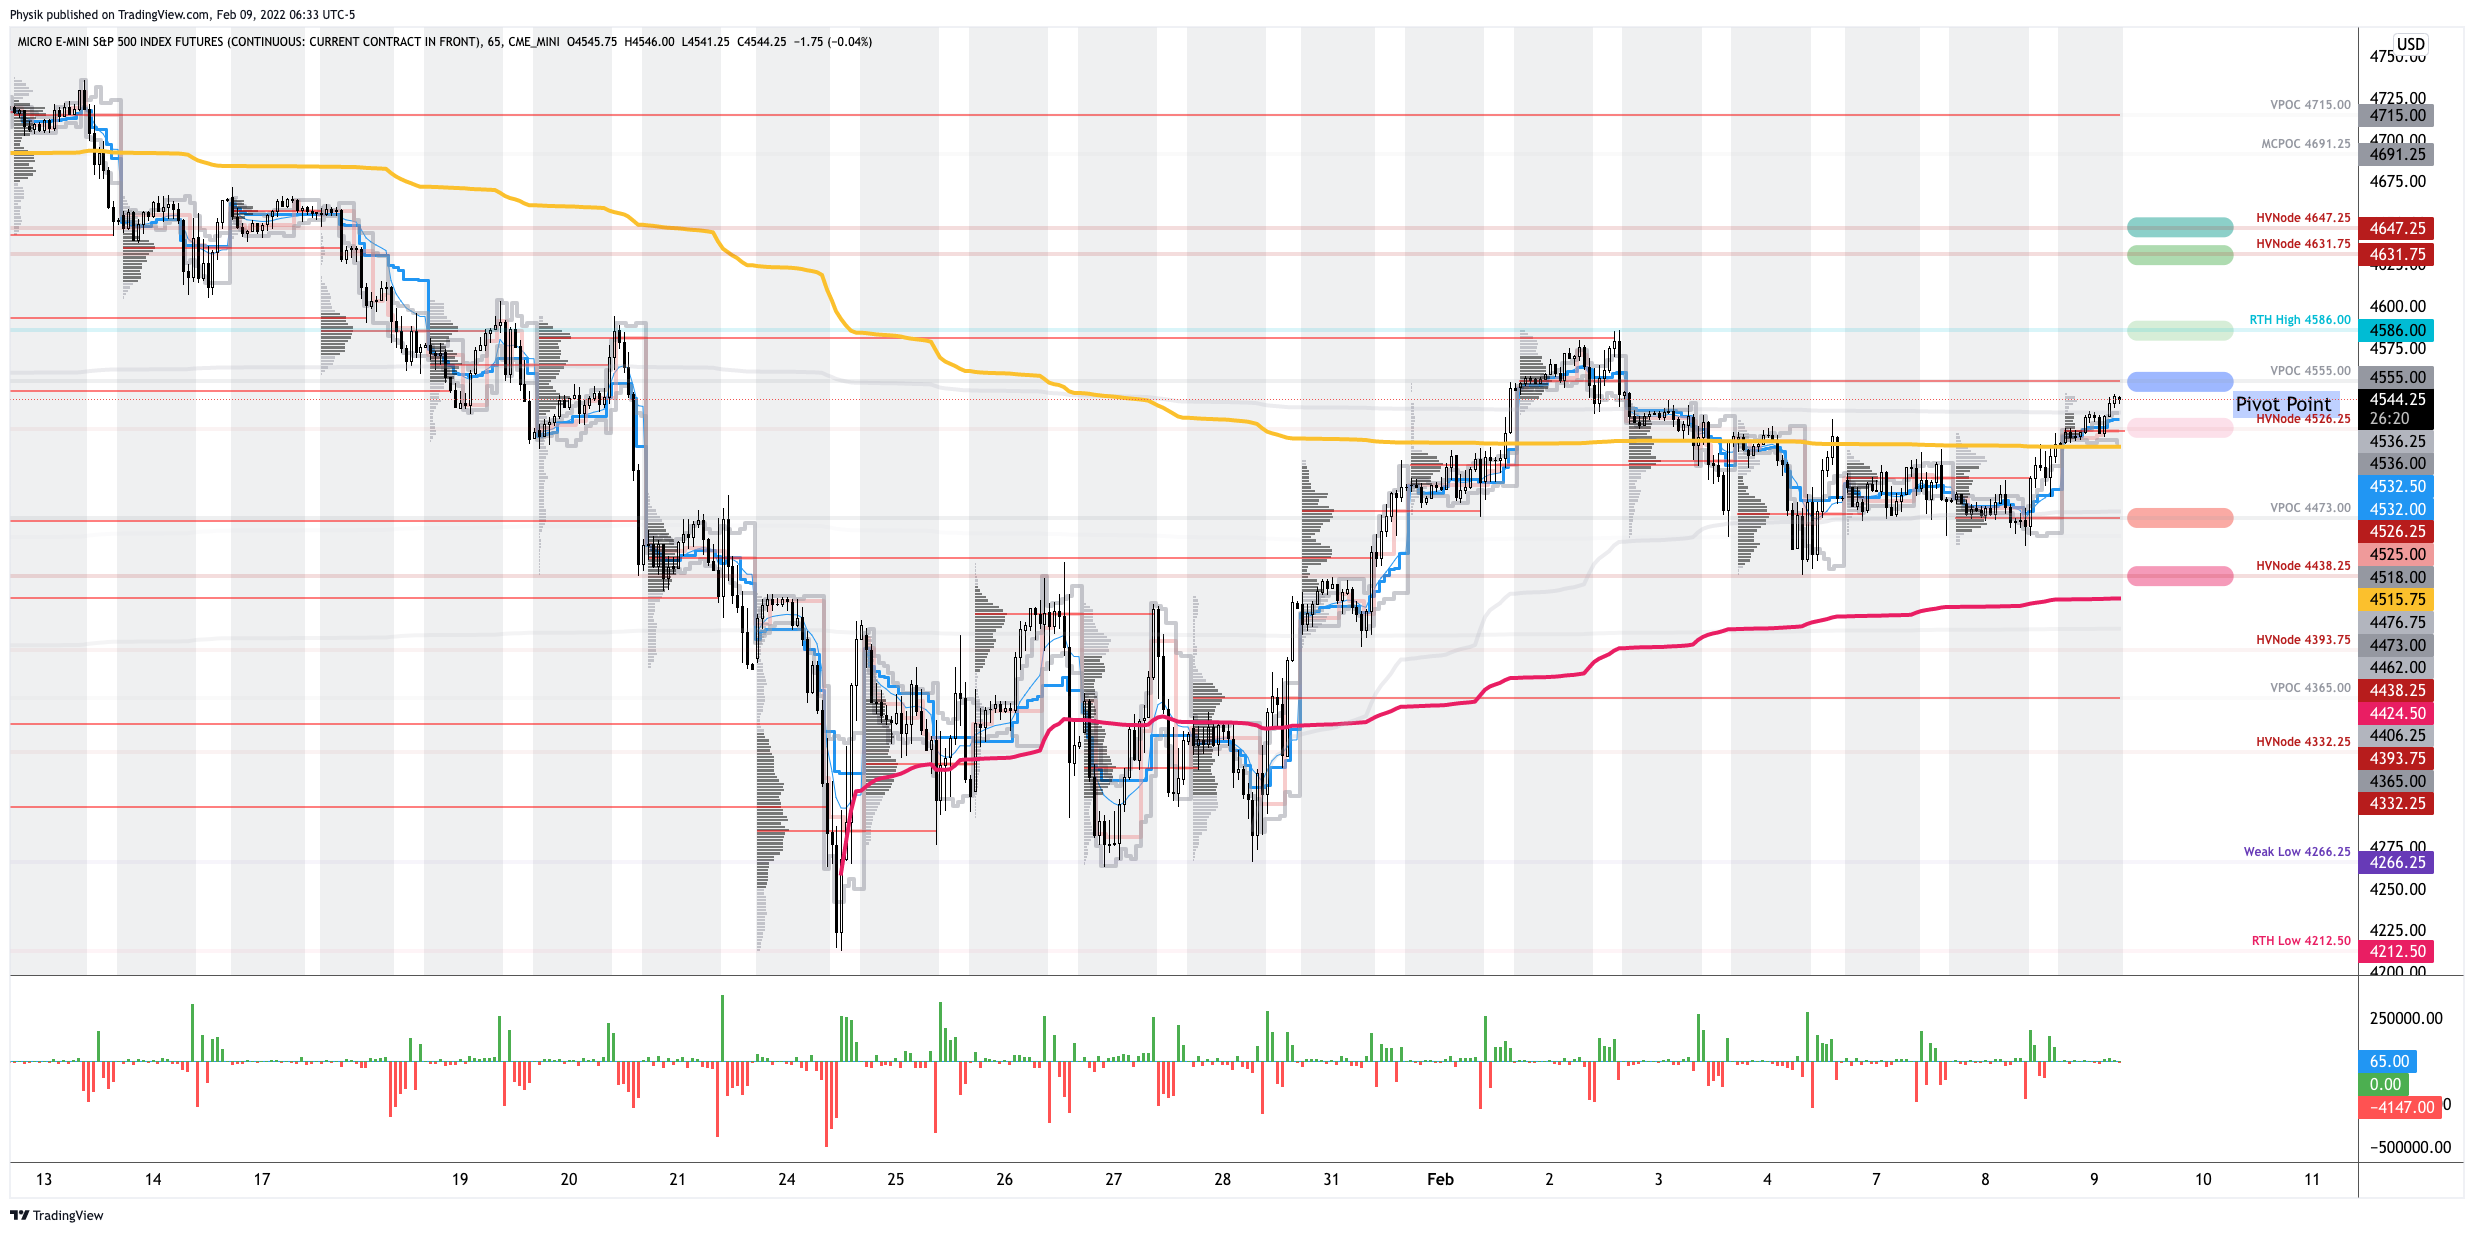
In the best case, the S&P 500 trades higher; activity above the $4,415.00 untested point of control (VPOC) puts in play the $4,438.00 key response area (balance boundary and high volume area). Initiative trade beyond the key response area could reach as high as the $4,464.75 low volume area (LVNode) and $4,485.00 regular trade high (RTH High), or higher.
In the worst case, the S&P 500 trades lower; activity below the $4,415.00 VPOC puts in play the $4,401.50 spike base. Initiative trade beyond the spike base could reach as low as the $4,367.25 regular trade low (RTH Low) and $4,332.75 high volume area (HVNode), or lower.
Click here to load today’s key levels into the web-based TradingView charting platform. Note that all levels are derived using the 65-minute timeframe. New links are produced, daily.

Definitions
Overnight Rally Highs (Lows): Typically, there is a low historical probability associated with overnight rally-highs (lows) ending the upside (downside) discovery process.
Volume Areas: A structurally sound market will build on areas of high volume (HVNodes). Should the market trend for long periods of time, it will lack sound structure, identified as low volume areas (LVNodes). LVNodes denote directional conviction and ought to offer support on any test.
If participants were to auction and find acceptance into areas of prior low volume (LVNodes), then future discovery ought to be volatile and quick as participants look to HVNodes for favorable entry or exit.
POCs: POCs are valuable as they denote areas where two-sided trade was most prevalent in a prior day session. Participants will respond to future tests of value as they offer favorable entry and exit.
Options Expiration (OPEX): Traditionally, option expiries mark an end to pinning (i.e, the theory that market makers and institutions short options move stocks to the point where the greatest dollar value of contracts will expire) and the reduction dealer gamma exposure. In recent history, this reset in dealer positioning has been front-run; prior, there was an increase in volatility after the removal of large options positions and associated hedging.
Balance (Two-Timeframe Or Bracket): Rotational trade that denotes current prices offer favorable entry and exit. Balance-areas make it easy to spot a change in the market (i.e., the transition from two-time frame trade, or balance, to one-time frame trade, or trend).
Modus operandi is responsive trade (i.e., fade the edges), rather than initiative trade (i.e., play the break).
Volume-Weighted Average Prices (VWAPs): A metric highly regarded by chief investment officers, among other participants, for quality of trade. Additionally, liquidity algorithms are benchmarked and programmed to buy and sell around VWAPs.
About
After years of self-education, strategy development, mentorship, and trial-and-error, Renato Leonard Capelj began trading full-time and founded Physik Invest to detail his methods, research, and performance in the markets.
Capelj is also a Benzinga finance and technology reporter interviewing the likes of Shark Tank’s Kevin O’Leary, JC2 Ventures’ John Chambers, FTX’s Sam Bankman-Fried, and ARK Invest’s Catherine Wood, as well as a SpotGamma contributor developing insights around impactful options market dynamics.
Disclaimer
Physik Invest does not carry the right to provide advice.
In no way should the materials herein be construed as advice. Derivatives carry a substantial risk of loss. All content is for informational purposes only.