Bloomberg reports that if the US defaults on its debt, which could happen as soon as June 1 if President Biden and House Speaker McCarthy fail to reach a deal on raising the ceiling, homebuyer borrowing costs may surge to 8.40%. As a consequence, the typical home’s monthly payment would increase by 22.00% and cool property sales; the monthly payment on a $500,000.00 mortgage may rise to $3,800.00, compared to about $3,095.00 at the current rate of 6.30%.
In prior letters, we concluded that past monetary action made stocks less sensitive to interest rates, quoting JPMorgan Chase & Co (NYSE: JPM) strategists that the market would likely continue to “artificially suppress perceptions of fundamental macro risks,” barring surprises like a debt limit breach.
With a debt limit breach a potential reality, Moody’s Corporation (NYSE: MCO) says a breach may compound recessionary pressures; expect a drop in equities, a volatility spike, and a disruption of funding markets.
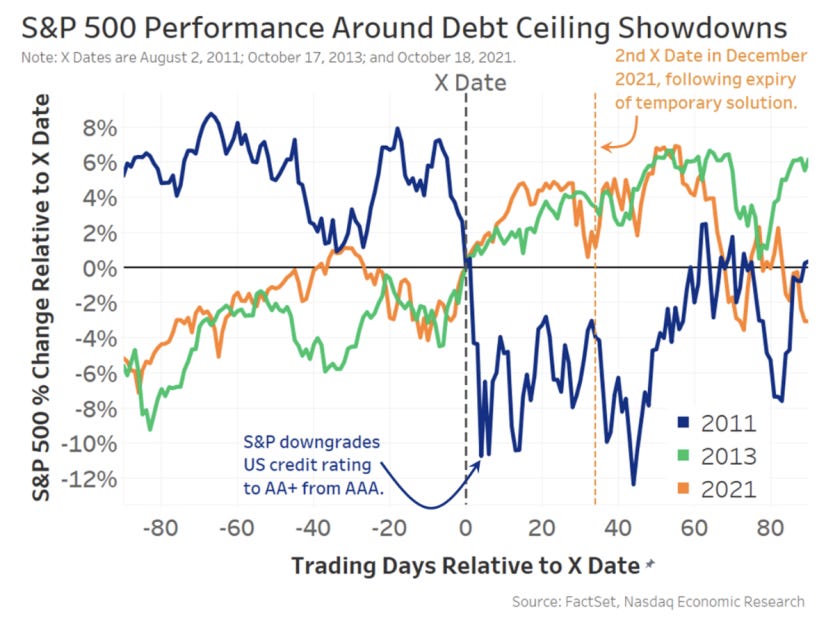
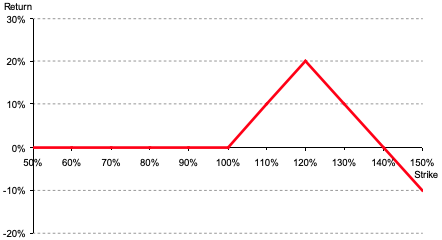
Graphic: Retrieved from Nasdaq Inc (NASDAQ: NDAQ).
“Data show that short-term bonds have the most predictable reaction – with interest rates and default insurance costs rising significantly – before quickly returning to normal after the uncertainty has passed,” Nasdaq’s Phil Mackintosh writes. “In reality, a crisis was averted in all [prior] cases, with the government able to increase or suspend the debt limit before the X Date.”
Notwithstanding the short-term uncertainty regarding the debt limit, Bank of America Corporation (NYSE: BAC) is adamant there will be a recession that manifests cracks in “credit and tech,” similar to the situation in 2008. BAC sees the bubble in technology, media, and telecommunication stocks soon deflating as they face higher-for-longer interest rates and a tempered earnings outlook.
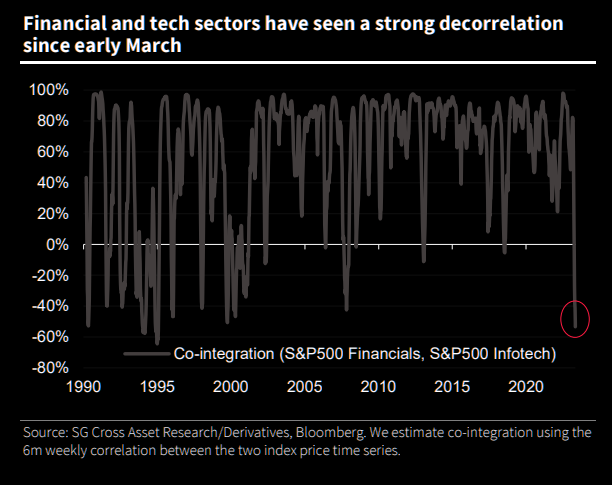
Graphic: Retrieved from Societe Generale SA (OTC: SCGLY) via The Market Ear.While investors poured $3.8 billion into technology stocks in the week through May 10, $2.1 billion was pulled from financial equities, the most significant redemption since May 2022.
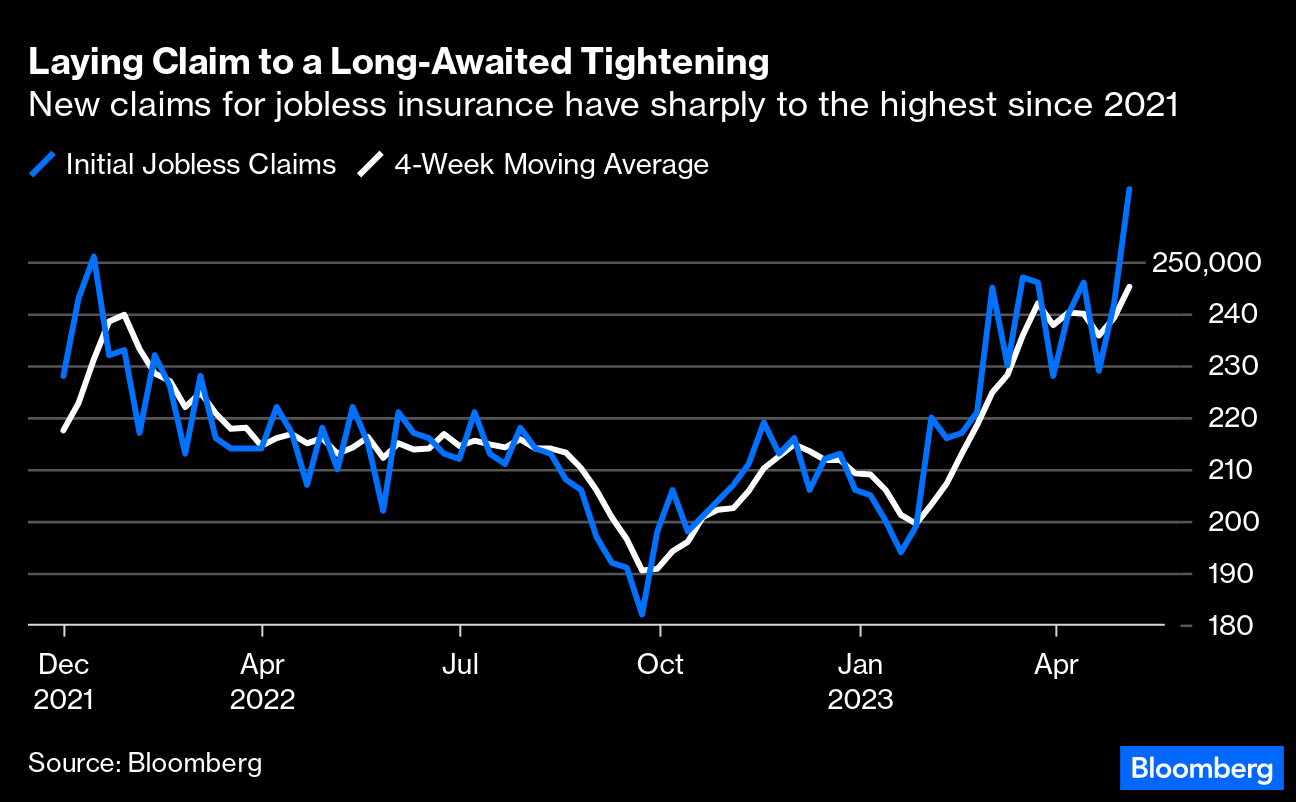
Compounding the recessionary pressures BAC sees, EPB Research adds, are banks’ funding costs, which have increased too much relative to prevailing asset yields. If the spread drops too low, bank lending tightens, and a recession occurs. Also, other data suggests tightening is finally starting to have an impact. Bloomberg reports that initial claims for unemployment insurance are on the rise. There has been a drop in overall wage growth to 5.1% last month, too, the biggest fall in the rate of increase since the series began.
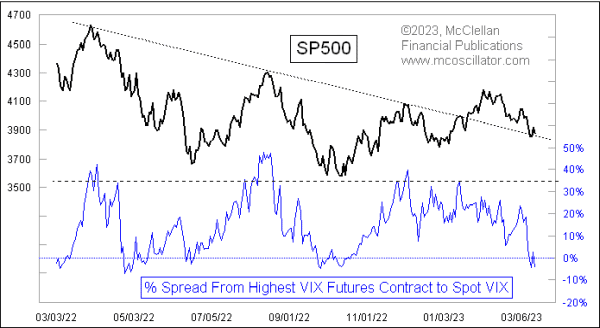
Separately, breadth divergences are becoming more frequent, with the Daily Advance-Decline (A-D) Line for the NYSE showing lower highs while DJIA and S&P 500 show slightly higher highs, McClellan Financial Publications writes. The bond CEF A-D Line is also showing a bearish divergence, indicating a shift in liquidity that could weigh on other stocks, including the big-cap stocks holding up the SP500 and the Nasdaq 100.
Graphic: Retrieved from McClellan Financial Publications.
McClellan adds that the A-D Line originated from data collected by Leonard Ayres and James Hughes in the 1920s. It was made famous in 1962.
Graphic: Retrieved from McClellan Financial Publications.
That’s when Joe Granville and Richard Russell commented on it in their newsletters, noting how it had shown a big bearish divergence ahead of the 1962 bear market.
Graphic: Retrieved from McClellan Financial Publications.
To end, the economic calendar next week is focused on manufacturing and housing. The housing market is showing some downside risk for existing-home sales for April due to a weak reading on pending sales, MCO says, adding that housing permits and starts are expected to move sideways as builders remain cautious amid high-interest rates and economic uncertainty. Regional Fed surveys in New York and Philadelphia will provide the first read on factory activity for May, with little hope for a significant rebound in manufacturing. Jobless claims will be critical, as continuing the recent trend would likely signal a rapid deceleration in monthly job gains. Other critical data to be released include retail sales, industrial production, and business inventories.
Should readers wish to hedge the debt ceiling debacle, June call options on the Cboe Volatility Index appear attractive, some suggest. But, with RVOL as low as it is, owning optionality is not generally warranted. The risk is lower lows in volatility.
Welcome to the Daily Brief by Physik Invest, a soon-to-launch research, consulting, trading, and asset management solutions provider. Learn about our origin story here, and consider subscribing for daily updates on the critical contexts that could lend to future market movement.
Separately, please don’t use this free letter as advice; all content is for informational purposes, and derivatives carry a substantial risk of loss. At this time, Capelj and Physik Invest, non-professional advisors, will never solicit others for capital or collect fees and disbursements. Separately, you may view this letter’s content calendar at this link.
Keeping it brief today, as well. PS: Almost ready to go live with that detailed report!
Half of the S&P 500 (INDEX: SPX) is scheduled to report earnings in the next weeks, and this will help investors further validate the index’s recent strength and tameness driven in part by “liquidity turning higher,” early solid earnings reports, the resolution of the bank turmoil, and expectations of “swift cuts by the Fed” later this year.
Aside from the debt ceiling issue, if new data confirm a growing consensus that the economy could slow and stay slow for a while, markets may endure some upset.
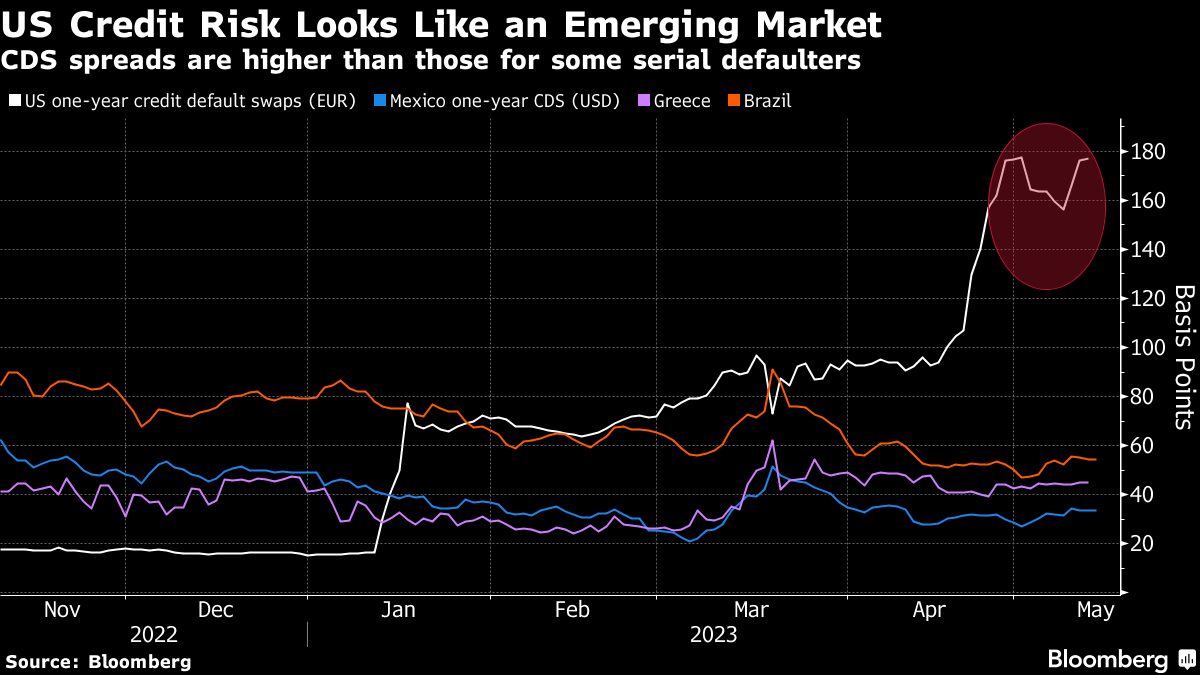
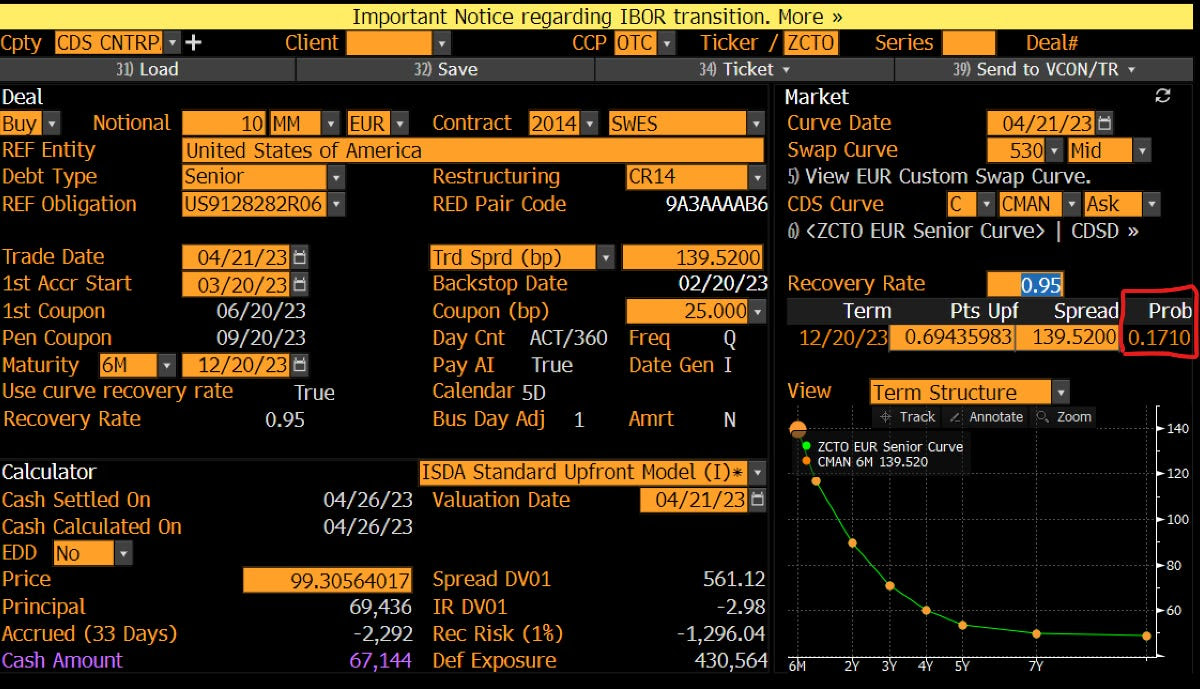
Graphic: Retrieved from Bloomberg via Tier1Alpha. Default probabilities are low. With a CDS of 130 and assuming a 40% recovery, the implied probability of default is 2.17% or so (130/0.6).
Anyways, the most objective thing to do is to hedge upset and the lagging effects of policy as covered in the previous two letters more deeply. Lock in protection against inflation while allocating remaining buying power to plays on equity strength that you may monetize and roll into bets on weakness later on should it be realized.
About
Welcome to the Daily Brief by Physik Invest, a soon-to-launch research, consulting, trading, and asset management solutions provider. Learn about our origin story here, and consider subscribing for daily updates on the critical contexts that could lend to future market movement.
Separately, please don’t use this free letter as advice; all content is for informational purposes, and derivatives carry a substantial risk of loss. At this time, Capelj and Physik Invest, non-professional advisors, will never solicit others for capital or collect fees and disbursements. Separately, you may view this letter’s content calendar at this link.
Physik Invest’s Daily Brief is read free by thousands of subscribers. Join this community to learn about the fundamental and technical drivers of markets.
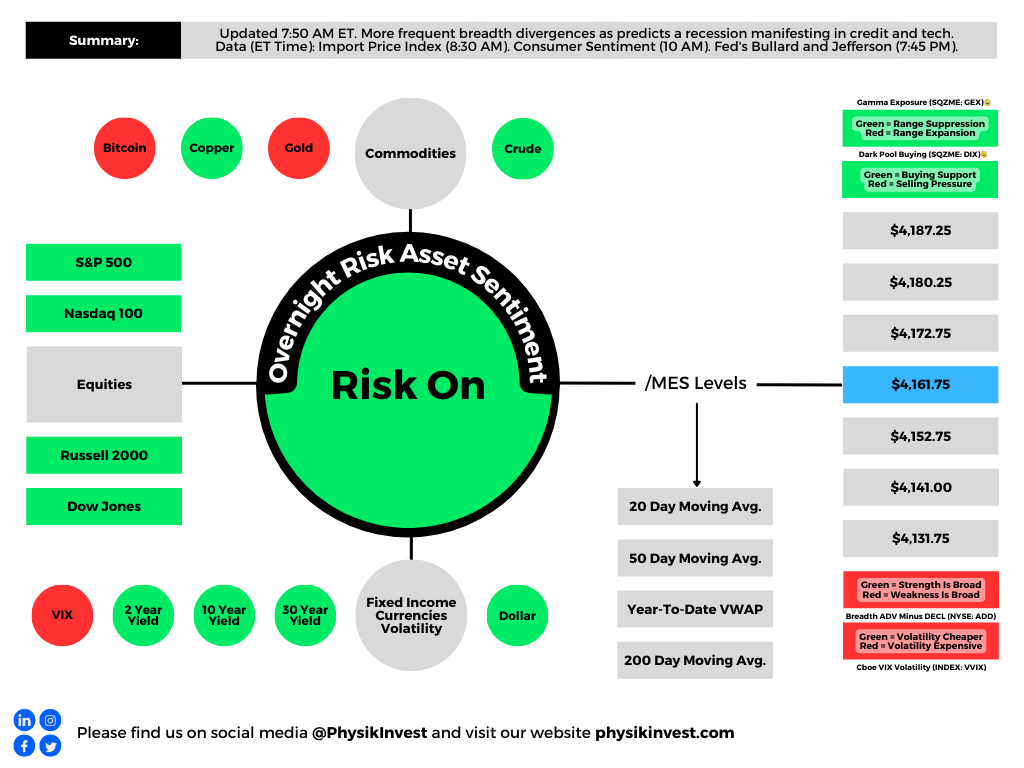
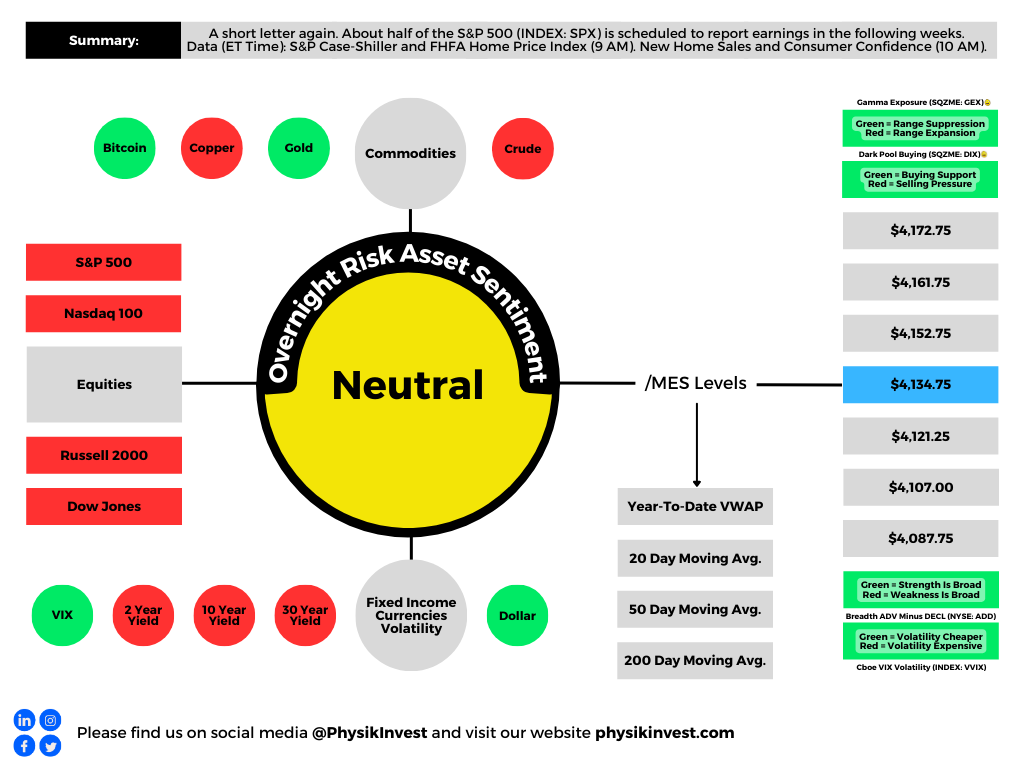
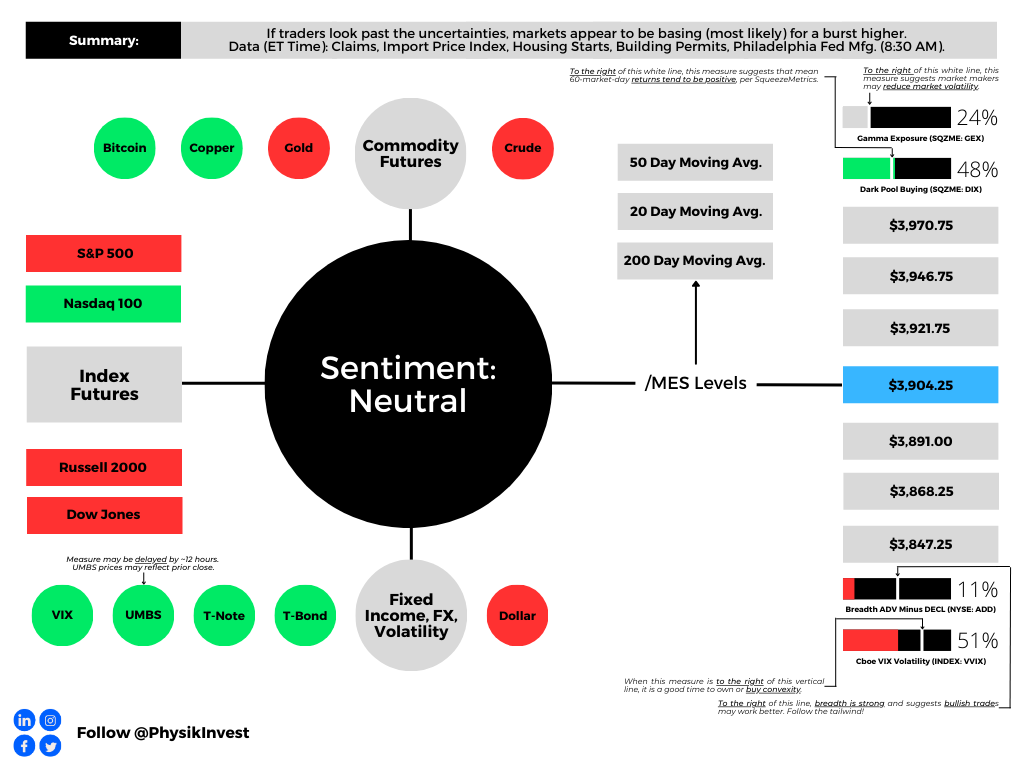
Graphic updated 7:15 AM ET. Sentiment Neutral if expected /MES open is inside of the prior day’s range. /MES levels are derived from the profile graphic at the bottom of this letter. Click here for the latest levels. SqueezeMetrics Dark Pool Index (DIX) and Gamma (GEX) with the latter calculated based on where the prior day’s reading falls with respect to the MAX and MIN of all occurrences available. A higher DIX is bullish. The lower the GEX, the more (expected) volatility. Click to learn the implications of volatility, direction, and moneyness. Breadth reflects a reading of the prior day’s NYSE Advance/Decline indicator. The CBOE VIX Volatility Index (INDEX: VVIX) reflects the attractiveness of owning volatility. UMBS prices via MND. Click here for the economic calendar.
Administrative
As previously indicated, through the end-of-this week, newsletters may be shorter due to the letter writer’s commitments. Take care!
Fundamental
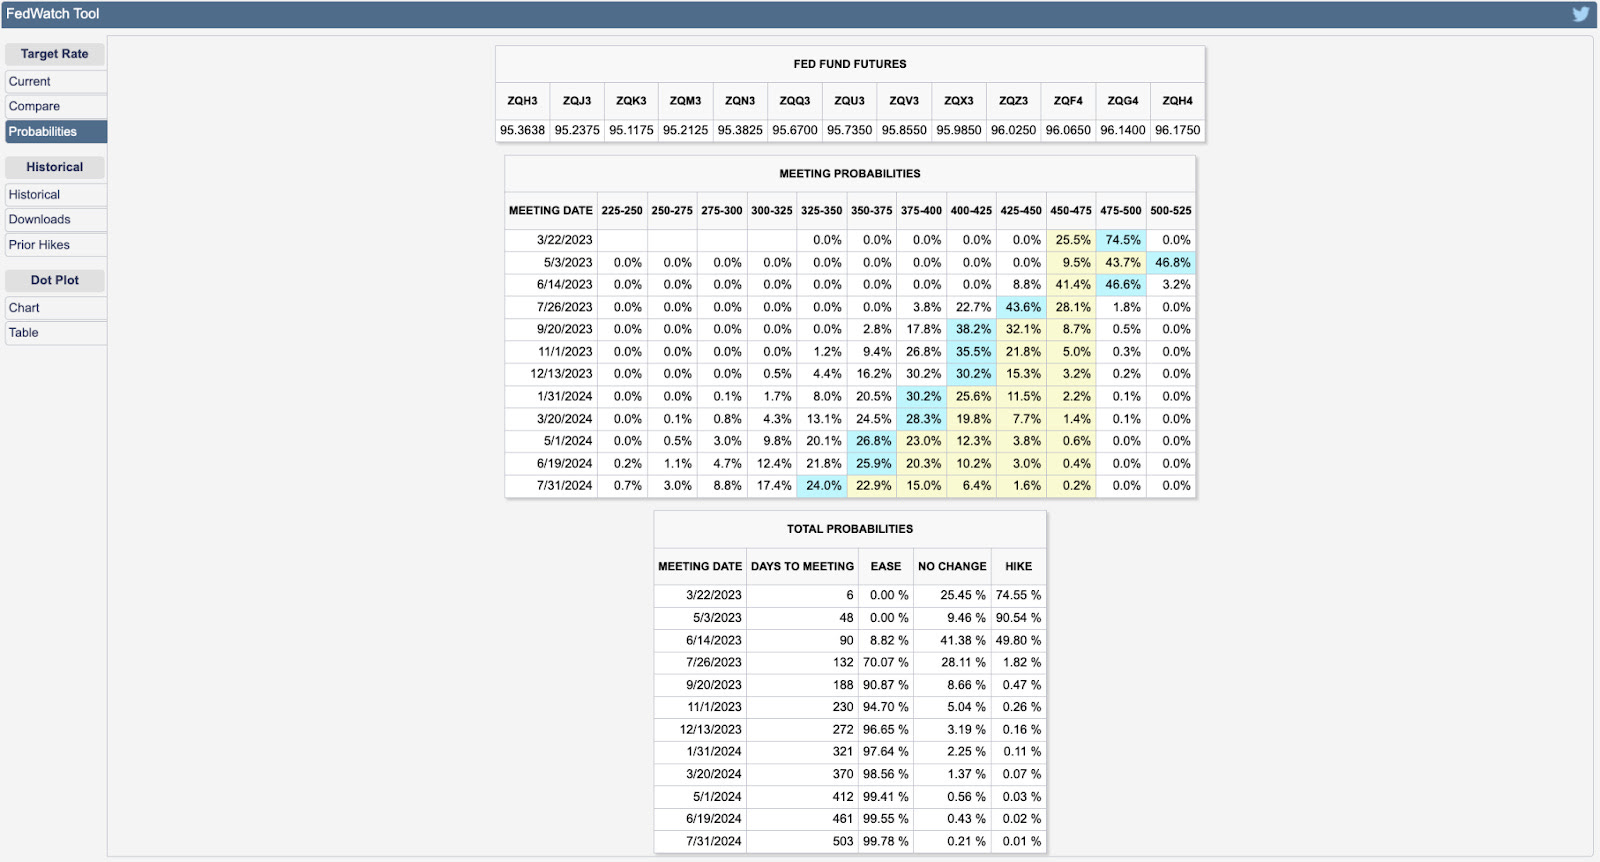
Based on the 30-Day Fed Funds (FUTURE: /ZQ), traders expect the Federal Reserve (Fed) to continue its tightening campaign with a 25 basis point rate hike at the next Federal Open Market Committee (FOMC) meeting. Following this, traders expect one more 25 basis point hike that brings the terminal or peak rate to 5.00-5.25%.
Graphic: Retrieved from CME Group Inc’s (NASDAQ: CME) FedWatch Tool.
Earlier this week, traders were pricing out hikes on financial institutions’ liquidity issues (e.g., SVB Financial Group) and data, including producer prices and retail sales, “moving in the right direction,” said Vital Knowledge’s Adam Crisafulli.
Graphic: Retrieved from Bloomberg via Gavekal Research/Macrobond. Recall that the Fed believes in needs a certain level of reserves for the proper functioning of the financial system (~$2 trillion). In 2019, banks dumped a lot of their reserves into repo to earn some extra return. When QT was about to end, there was less money in their reserves which preceded a spike in rates and a blow-up among those who needed the money the most, as explained here. Read the Daily Brief for September 20, 2022, for more.
Now, with fear of contagion ebbing on authorities’ commitment to preventing an “all-out systemic crisis,” explains Bloomberg’s John Authers, traders are again expecting a 5.00-5.25% terminal or peak rate.
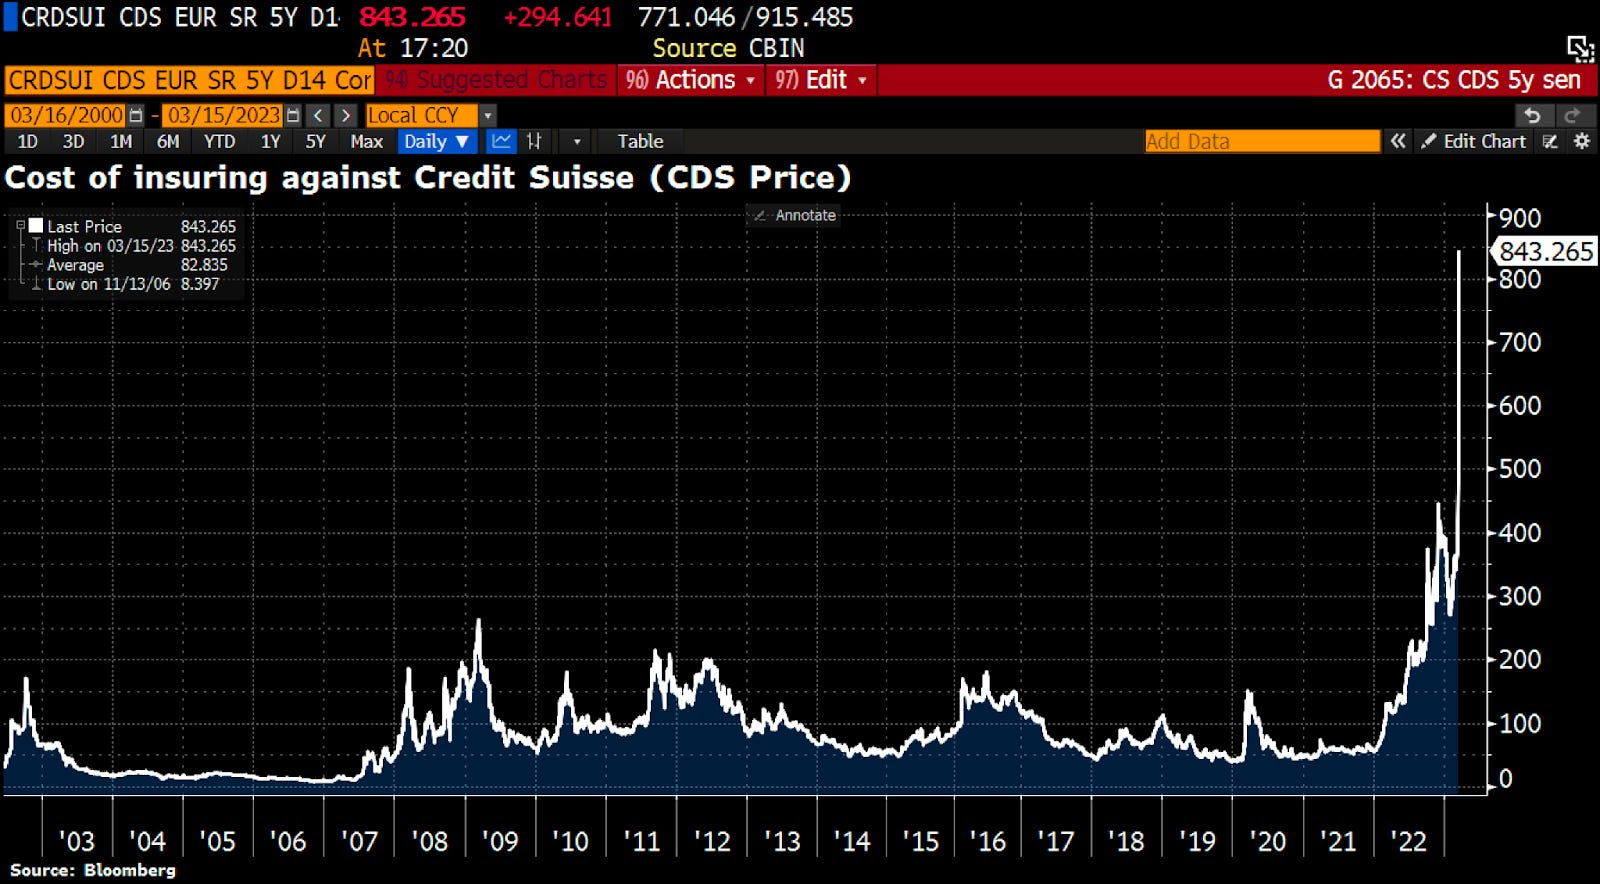
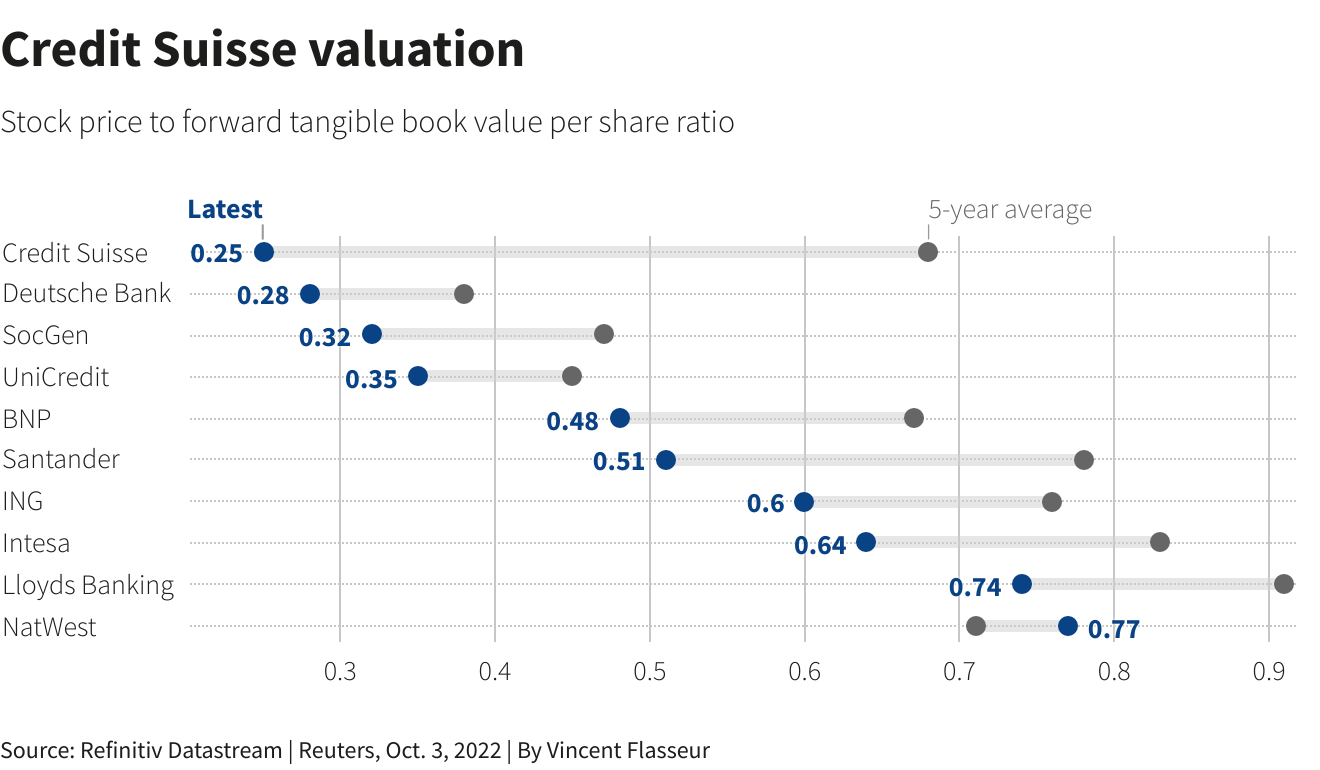
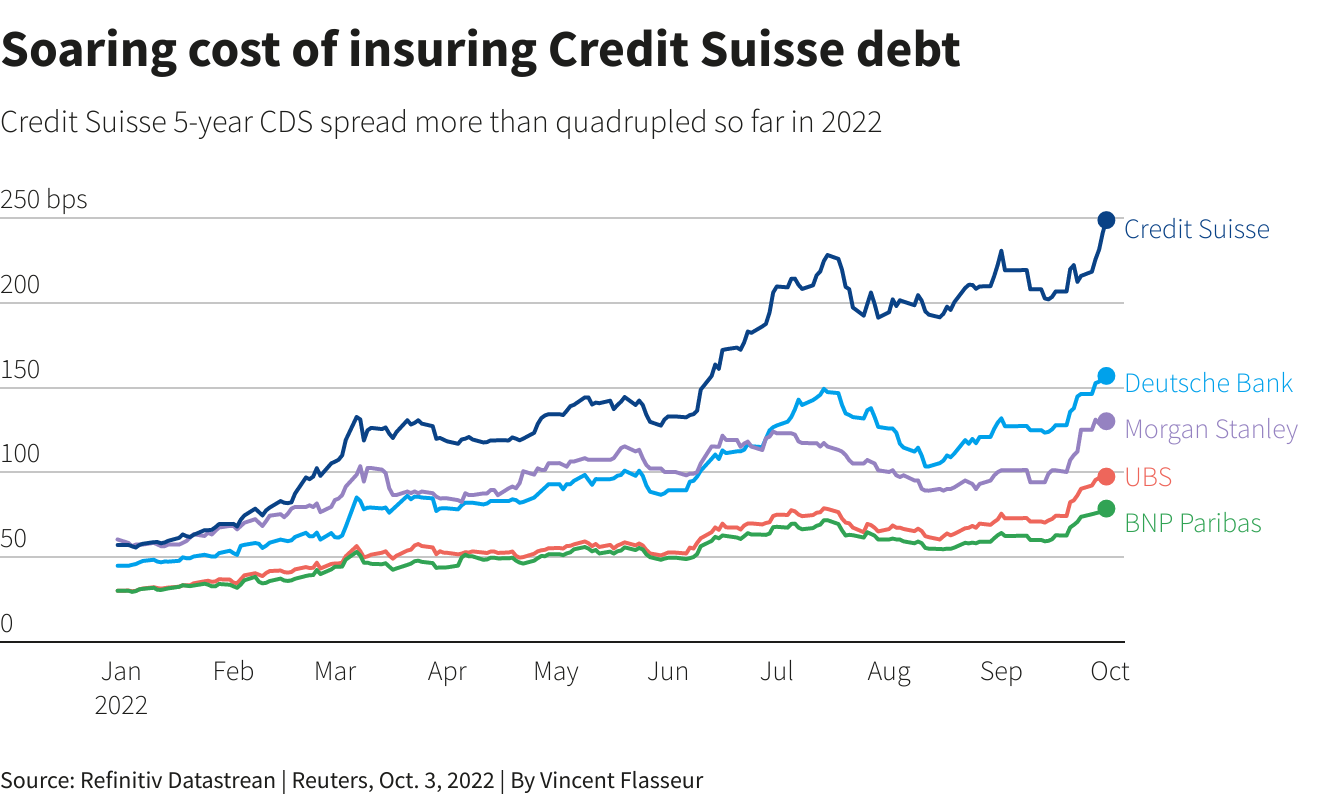
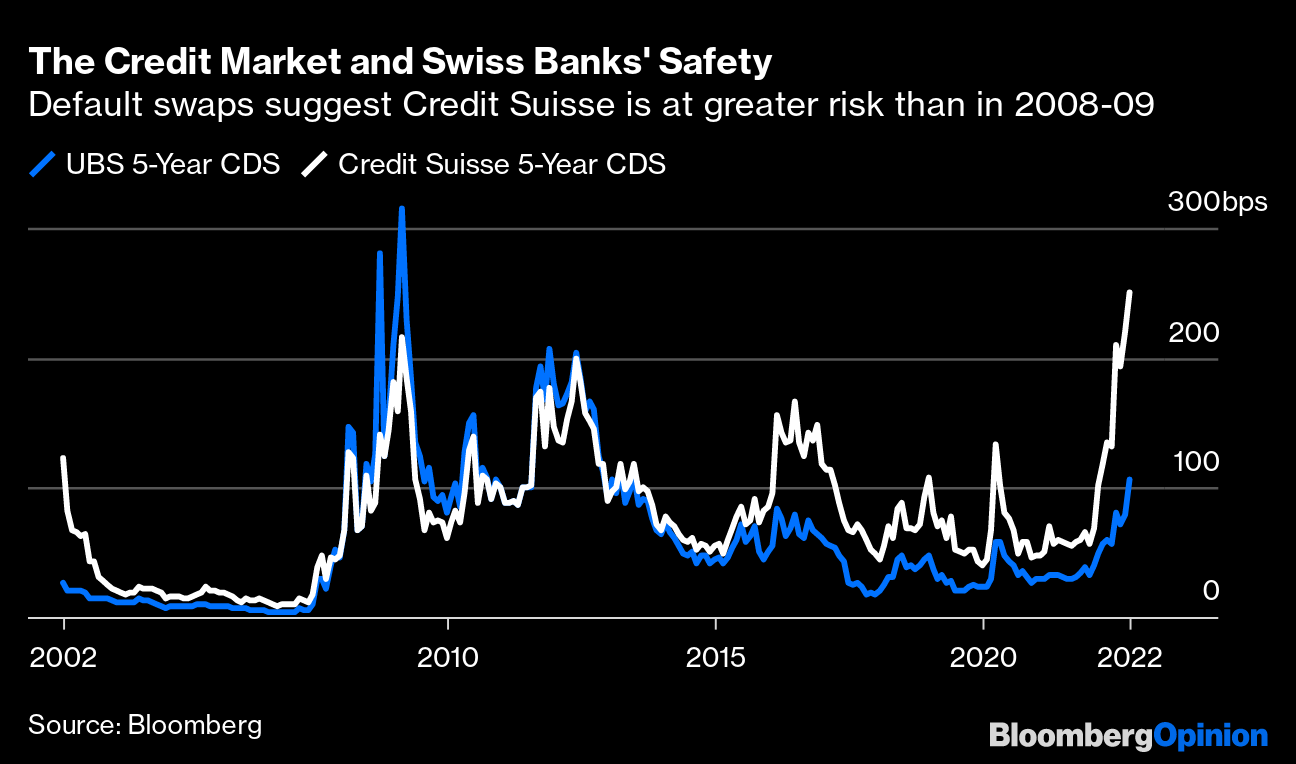
Read: Credit Suisse Group AG (NYSE: CS) protection reaches prohibitively expensive levels as banks rush into CDS after big shareholders hesitate to boost their stake. Switzerland was forced to step in with a $54 billion lifeline to stabilize the crisis.
Graphic: Retrieved from Bloomberg via Holger Zschaepitz.
Adding, as Unlimited’s Bob Elliott puts it, “in the [Global Financial Crisis], credit risk spread rapidly. Today, there is very little [credit default swap] impact” or carryover.
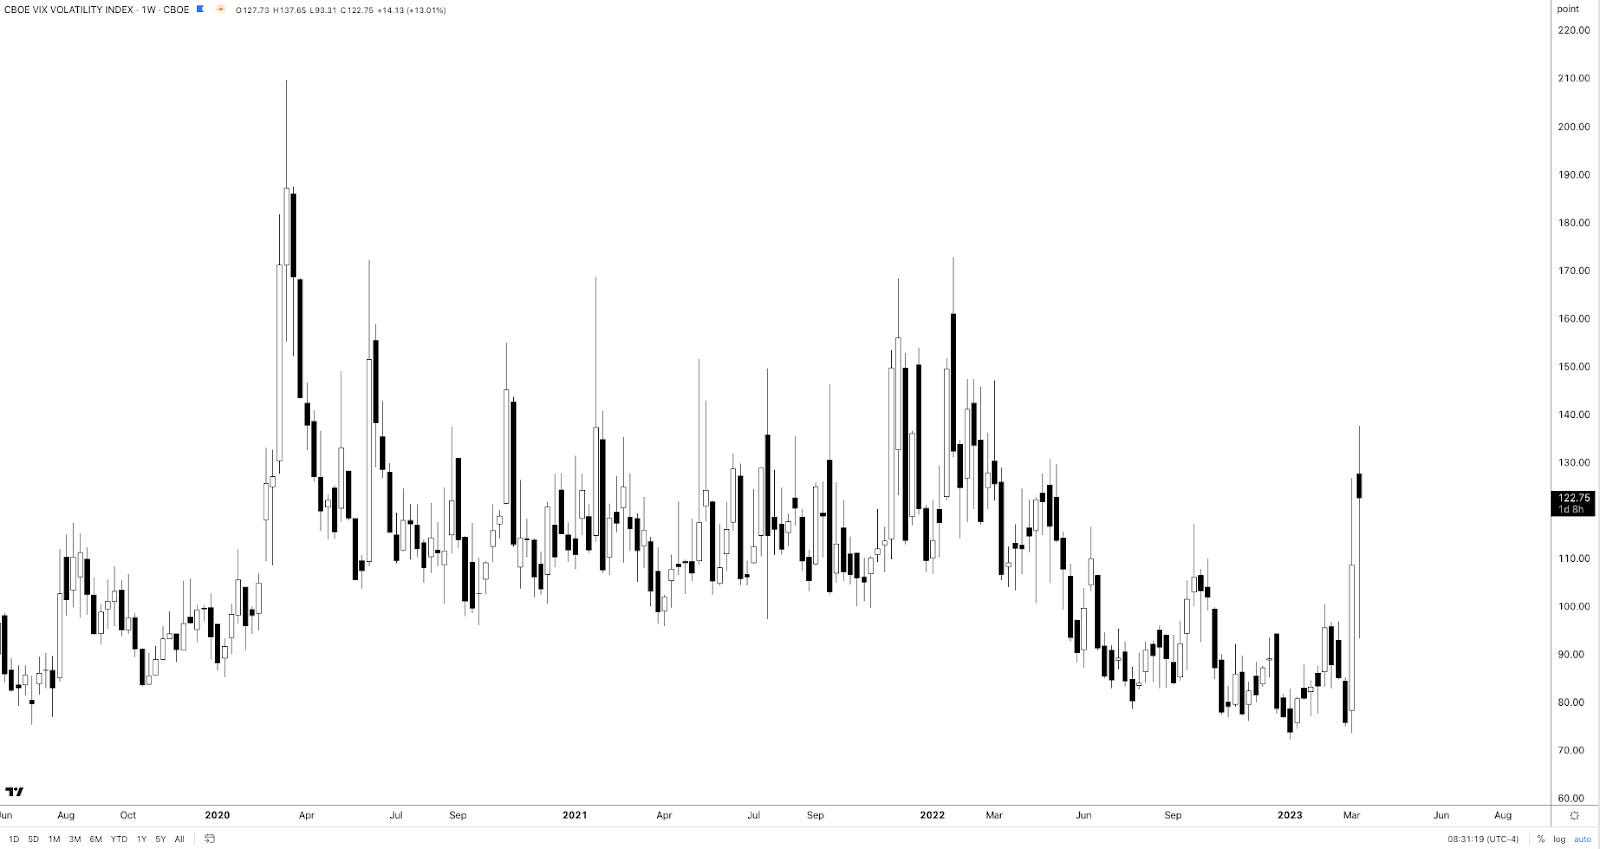
Following measures of US Treasury yield volatility implied by options (i.e., bets or hedges on or against market movement) adjusting higher, equity market volatility strengthened as observed by measures of convexity (e.g., Cboe VIX Volatility Index or VVIX). The Daily Brief for March 14 talked about this in detail.
Graphic: VVIX chart retrieved from TradingView.
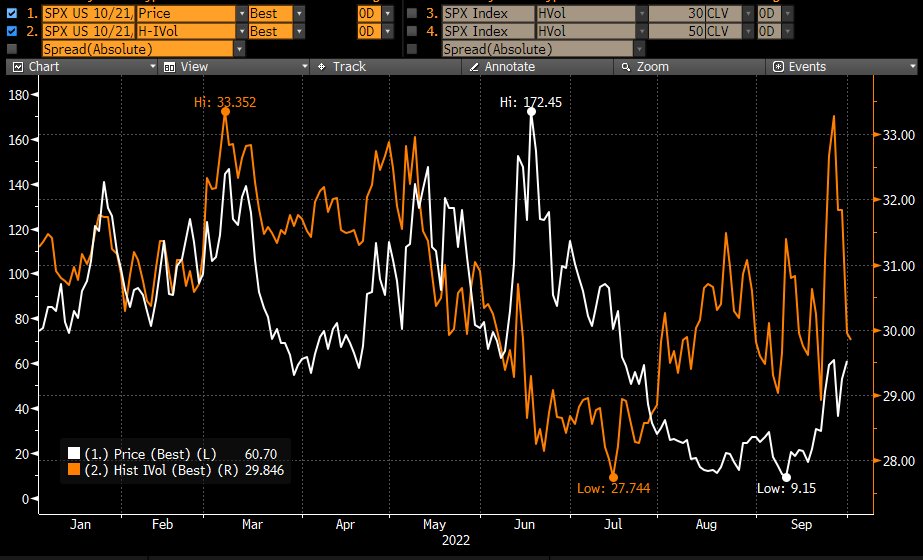
For this protection to keep its value and continue to perform well, realized volatility or RVOL must shift higher substantially and stay elevated. That’s not really happening to some big extent, at least in the equity market. Consequently, put structures such as bear put spreads in the S&P 500 (INDEX: SPX), for example, are not performing.
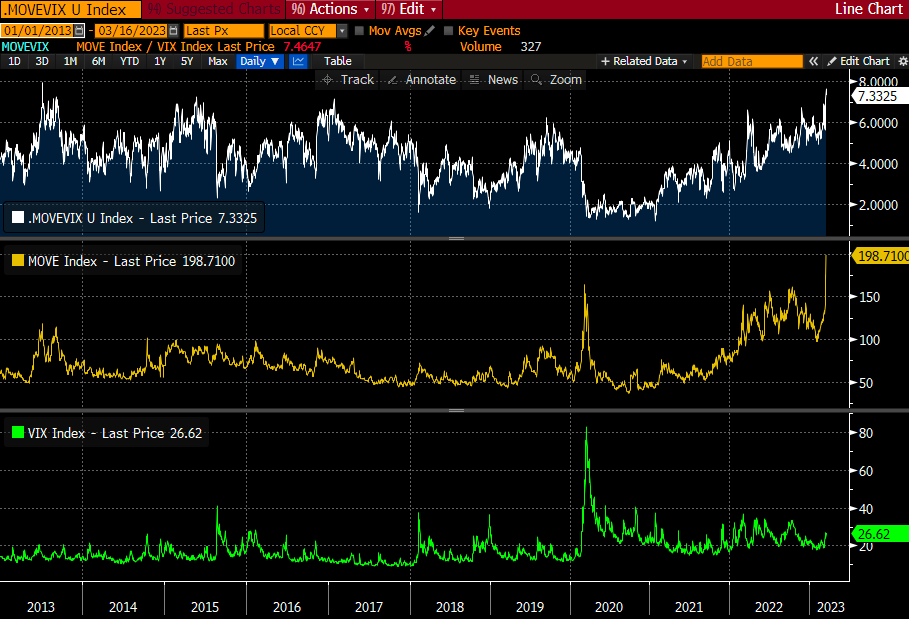
Graphic: Retrieved from Alpha_Ex_LLC. “Easy to argue that rate vol is leading and in this context, one could suggest VIX has room to rise from here.” However, it would “take a lot for the MOVE to sustain itself at this level.”
This information, coupled with falling implied volatility or IVOL, the passage of nearing derivatives expiries, and the strength of products like the Nasdaq 100 (INDEX: NDX) relative to others like the Russell 2000 (INDEX: RUT), has your letter writer leaning optimistic. Though it may be too early to position for strength, one may consider it the way it was explained in the Daily Brief on March 14.
Graphic: Retrieved from Tom McClellan. “The direct message is that the SP500 options traders who drive the VIX Index are feeling more fearful than the VIX futures traders believe is merited.”
Technical
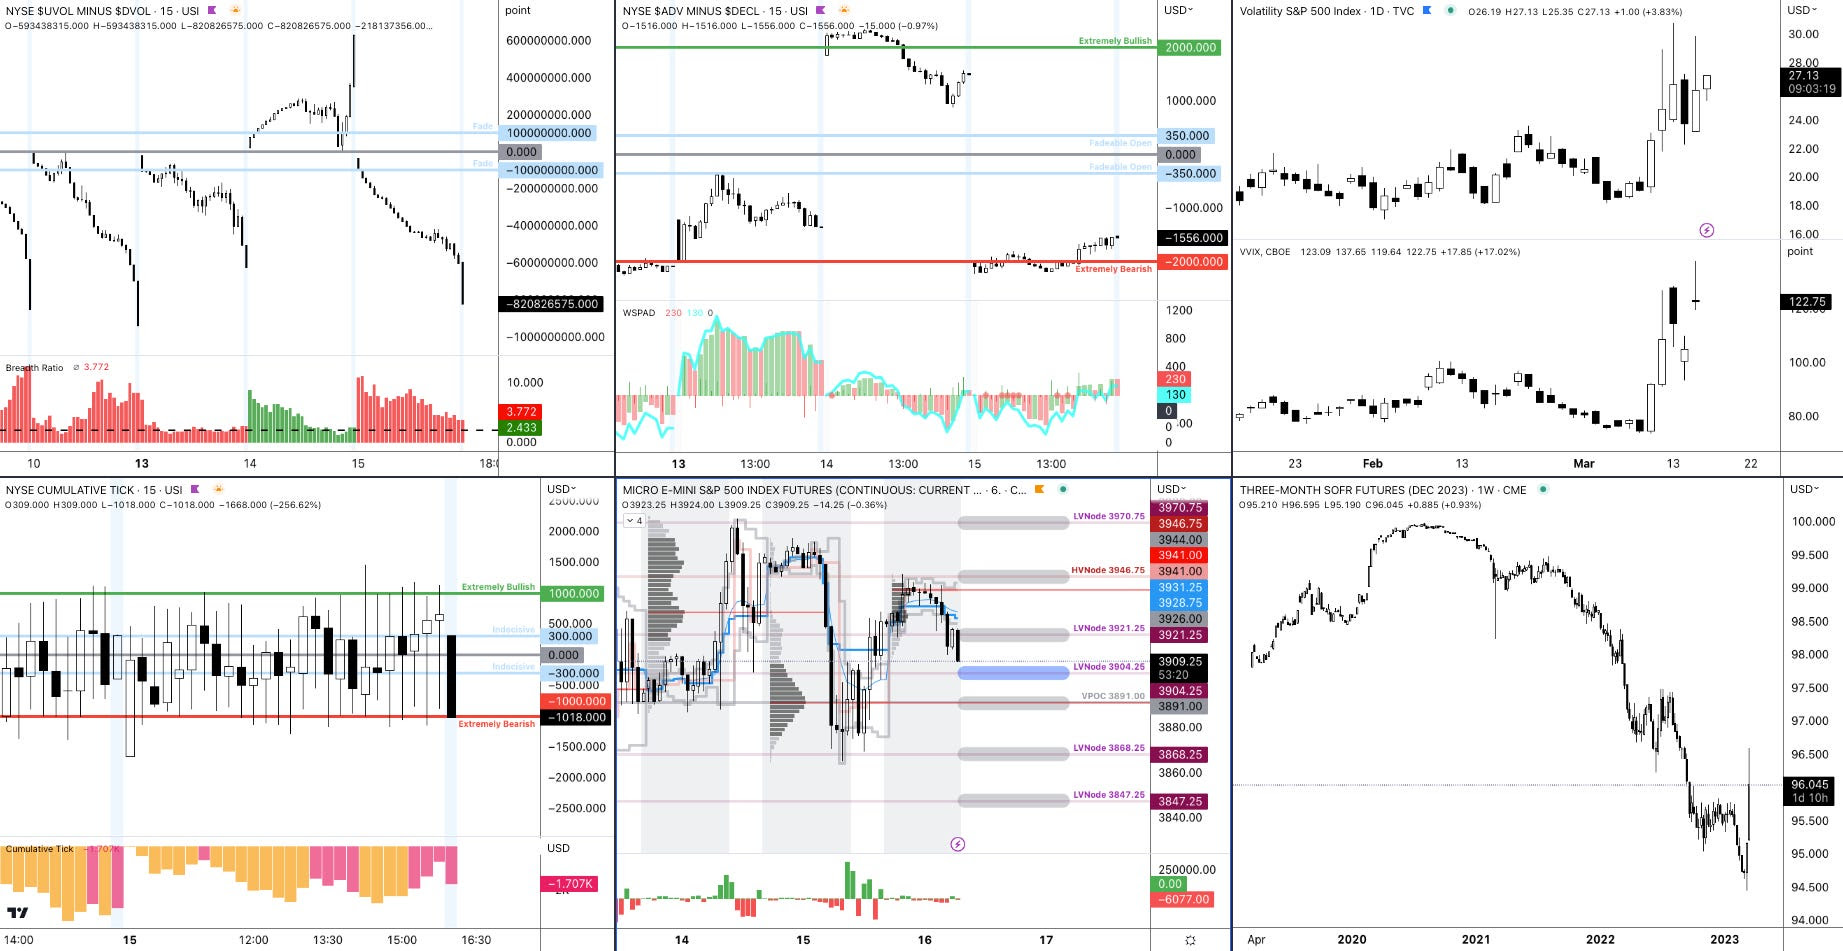
As of 7:15 AM ET, Thursday’s regular session (9:30 AM – 4:00 PM ET), in the S&P 500, is likely to open in the lower part of a balanced overnight inventory, inside of the prior day’s range, suggesting a limited potential for immediate directional opportunity.
The S&P 500 pivot for today is $3,904.25.
Key levels to the upside include $3,921.25, $3,946.75, and $3,970.75.
Key levels to the downside include $3,891.00, $3,868.25, and $3,847.25.
Disclaimer: Click here to load the updated key levels via the web-based TradingView platform. New links are produced daily. Quoted levels likely hold barring an exogenous development.
Graphic: 65-minute profile chart of the Micro E-mini S&P 500 Futures (bottom middle).
Definitions
Volume Areas: Markets will build on areas of high-volume (HVNodes). Should the market trend for a period of time, this will be identified by a low-volume area (LVNodes). The LVNodes denote directional conviction and ought to offer support on any test.
If participants auction and find acceptance in an area of a prior LVNode, then future discovery ought to be volatile and quick as participants look to the nearest HVNodes for more favorable entry or exit.
POCs: Areas where two-sided trade was most prevalent in a prior day session. Participants will respond to future tests of value as they offer favorable entry and exit.
Volume-Weighted Average Prices (VWAPs): A metric highly regarded by chief investment officers, among other participants, for quality of trade. Additionally, liquidity algorithms are benchmarked and programmed to buy and sell around VWAPs.
About
The author, Renato Leonard Capelj, spends the bulk of his time at Physik Invest, an entity through which he invests and publishes free daily analyses to thousands of subscribers. The analyses offer him and his subscribers a way to stay on the right side of the market.
You may view this letter’s content calendar at this link.
Disclaimer
Do not construe this newsletter as advice. All content is for informational purposes. Capelj and Physik Invest manage their own capital and will not solicit others for it.
The daily brief is a free glimpse into the prevailing fundamental and technical drivers of U.S. equity market products. Join the 990+ that read this report daily, below!
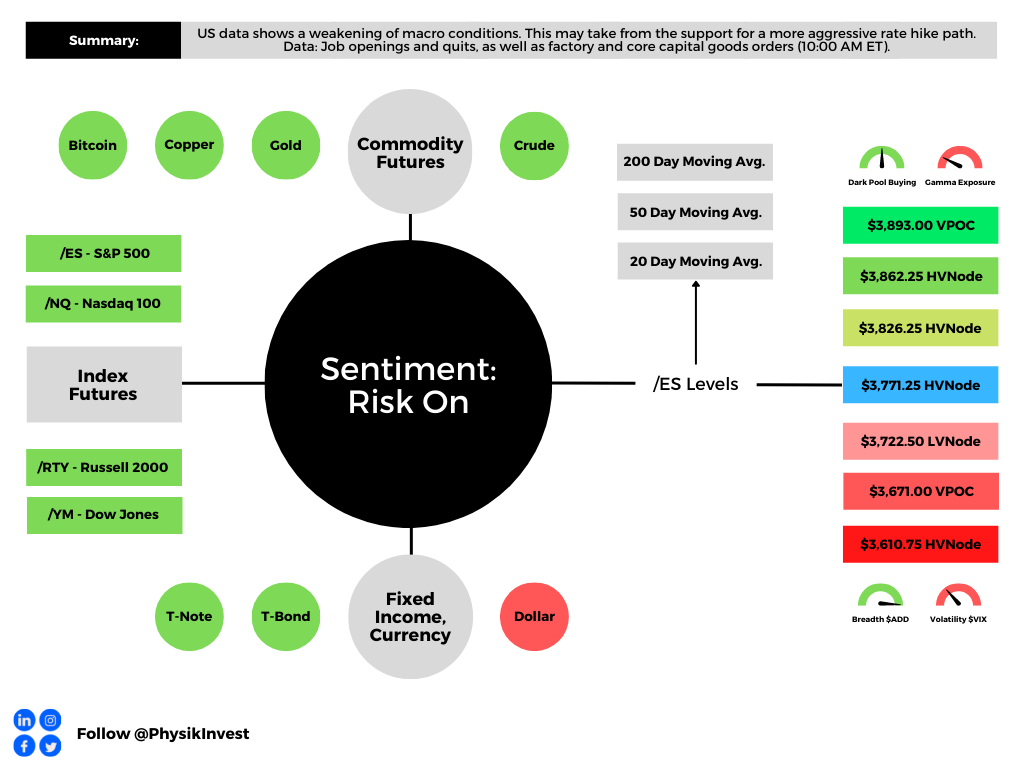
Graphic updated 9:20 AM ET. Sentiment Risk-On if expected /ES open is above the prior day’s range. /ES levels are derived from the profile graphic at the bottom of the following section. Levels may have changed since initially quoted; click here for the latest levels. SqueezeMetrics Dark Pool Index (DIX) and Gamma (GEX) calculations are based on where the prior day’s reading falls with respect to the MAX and MIN of all occurrences available. A higher DIX is bullish. At the same time, the lower the GEX, the more (expected) volatility. Learn the implications of volatility, direction, and moneyness. Breadth reflects a reading of the prior day’s NYSE Advance/Decline indicator. VIX reflects a current reading of the CBOE Volatility Index (INDEX: VIX) from 0-100.
Fundamental
Fresh and top of mind, still, is the Credit Suisse Group AG (NYSE: CS) debacle. However, despite the bank’s “critical moment,” as discussed in yesterday’s letter, credit default swap (CDS) levels, though still rising, are “far from distressed.”
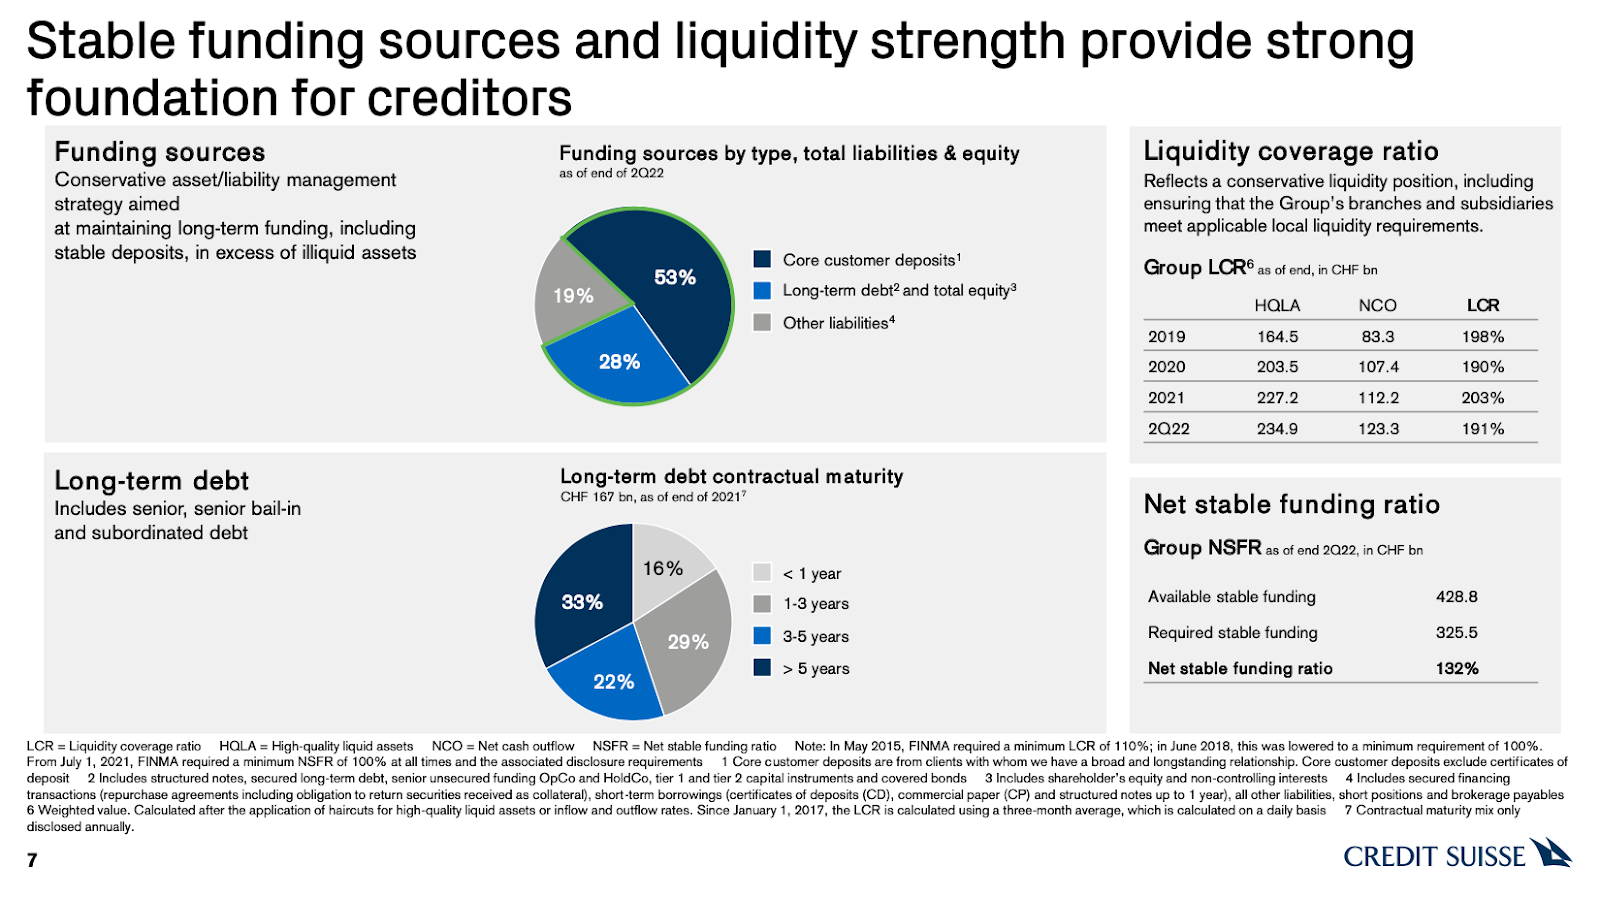
Adding, not reflected by the stock is a “strong capital base and liquidity position,” per CS.
Graphic: Retrieved from Credit Suisse Group AG (NYSE: CS).
A big topic speculated on was CS’ probability of default. At its core, CDS spreads relate to the probability of default in the following way, per Deutsche Bank AG (NYSE: DB) research:
(CDS Spread) / (1 – Recovery Rate) = Implied Probability Of Default.
The recovery rate is basically the (estimated) amount of a loan that will be repaid in the case of a bankruptcy or default. Per European Central Bank research, “the standard recovery rate used by the industry in price calculations is 40%.”
Roughly speaking, below is a quick calculation:
250 basis points / (1 – 0.40) = 416.67 basis points = 4.17% Implied Probability Of Default
In CS’ case, if the spread is 250 basis points, assuming a 40% recovery, that’s a 4.17% default probability implied. If the spread was at 150 basis points, then, assuming a 40% recovery, that’s a 2.5% chance of default.
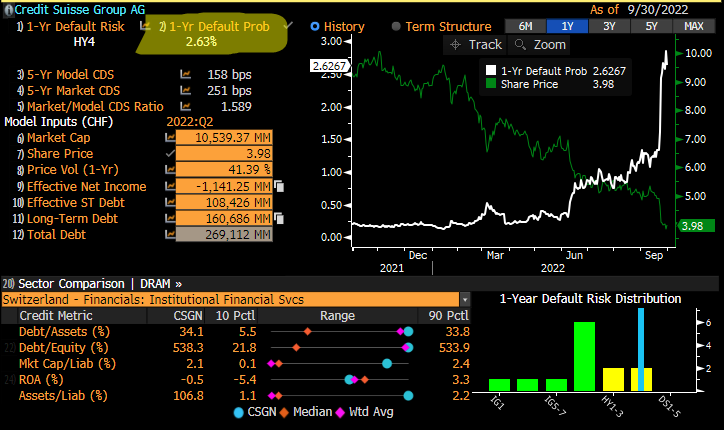
Graphic: Taken from @EffMktHype who retrieved from Bloomberg. “So many [Bloomberg] screenshots of CS CDS levels and talking about massive default prob numbers. Zero people actually using [the] same terminal to look at default risk screen.”
Taken together, in short, similar to as we put forth, yesterday, “[t]his is not 2008,” per Citigroup Inc’s (NYSE: C) Andrew Coombs. Bloomberg adds that Morgan Stanley (NYSE: MS) faced its own credit spread debacle during 2011 European debt exposure rumors; “it took months for the price of the default swaps to fall as the feared losses never materialized.”
Ahead of an October 27 CS review covering topics including “a large-scale investment banking retreat, … [i]nvestors are worried about how much the bank will [have to] cover” a restructuring.
Bloomberg adds: “A sale of Credit Suisse’s structured-products group, which trades securitized debt, has attracted interest from potential buyers, … [amid] rising interest rates.”
Per UBS Group AG (NYSE: UBS) research, a sale of such businesses, which may be worth more than the market is currently implying, “could help to avoid a dilutive capital increase.”
Positioning
“Month-end portfolio rebalances and [the] expiration of quarterly option strategies [acted] in support of the market,” JPMorgan Chase & Co’s (NYSE: JPM) Marko Kolanovic stated in a September 30, 2022 commentary titled “Throwing rocks in glass houses.”
In that same commentary, Kolanovic eased support for his 2022 price targets on economic volatility led by central banks, the war in Europe, and beyond.
As stated last week, per Kai Volatility’s Cem Karsan, it’s the case that the removal of options strategies and potential supply of protection (as investors further come to the realization that options protection has done little to protect against downside) may provide markets a boost.
Graphic: Taken from @Alpha_Ex_LLC who retrieved from Bloomberg. S&P 500 (INDEX: SPX) October put option lower in price and volatility.
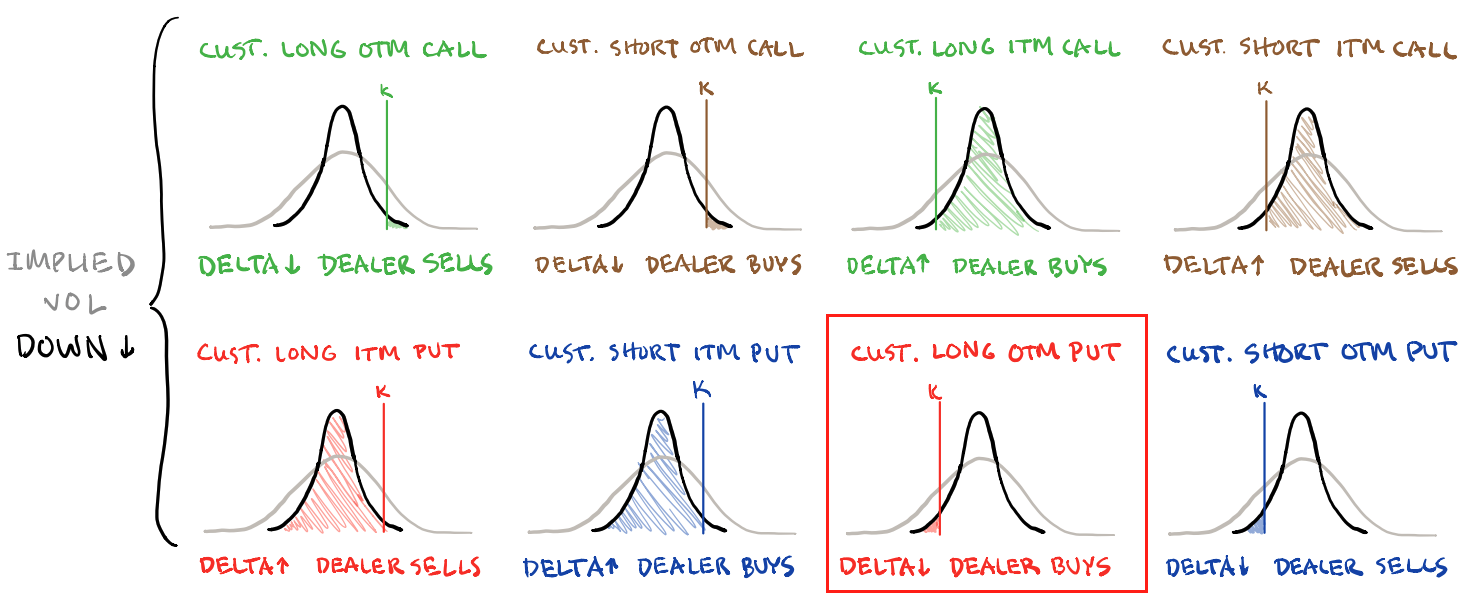
Ultimately, though, a final resolution would be “tied to the incremental effects on liquidity,” (e.g., QT manifesting itself as “$4.5 billion less in demand for assets per day,” and buyback blackout) while options repositioning may make the case for increased fragility, as traders’ falling demand for put protection opens the door to less supportive hedging flows with respect to time (Charm) and volatility (Vanna) changes.
Therefore, trades such as the Short Ratio Put Spread, particularly if narrower, may be far riskier to employ into the end of this year and the middle half of next year. For context, this was a trade to have on this year.
As participants continue to make the aforementioned realizations and supply to the market put (downside protection), tails may “continue to be cheap,” and discount “crash risk,” according to The Ambrus Group’s Kris Sidial.
A lot more to resolve this jumbled mess of a newsletter in the coming days.
Technical
As of 9:10 AM ET, Tuesday’s regular session (9:30 AM – 4:00 PM ET), in the S&P 500, is likely to open in the upper part of a positively skewed overnight inventory, outside of prior-range and -value, suggesting a potential for immediate directional opportunity.
In the best case, the S&P 500 trades higher.
Any activity above the $3,771.25 HVNode puts into play the $3,826.25 HVNode. Initiative trade beyond the last-mentioned could reach as high as the $3,862.25 HVNode and $3,893.00 VPOC, or higher.
In the worst case, the S&P 500 trades lower.
Any activity below the $3,771.25 HVNode puts into play the $3,722.50 LVNode. Initiative trade beyond the LVNode could reach as low as the $3,671.00 VPOC and $3,610.75 HVNode, or lower.
Click here to load today’s key levels into the web-based TradingView charting platform. Note that all levels are derived using the 65-minute timeframe. New links are produced, daily.
Graphic: 65-minute profile chart of the Micro E-mini S&P 500 Futures.
Definitions
Volume Areas: A structurally sound market will build on areas of high volume (HVNodes). Should the market trend for long periods of time, it will lack sound structure, identified as low volume areas (LVNodes). LVNodes denote directional conviction and ought to offer support on any test.
If participants were to auction and find acceptance into areas of prior low volume (LVNodes), then future discovery ought to be volatile and quick as participants look to HVNodes for favorable entry or exit.
POCs: POCs are valuable as they denote areas where two-sided trade was most prevalent in a prior day session. Participants will respond to future tests of value as they offer favorable entry and exit.
Vanna: The rate at which the delta of an option changes with respect to volatility.
Charm: The rate at which the delta of an option changes with respect to time.
About
After years of self-education, strategy development, mentorship, and trial-and-error, Renato Leonard Capelj began trading full-time and founded Physik Invest to detail his methods, research, and performance in the markets.
Capelj also develops insights around impactful options market dynamics at SpotGamma and is a Benzinga reporter.
In no way should the materials herein be construed as advice. Derivatives carry a substantial risk of loss. All content is for informational purposes only.
The daily brief is a free glimpse into the prevailing fundamental and technical drivers of U.S. equity market products. Join the 980+ that read this report daily, below!
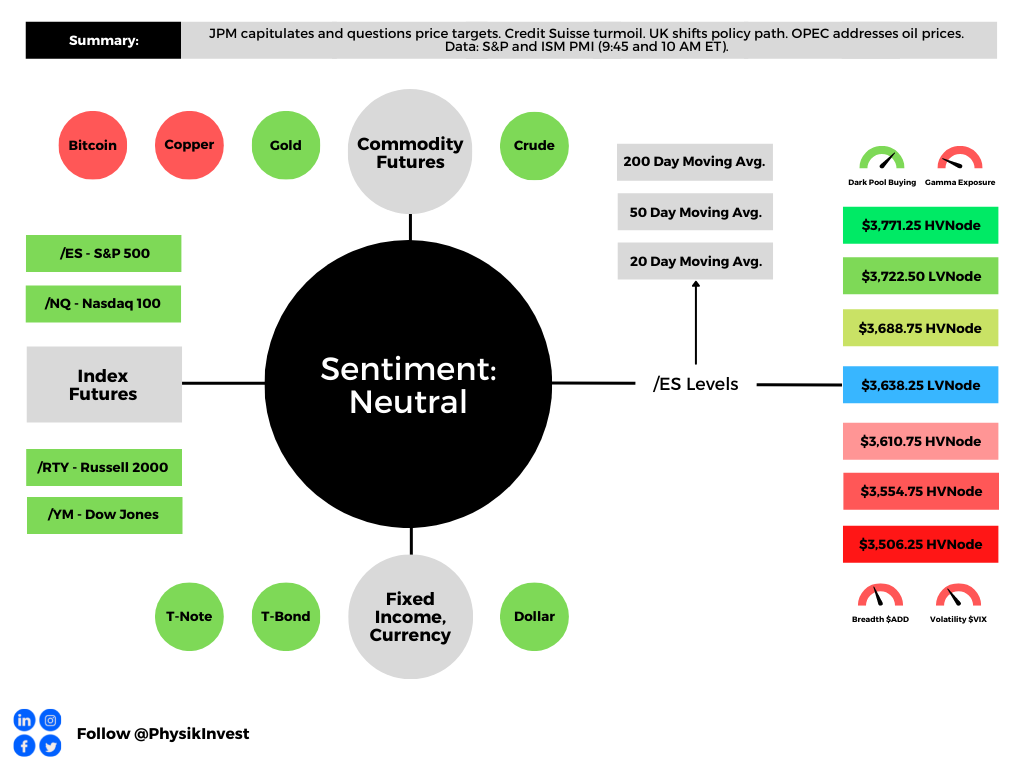
Graphic updated 8:30 AM ET. Sentiment Neutral if expected /ES open is inside of the prior day’s range. /ES levels are derived from the profile graphic at the bottom of the following section. Levels may have changed since initially quoted; click here for the latest levels. SqueezeMetrics Dark Pool Index (DIX) and Gamma (GEX) calculations are based on where the prior day’s reading falls with respect to the MAX and MIN of all occurrences available. A higher DIX is bullish. At the same time, the lower the GEX, the more (expected) volatility. Learn the implications of volatility, direction, and moneyness. Breadth reflects a reading of the prior day’s NYSE Advance/Decline indicator. VIX reflects a current reading of the CBOE Volatility Index (INDEX: VIX) from 0-100.
Administrative
Ended last week on a strong note and started this week on a lighter, less impactful note.
Separately, due to travel commitments, there may be inconsistency in the frequency of posts in the coming weeks, particularly October 10-21, 2022.
Fundamental
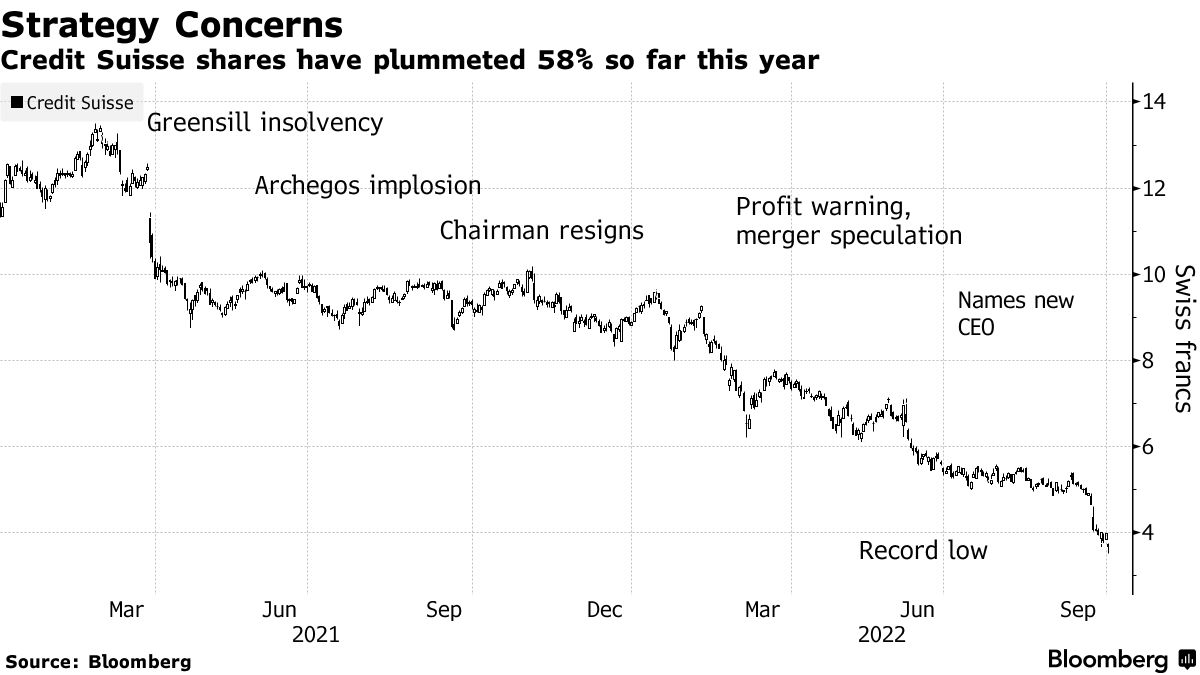
A lot of noise this weekend. Top headlines and posts on social media concerned the stability of Credit Suisse Group AG (NYSE: CS), for one, which is slated to open about 5% lower today.
CEO Ulrich Koerner said the bank is at a “critical moment” while stressing stock prices did not reflect its “strong capital base and liquidity position.” The bank’s key capital ratio sits at 13.5%, higher than what Deutsche Bank AG (NYSE: DB) had in 2016 when it was in trouble.
Graphic: Retrieved from Bloomberg. “Credit Suisse Group AG shares are now a “buy for the brave,” said Citigroup Inc. analysts on Monday.”
A hot topic, too, is the bank’s credit default swap (CDS) levels which “are still far from distressed and are part of a broad market selloff,” Bloomberg concludes.
For context, a CDS is a tool to hedge against the risk of some credit event (e.g., bankruptcy, a failure to pay, restructuring of debt, repudiation/moratorium, and obligation acceleration or an obligation default). The settlement of a CDS involves the exchanging of bonds for their par value or a cash payment equal to the difference between par and the bond’s market value.
Graphic: Retrieved from Bloomberg. “There is now a roughly 23% chance the bank defaults on its bonds within 5 years.” A CDS spread at – say 250 bps – “assuming a recovery of zero,” implies an annual default probability of 2.5%.
Moreover, in spite of all the discussion and debate online, “Credit Suisse is not creating anything like the angst we experienced [in 2008],” said columnist John Authers.
If no bailout is needed, “as the CEO’s memo endeavors to show, then all the talk has left it very much oversold.”
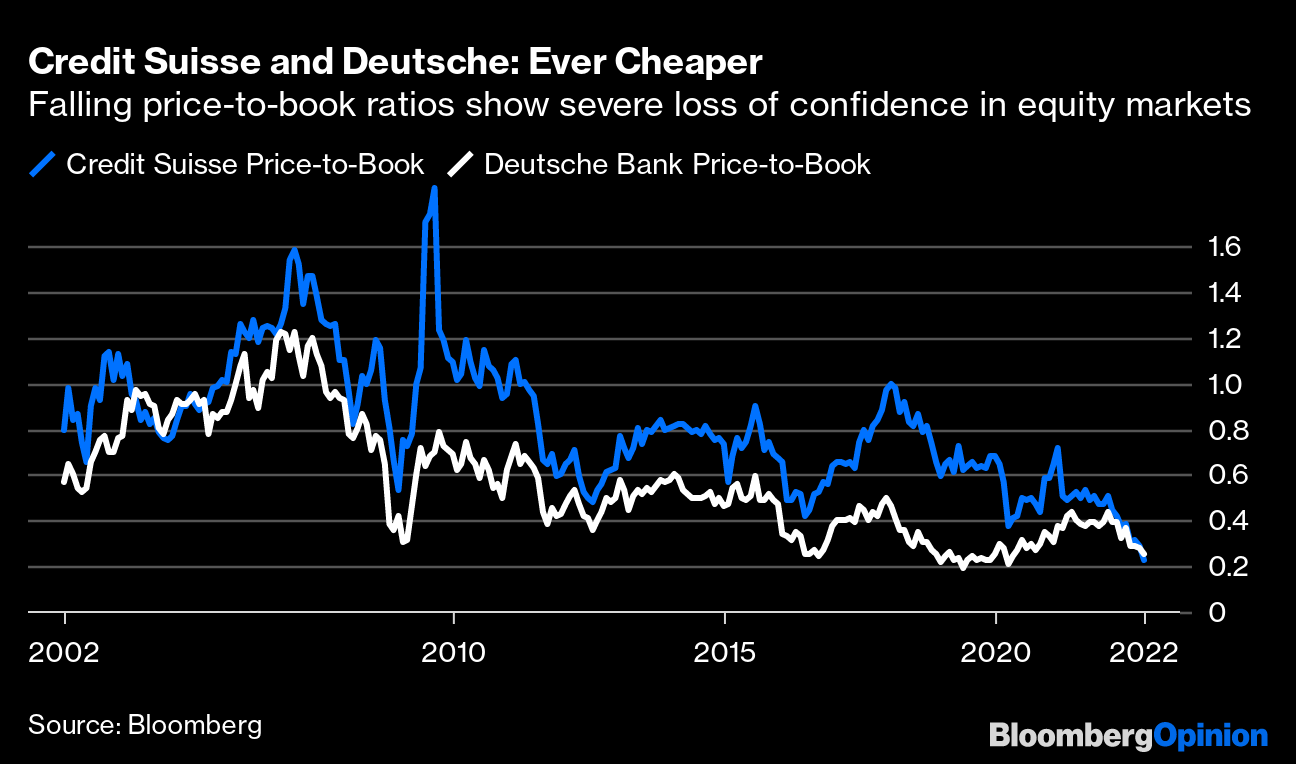
Graphic: Retrieved from Bloomberg. CS trades at less than book value (assets less liabilities).
In other news, Liz Truss, the Prime Minister of the UK, shifted her focus from some fiscal stimuli which “bec[ame] a distraction from [the] mission to get Britain moving.”
“Our focus now is on building a high growth economy that funds world-class public services, boosts wages, and creates opportunities across the country.”
For context, the last week was filled with excitement overseas, we explained in detail Monday through Friday.
In short, the announcement of new fiscal policies coincided with market volatility that prompted reflexive feedback loops and the risk of default among some pension schemes.
Some of those announcements were walked back and UK volatility eased.
Moving on.
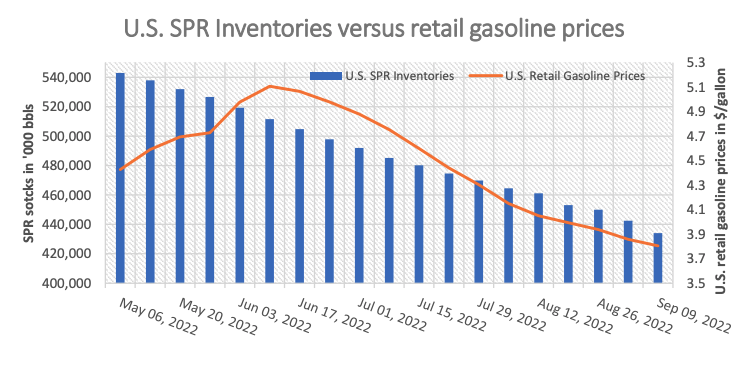
Oil was bid on news that OPEC+ is considering a cut to production in excess of a million barrels per day. This is as they look to “pre-empt” potential surpluses amid waning demand and the sale of oil from the US’s Strategic Petroleum Reserves (SPR) into November.
Graphic: Retrieved from CME Group Inc (NASDAQ: CME). “SPR release has helped tame oil prices.”
Waning demand is showing up in other areas; factor activity is falling on a slowdown, globally, as policymakers tighten and clamp down on excesses. Just yesterday, the Wall Street Journal reported that cargo shipowners were canceling sailings as shipping rates, discussed last week, plunged ~75%.
Positioning
Top of mind, for many, last week was the trade, repositioning, and/or removal of large options positions coinciding with the September Quarterly Options Expiration (OPEX).
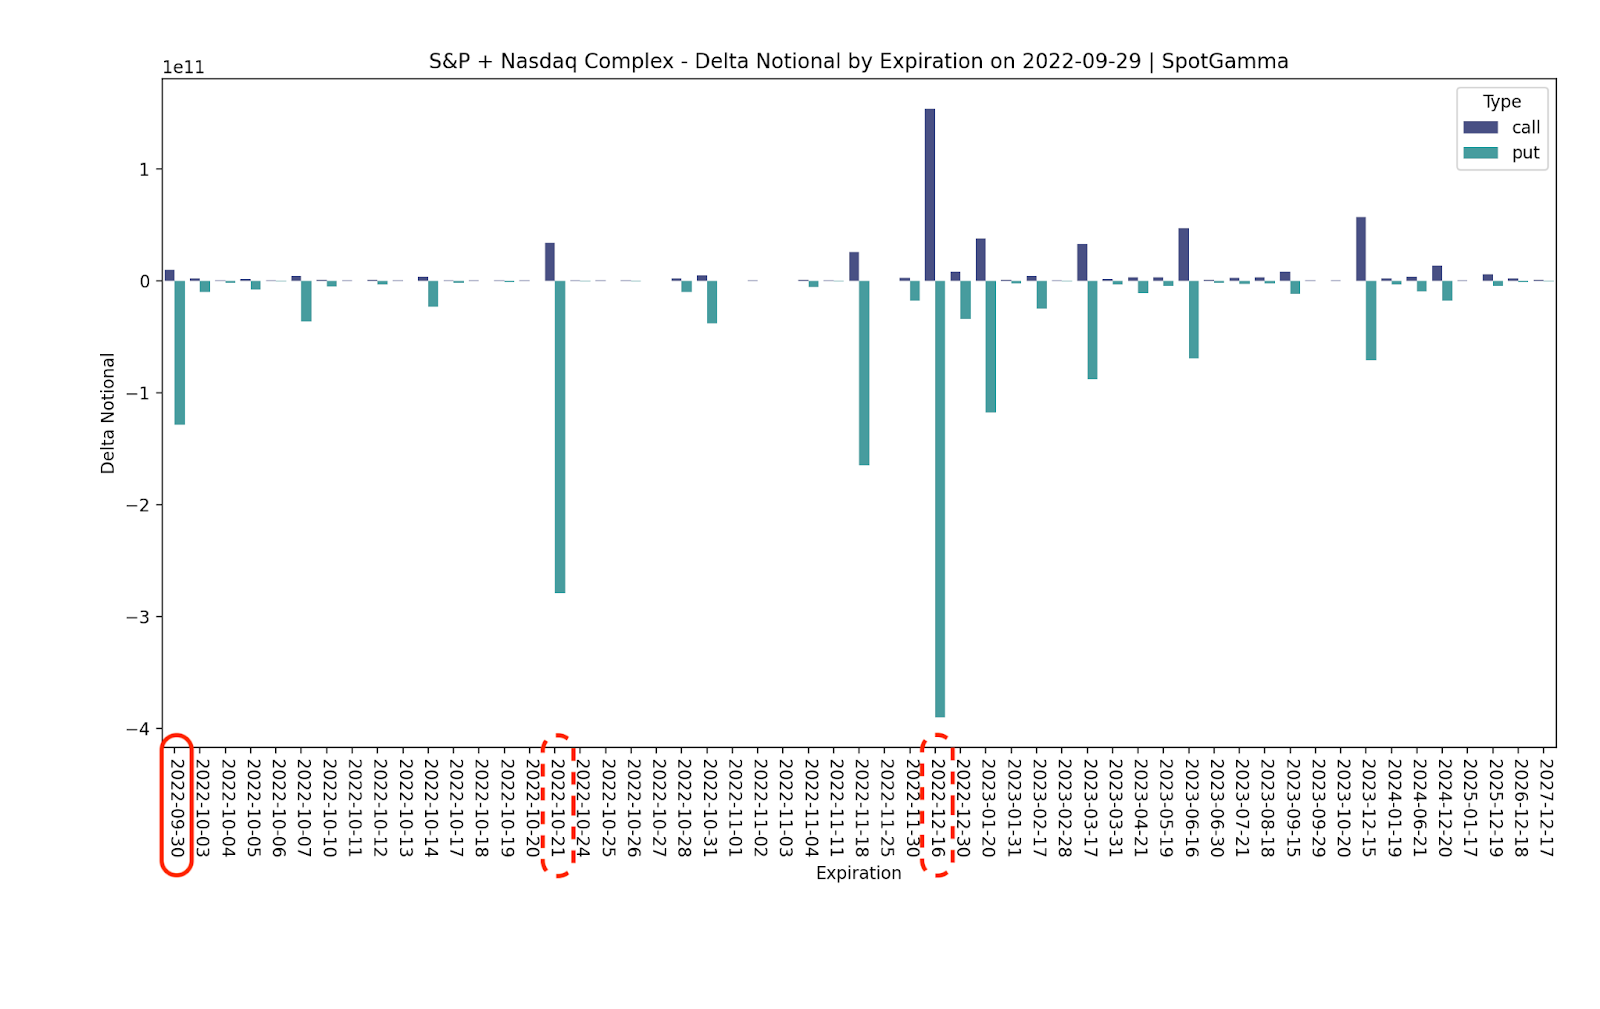
Notwithstanding, per SpotGamma data, the “expiration isn’t particularly impressive” as there is likely far “more potential market impact” expected in October and December.
Graphic: Retrieved from SpotGamma.
Still, there was a removal of a lot of put Delta. SpotGamma sees counterparties as having positive Delta (directional) exposure via short put (i.e., meaning the trade loses money if the underlying trades lower). This opens the door to relief as counterparties reposition and trim exposure to their negative Delta (offsetting) hedges via futures and/or stock.
“We believe that the expiration of large put positions can be turning points for market rallies.”
Technical
As of 7:00 AM ET, Monday’s regular session (9:30 AM – 4:00 PM ET), in the S&P 500, is likely to open in the upper part of a balanced overnight inventory, inside of prior-range and -value, suggesting a limited potential for immediate directional opportunity.
In the best case, the S&P 500 trades higher.
Any activity above the $3,610.75 HVNode puts into play the $3,653.00 VPOC. Initiative trade beyond the VPOC could reach as high as the $3,688.75 HVNode and $3,722.50 LVNode, or higher.
In the worst case, the S&P 500 trades lower.
Any activity below the $3,610.75 HVNode puts into play the $3,554.75 HVNode. Initiative trade beyond the last-mentioned could reach as low as the $3,506.25 and $3,444.75 HVNode, or lower.
Click here to load today’s key levels into the web-based TradingView charting platform. Note that all levels are derived using the 65-minute timeframe. New links are produced, daily.
Graphic: 65-minute profile chart of the Micro E-mini S&P 500 Futures.
Definitions
Volume Areas: A structurally sound market will build on areas of high volume (HVNodes). Should the market trend for long periods of time, it will lack sound structure, identified as low volume areas (LVNodes). LVNodes denote directional conviction and ought to offer support on any test.
If participants were to auction and find acceptance into areas of prior low volume (LVNodes), then future discovery ought to be volatile and quick as participants look to HVNodes for favorable entry or exit.
About
After years of self-education, strategy development, mentorship, and trial-and-error, Renato Leonard Capelj began trading full-time and founded Physik Invest to detail his methods, research, and performance in the markets.
Capelj also develops insights around impactful options market dynamics at SpotGamma and is a Benzinga reporter.
In no way should the materials herein be construed as advice. Derivatives carry a substantial risk of loss. All content is for informational purposes only.
The daily brief is a free glimpse into the prevailing fundamental and technical drivers of U.S. equity market products. Join the 970+ that read this report daily, below!
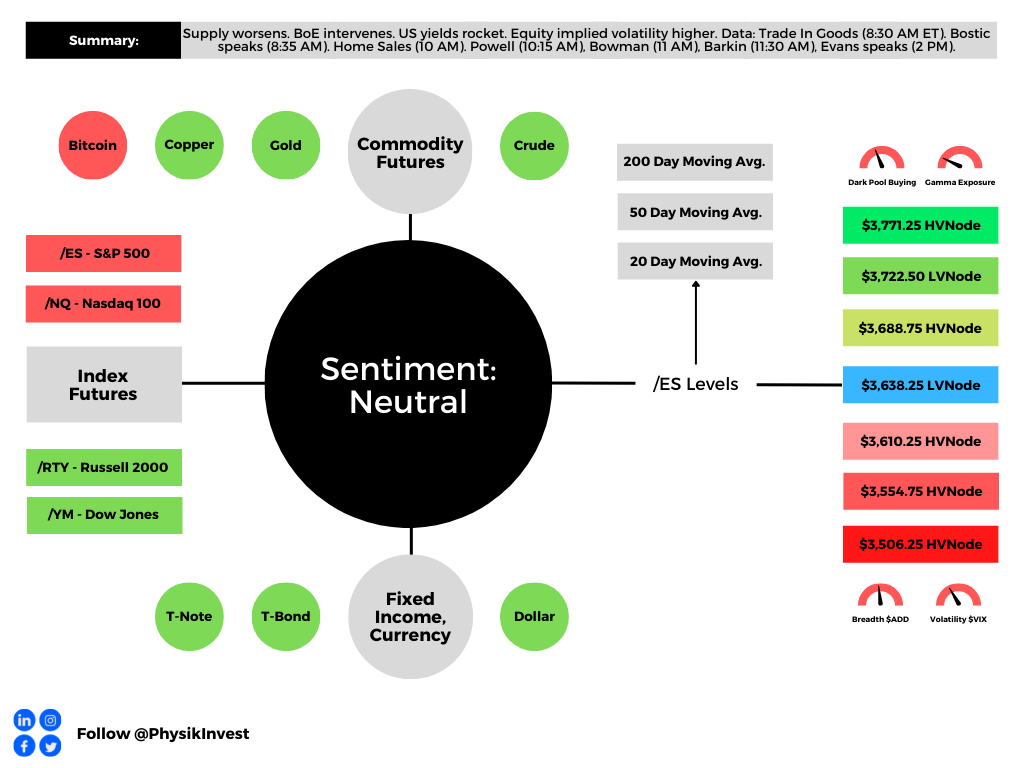
Graphic updated 8:20 AM ET. Sentiment Neutral if expected /ES open is inside of the prior day’s range. /ES levels are derived from the profile graphic at the bottom of the following section. Levels may have changed since initially quoted; click here for the latest levels. SqueezeMetrics Dark Pool Index (DIX) and Gamma (GEX) calculations are based on where the prior day’s reading falls with respect to the MAX and MIN of all occurrences available. A higher DIX is bullish. At the same time, the lower the GEX, the more (expected) volatility. Learn the implications of volatility, direction, and moneyness. Breadth reflects a reading of the prior day’s NYSE Advance/Decline indicator. VIX reflects a current reading of the CBOE Volatility Index (INDEX: VIX) from 0-100.
Administrative
Apologies, team, if the quality was lacking these past few days. Extremely busy on my end and I look forward to some detailed letters in the near future! – Renato
Fundamental
“Great powers are waging hot wars involving the flow of technologies, goods, and commodities.”
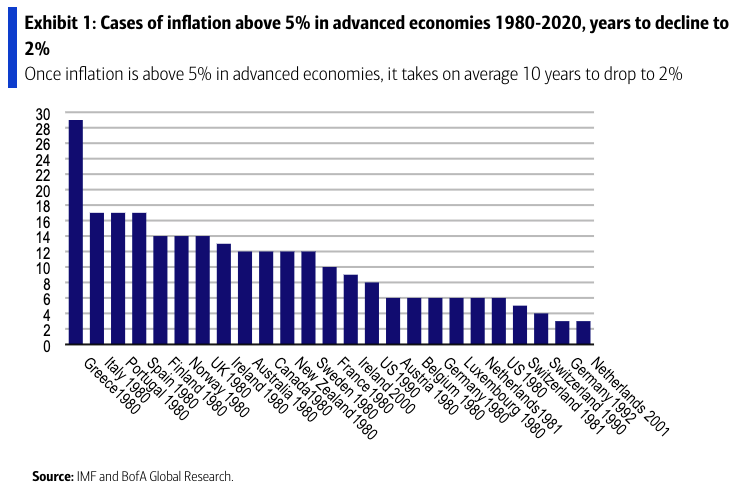
That’s according to Credit Suisse Group AG’s (NYSE: CS) Zoltan Pozsar who believes that the pillars forming the context for a low-inflation world are changing, and this is setting the stage for longer-lasting structural inflation.
In short, inflationary impulses are incoming from non-linear geopolitical and economic conflicts.
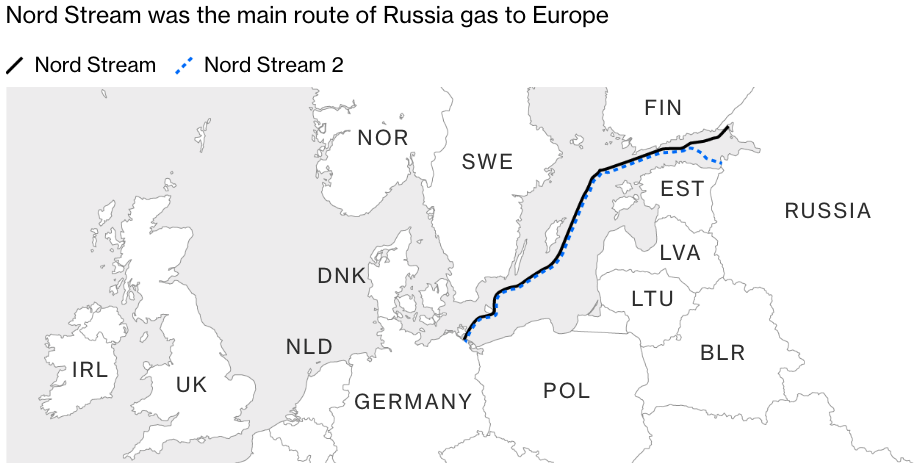
Just yesterday, Europe was investigating attacks on pipelines from Russia; there were “major leaks into the Baltic Sea from two Russian gas pipelines at the cent[er] of an energy standoff.”
“The word sabotage springs to mind,” Javier Blas of Bloomberg, said. “In a single day, the conduits, which link Russia with Germany under the Baltic Sea, have suffered not one, not two, but three separate major leaks.”
Per reports by Refinitiv, seismologists nearby registered “powerful blasts” that “do not resemble signals from earthquakes.” Instead, the explosions likely correspond with hundreds of “kilos (kg) of dynamite.”
Given that Nordstream 1 and 2 are not operational, now, the “leaks are more likely a message: [if truly the culprit], Russia is opening a new front on its energy war against Europe.”
Accordingly, gas prices were higher but “below this year’s peaks,” Refinitiv reported. Generally, across some benchmarks, prices read “more than 200%, higher than in early September 2021.”
Separately, the Bank of England (BoE) is delaying quantitative-tightening (QT) bond sales and opting to purchase longer-dated government bonds in an attempt to restore stability, which we discussed was at risk on Monday and Tuesday.
Graphic: Retrieved from Bloomberg. Credit Default Swaps (CDSs) are a tool for investors to offload credit risk to other market participants.
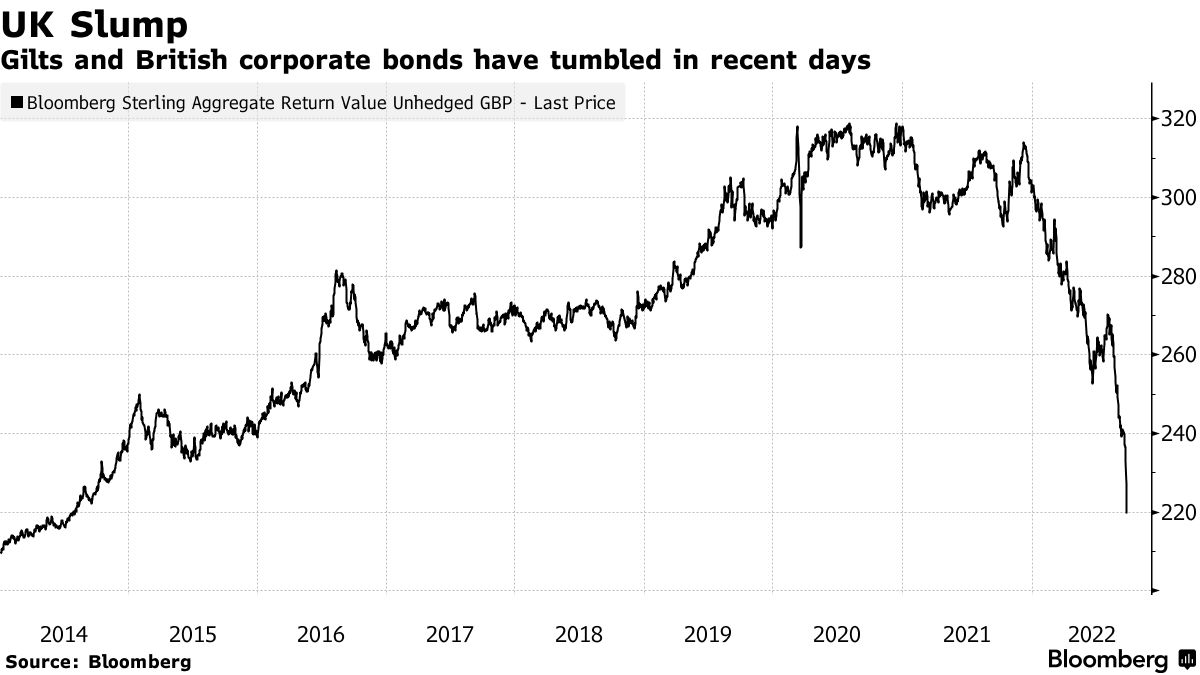
As a result, after a near-vertical drop (visible below) in Gilts and British corporate bonds (which impacted mortgage lending, for one), UK yields saw some of their biggest drops on record.
Graphic: Retrieved from Bloomberg. Updated September 26, 2022.
The actions over the past few days complicate the Monetary Policy Committee’s (MPC) objective to reach a return to 2% inflation in the medium term.
Graphic: Retrieved, initially, from Bank of America Corporation (NYSE: BAC). Via The Transcript. Interest rates “may be higher for longer” than expected.
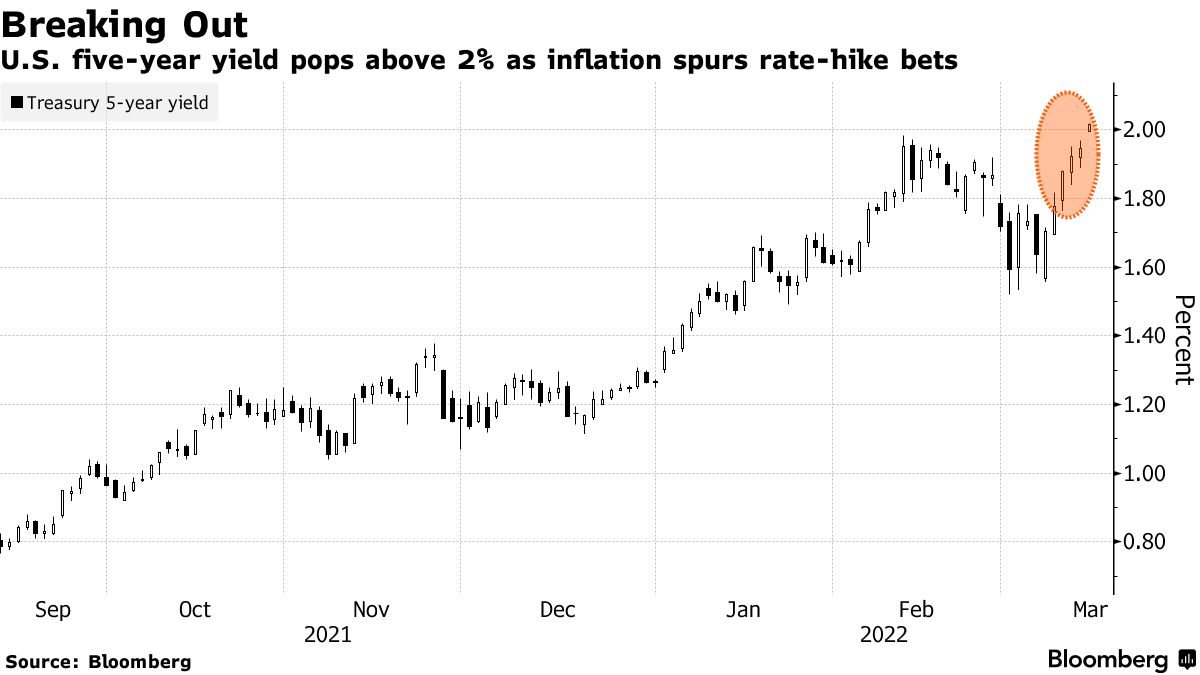
At home, here, in the US, yields on the 10-year topped 4.00%. There is a heightened chance of a Federal Reserve (Fed) bump in rates that brings the target rate to 375-400 basis points, while the UK, in stemming its inflationary pressures, is expected to bump by double that amount.
The action to stem inflation is feeding through to demand. Apple Inc (NASDAQ: AAPL) said it would ease plans to boost iPhone production “after an anticipated surge in demand failed to materialize,” a Bloomberg report said.
“The supply constraints pulling down on the market since last year have eased and the industry has shifted to a demand-constrained market,” said Nabila Popal, research director at IDC.
“High inventory in channels and low demand with no signs of immediate recovery has OEMs panicking and cutting their orders drastically for 2022,” a fear we said ARK Invest’s Catherine Wood shared, not too long ago.
Positioning
The beginning of the week was characterized by a sideways-to-lower S&P 500 (INDEX: SPX) and implied volatility (IVOL) metrics, such as the Cboe Volatility Index (INDEX: VIX), rising.
Per IVOL the term structure, demand for options protections seems to be concentrated in options that are shorter-dated and far more sensitive to changes in direction and volatility.
That means for large shifts in price and/or volatility, hedging ratios (e.g., Delta) shift markedly, too. This prompts “hedging feedback mechanisms in both market directions,” per SpotGamma.
Graphic: Retrieved from VIX Central. Taken from The Market Ear. Updated 9/27/2022.
Moreover, the risks are skewed to the upside, SpotGamma added.
“For pumped-up options far from the money to retain their value, there essentially needs to be an adverse move (in price and volatility). Should nothing bad happen, the probability of these options paying out will fade, as will their exposure to direction (or Delta). [In] re-hedg[ing] decreased exposure to Delta, liquidity providers [] may provide the market with a boost.”
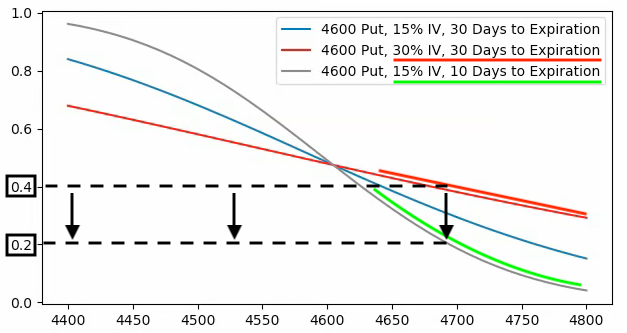
Graphic: Retrieved from SpotGamma. SPX prices X-axis. Option delta Y-axis. When the factors of implied volatility (Vanna) and time change (Charm), hedging ratios change. The graphic is for illustrational purposes, only.
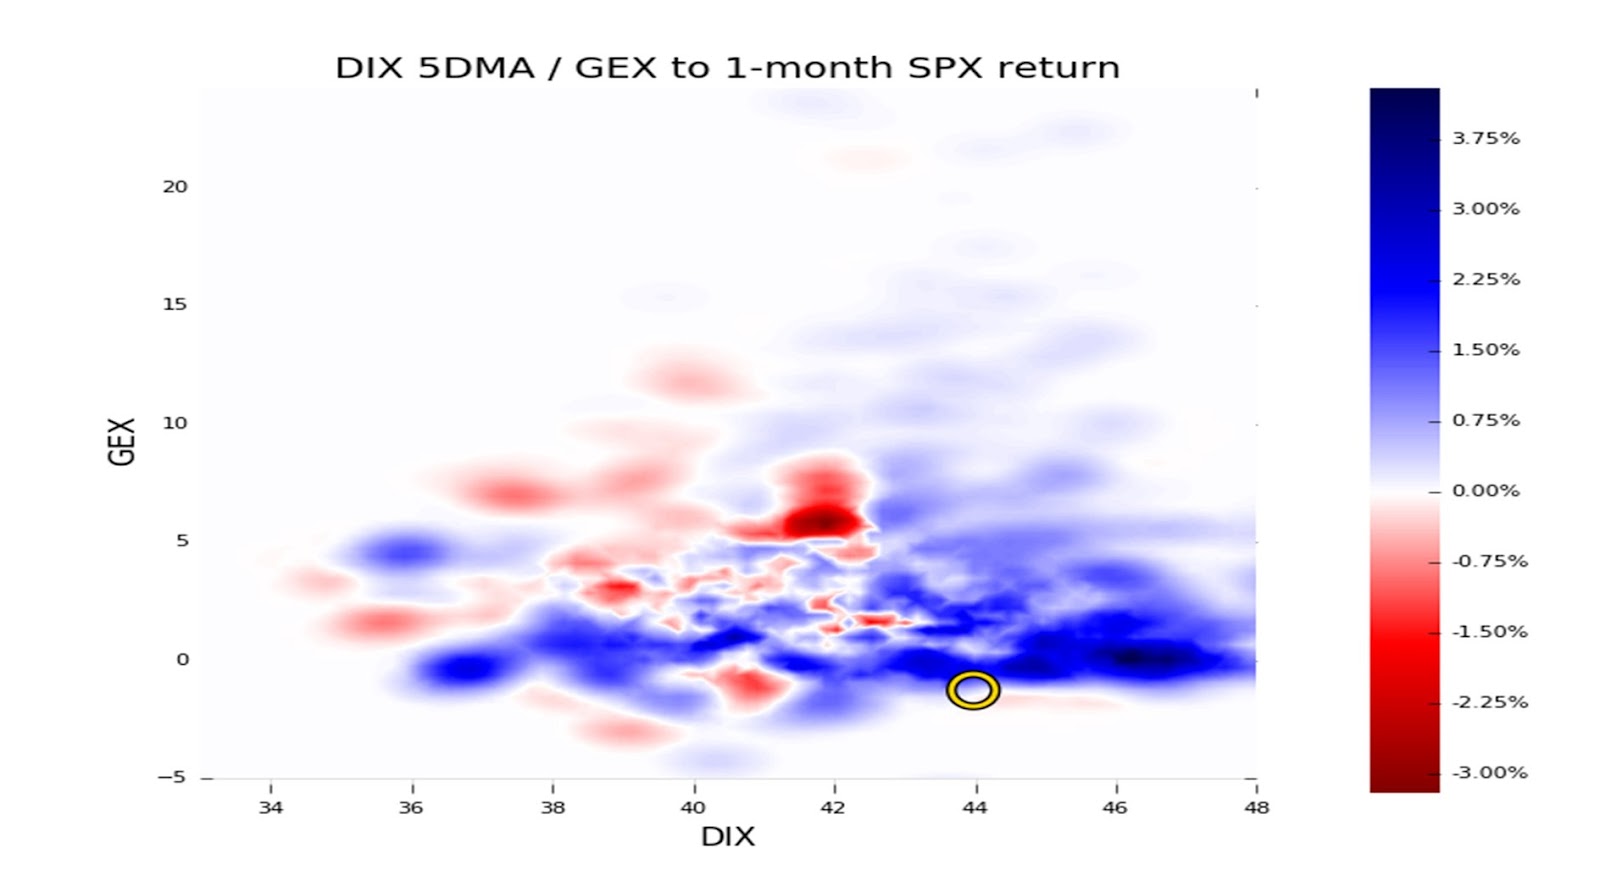
At the same time, there appears to be some “dealer disintermediation” amid “less incentive to make deep, tight markets” due to “capital constraints,” potentially, explained SqueezeMetrics, the creator of the DIX (Dark Pool Index).
This comes after months of high average readings in DIX (likely as market-makers assembled “basket[s] of S&P 500 stocks to create ETF shares, or to hedge away the exposure of a futures contract[s]”). Typically, high DIX readings are associated with stronger 1-month market returns, particularly when put flows are strong (i.e., lower Gamma exposure readings, like now).
Overall, the trend change is “suggestive of some second thoughts from the [buy-the-dip] crowd, and perhaps (likely!) some deleveraging from elsewhere,” SqueezeMetrics ended.
Technical
As of 8:20 AM ET, Wednesday’s regular session (9:30 AM – 4:00 PM ET), in the S&P 500, is likely to open in the upper part of a negatively skewed overnight inventory, inside of prior-range and -value, suggesting a limited potential for immediate directional opportunity.
In the best case, the S&P 500 trades higher.
Any activity above the $3,638.25 LVNode puts into play the $3,688.75 HVNode. Initiative trade beyond the HVNode could reach as high as the $3,722.50 LVNode and $3,771.25 HVnode, or higher.
In the worst case, the S&P 500 trades lower.
Any activity below the $3,638.25 LVNode puts into play the $3,610.75 HVNode. Initiative trade beyond the HVNode could reach as low as the $3,554.75 and $3,506.25 HVNode, or lower.
Click here to load today’s key levels into the web-based TradingView charting platform. Note that all levels are derived using the 65-minute timeframe. New links are produced, daily.
Graphic: 65-minute profile chart of the Micro E-mini S&P 500 Futures.
Definitions
Volume Areas: A structurally sound market will build on areas of high volume (HVNodes). Should the market trend for long periods of time, it will lack sound structure, identified as low volume areas (LVNodes). LVNodes denote directional conviction and ought to offer support on any test.
If participants were to auction and find acceptance into areas of prior low volume (LVNodes), then future discovery ought to be volatile and quick as participants look to HVNodes for favorable entry or exit.
POCs: POCs are valuable as they denote areas where two-sided trade was most prevalent in a prior day session. Participants will respond to future tests of value as they offer favorable entry and exit.
About
After years of self-education, strategy development, mentorship, and trial-and-error, Renato Leonard Capelj began trading full-time and founded Physik Invest to detail his methods, research, and performance in the markets.
Capelj also develops insights around impactful options market dynamics at SpotGamma and is a Benzinga reporter.
In no way should the materials herein be construed as advice. Derivatives carry a substantial risk of loss. All content is for informational purposes only.
Editor’s Note: The Daily Brief is a free glimpse into the prevailing fundamental and technical drivers of U.S. equity market products. Join the 200+ that read this report daily, below!
A lot to unpack, today. Part of the newsletter may be cut off, as a result, in your inbox. Just click to view in another window.
Overnight, equity index futures auctioned sideways-to-higher, masking turmoil in products listed abroad, as well as commodities and fixed income.
In regards to bonds, they slumped (globally) in light of participants’ pricing in monetary action given heightened inflation. The Federal Reserve, Bank of England, and Bank of Japan are to issue policy updates this week.
Commodity markets are still roiling after a price spike in some products “created a systemic risk” that prompted exchanges to cancel trades, while equity markets in Asia saw their worst-selling in years.
The Hang Seng China Enterprises Index (INDEX: HSCEI) closed down 7.2%, the biggest drop since 2008. This was after Russia asked for China’s assistance in Ukraine (which could result, later, in sanctions from the U.S.), thus compounding uncertainties with respect to an ongoing regulatory crackdown.
Ahead is data on 1- and 3-year inflation expectations (11:00 AM ET).
Graphic updated 6:11 AM ET. Sentiment Neutral if expected /ES open is inside of the prior day’s range. /ES levels are derived from the profile graphic at the bottom of the following section. Levels may have changed since initially quoted; click here for the latest levels. SqueezeMetrics Dark Pool Index (DIX) and Gamma (GEX) calculations are based on where the prior day’s reading falls with respect to the MAX and MIN of all occurrences available. A higher DIX is bullish. At the same time, the lower the GEX, the more (expected) volatility. Learn the implications of volatility, direction, and moneyness. SHIFT data used for S&P 500 (INDEX: SPX) options activity. Note that options flow is sorted by the call premium spent; if more positive, then more was spent on call options. Breadth reflects a reading of the prior day’s NYSE Advance/Decline indicator. VIX reflects a current reading of the CBOE Volatility Index (INDEX: VIX) from 0-100.
What To Expect
Fundamental: We may attribute participants’ uncertainty to how far monetary policymakers want to tighten, slower economic growth, the implications of geopolitical tensions, imminent Russian defaults, a resurgence in COVID-19 abroad, and more.
Graphic: Via Bloomberg. As Treasury yields rise, participants price in Fed tightening.
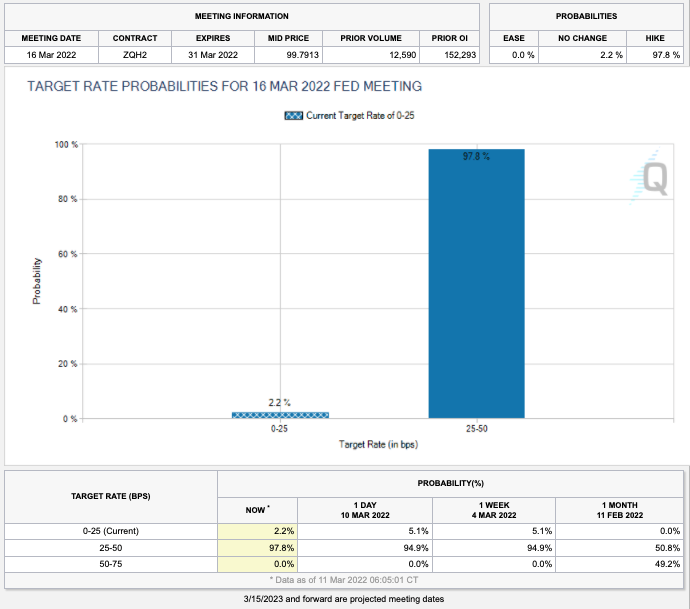
As revealed by metrics like CME Group Inc’s (NASDAQ: CME) FedWatch Tool, for instance, participants are pricing a high certainty of an increase in rates.
Graphic: Via CME Group Inc (NASDAQ: CME). Participants price in an increased probability of a shift in the target rate. Click here to access the FedWatch Tool.
“Yields are reflecting a surprise higher shift upward in inflation expectations,” said Morgan Stanley’s (NYSE: MS) Jim Caron. “Many thought inflation would peak in the first quarter and fall. Now, with oil prices, inflation may stay high.”
At the same time, there are some indications of market stresses.
Graphic: Via McClellan Financial Publications. “The Daily A-D Line for corporate high yield bonds continues to look quite ugly. That is a concern for the overall stock market because high yield bonds drink from the same liquidity pool as stocks do, and these bonds are arguably more sensitive than stocks are to liquidity problems.”
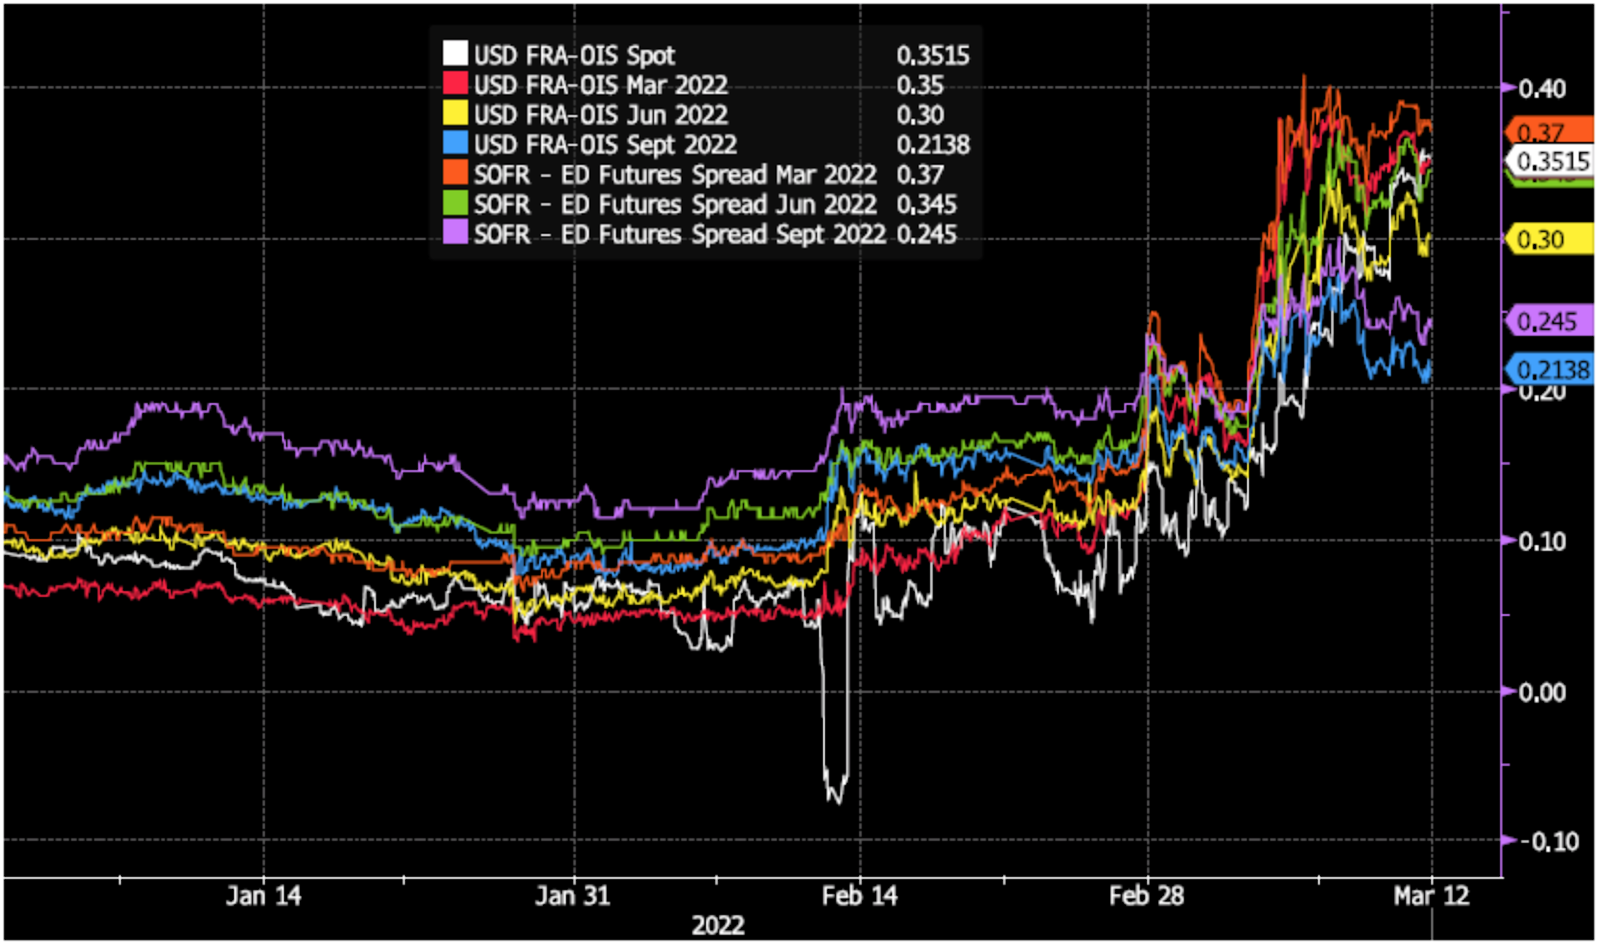
As explained in DC’s Chartbook discussion, however, “stress in money markets is for now mostly contained and not an imminent risk to financial sustainability.”
Graphic: Via DC’s Chartbook. Funding spreads “have stabilized over the past week, not making new highs after the gap-up open on March 7. These are encouraging signs that the stress in money markets is for now mostly contained and not an imminent risk to financial stability.”
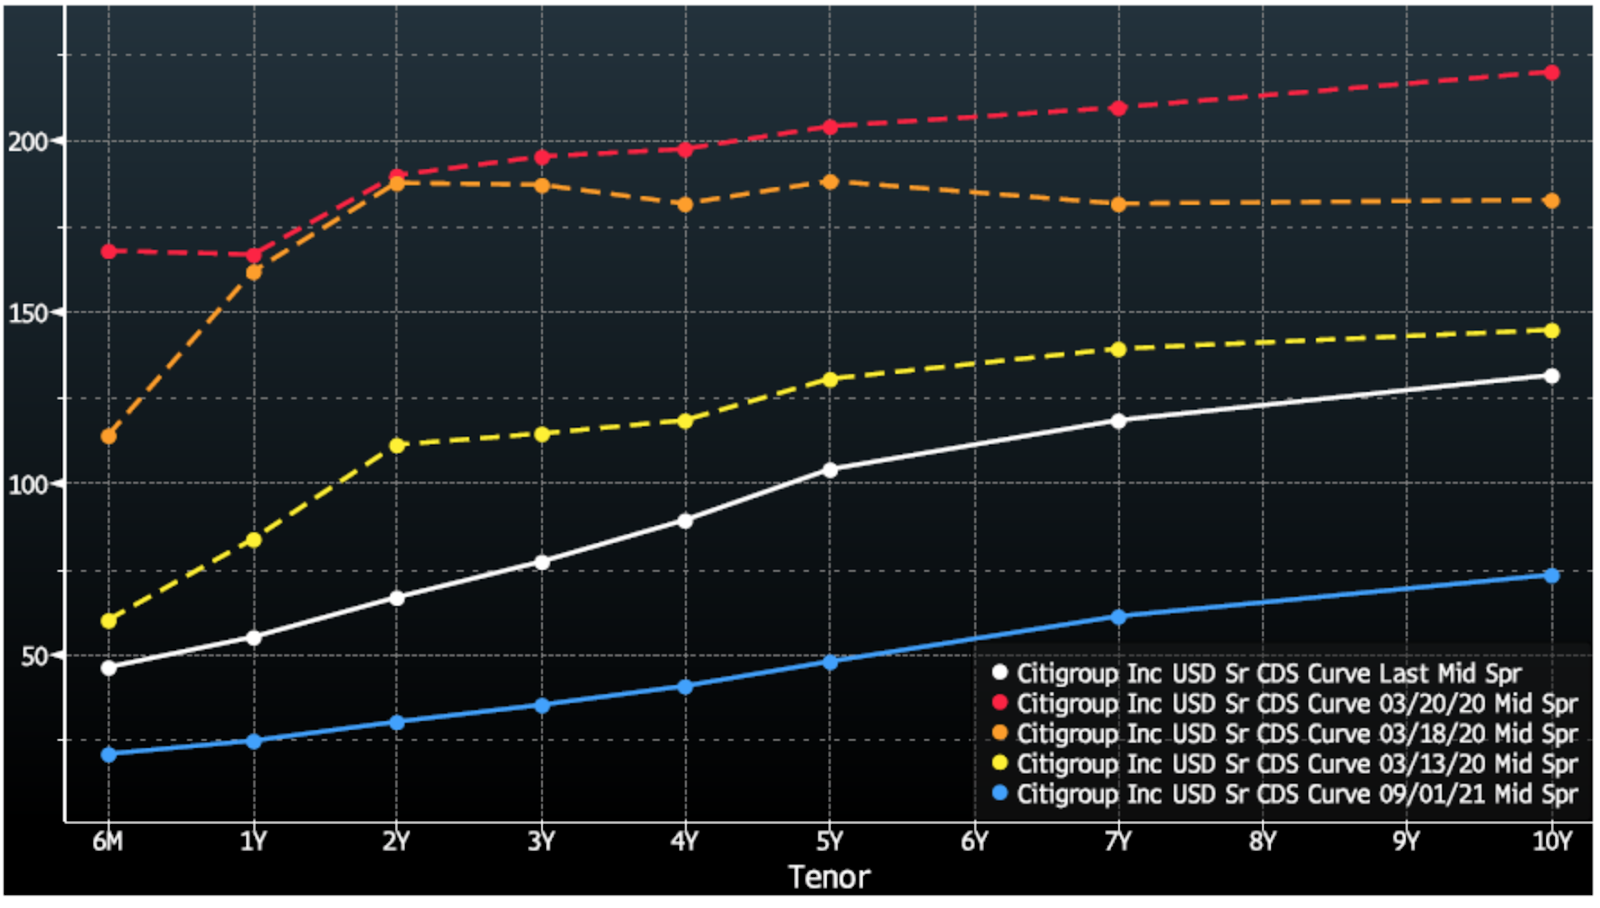
In regards to credit default swap spreads, though they are wider than in recent history, “they are still far below where they were during times of material solvency risk such as March of 2020, and the term structure of CDS spreads suggests this is more due to mechanical de-risking.”
Graphic: Via DC’s Chartbook. Cost of credit insurance for Citigroup Inc (NYSE: C). Hedging with CDS results in mechanical steepening which raises the curve. “This is in sharp contrast to the curve in March 2020 (yellow, orange, and red), when the short end of the CDS curve rose quickly and flattened the curve.”
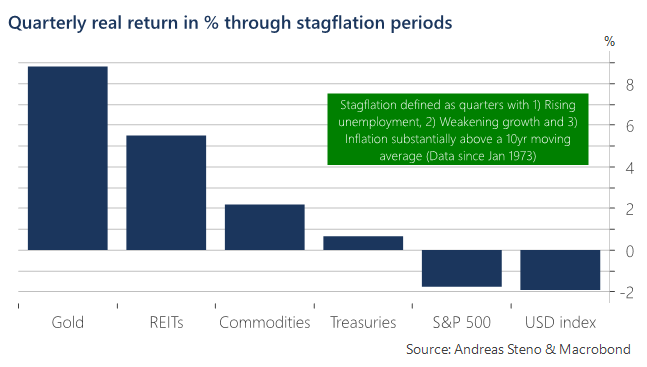
Okay. So, the “financial system is functioning smoothly.” How do you trade slowing growth in the face of heightened inflation?
As Andreas Steno Larsen of Heimstaden explains, the “best way to assess this question is via a historical study of empirical returns during times of actual stagflation dating back to the early 1970s.”
Graphic: Via Andreas Steno Larsen. “Heatmap on quarterly inflation-adjusted returns across asset classes during stagflation periods (1973 – today).”
“Assets that tend to keep the value intact or even increase in real terms through stagflation are typically negatively correlated to low or negative real rates, which is why gold and real estate (REITs) are some of the best places to hide during stagflation,” Steno Larsen says.
“Equities overall struggle to perform in real terms and so do bonds, which might be even worse this time around due to the outset of bond yields into this potential stagflationary environment.”
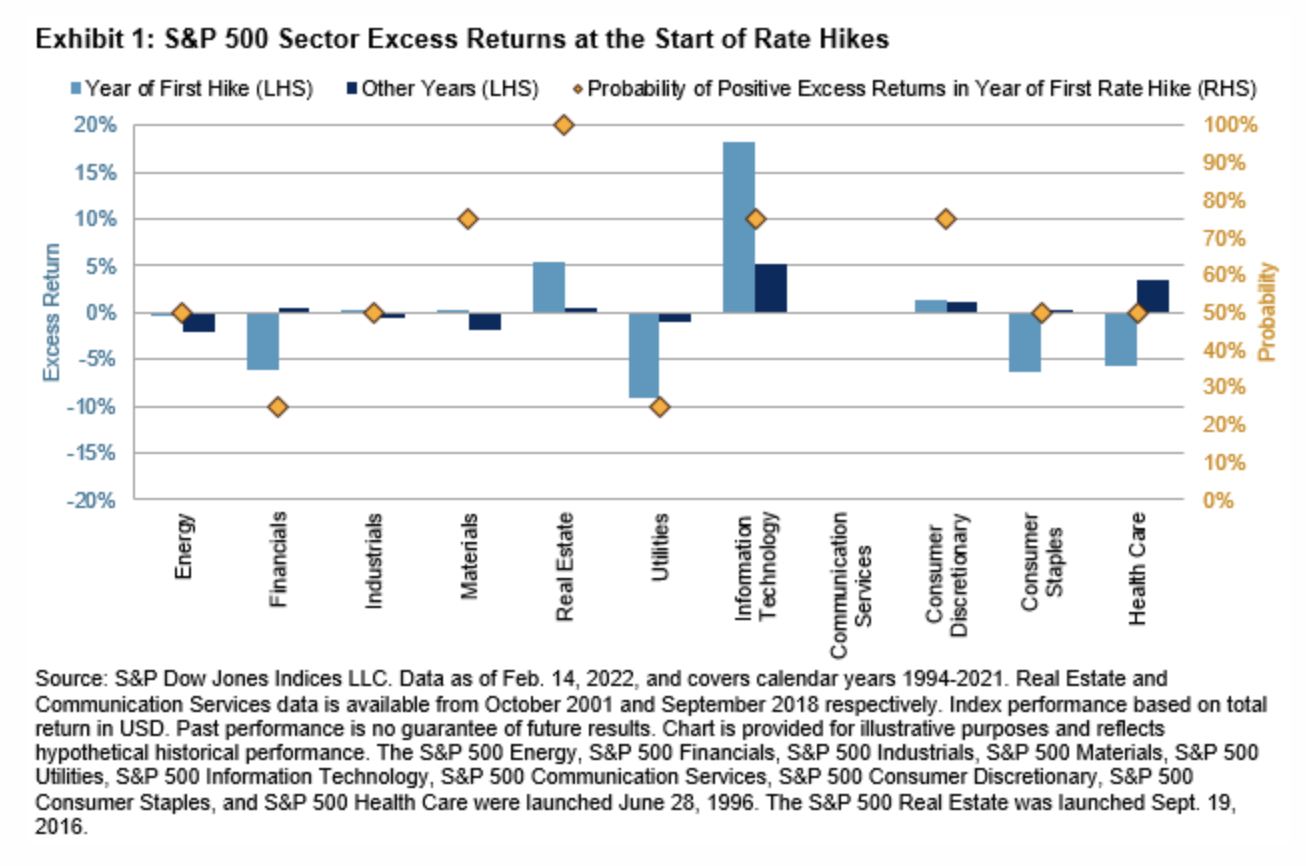
To note, pursuant to the idea that participants have “priced in” the aforementioned, S&P Global Inc (NYSE: SPGI) data suggests “the initial stages of a monetary tightening cycle have not been disastrous for the U.S. stock market historically.”
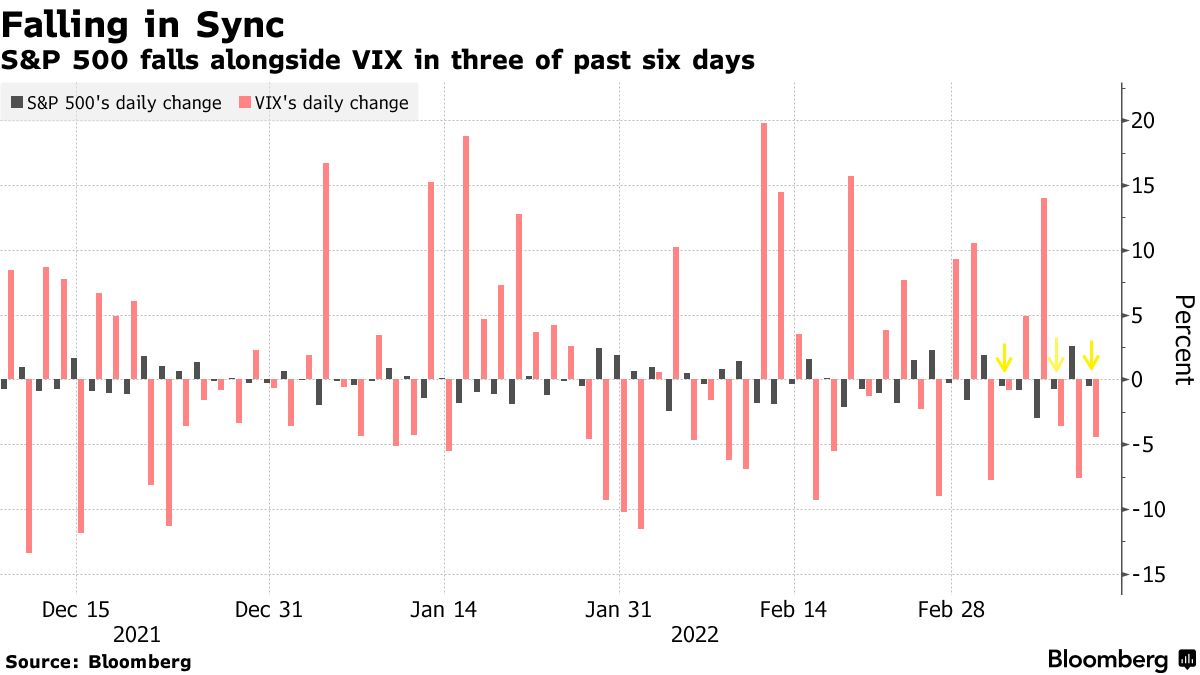
Positioning: Based on a comparison of present options positioning and buying metrics, the returns distribution is skewed positive.
This is in the face of an S&P 500 (INDEX: SPX) and Cboe Volatility Index (INDEX: VIX) down environment.
Graphic: Via Bloomberg. S&P 500 (INDEX: SPX) down, CBOE Volatility Index (INDEX: VIX) down.
In part, this has to do with the supply and demand of protection; mainly, the market is “well hedged and well-positioned,” Amy Wu Silverman of Royal Bank of Canada’s (NYSE: RY) says.
Graphic: Via SpotGamma. “Netting call & put delta, you can see we’re near extremes in terms of put:call positions. Often large put positions are removed by expirations, which seems to coincide with market lows. Many of these are quarterly expirations which coincide w/FOMC meetings – such as next week.”
Given this, as JPMorgan Chase & Co (NYSE: JPM) analysts explain, “we could be closer to the end” of discretionary de-risking, and the compression of volatility (via passage of FOMC), as well as the removal of counterparty negative exposure (via OPEX) may serve to alleviate pressure.
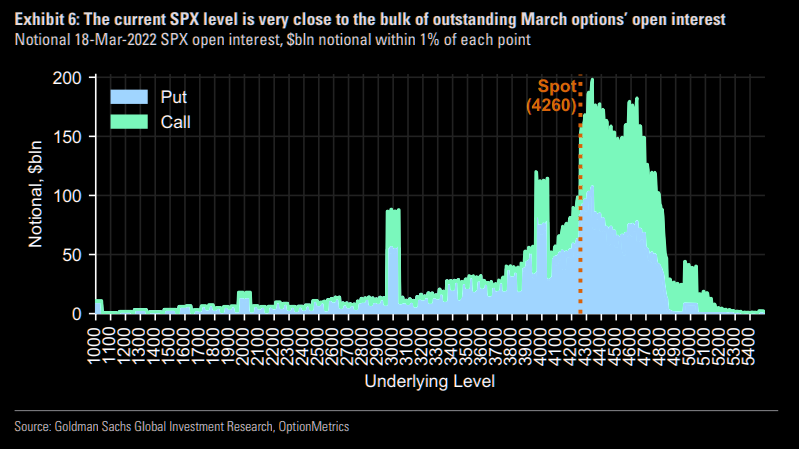
Graphic: Via Goldman Sachs Group Inc (NYSE: GS). Taken from The Market Ear. “18-Mar has more expiring near-the-money SPX open interest than any expiration since 2019.”
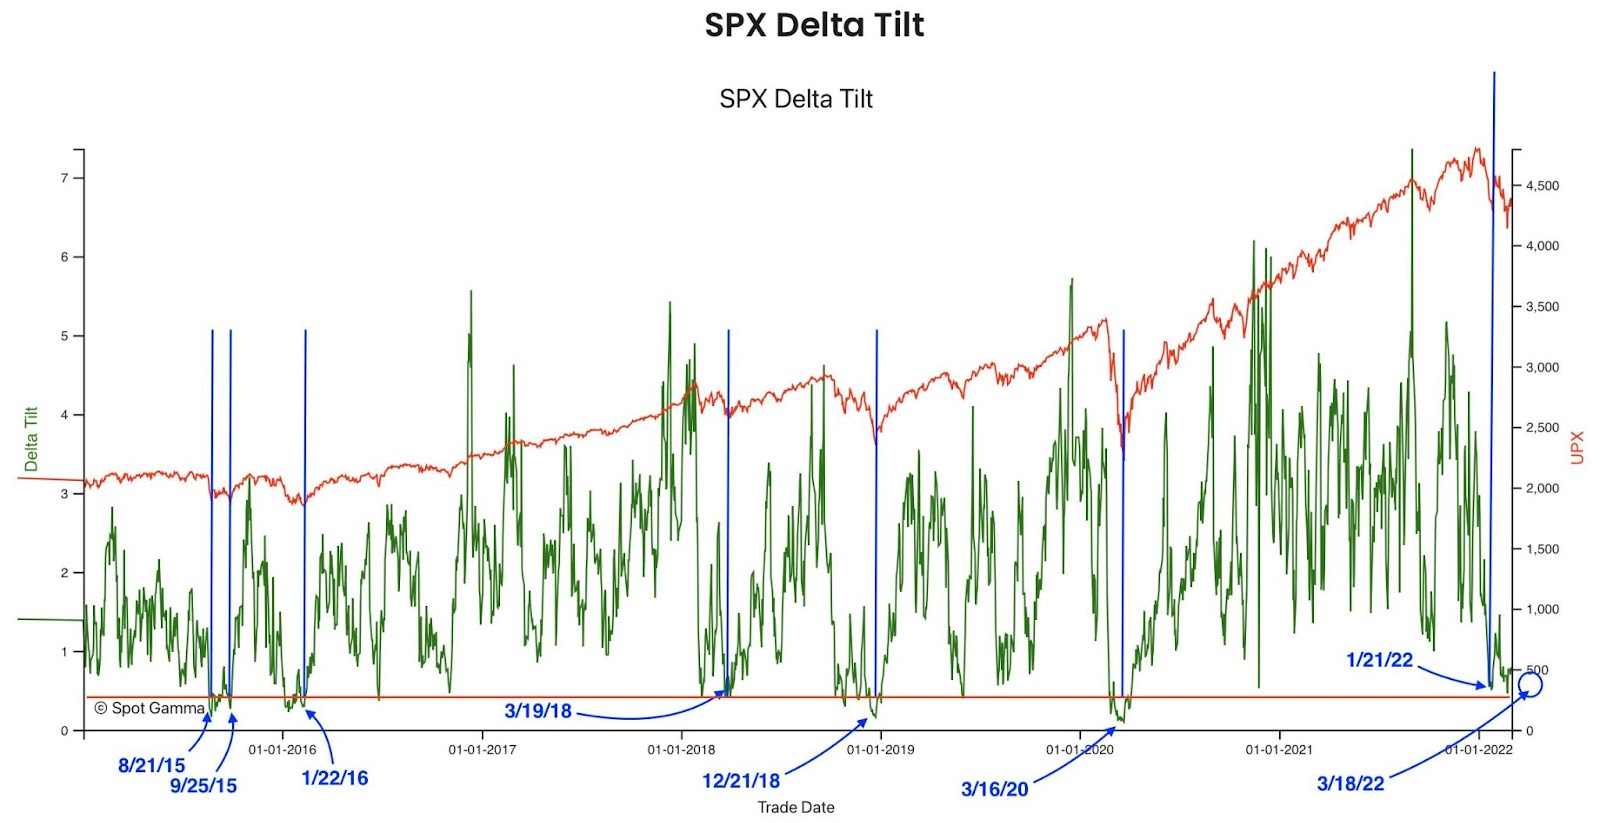
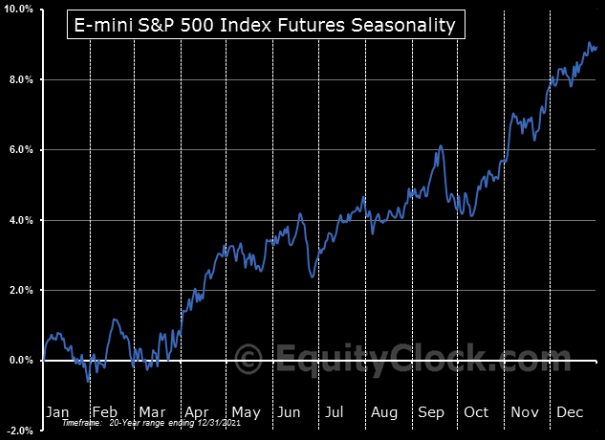
As SpotGamma, explains, “As it stands, without further geopolitical events causing, even more, fear, the markets are due for a relief rally,” on improving seasonality, among other things.
“Following the FOMC meeting, as well as the reduction in put-heavy exposures post-OPEX (options expiration), the need for put ownership (protection) and relative short positions is reduced (less positive delta = less selling to hedge = less pressure).”
Graphic: Via EquityClock. Taken from The Market Ear.
Technical: As of 6:30 AM ET, Monday’s regular session (9:30 AM – 4:00 PM ET), in the S&P 500, will likely open in the middle part of a positively skewed overnight inventory, inside of prior-range and -value, suggesting a limited potential for immediate directional opportunity.
In the best case, the S&P 500 trades higher; activity above the $4,227.75 high volume area (HVNode) puts in play the $4,249.25 low volume area (LVNode). Initiative trade beyond the LVNode could reach as high as the $4,285.25 and $4,314.75 HVNode, or higher.
In the worst case, the S&P 500 trades lower; activity below the $4,227.75 HVNode puts in play the $4,189.00 regular trade low (RTH Low). Initiative trade beyond the RTH Low could reach as low as the $4,138.75 and $4,101.25 overnight low (ONL), or lower.
Considerations: Participants resolve a pinch of two anchored volume-weighted average price indicators (VWAPs). A VWAP is a metric highly regarded by chief investment officers, among other participants, for quality of trade. Additionally, liquidity algorithms are benchmarked and programmed to buy and sell around VWAPs.
We look to buy above a flat/rising VWAP pinch. We look to sell below a flat/declining VWAP pinch.
Click here to load today’s key levels into the web-based TradingView charting platform. Note that all levels are derived using the 65-minute timeframe. New links are produced, daily.
Graphic: 65-minute profile chart of the Micro E-mini S&P 500 Futures.
Definitions
Overnight Rally Highs (Lows): Typically, there is a low historical probability associated with overnight rally-highs (lows) ending the upside (downside) discovery process.
Volume Areas: A structurally sound market will build on areas of high volume (HVNodes). Should the market trend for long periods of time, it will lack sound structure, identified as low volume areas (LVNodes). LVNodes denote directional conviction and ought to offer support on any test.
If participants were to auction and find acceptance into areas of prior low volume (LVNodes), then future discovery ought to be volatile and quick as participants look to HVNodes for favorable entry or exit.
POCs: POCs are valuable as they denote areas where two-sided trade was most prevalent in a prior day session. Participants will respond to future tests of value as they offer favorable entry and exit.
About
After years of self-education, strategy development, mentorship, and trial-and-error, Renato Leonard Capelj began trading full-time and founded Physik Invest to detail his methods, research, and performance in the markets.
Capelj is also a Benzinga finance and technology reporter interviewing the likes of Shark Tank’s Kevin O’Leary, JC2 Ventures’ John Chambers, FTX’s Sam Bankman-Fried, and ARK Invest’s Catherine Wood, as well as a SpotGamma contributor developing insights around impactful options market dynamics.
Disclaimer
Physik Invest does not carry the right to provide advice.
In no way should the materials herein be construed as advice. Derivatives carry a substantial risk of loss. All content is for informational purposes only.
Editor’s Note: The Daily Brief is a free glimpse into the prevailing fundamental and technical drivers of U.S. equity market products. Join the 200+ that read this report daily, below!
Overnight, equity index futures auctioned lower practically negating the prior day’s advance. Per the news, Ukraine and Russia failed in their efforts to end the war.
Adding, similar to days prior, areas where there are key technical nuances served as supports and resistances. One may construe this as short-term traders’ dominance in the smaller time horizons while the other time frames are positioning for expansive moves (yet to happen).
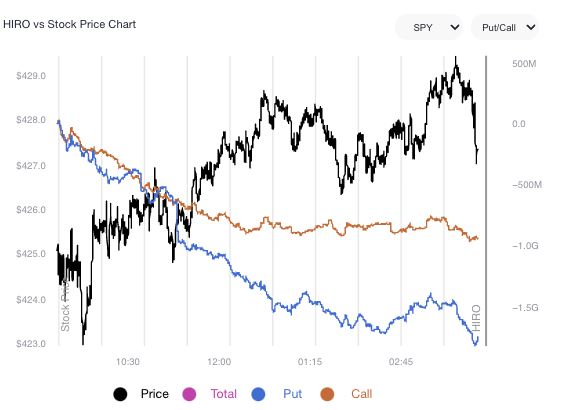
To note, key metrics under the hood (SpotGamma’s HIRO, among other things) yesterday, further validated the status quo and short-covering.
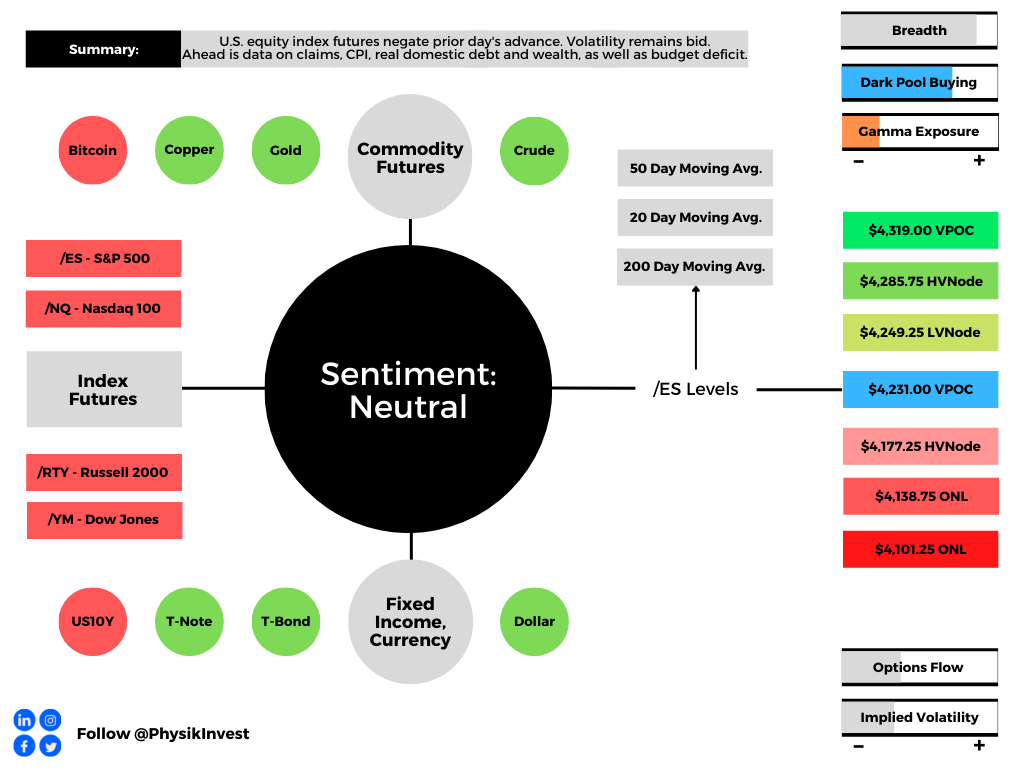
Moreover, ahead is data on jobless claims and the consumer price index (8:30 AM ET). Later, participants get data on real domestic nonfinancial debt and wealth (1:00 PM ET), as well as the budget deficit (2:00 PM ET).
Graphic updated 6:40 AM ET. Sentiment Neutral if expected /ES open is inside of the prior day’s range. /ES levels are derived from the profile graphic at the bottom of the following section. Levels may have changed since initially quoted; click here for the latest levels. SqueezeMetrics Dark Pool Index (DIX) and Gamma (GEX) calculations are based on where the prior day’s reading falls with respect to the MAX and MIN of all occurrences available. A higher DIX is bullish. At the same time, the lower the GEX, the more (expected) volatility. Learn the implications of volatility, direction, and moneyness. SHIFT data used for S&P 500 (INDEX: SPX) options activity. Note that options flow is sorted by the call premium spent; if more positive, then more was spent on call options. Breadth reflects a reading of the prior day’s NYSE Advance/Decline indicator. VIX reflects a current reading of the CBOE Volatility Index (INDEX: VIX) from 0-100.
What To Expect
Fundamental: The consumer price index (CPI) is to likely accelerate to 7.8% from a year ago.
This forecast varies widely, however, based on economic analysis with respect to the implications of Russia’s invasion of Ukraine and the sanction that resulted after.
“There’s going to be a lot of noise in the next six months that’s going to be extremely difficult to disentangle,” said Omair Sharif of Inflation Insights LLC.
“If you thought it was difficult to figure out what used car prices were doing and whether that was transitory, multiply that by a thousand.”
In a mention on energy market volatility, while today’s economy is less dependent on oil (i.e., less likely to kill the expansion), the action in that market (and the responses it may solicit from policymakers, later) is noteworthy.
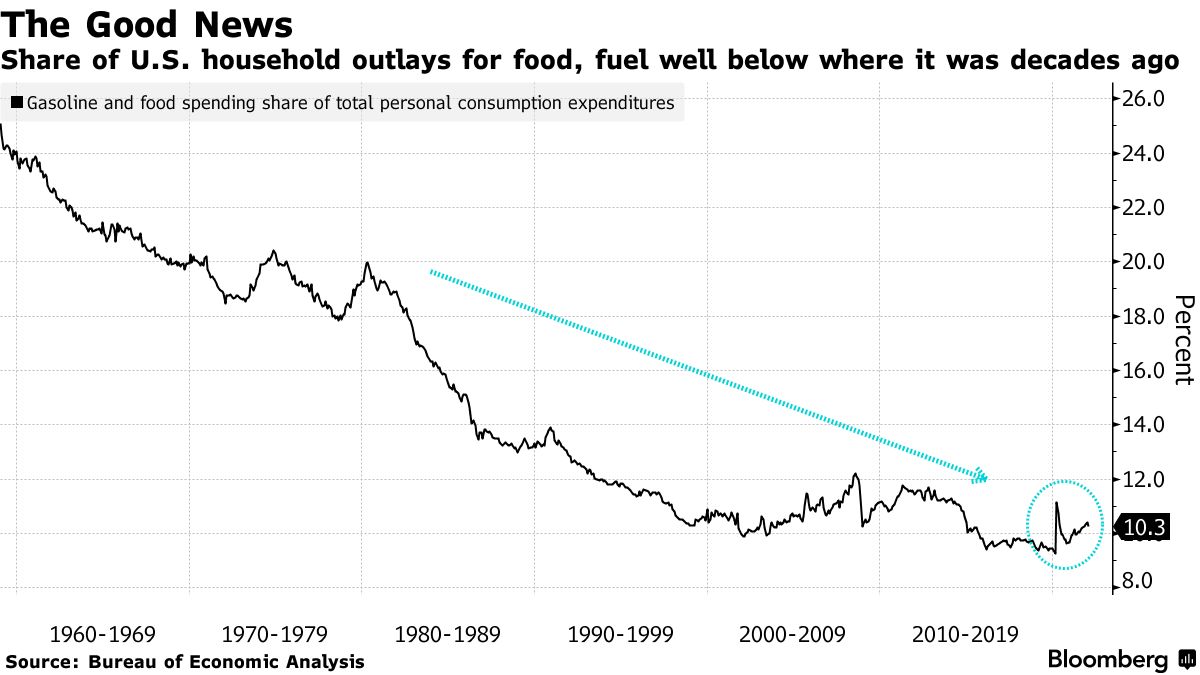
Graphic: Via Bloomberg. “When families have to spend more money on necessities, they have less to spend on discretionary items and services. Economists at Barclays Plc expect the spike in energy prices to subtract an annualized 0.3 percentage point from consumption growth on average per quarter through the end of 2023.”
Despite a deterioration in the relationship between prices of crude and inflation, oil is “a major input in the economy – it is used in critical activities such as fueling transportation and heating homes – and if input costs rise, so should the cost of end products,” Investopedia says well.
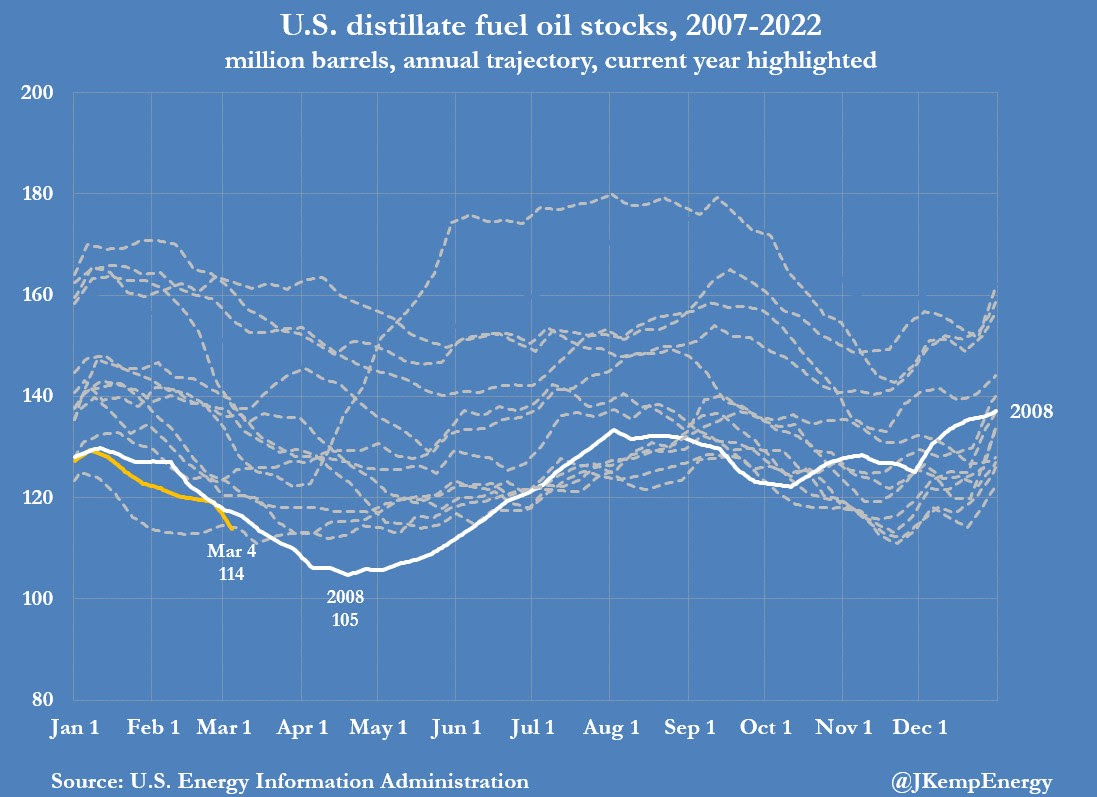
Further, according to Reuters’ John Kemp, fuel oil inventories fell last week to the lowest seasonal level in more than 15 years.
Graphic: Via John Kemp’s “Best in Energy” note. “Distillate stocks were already looking tight and are now on track to become exceptionally tight before mid-year. Distillate inventories are on course for an expected first-half low of 103 million barrels (with a range of 92-114 million).”
“Stocks are on track to hit an even lower seasonal level than 2008 when the distillate shortages helped propel crude oil prices to a record high at the middle of the year,” Kemp says.
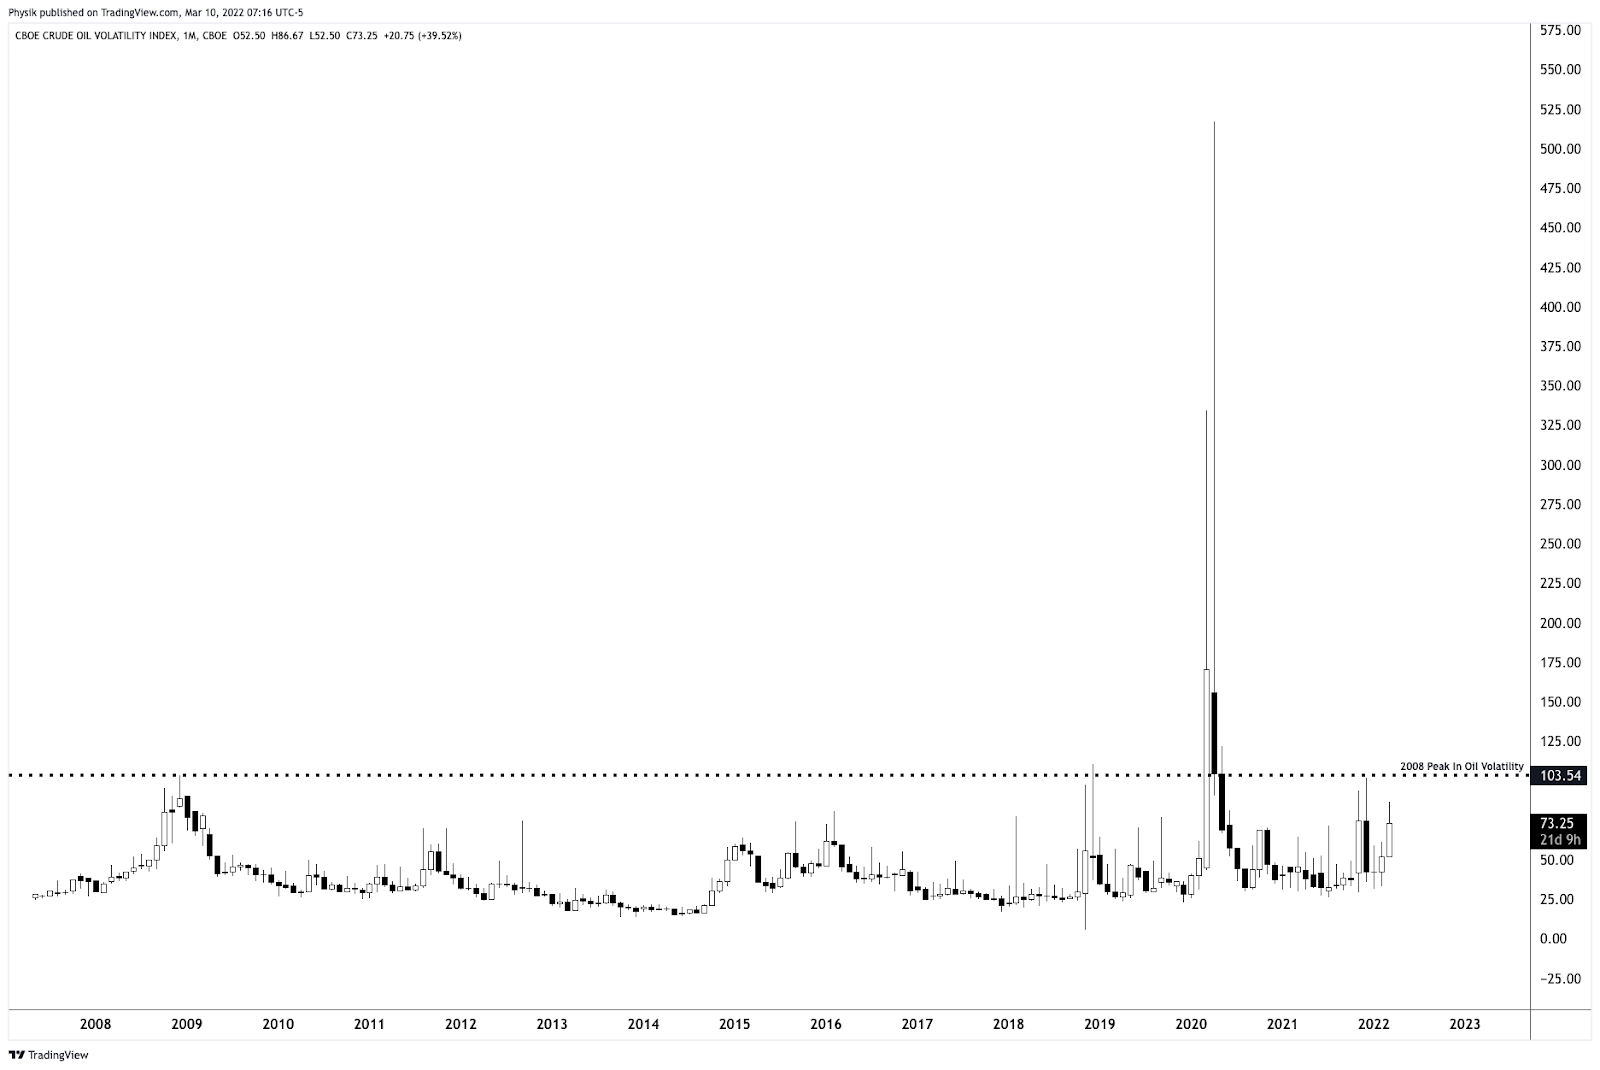
Graphic: Via Physik Invest. The CBOE Crude Oil Volatility Index (INDEX: OVX) reveals signs of peaking.
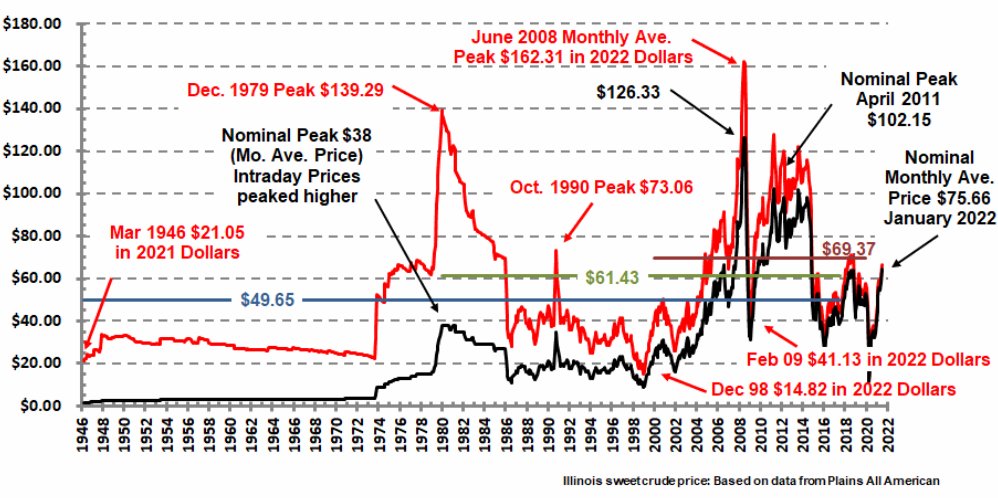
The highest oil prices ~$150/bbl had printed in 2008. As Alfonso Peccatiello of The Macro Compass hypothesizes, “Oil is denominated in fiat currency, and there has been A LOT of spendable money printing over the last 15 years. If you think the market gets as extreme as 2008, the equivalent oil price in today’s USD would be above $250/bbl.”
Given wage growth and the like, consumers likely start “to feel the heat way below $250.”
Graphic: Via Alfonso Peccatiello. “The red line shows the inflation-adjusted crude price: if you expect a proper tight oil environment, >$150-160 is your number. Also, anything above $120 in today’s prices and sustained for a few quarters would likely hit the demand side. 2013-2014 a good example, with the private sector turning defensive in 2015-2016 and China forced to ease big times to shore up the global economy.”
Why mention any of this? Fast moves higher in some of these commodity markets may impact end-consumer prices and behavior, quickly. In a bid to rein inflation – ”very high CPI in 2022, [and] still high in 2023 – central bankers will tighten.
“The path of least resistance is for the Fed to hike rates from 0% to at least 2% relatively quickly,” Peccatiello explains in a recent post.
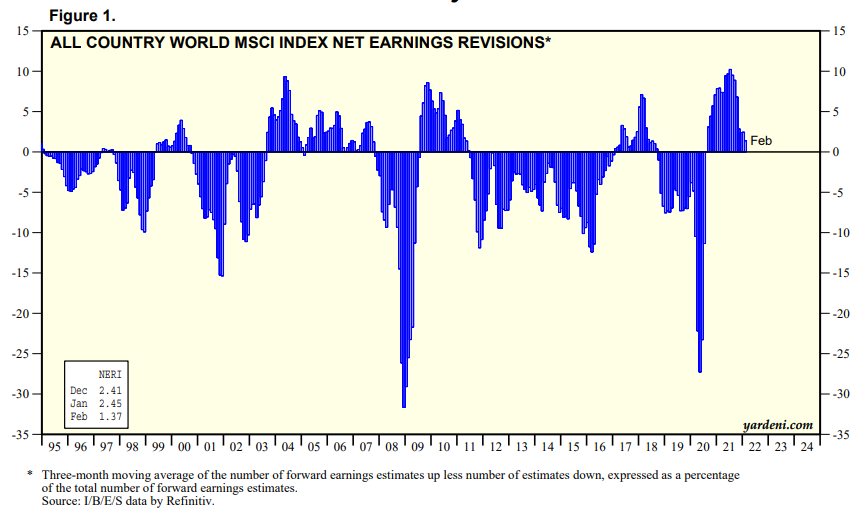
However, the “Last time companies were revising their forward earnings estimates down on a net basis while Central Banks were attempting to tighten monetary policy was mid-2018,” when the markets sold nearly 20%.
Graphic: Via Yardeni Research. Taken from The Macro Compass. “The chart above shows the 3-months average of the MSCI World net earnings revisions: essentially, this metric measures the difference between the number of companies revisiting their forward earnings estimate up versus down.”
With financial conditions tightening, Peccatiello posits the Fed will be receptive to that.
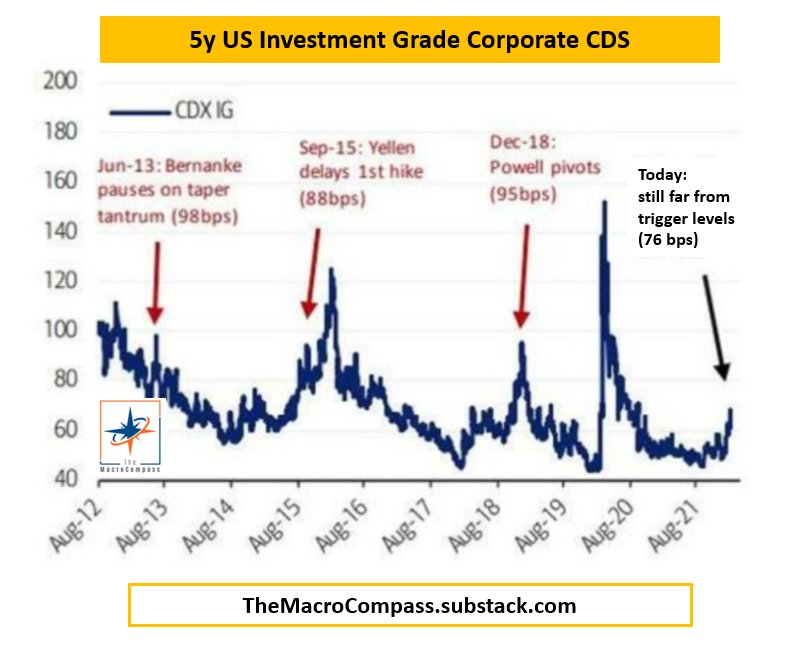
Graphic: Via The Macro Compass. “Credit-default swaps on 5-year US Investment Grade Corporate Bonds are trading at 76 bps at the time of writing: Fed puts (or pivots) became more visible in the past when this measure of credit spreads approached 100 bps.”
Basically, if selling were to continue, the Fed would reassess tightening. At such level of reassessment is the Fed Put, a dynamic we’ve discussed in the past.
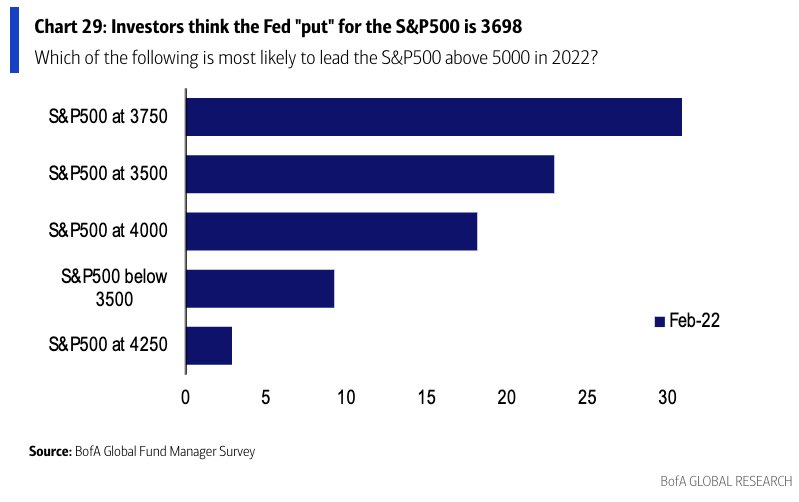
Graphic: Via Bank of America Corporation (NYSE: BAC). Retrieved from Callum Thomas.
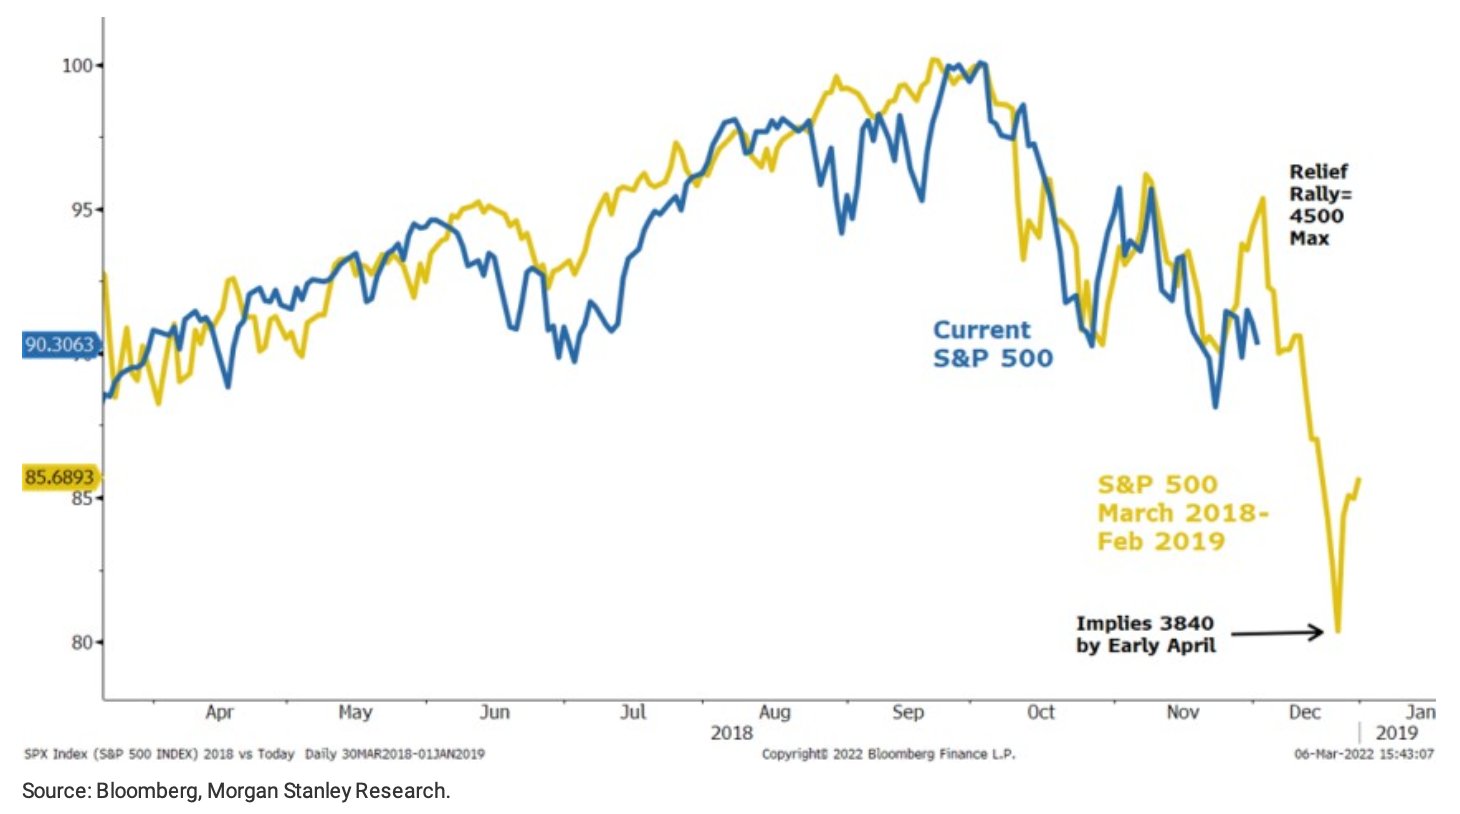
Chamath Palihapitiya recently posted about this, too. He said: “In 2018, the Fed was concerned about inflation. They were wrong and within a quarter or so, the risk shifted to recession. This chart shows how the equity markets reacted… seems eerily similar.”
“Value then faded and Growth ripped.”
Graphic: Via Morgan Stanley (NYSE: MS).
Positioning: Based on a comparison of present options positioning and buying metrics, the returns distribution is skewed positive, albeit less so than before.
Obviously, the fundamental picture and the market’s responsiveness to news events – given the negative gamma environment – has us discounting these metrics. It’s noteworthy, nonetheless.
For instance, in the face of some positive developments abroad, fundamentally, markets diverged from what participants in the options complex were doing.
Graphic: SpotGamma’s Hedging Impact of Real-Time Options (HIRO) indicator reveals strong put buying and call selling (a bearish negative delta trade) in the context of Wednesday’s rise.
This divergence resolved itself, some, overnight in the broader market (even in the face of a ~7% price rise of Amazon Inc (NASDAQ: AMZN) large index constituent).
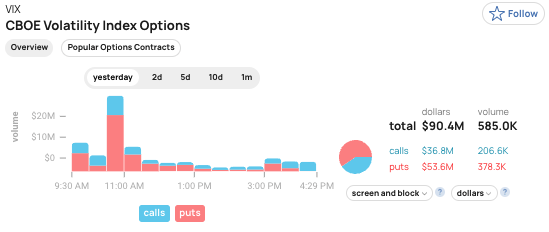
I’d be remiss if I did not point out growing bets on drops in the equity market’s pricing of risk (via the CBOE Volatility Index [INDEX: VIXI]). That would occur if indexes likely rebounded.
Graphic: Via SHIFT. There was heavy buying of the 26 VIX put.
Taken together, it’s difficult to get a grasp of where the market wants to head, in the near term.
What is for certain: the compression of volatility (via passage of FOMC) or removal of counterparty negative exposure (via OPEX) may serve to alleviate some of this pressure.
Until then, participants can expect the options landscape to add to market volatility.
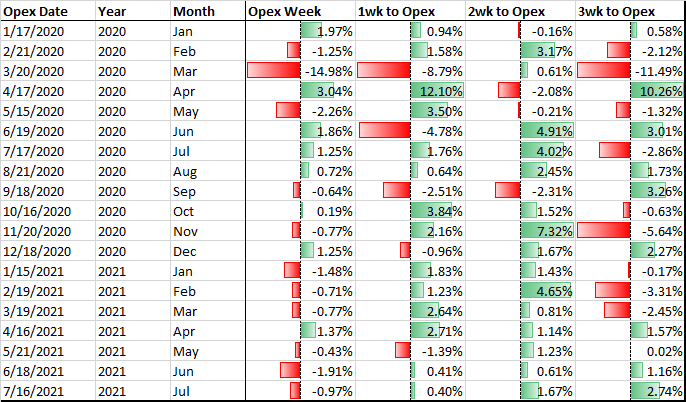
Graphic: @pat_hennessy breaks down returns for the S&P 500, categorized by the week relative to OPEX.
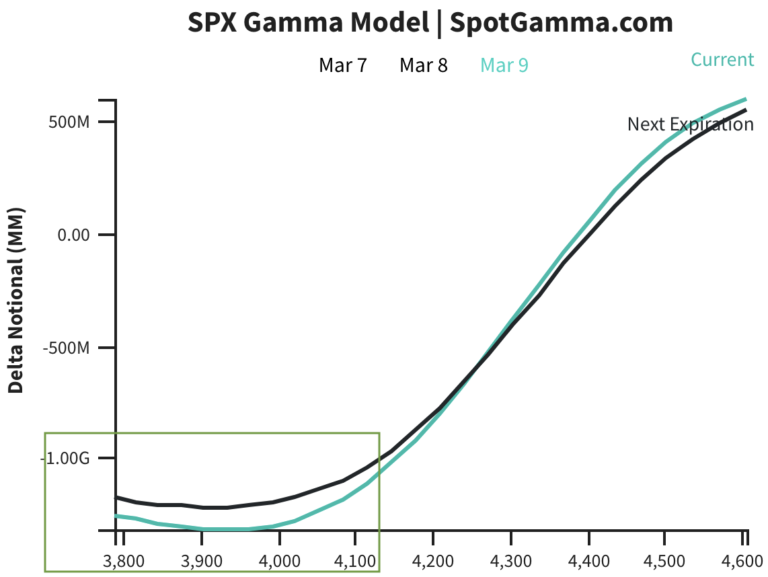
In case of lower prices, according to SpotGamma, the rate at which options counterparties increasingly add pressure on underlying SPX, so to speak, tapers off in the $4,100.00 to $4,000.00 area. Caution.
Graphic: Gamma profile flattens out near the $4,100-4,000 range suggesting less pressure and more counterparty support.
A way to take advantage of this volatility, while lowering the cost of bets, is options spreads. For instance, the Call Ratio (buy 1 call, sell 2 or more further out) can lower the cost of bets on the upside while providing exposure to asymmetric payouts.
Time and volatility are two factors, however, to be mindful of when initiating such spreads. Risk is undefined and if the time to expiry is too long (e.g., in excess of 1-2 weeks), fast moves and increases in volatility may result in large losses.
For that reason, also, one must be extremely careful with Put Ratio spreads. Consider adding protection far away from your short strikes to cap risk and turn the spreads into Butterflies.
Graphic: Via Banco Santander SA (NYSE: SAN) research, the return profile, at expiry, of a classic 1×2 (long 1, short 2 further away) ratio spread.
Technical: As of 6:30 AM ET, Thursday’s regular session (9:30 AM – 4:00 PM ET), in the S&P 500, will likely open in the lower part of a negatively skewed overnight inventory, inside of prior-range and -value, suggesting a limited potential for immediate directional opportunity.
Gap Scenarios Potentially In Play: Gaps ought to fill quickly. Should they not, that’s a signal of strength; do not fade. Leaving value behind on a gap-fill or failing to fill a gap (i.e., remaining outside of the prior session’s range) is a go-with indicator.

Auctioning and spending at least 1-hour of trade back in the prior range suggests a lack of conviction; in such a case, do not follow the direction of the most recent initiative activity.
In the best case, the S&P 500 trades higher; activity above the $4,231.00 regular trade low (RTH Low) puts in play the $4,249.25 low volume area (LVNode). Initiative trade beyond the LVNode could reach as high as the $4,285.75 high volume area (HVNode) and $4,319.00 untested point of control (VPOC), or higher.
In the worst case, the S&P 500 trades lower; activity below the $4,231.00 RTH Low puts in play the $4,177.25 HVNode. Initiative trade beyond the HVNode could reach as low as the $4,138.75 and $4,101.25 overnight low (ONL), or lower.
Considerations: Push-and-pull, as well as responsiveness near key-technical areas (that are discernable visually on a chart), suggests technically-driven traders with short time horizons are very active.
Such traders often lack the wherewithal to defend retests and, additionally, the type of trade may be indicative of the other time frame participants waiting for more information to initiate trades.
Click here to load today’s key levels into the web-based TradingView charting platform. Note that all levels are derived using the 65-minute timeframe. New links are produced, daily.
Graphic: 65-minute profile chart of the Micro E-mini S&P 500 Futures.
Definitions
Overnight Rally Highs (Lows): Typically, there is a low historical probability associated with overnight rally-highs (lows) ending the upside (downside) discovery process.
Volume Areas: A structurally sound market will build on areas of high volume (HVNodes). Should the market trend for long periods of time, it will lack sound structure, identified as low volume areas (LVNodes). LVNodes denote directional conviction and ought to offer support on any test.
If participants were to auction and find acceptance into areas of prior low volume (LVNodes), then future discovery ought to be volatile and quick as participants look to HVNodes for favorable entry or exit.
POCs: POCs are valuable as they denote areas where two-sided trade was most prevalent in a prior day session. Participants will respond to future tests of value as they offer favorable entry and exit.
About
After years of self-education, strategy development, mentorship, and trial-and-error, Renato Leonard Capelj began trading full-time and founded Physik Invest to detail his methods, research, and performance in the markets.
Capelj is also a Benzinga finance and technology reporter interviewing the likes of Shark Tank’s Kevin O’Leary, JC2 Ventures’ John Chambers, FTX’s Sam Bankman-Fried, and ARK Invest’s Catherine Wood, as well as a SpotGamma contributor developing insights around impactful options market dynamics.
Disclaimer
Physik Invest does not carry the right to provide advice.
In no way should the materials herein be construed as advice. Derivatives carry a substantial risk of loss. All content is for informational purposes only.