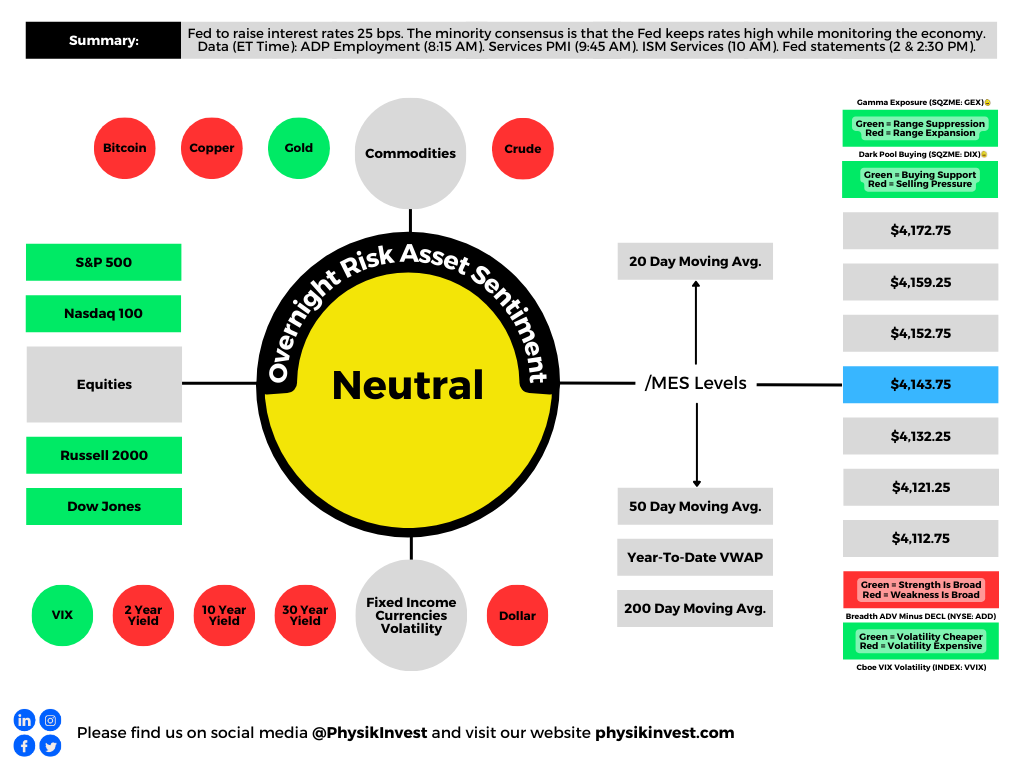
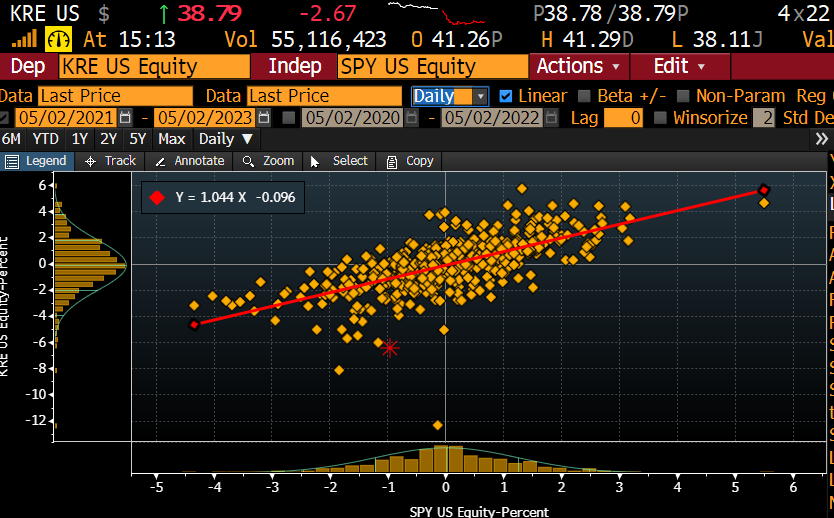
The S&P 500 (INDEX: SPX) recovered after a violent sell-off led by products like the SPDR S&P Regional Banking ETF (NYSE: KRE). This is before updates on the Federal Reserve’s (Fed) monetary policy today.
Graphic: Retrieved from Danny Kirsch of Piper Sandler Companies (NYSE: PIPR).
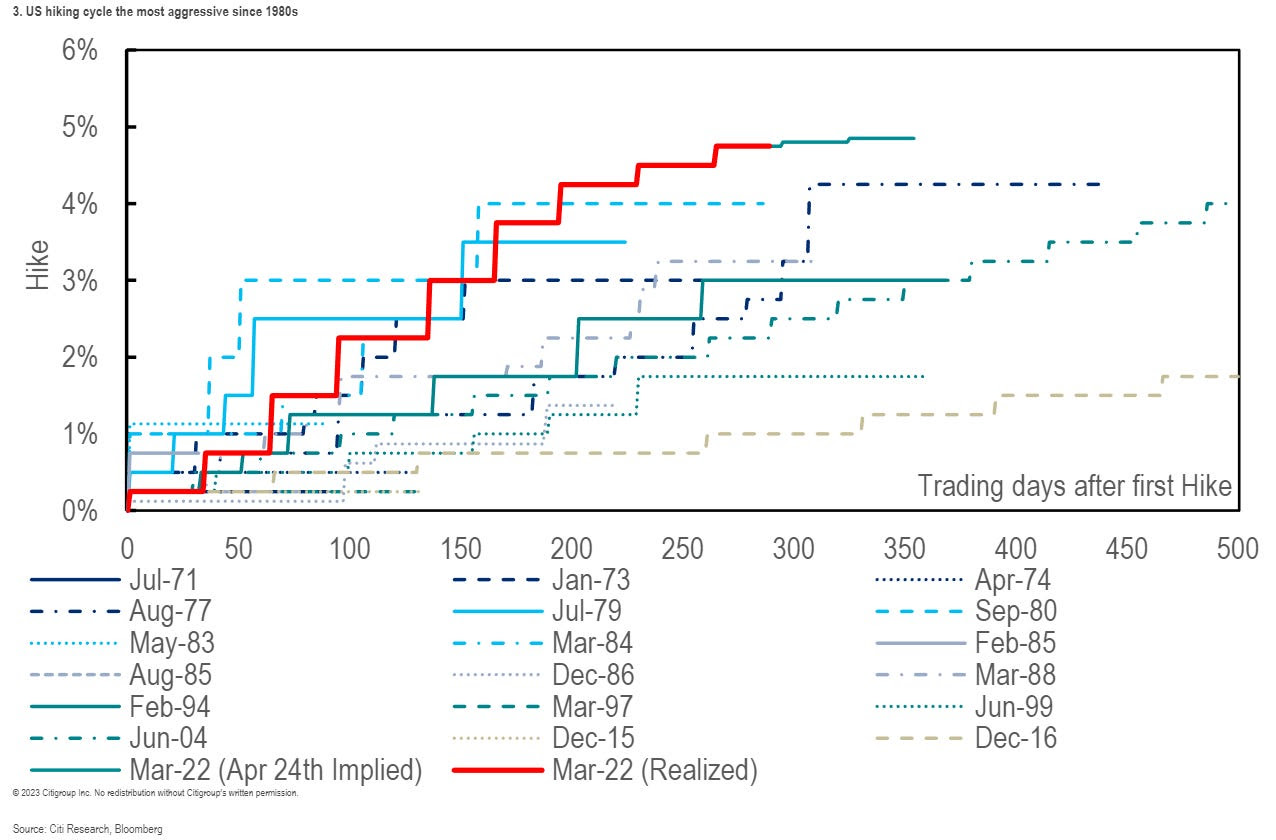
The consensus is the Fed ratchets up the target rate to 5.00-5.25%. Following this, it is likely to keep rates at this higher level for longer than markets expect, letting the effects of the tightening work through the economy and tame the still-sticky inflation (e.g., lenders eating the cost of interest to sell more goods, job vacancies dropping, and payrolls surprising higher).
Graphic: Retrieved from Citigroup Inc (NYSE: C) via Bloomberg. “The Fed’s own projections from March suggest rates will be only just above 5% by year’s end — implying a protracted pause with no cuts, after the most aggressive hiking campaign in decades. It’s marked in red in the chart [above].”
Strategists at JPMorgan Chase & Co (NYSE: JPM) think a “hike and pause” scenario prompts a push higher in stocks.
“Here, the Fed would be relying on a tightening of lending standards stemming from the banking crisis to act as de facto rate hikes. Any language that the market interprets as the Fed being on pause should benefit stocks,” JPM wrote. “This outcome is not fully priced into equities.”
This idea was alluded to in yesterday’s letter; stocks likely do “ok” in a higher rates for longer environment. Beyond economic surprises and the debt ceiling issue, the Fed’s balance sheet (not likely to be addressed in this next announcement) strategists like Andy Constan of Damped Spring Advisors are most concerned about, since the size of quantitative easing or QE made stocks less sensitive to interest rates. Ratcheting quantitative tightening or QT, the flow of capital out of markets, would prompt some increased bearishness among those strategists.
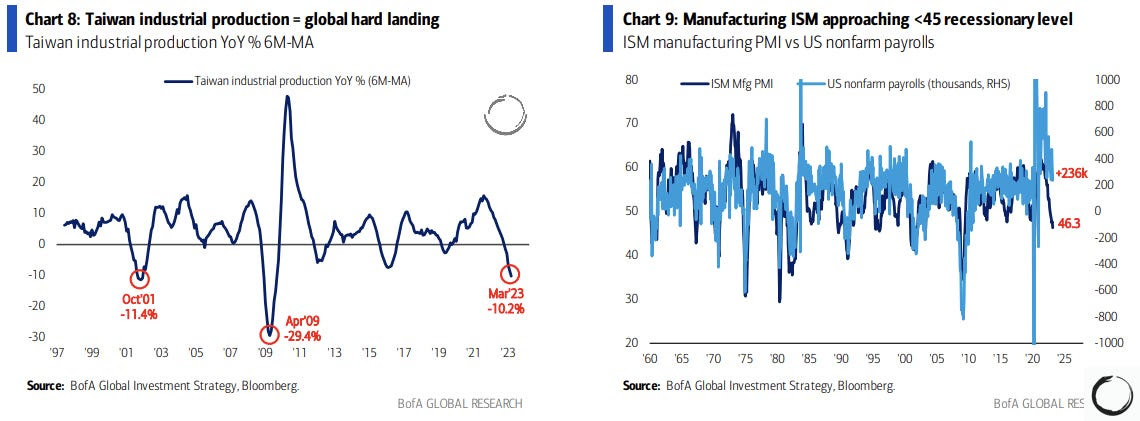
Graphic: Retrieved from Bank of America Corporation (NYSE: BAC) via Macro Ops.
JPM strategists add the market may continue “artificially suppress[ing] perceptions of fundamental macro risks,” prompting upside momentum.
“We expect these inflows to persist over the next two weeks, with several more large returns expected to drop from the trailing sample window,” Tier1Alpha explains. “Even if market volatility increases during this time, it would take exceptionally significant moves to trigger substantial selling. While these inflows are advantageous during market upswings, it’s essential to remember that they can be particularly brutal on the way back down once volatility inevitably returns.”
Eventually, “as recessionary conditions proliferate,” EPB’s Eric Basmajian says, asset prices will turn. Downside accelerants include the debt limit breach, which Nasdaq Inc (NASDAQ: NDAQ) and Moody’s Corporation (NYCE: MCO) think portends recession and volatility spike.
Trade ideas and more in our recently published report.
Welcome to the Daily Brief by Physik Invest, a soon-to-launch research, consulting, trading, and asset management solutions provider. Learn about our origin story here, and consider subscribing for daily updates on the critical contexts that could lend to future market movement.
Separately, please don’t use this free letter as advice; all content is for informational purposes, and derivatives carry a substantial risk of loss. At this time, Capelj and Physik Invest, non-professional advisors, will never solicit others for capital or collect fees and disbursements. Separately, you may view this letter’s content calendar at this link.
Although banks’ earnings were better than anticipated, sone figures indicate that the broader economy is declining, as retail sales and manufacturing output fell more than projected. Despite the challenges, most believe the Federal Reserve will raise interest rates next month.
Loretta Mester of the Federal Reserve, explained there should be another rate hike as the monetary policy will need to be more restrictive this year, with the fed funds rate rising above 5% and the real fed funds rate remaining positive for an extended period.
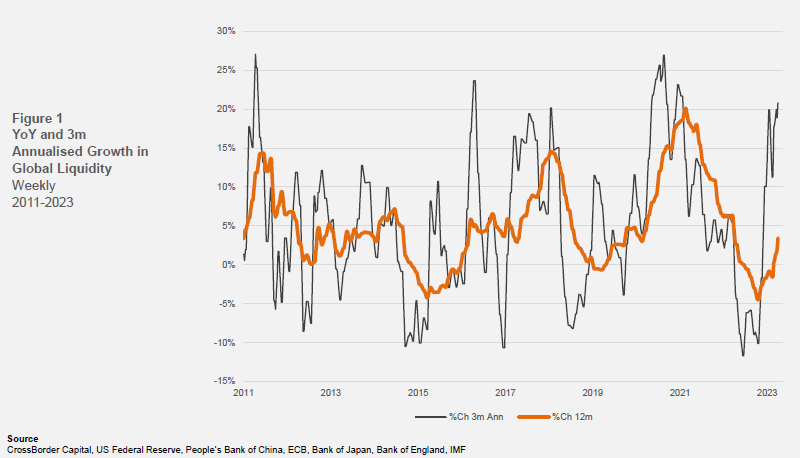
Thus far, monetary policymakers’ efforts to work liquidity out of the system have been complicated, particularly with rates at the back end falling, said Kai Volatility’s Cem Karsan in a conversation with TD Ameritrade Network. CrossBorder Capital confirms. Liquidity has been on an upward trend since October, partly due to China’s efforts to recover from Covid-19 restrictions and the collapse of the UK gilts markets.
Graphic: Retrieved from CrossBorder Capital via Bloomberg.
“Our original conjecture that Central Banks have effectively split their policy tools to use quantitative or balance sheet policies (QE) to ensure financial stability, whilst targeting inflation with interest rate policy is becoming more widely discussed in the media,” CrossBorder Capital’s Mike Howell said. “This splitting of roles can explain why interest rates have risen at the same time that Global Liquidity is turning higher.”
Accordingly, with the recent response to the bank issues cutting down tail risks for the S&P 500 (INDEX: SPX), markets are positioned to stay contained with falling implied volatility (IVOL) and correlations, as well as the passage of time, positioning-wise, key market boosters, Karsan added.
It’s appears the SPX may strengthen before it weakens with risk indicators, including IVOL measures, rising with the SPX. Physik Invest agrees: buy call structures on any weakness and monetize them into strength to finance long dated put structures.
It is better for traders to limit their expectations and stay the course, despite the big gap between IVOL measures like the Cboe Volatility Index and Merrill Lynch Option Volatility Estimate or MOVE, and big bets on market movement in the VIX complex, potentially to hedge against the breach of the US debt limit as soon as June.
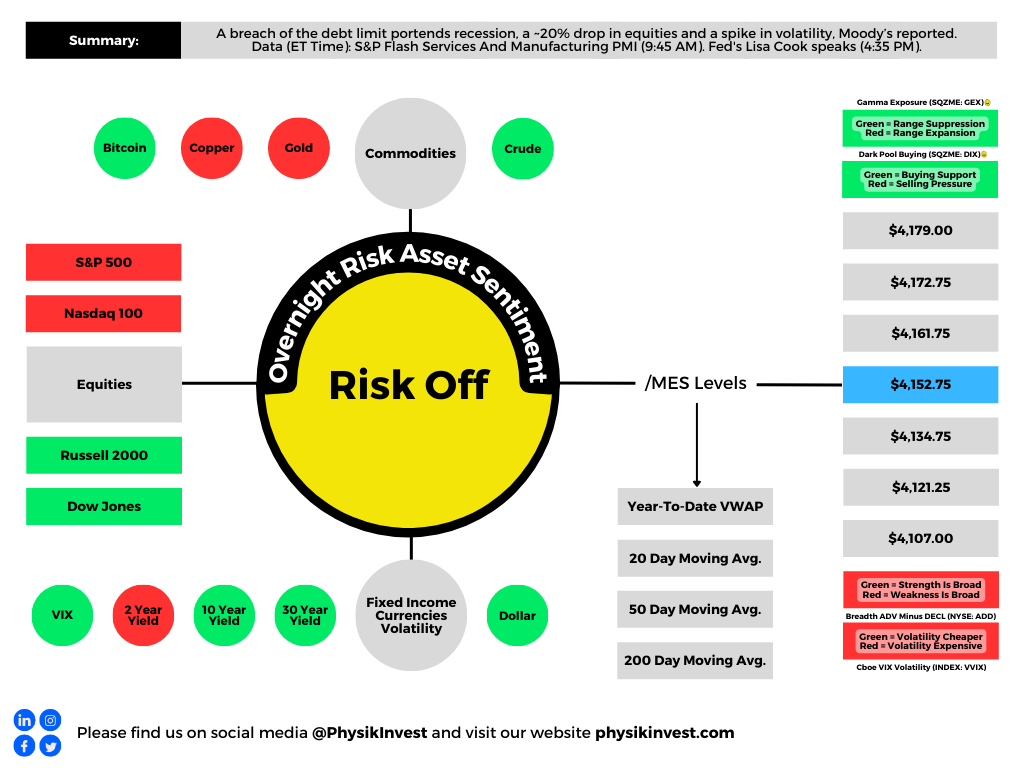
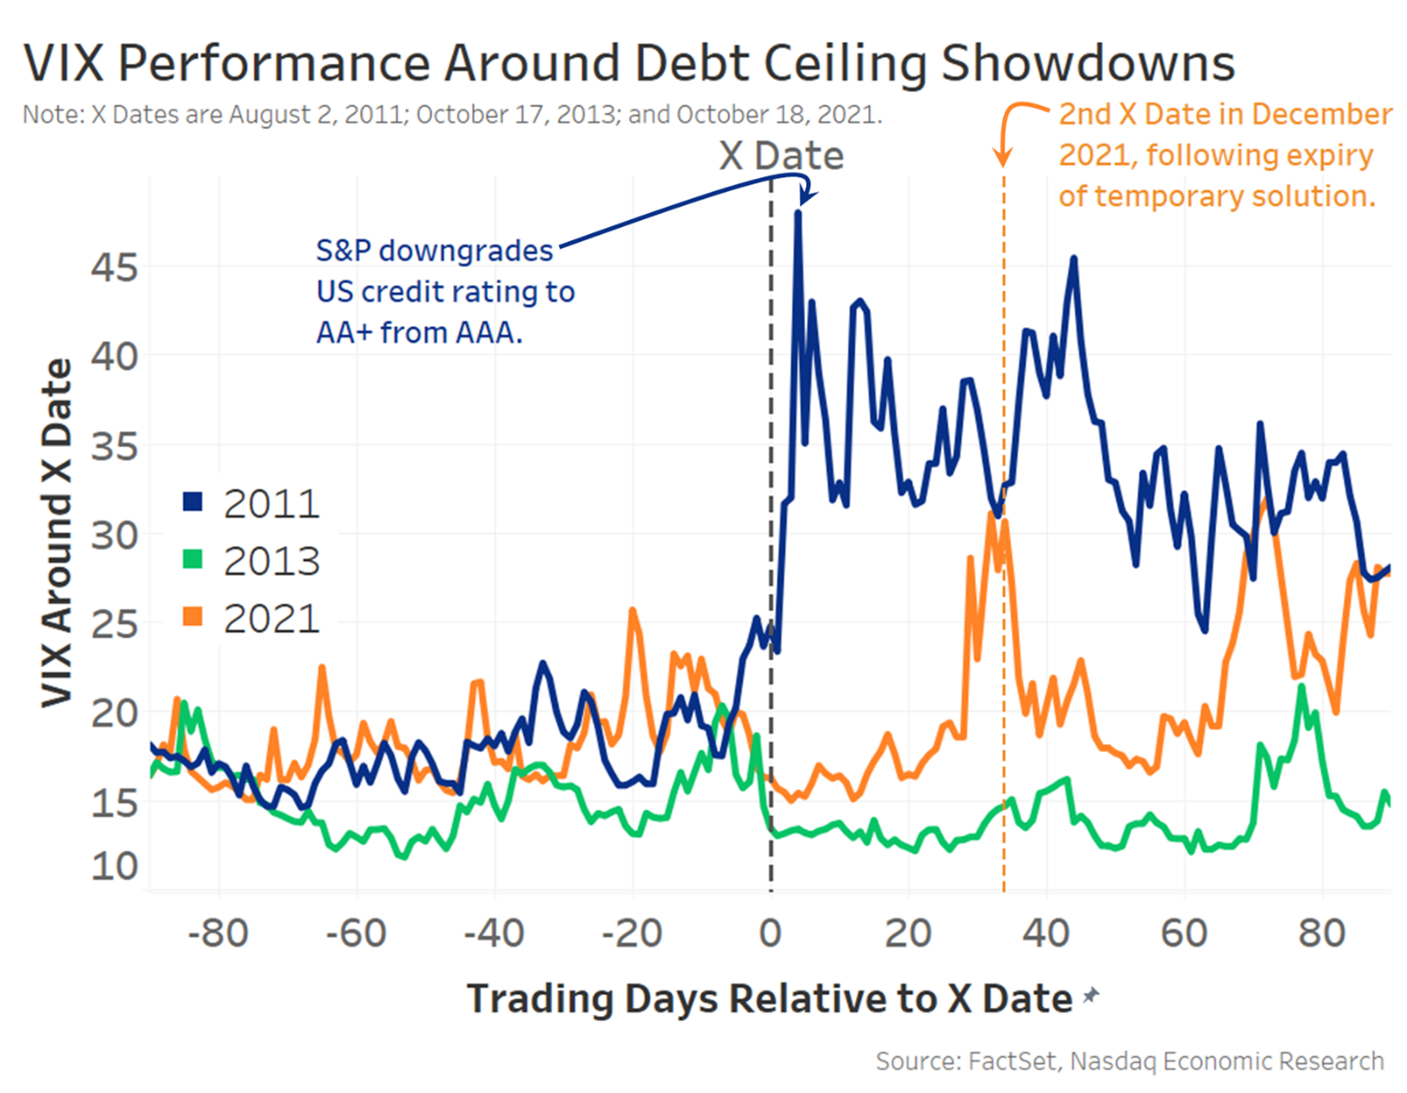
As an aside, recent VIX hedging makes sense given that a breach of the debt limit likely results in recession, a ~20% drop in equities, and a volatility spike, Moody’s said.
Graphic: Retrieved from Nasdaq Inc (NASDAQ: NDAQ).
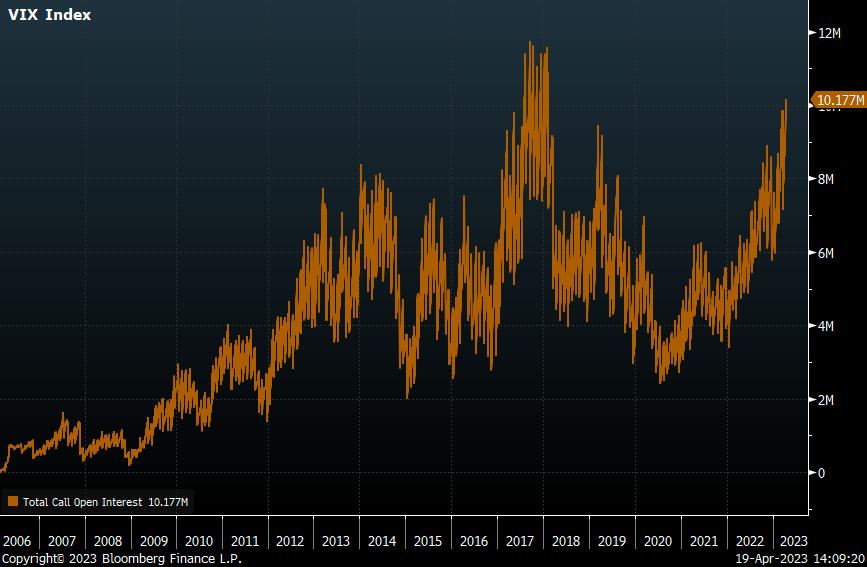
Quoting The Ambrus Group’s Kris Sidial, “When volatility starts to move, it moves at a higher rate than S&P volatility which is something that’s really important for the call option buyers,” which are stepping in aggressively as we’ve shown in the past letters.
Graphic: Retrieved from Piper Sandler Companies’ (NYSE: PIPR) Danny Kirsch. “With $VIX sitting at lowest level since early 2022, VIX call open interest approaching all-time highs reached in 2017/2018.”
About
Welcome to the Daily Brief by Physik Invest, a soon-to-launch research, consulting, trading, and asset management solutions provider. Learn about our origin story here, and consider subscribing for daily updates on the critical contexts that could lend to future market movement.
Separately, please don’t use this free letter as advice; all content is for informational purposes, and derivatives carry a substantial risk of loss. At this time, Capelj and Physik Invest, non-professional advisors, will never solicit others for capital or collect fees and disbursements. Separately, you may view this letter’s content calendar at this link.
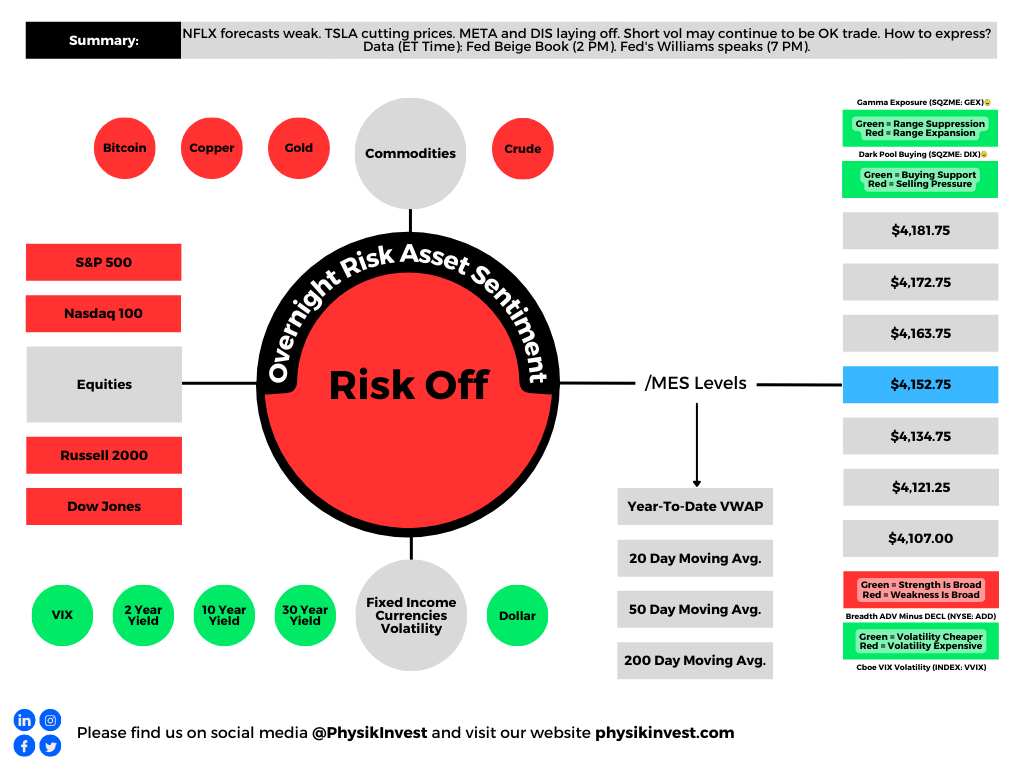
Big news includes Netflix Inc (NASDAQ: NFLX) beating earnings estimates but having a weaker-than-expected forecast, Tesla Inc (NASDAQ: TSLA) cutting prices the sixth time this year, Meta Platforms Inc (NASDAQ: META) and Walt Disney Co (NYSE: DIS) commencing layoffs, and mortgage rates edging higher to ~6.4%.
Graphic: Retrieved from Bloomberg. “US mortgage rates increased last week by the most in two months to 6.43%, denting already sluggish demand.”
Equity markets are down, and equity implied volatility (IVOL) measures, including the Cboe Volatility Index or VIX, are climbing. Notwithstanding, the trend lower in IVOL is intact, and that’s good for traders biased short volatility.
Graphic: Retrieved from Bloomberg via Danny Kirsch of Piper Sandler Companies (NYSE: PIPR). Call option volatility for the $4,150.00 strike. May monthly expiration.
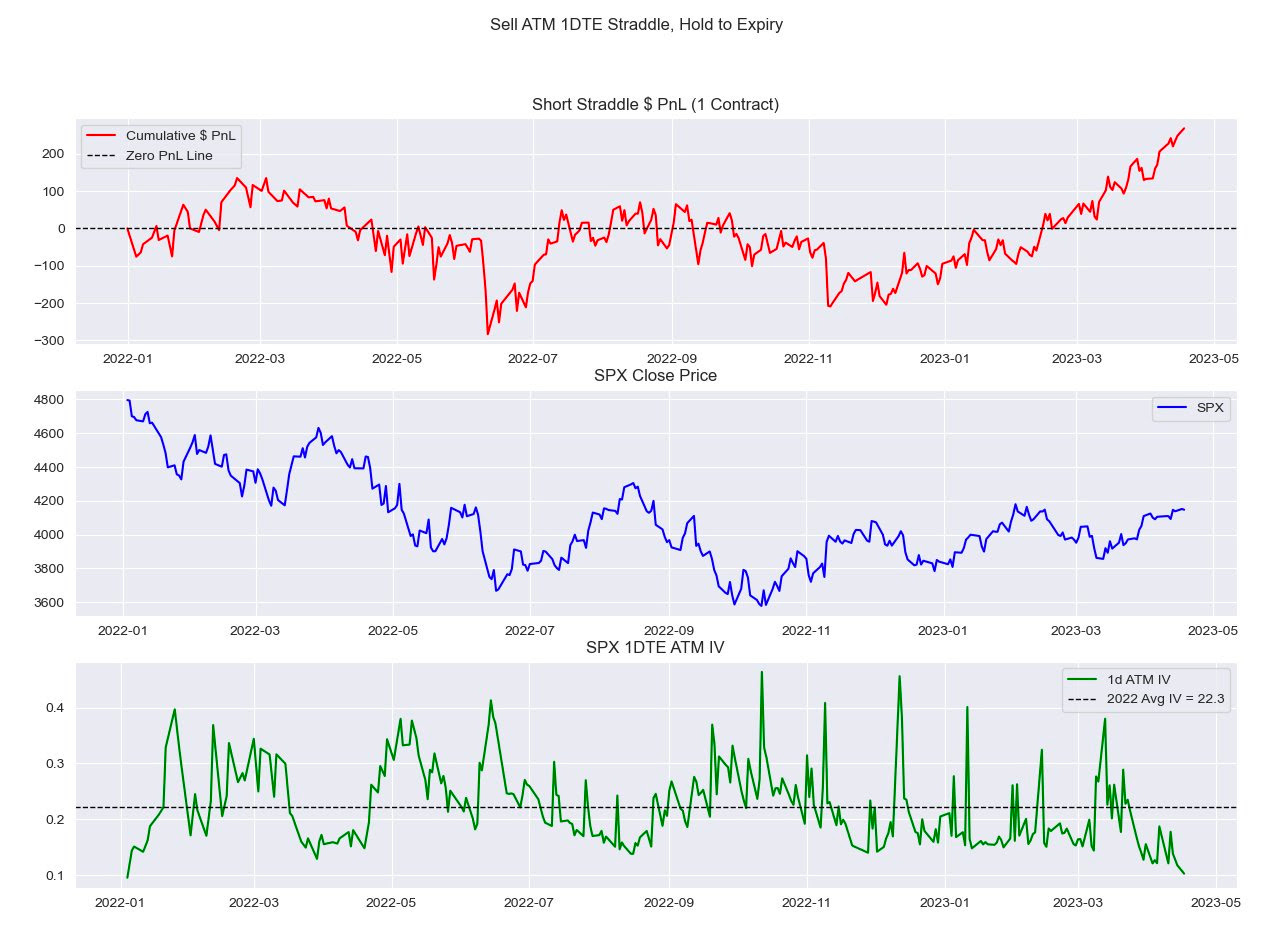
“With all the focus [on S&P 500 (INDEX: SPX)] 0 DTE lately, I look at how expensive these have been since 2022,” IPS Strategic Capital’s Pat Hennessy says, referencing a backtest he conducted selling a 1 DTE straddle and holding till maturity.
“Performance since the November CPI has been stellar, with a 63% win rate and an average gain of $20.00.”
Graphic: Retrieved from IPS Strategic Capital’s Pat Hennessy.
Volatility trader Darrin John agrees, noting volatility remains expensive, a detriment to those who may be biased long volatility.
“The VRP is so wide across all of the tenors I track,” John elaborates. “It’s going to be hard for gamma buyers to cover daily theta bills.”
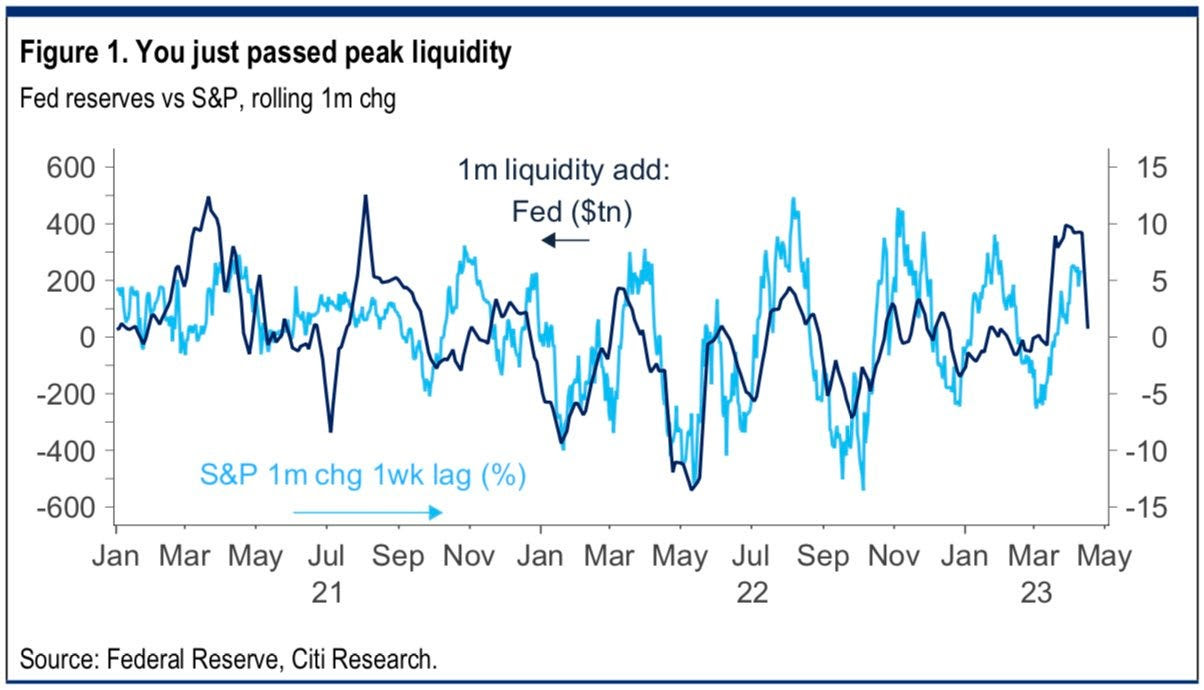
Clouds are appearing on the horizon, however, and the trend higher (lower) in stocks (volatility) may not last. Bloomberg forecasts the largest fall in SPX earnings since the start of 2020. Notwithstanding, strength can continue for longer …
Graphic: Retrieved from Citigroup Inc Research (NYSE: C) via @tr8derz. “YTD rally stems from $1tn in CB liquidity. High-frequency indicators suggest this is already stalling, and coming weeks seem increasingly likely to bring a sharp reversal. Higher TGA and RRP, ECB QT and reduced China easing could easily see a net drain of some $6-800bn.”
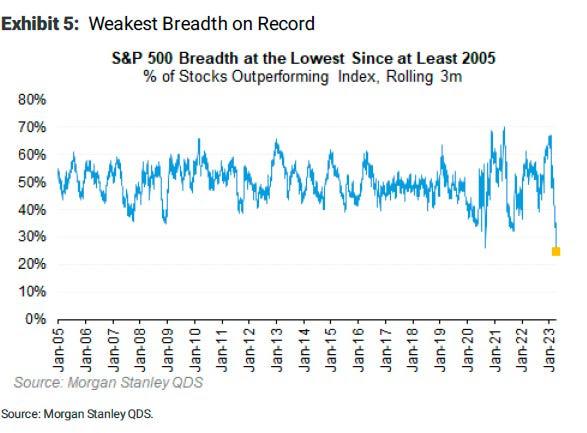
… even with the SPX breadth reading poor. The SPX has rallied with multiples rising; strength came with positive earnings surprises, bond demand, and other things.
Graphic: Retrieved from Morgan Stanley (NYSE: MS) via Bloomberg.
Hence, at the risk of sounding like a broken record, the low-cost call structures we’ve talked about in the past remain attractive.
If markets move higher, you can monetize and roll profits into put spreads (i.e., buy put and sell another at a lower strike). This may work well if JPMorgan Chase & Co’s (NYSE: JPM) call that “even a mild recession would warrant retesting the previous lows” is realized.
Such structures work well as “a big pop in the market can result in a decent drop in the VIX…and vice versa, a market sell-off will result in a greater increase in the VIX now than it did in 2022,” says Alpha Exchange.
Alternatively, lean neutral and buy into cash or bonds yielding 4-5%. Some long box spreads yield 5.4% as of yesterday’s close.
In other news, Physik Invest’s first in-depth note is nearing completion and will be available for public viewing in short order. Take care and watch your risk!
About
Welcome to the Daily Brief by Physik Invest, a soon-to-launch research, consulting, trading, and asset management solutions provider. Learn about our origin story here, and consider subscribing for daily updates on the critical contexts that could lend to future market movement.
Separately, please don’t use this free letter as advice; all content is for informational purposes, and derivatives carry a substantial risk of loss. At this time, Capelj and Physik Invest, non-professional advisors, will never solicit others for capital or collect fees and disbursements. Separately, you may view this letter’s content calendar at this link.
Bank of America Corporation (NYSE: BAC) sees allocations to equities versus bonds falling. That’s amid recession fears. Per EPB, “the cyclical economy has just started to shed jobs today, and leading indicators signal the recession is likely underway.”
“To get advanced warning of recessions, you must look at the construction and manufacturing sectors, even though these two sectors are only 13% of the labor market,” EPB adds, noting traditional indicators’ weakening predictability is not so great to ignore the insight. “It’s clear that the composition of traditional leading indicators remains appropriate, and thus, the current resounding recessionary signal should not be ignored.”
BAC strategist Michael Hartnett said, though, that this “consensus lust for recession” must soon be satisfied. Otherwise, the “pain trade” would be even higher yields and stocks; the S&P 500 (INDEX: SPX) is enjoying an accelerated rally which Jefferies Financial Group (NYSE: JEF) strategists think portends a period of flatness, now, over the coming weeks …
Graphic: Retrieved from Jefferies Financial Group (NYSE: JEF) via The Market Ear.
… and through options expiration (OpEx), typically a poor performance period for the SPX.
Beyond the uninspiring fundamentals, the positioning contexts are supportive. Recall our letters published earlier this year. If the market consolidated and failed to break substantially, then falling implied volatility (IVOL) and time passing would bolster markets and, potentially, help build a platform for a rally into mid-year. A check of fixed-strike and top-line measures of IVOL like the Cboe Volatility Index or VIX confirms options activities are keeping markets intact.
Graphic: Retrieved from Danny Kirsch of Piper Sandler (NYSE: PIPR). “SPX May $4,150.00 call volatility, the lack of realized volatility weighing on the market. Volatility low, not cheap.”
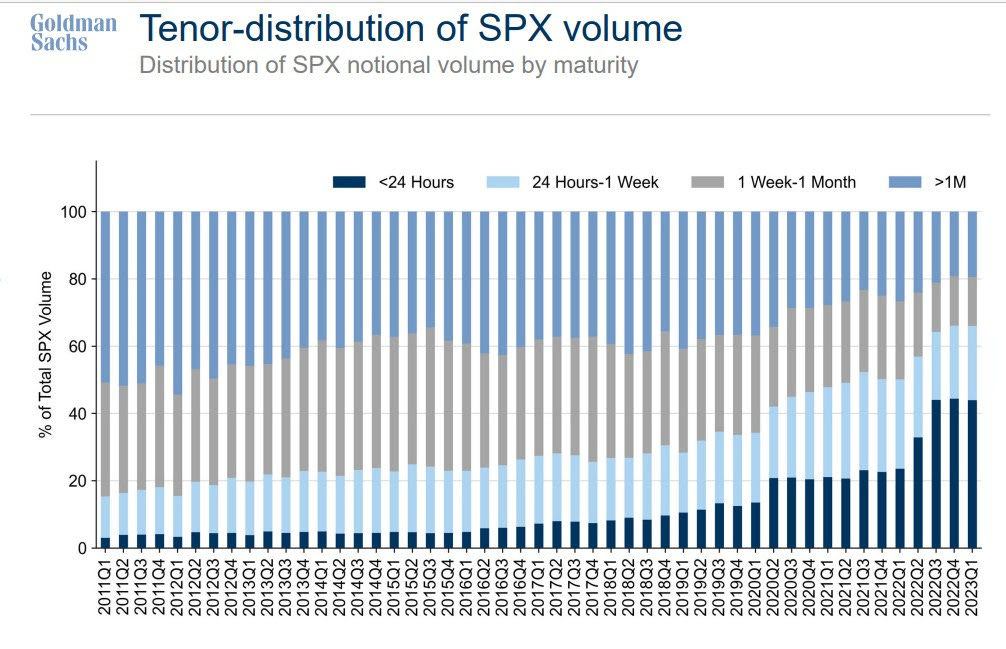
Beyond the rotation into shorter-dated options, just one of the factors exacerbating the decimation of longer-dated volatility, traders’ consensus is that markets won’t move a lot and/or they don’t need to hedge over longer time horizons; traders want punchier exposure to realized volatility (RVOL), and that they can get through shorter-dated options that have more gamma (i.e., exposure to changes in movement), not vega (i.e., exposure to changes in implied volatility).
Graphic: Retrieved from Goldman Sachs Group Inc (NYSE: GS) via Bloomberg.
Consequently, counterparties may be less dangerous to accelerating movement in either direction; hence, the growing likelihood of a period of flatness.
“Despite the collapse in the 1-month realized volatility, we suspect most vol control funds have scaled into using their longer-term realized vols, which by design, lead to less aggressive rebalancing flows,” Tier1Alpha says. “For example, the 3-month rVol, which is currently driving our model, was essentially unchanged yesterday, which means volatility targets were maintained, and very little additional rebalancing had to occur. So even with the decline in the 1-month vol, overall risk exposure remained the same.”
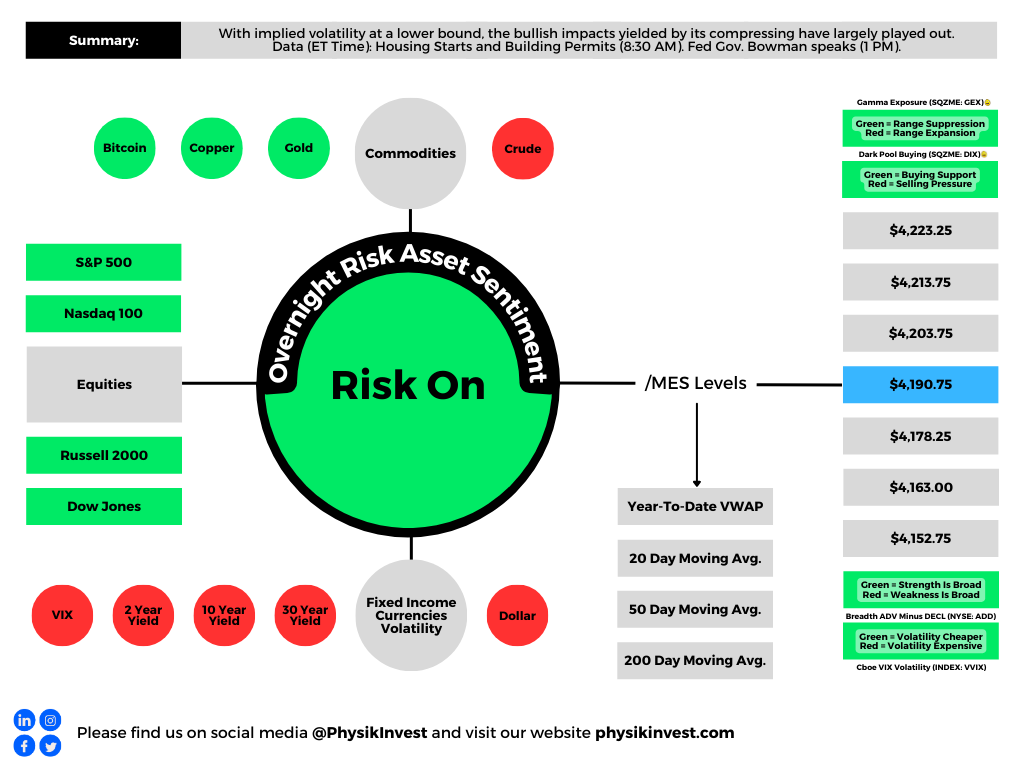
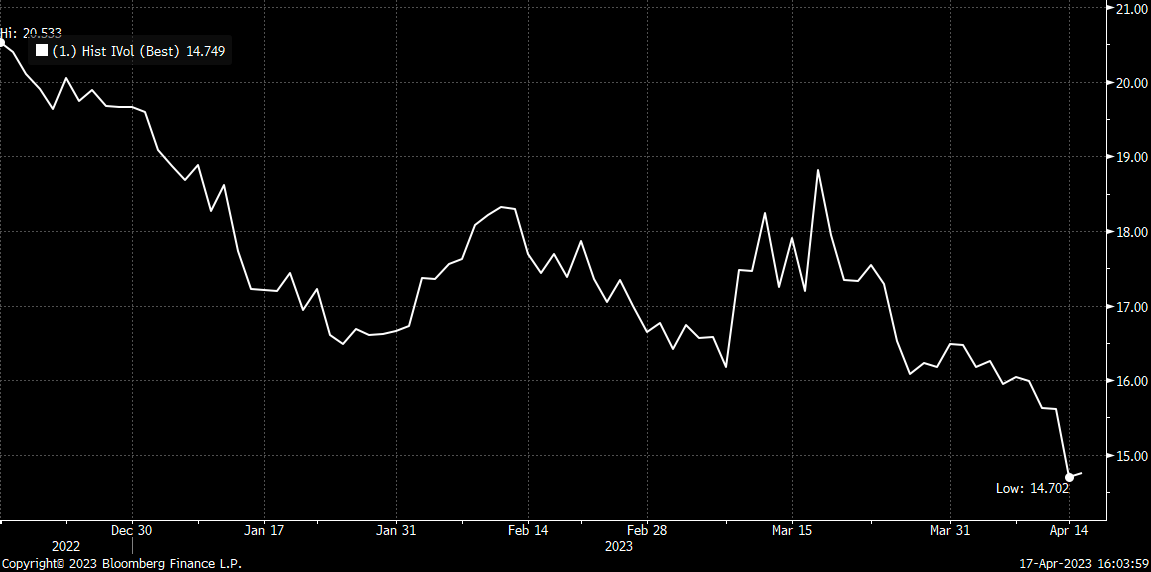
With IVOL at a lower bound, the bullish impacts yielded by its compressing have largely played out. There may be more to be gained by movements higher in IVOL, in addition to the expiry of many call options this OpEx. By owning protection, particularly far from current prices, you are positioned to monetize on the market downside and non-linear repricings of volatility, as this letter has discussed in recent history. The caveat is that volatility can cluster and revert for longer; hence, your structure matters.
“I am concerned that VIX is underpricing the series of events that we know to expect over the coming weeks,” says Interactive Brokers Group Inc’s (NASDAQ: IBKR) Steve Sosnick. “While there is now an 88% implied likelihood of a 25 basis point hike, the likely path of any potential future hikes and assumed cuts should be more clarified at the meeting and in its aftermath. And oh, has anyone ever heard the expression “sell in May and go away?”
Graphic: Retrieved from Interactive Brokers Group Inc (NASDAQ: IBKR).
With call skews far up meaningfully steep in some products, still-present low- and zero-cost call structures this letter has talked about in the past remain attractive. If the market falls apart, your costs are low, and losses are minimal. If markets move higher into a “more combustible” position, wherein “volatility is sticky into a rally,” you may monetize your call structures and roll some of those profits into bear put spreads (i.e., buy put and sell another at a lower strike). An alternative option is neutral. Own something such as a T-bill or box spread (i.e., buy call and sell put at one strike and sell call and buy put at another higher strike). Some boxes are yielding upwards of 5.4% as of yesterday’s close.
To end, though the short-dated options activity may prompt cascading events in market downturns, the main issue is the reduced use of longer-dated options; a supply and demand imbalance likely resolves itself with an implied volatility repricing of a great size where longer-dated options outperform those that are shorter-dated.
Our locking in of rates or using the profits of call structures to position for a potential IVOL repricing, particularly in the back half of the year when dealer positioning is less clear, buybacks are to fall off of a cliff, rates may fall, and the boost from short-covering has played its course, is an attractive proposition given the context.
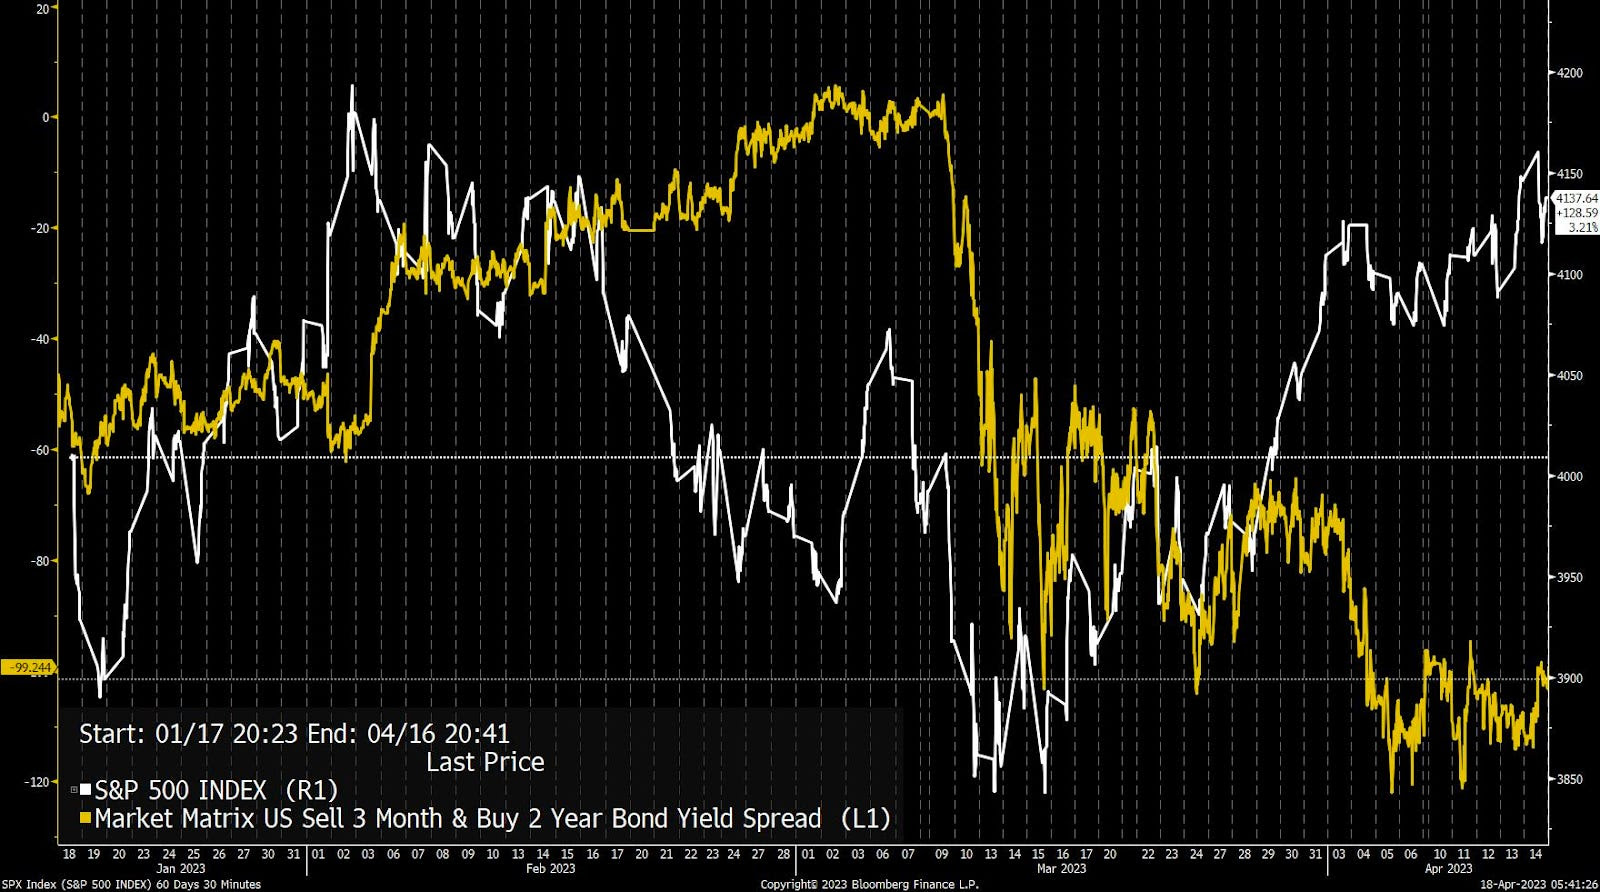
Graphic: Retrieved from Bloomberg. “The S&P 500 (white line) is well above its levels from early March, while the yield on the 3m-2y spread remains in a deep inversion, signifying meaningful expectations of cuts in the months ahead.”
About
Welcome to the Daily Brief by Physik Invest, a soon-to-launch research, consulting, trading, and asset management solutions provider. Learn about our origin story here, and consider subscribing for daily updates on the critical contexts that could lend to future market movement.
Separately, please don’t use this free letter as advice; all content is for informational purposes, and derivatives carry a substantial risk of loss. At this time, Capelj and Physik Invest, non-professional advisors, will never solicit others for capital or collect fees and disbursements. Separately, you may view this letter’s content calendar at this link.
Physik Invest’s Daily Brief is read free by thousands of subscribers. Join this community to learn about the fundamental and technical drivers of markets.
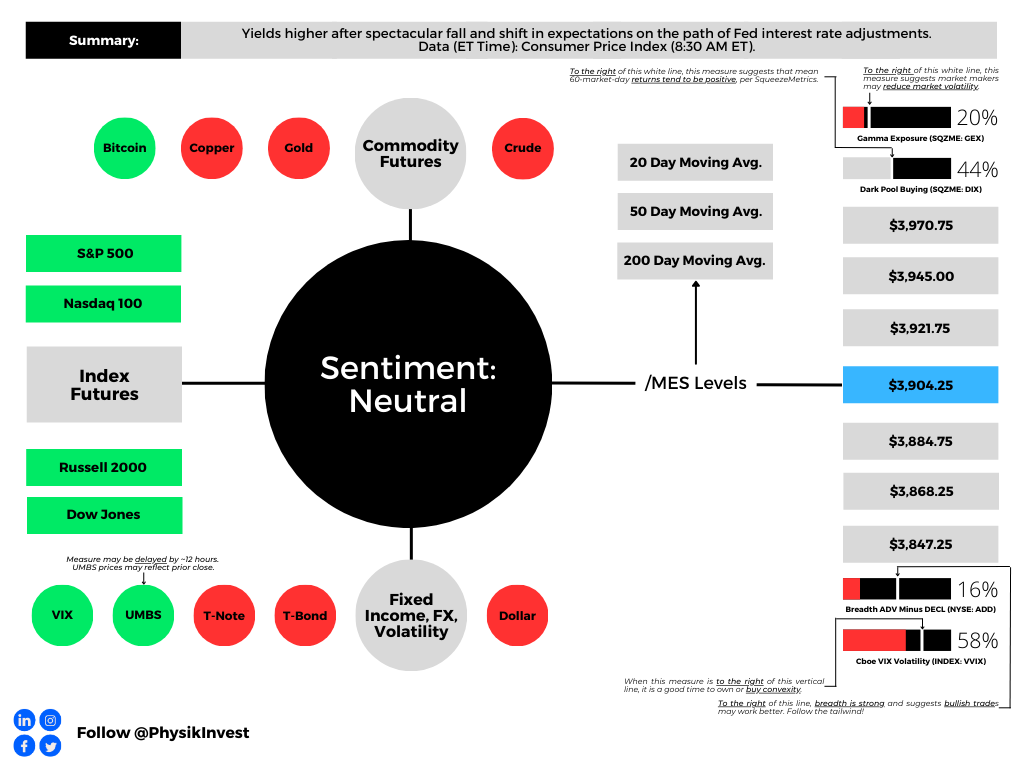
Graphic updated 6:30 AM ET. Sentiment Neutral if expected /MES open is inside of the prior day’s range. /MES levels are derived from the profile graphic at the bottom of this letter. Click here for the latest levels. SqueezeMetrics Dark Pool Index (DIX) and Gamma (GEX) with the latter calculated based on where the prior day’s reading falls with respect to the MAX and MIN of all occurrences available. A higher DIX is bullish. The lower the GEX, the more (expected) volatility. Click to learn the implications of volatility, direction, and moneyness. Breadth reflects a reading of the prior day’s NYSE Advance/Decline indicator. The CBOE VIX Volatility Index (INDEX: VVIX) reflects the attractiveness of owning volatility. UMBS prices via MND. Click here for the economic calendar.
Administrative
A long(er) letter, today. Through the end-of-this week, newsletters may be shorter due to the letter writer’s commitments. Take care!
Fundamental
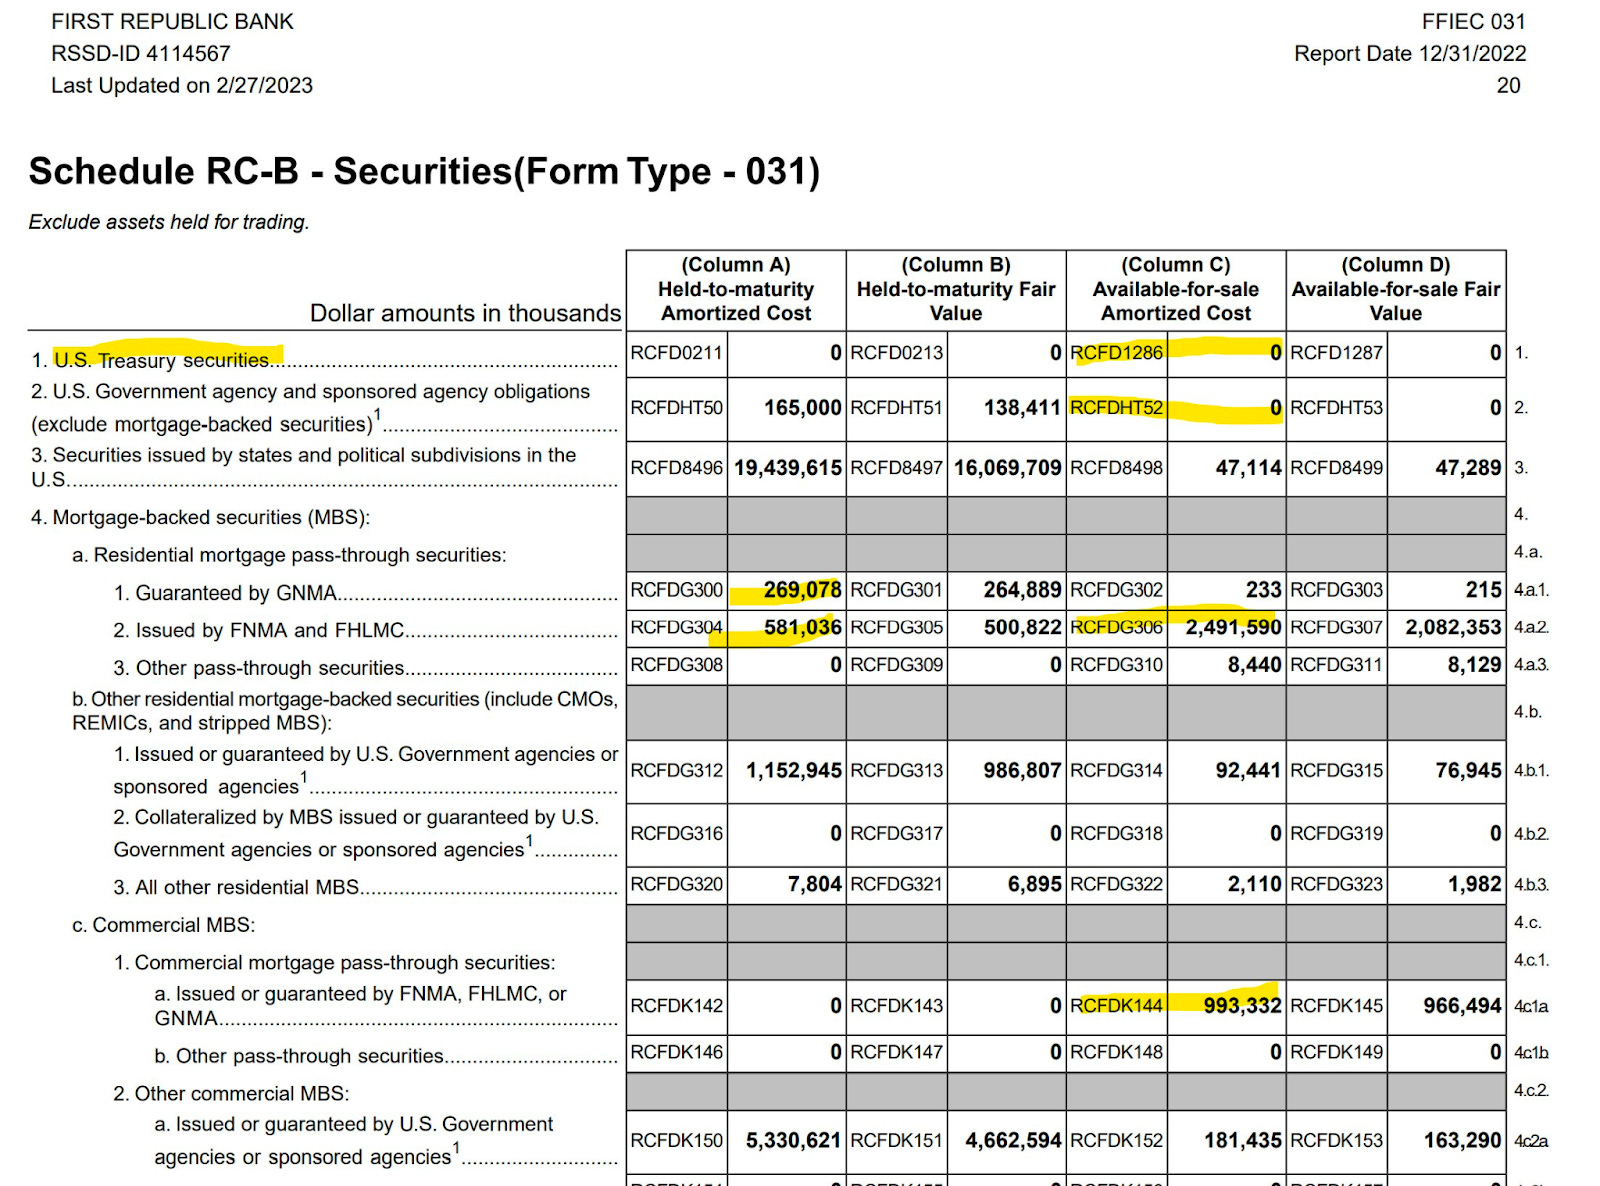
Yesterday’s letter focused on the SVB Financial Group (NASDAQ: SIVB) failure, albeit with an optimistic tone. In short, the bank could not make good on fast accelerating withdrawals. Read more here.
According to one TechCrunch article, the likes of Founders Fund “reportedly advised their portfolio companies … to withdraw their money, … [and], if everybody is telling each other that SVB is in trouble, that will be a challenge,” as it was.
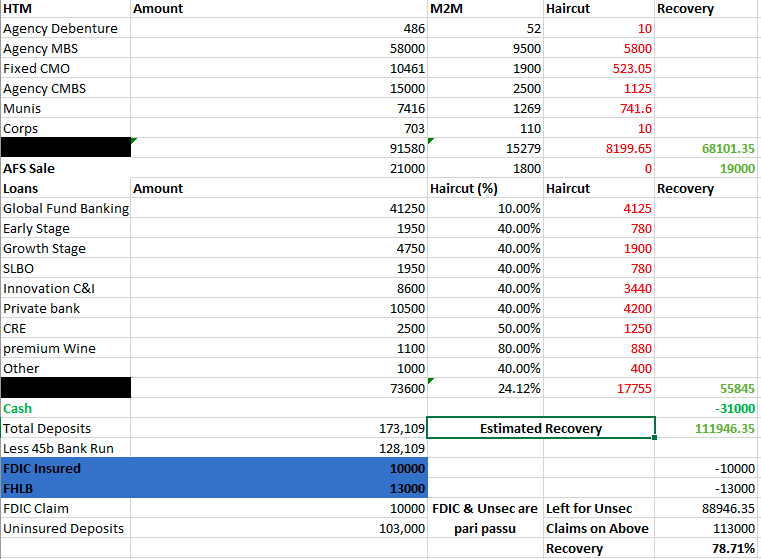
Graphic: Retrieved from @Citrini7. In the worst-case scenario, it was likely that uninsured depositors at SIVB would have received $0.80 on each dollar barring a bailout.
Authorities later put forth emergency measures guaranteeing all deposits. The effort shored up confidence in the banking system and markets strengthened, though some regional names such as First Republic Bank (NYSE: FRC) continued trading weak. In FRC’s case, the Federal Reserve’s (Fed) new bailout facility does not help. As former Fed trader Joseph Wang explains, “you need Treasuries and Agency MBS to tap the facility, and [FRC] barely owns any.”
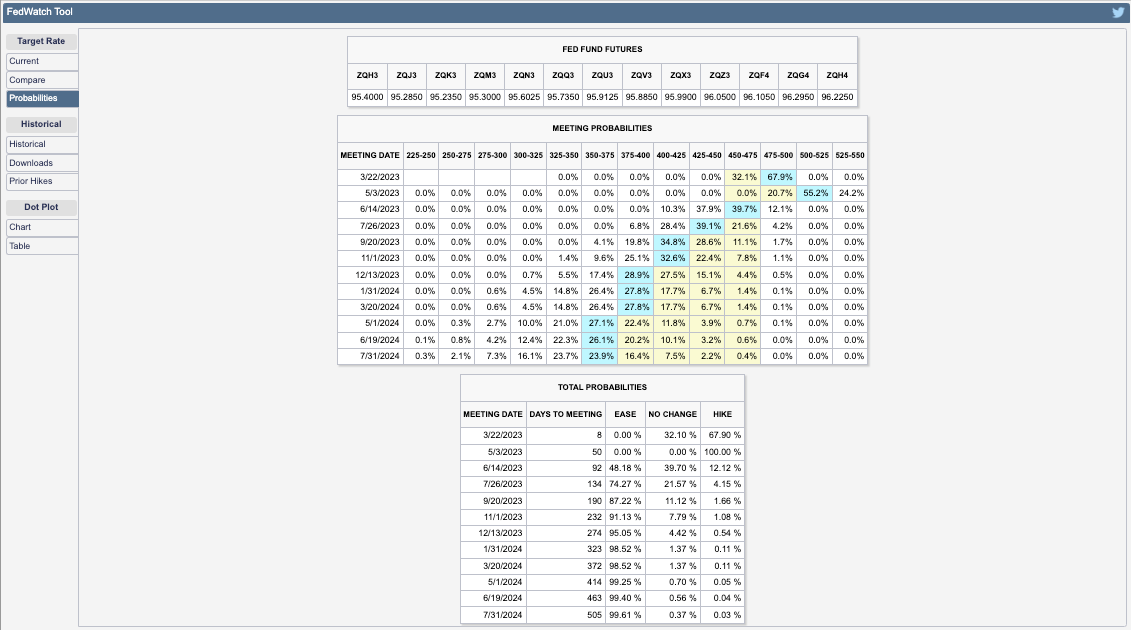
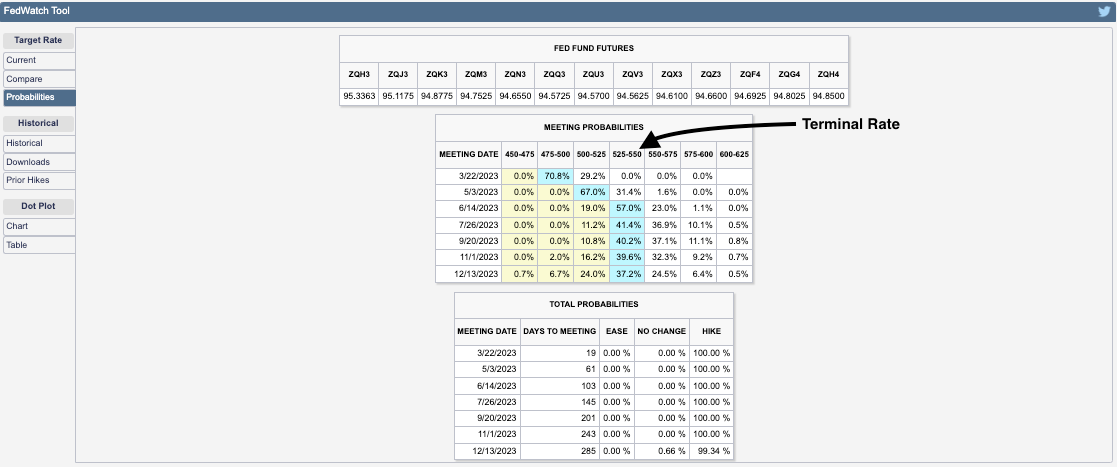
Anyways, as yesterday’s letter briefly mentioned, expectations on the path of Fed Funds shifted. Traders put the terminal/peak rate at 5.00-5.25%, down from 5.50-5.75%, while pricing cuts after spring. Previously, no cuts were expected in 2023.
Graphic: Retrieved from CME Group Inc’s (NASDAQ: CME) FedWatch Tool.
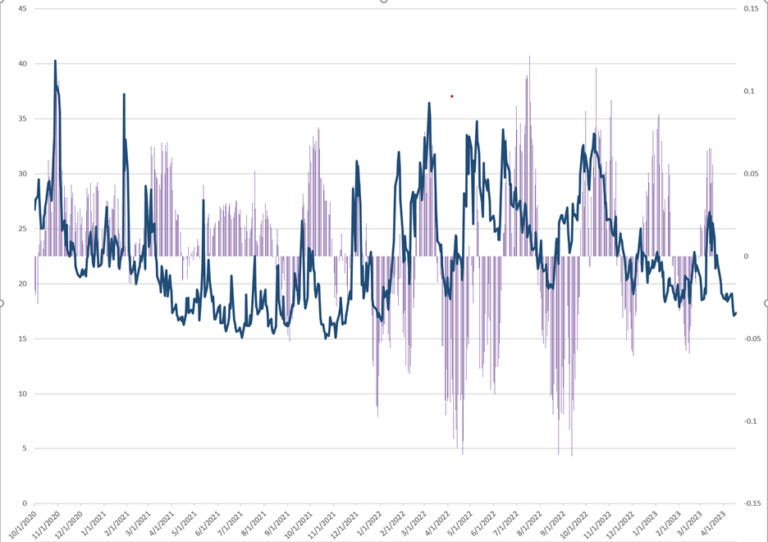
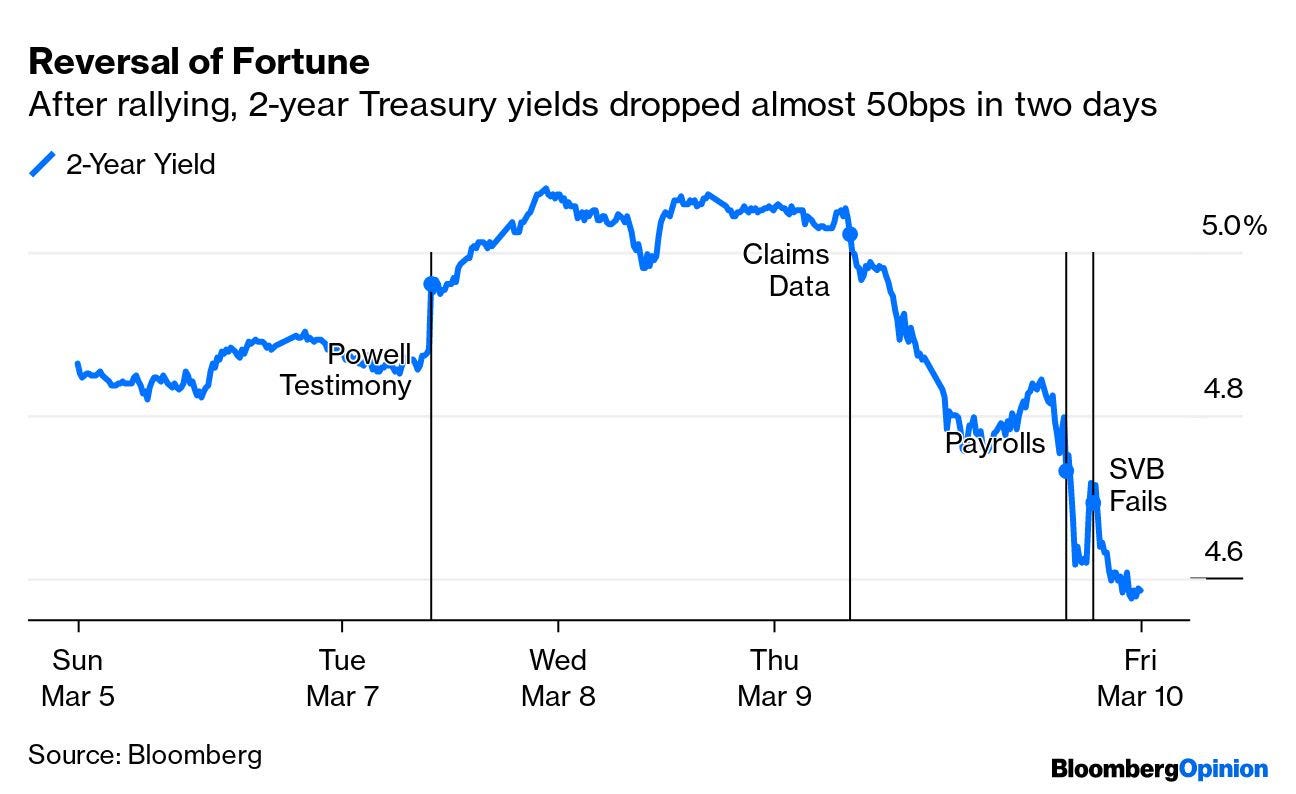
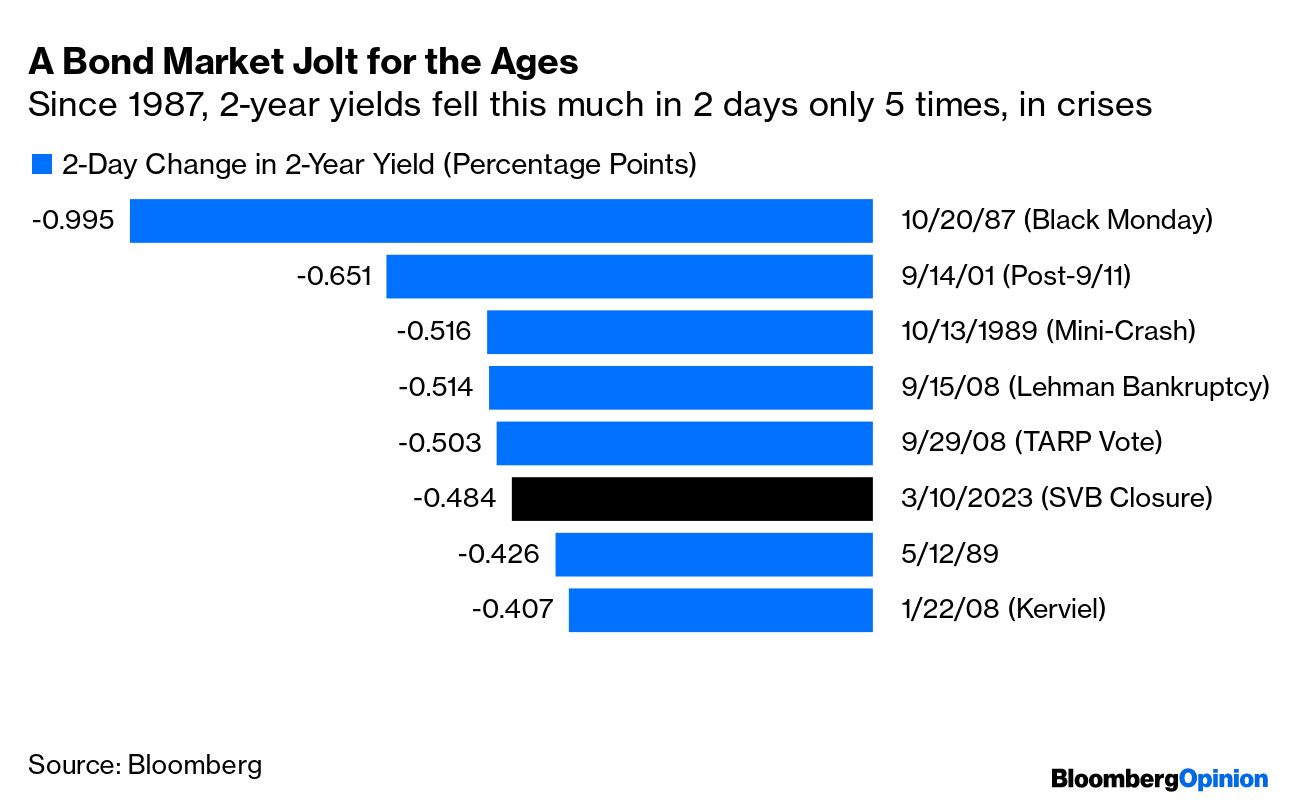
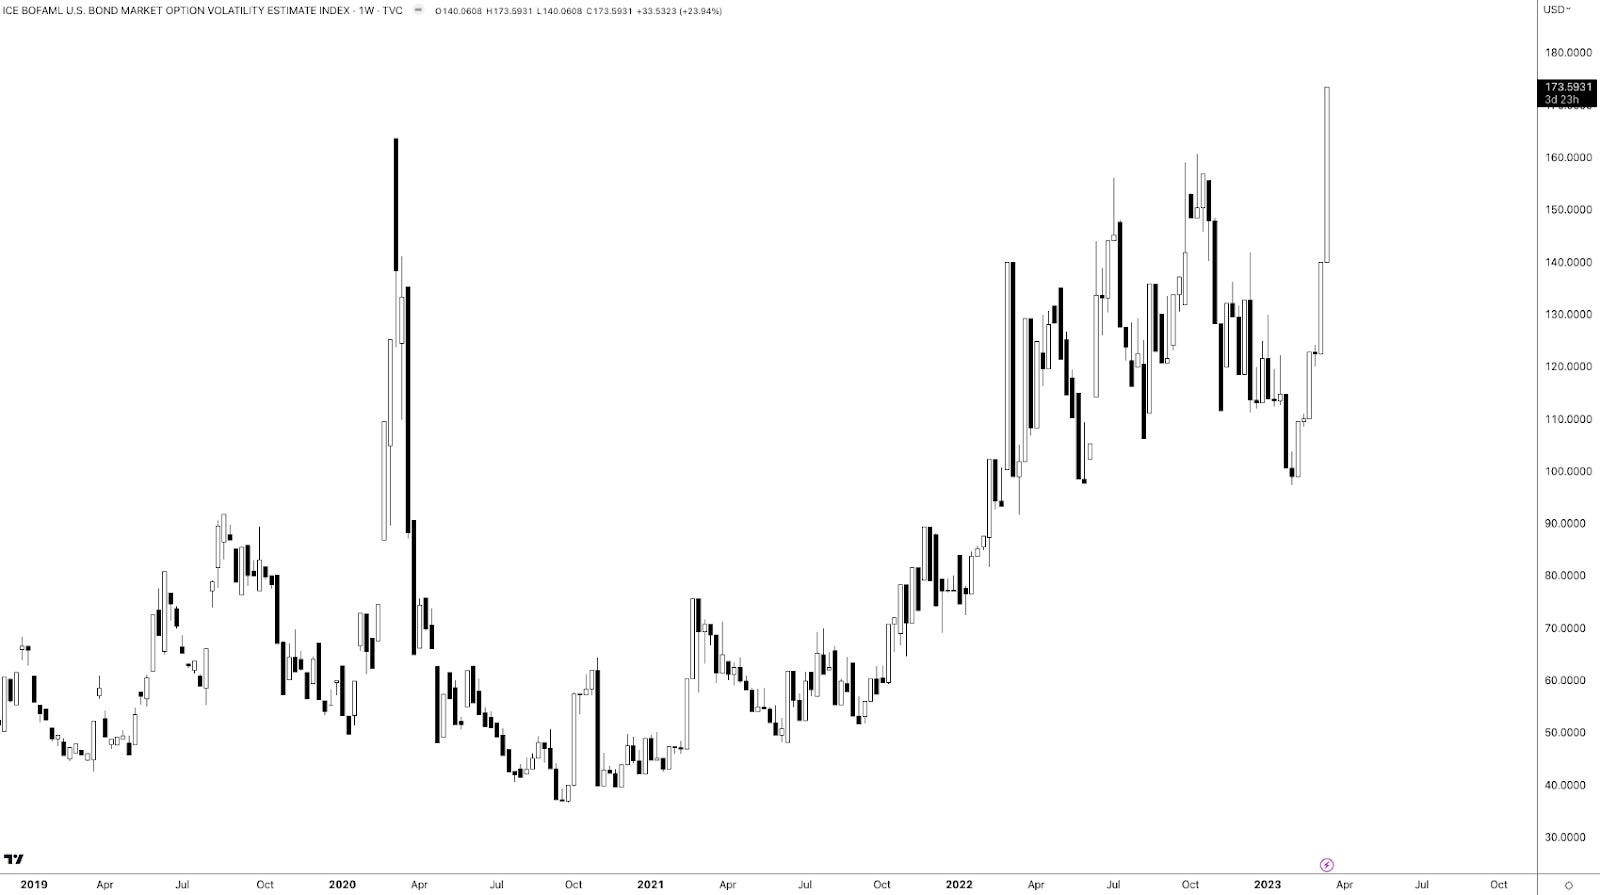
Measures of US Treasury yield volatility implied by options (i.e., bets or hedges on or against market movement) adjusted higher, accordingly. This is often a harbinger of equity market volatility.
Graphic: Merrill Lynch Option Volatility Estimate retrieved from TradingView
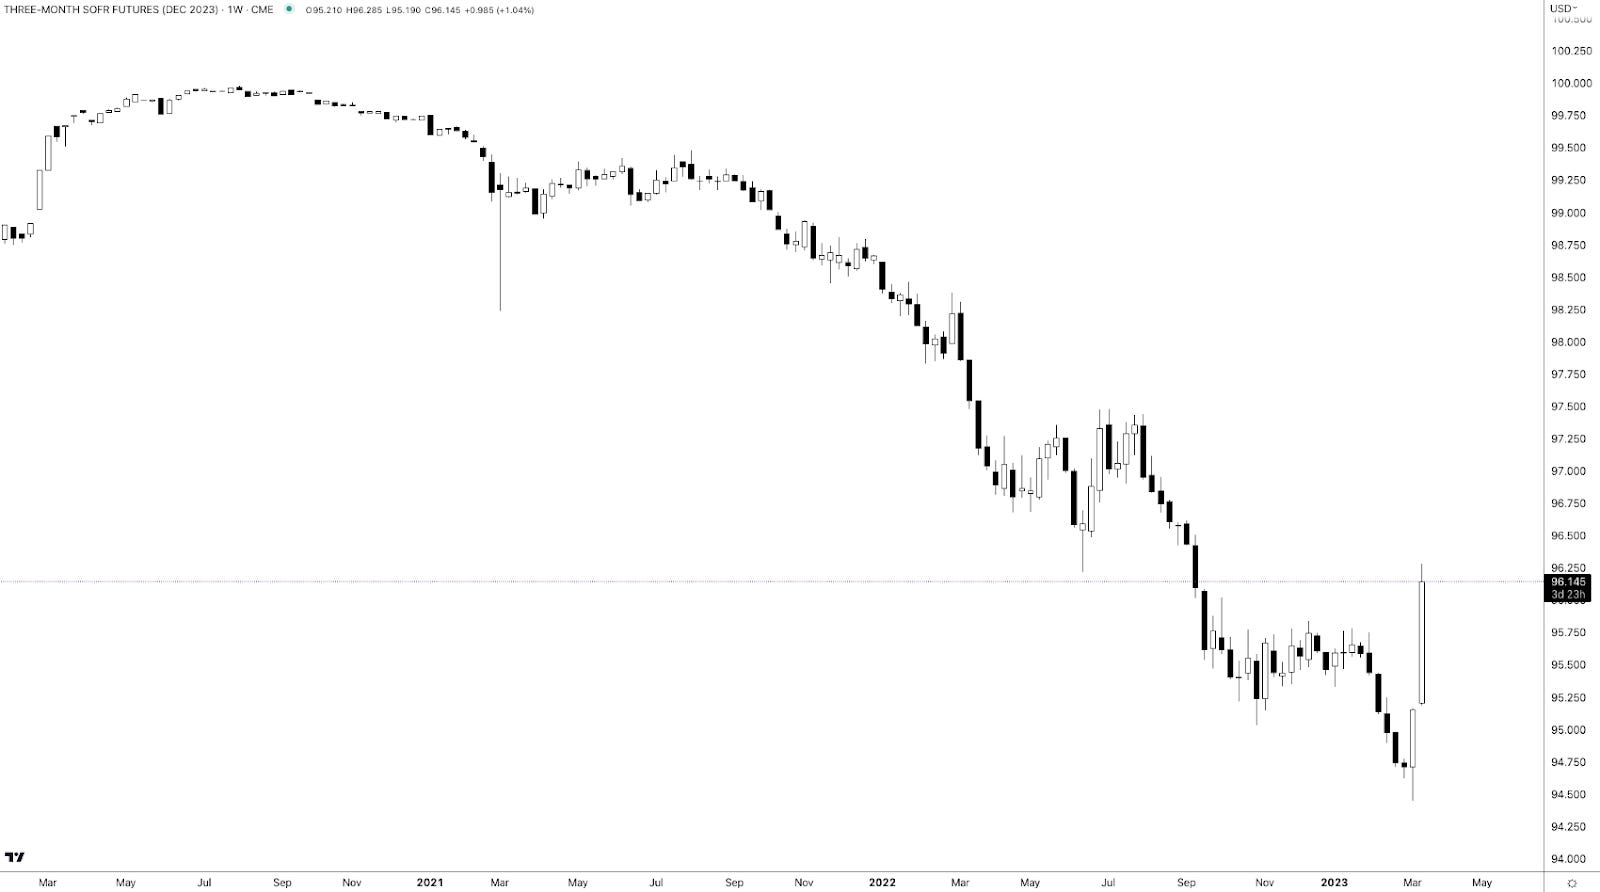
Call options on the three-month Secured Overnight Financing Rate (FUTURE: SOFR) future (i.e., bets on interest rates falling in the future) paid handsomely.
For instance, bull call spreads that expire in December 2023 (e.g., BUY +1 VERTICAL /SR3Z23:XCME 1/2500 DEC 23 /SR3Z23:XCME 96/97 CALL @.0375) increased in value by about 650.00% to $0.33 (i.e., $750.00 per contract).
Graphic: Retrieved via TradingView. Three-month SOFR Future (December 2023). When SOFR is at a lower (higher) number, the market is pricing an increase (decrease) in interest rates. Participants put the December 2023 SOFR rate at 100-96.145 = 3.855%.
In the equity space, some readers may have caught some commentary on spot-vol beta in the VIX complex strengthening like we have not seen in a while, a nod to the harbinger of equity market volatility remark a few paragraphs higher.
Recommended Readings:
Read: The Ambrus Group’s Kris Sidial on two major risks investors should watch out for in 2023. In short, volatility’s sensitivity to underlying prices (spot-vol beta) was low, and Sidial cast blame, in part, on commodity trading advisors and strong volatility supply.
Read: Simplify Asset Management’s Michael Green on using option and bond overlays to hedge big uncertainties facing markets. Following 2022, investors swapped poor-performing long-dated volatility exposures for ones with bounded risk and less time to expiry, hence the increase in 0 DTE trading.
Graphic: Retrieved from Piper Sandler’s (NYSE: PIPR) Danny Kirsch.
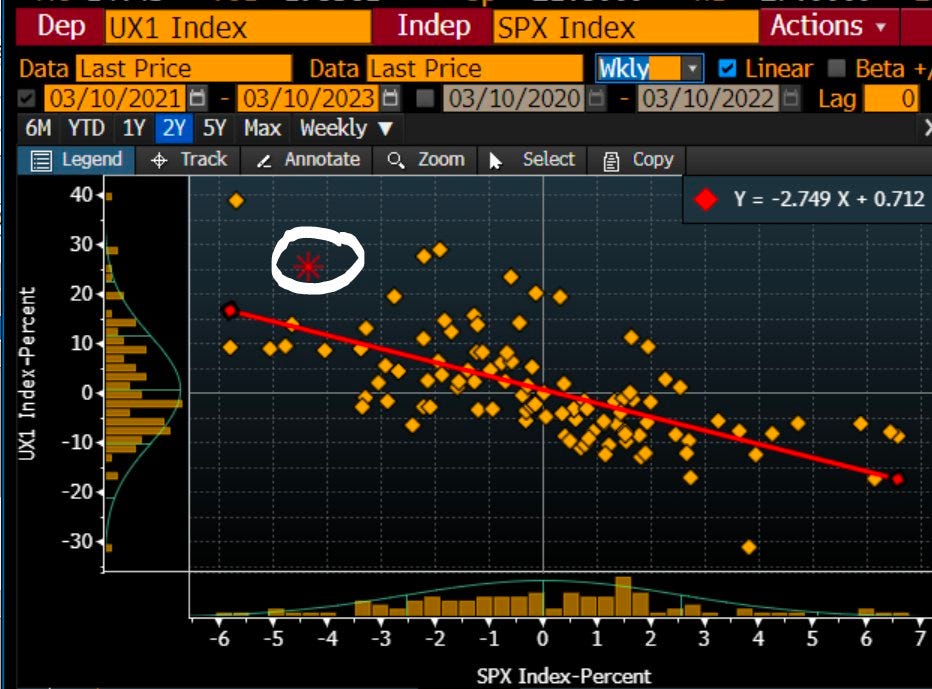
This spot-vol beta remark suggests that (at least some of) the volatility in rates, as well as certain small pockets of the equity and crypto market, manifested demand for crash protection in the S&P 500, “which feeds back into VIX,” one explanation put well.
Graphic: Retrieved from Piper Sandler’s (NYSE: PIPR) Danny Kirsch. “[Last] week finally got a bit of explosiveness in VIX as fixed strike volatility got bid. This is VIX generic front month future and move in SPX. Last time it really “paid” to have VIX upside was Jan of 2022 (point in upper left corner).”
Notwithstanding, for these options to keep their value and continue to perform well, realized volatility (RVOL) must pick up substantially, which is not likely.
Unlimited’s Bob Elliott comments: “the bond market is pricing a broad-based credit crunch, … [and though] it’s not crazy for the Fed to slow down here given the current uncertainty,” odds are financial problems are contained and the Fed moves forward with its mission to get (and keep) inflation down.
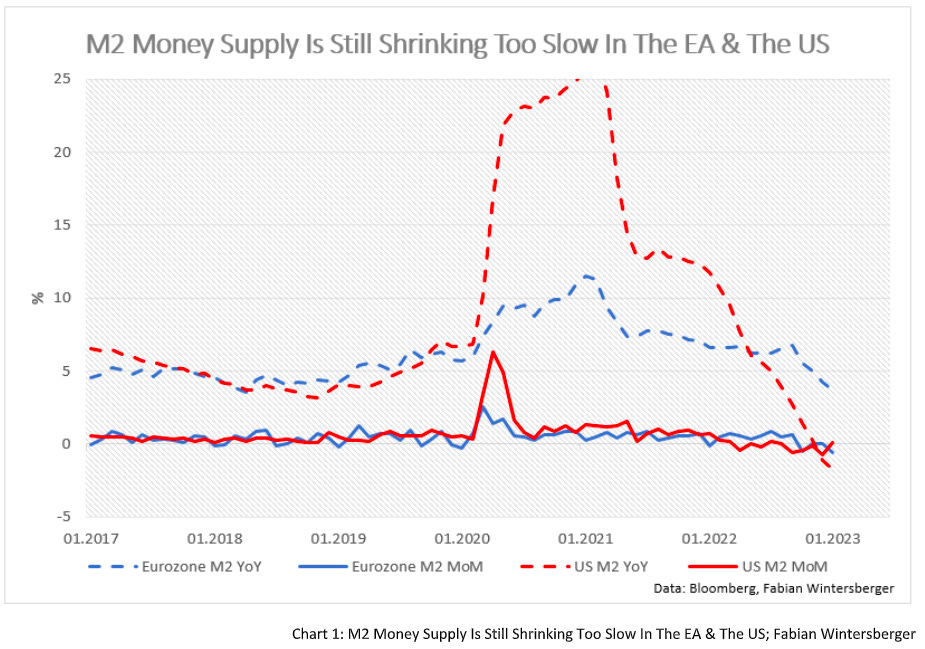
Graphic: Retrieved from Fabian Wintersberger. Just as the “monetary expansion supported the rise in equity and bond prices in January.”
Consequently, “the pricing of Dec23s and 5yr BEIs makes no sense,” Elliott adds. This means the example SOFR trade above is/was ripe for some monetization, and equity volatility must be dealt with carefully (i.e., price movements must be higher than they are now which would be difficult given that authorities/Fed do not want liquidations).
In support of siding with the less extreme take, we paraphrase Kai Volatility’s Cem Karsan who says that for years prior to the 2007-2008 turmoil, macro tourists were calling for a crash.
For markets to crumble, there would have to be an exogenous event far greater in implications than what just transpired with SIVB over the weekend. With odds that such turmoil doesn’t happen soon, coupled with participants easing up on their long-equity exposure (i.e., selling stock and not needing to hedge, hence the statement that owning equity volatility must be dealt with carefully), RVOL is likely to stay contained. That’s not to say that this volatility observed in the rates market can’t persist. It’s also not to say that markets can’t continue to trade lower (in fact, with interest rates rising and processes like quantitative tightening challenging bank liquidity, there is less incentive for investors to reside in lower-yielding equities). It just means that, barring some exogenous event, the market remains intact.
Graphic: Retrieved from Jack Farley. “Silicon Valley Bank owns >$80 Billion of Mortgage-Backed Securities (MBS), a market that is ‘more prone to bouts of volatility’ because ‘small investors & leveraged funds have become the main buyers’ as the Fed & banks step away from market, according to Dec 2022 BIS report.”
Positioning
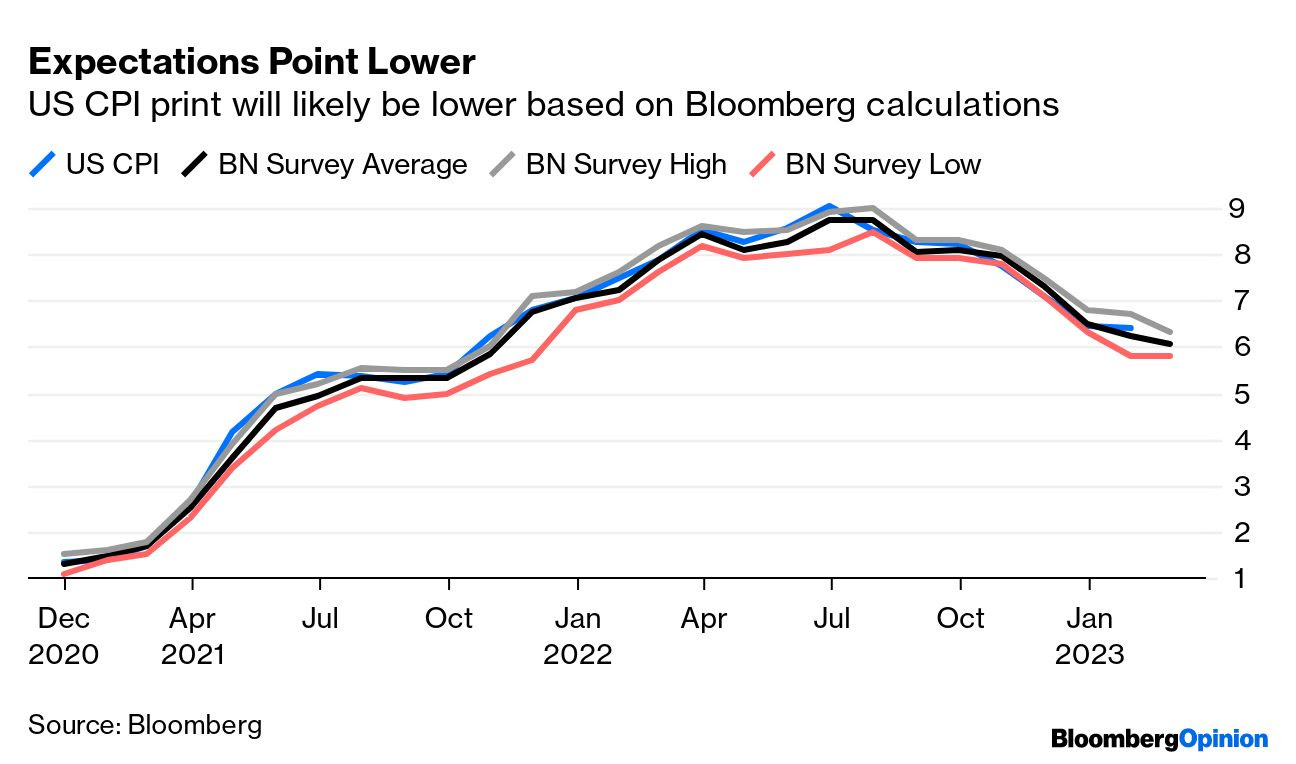
Following important events like the release of the Consumer Price Index (CPI) today, the compression of implied volatility or IVOL, coupled with the nearing of big options expirations (OpEx), sets the market up for potential short bursts of strength heading into the end of the month and next month.
Graphic: Retrieved from Bloomberg. Inflation has been well within forecasts.
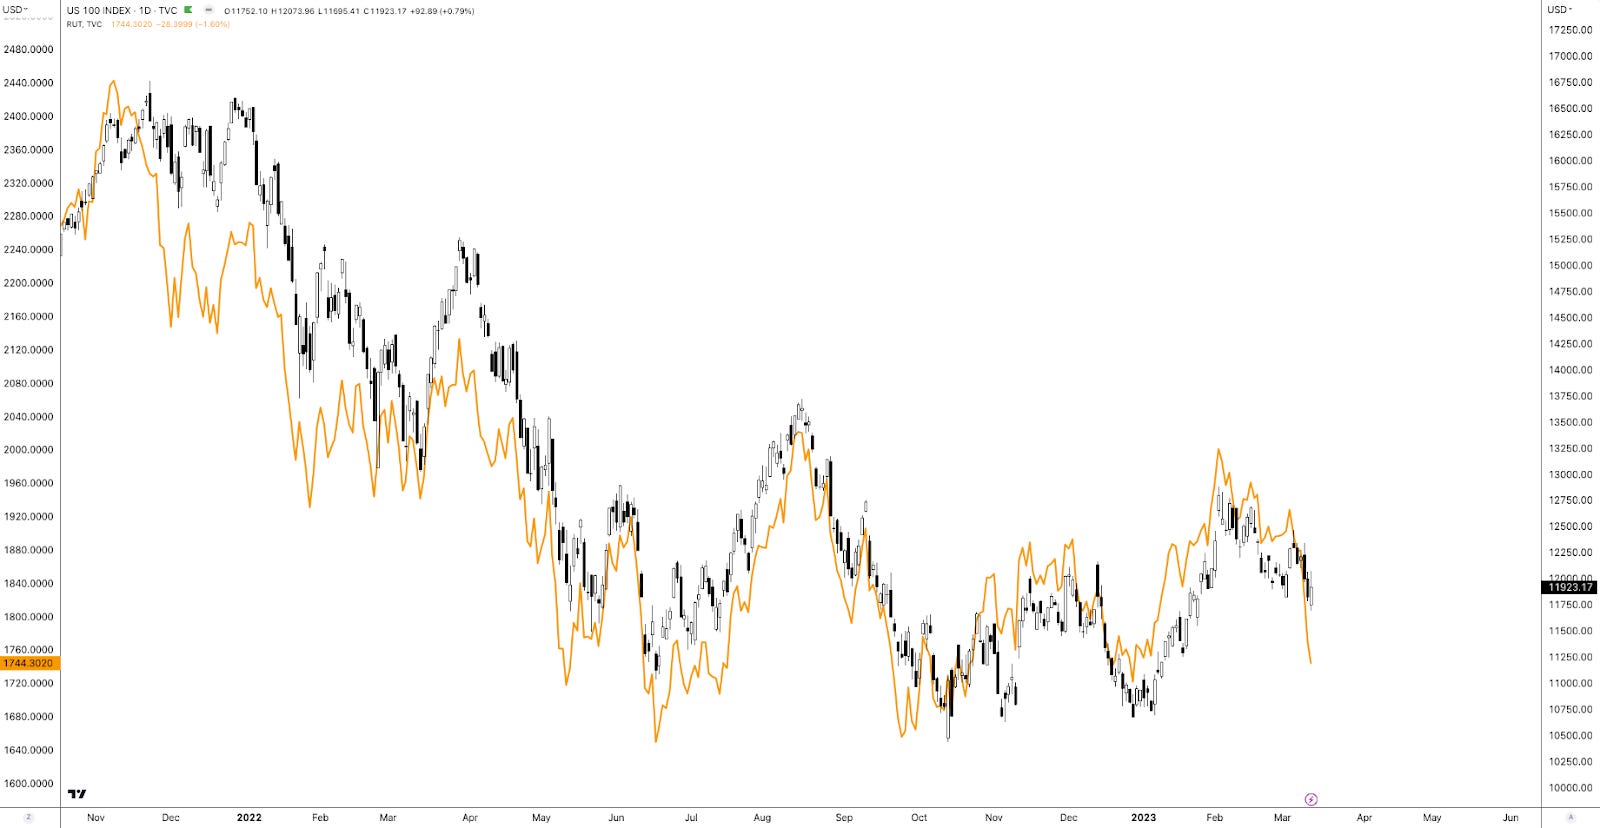
A quick comparison of the Russell 2000 (INDEX: RUT) and Nasdaq 100 (INDEX: NDX) suggests this options-induced strength may help keep the recent re-grossing theme intact. The compression of wound IVOL and passage of OpEx, coupled with the still-live re-grossing theme, may put a floor under equities.
Graphic: Retrieved from TradingView. Orange = RUT. Candles = NDX. Note the weakness in RUT. Note the strength of the Nasdaq relative to the Russell.
To play, one could place a portion of their cash in money market funds or T-bill ETFs or box spreads, for instance, while allocating another portion to leverage potential by way of some call options structures that use one or more short options to help bring down the cost of a long option that is closer to current market prices (e.g., a bull call spread or short ratio call spread). To note, based on options prices as of this writing, it may be too early to enter call structures (i.e., too expensive given the context).
DEFINED OUTCOME INVESTING
-Worried about the prospects of the 60/40 portfolio? -Looking for a strategy that takes advantage of higher interest rates? -Tired of market timing?
A 🧵on how to use exchange-traded options + U.S. Treasurys to define your risk today, for tomorrow.
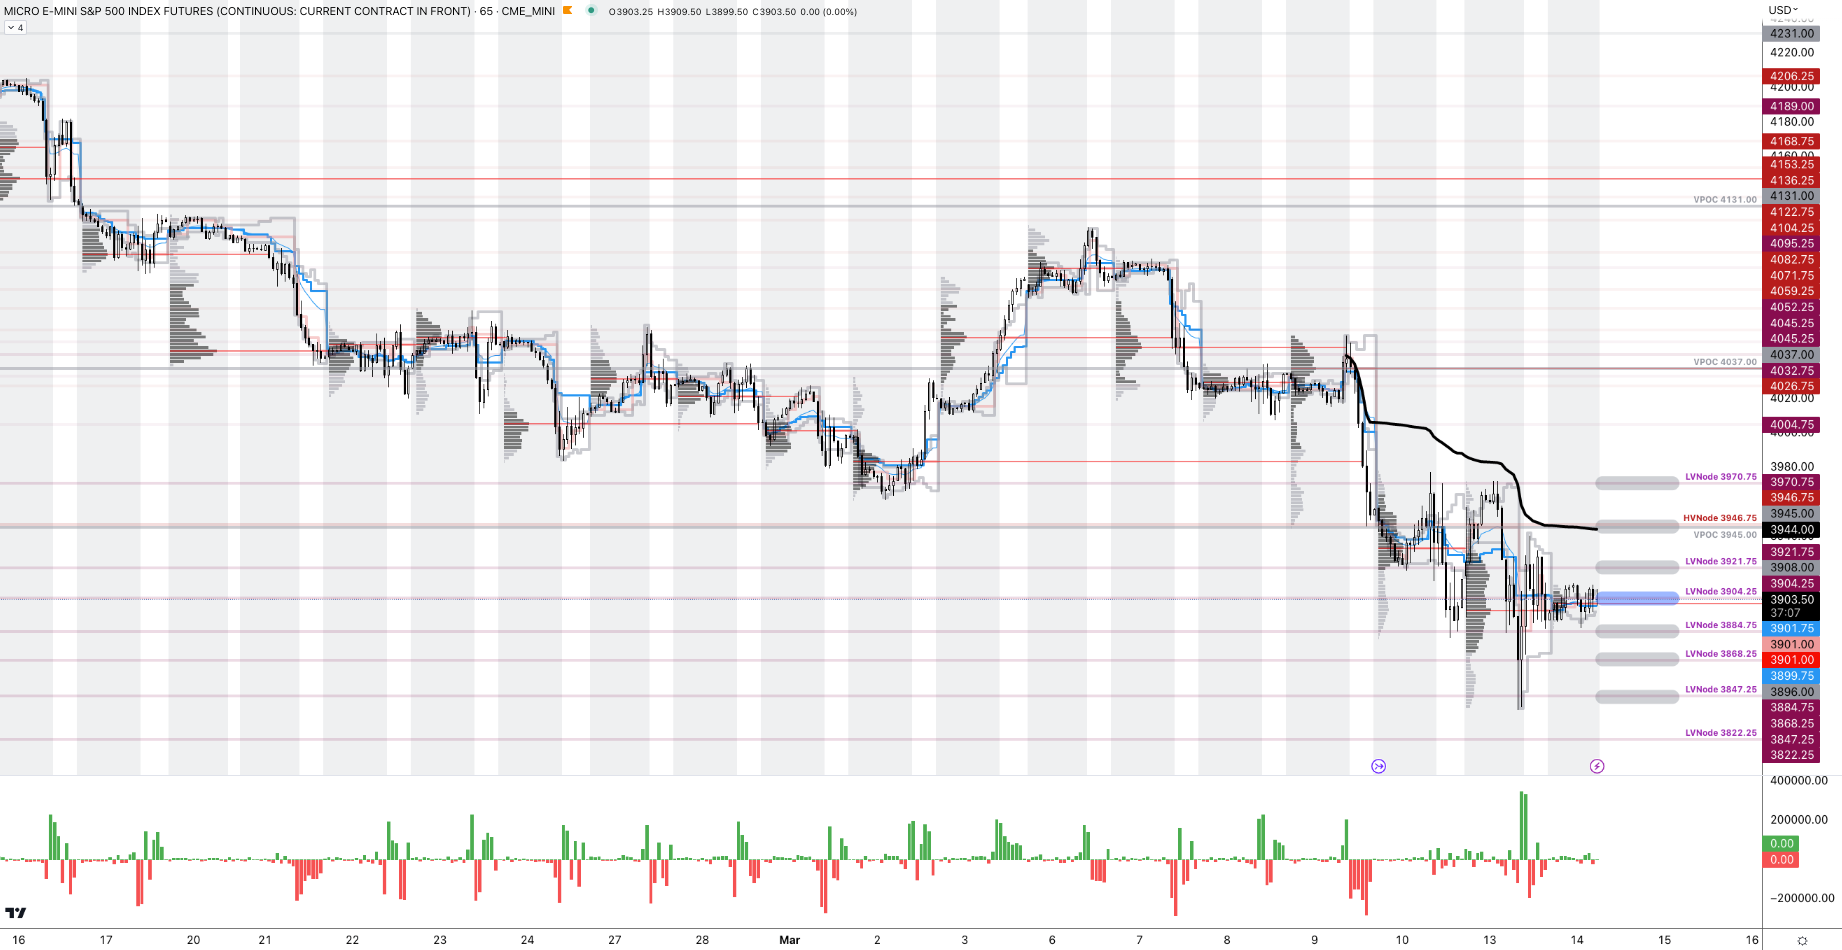
As of 6:30 AM ET, Tuesday’s regular session (9:30 AM – 4:00 PM ET), in the S&P 500, is likely to open in the middle part of a balanced overnight inventory, inside of the prior day’s range, suggesting a limited potential for immediate directional opportunity.
The S&P 500 pivot for today is $3,904.25.
Key levels to the upside include $3,921.75, $3,945.00, and $3,970.75.
Key levels to the downside include $3,884.75, $3,868.25, and $3,847.25.
Disclaimer: Click here to load the updated key levels via the web-based TradingView platform. New links are produced daily. Quoted levels likely hold barring an exogenous development.
Graphic: 65-minute profile chart of the Micro E-mini S&P 500 Futures.
Definitions
Volume Areas: Markets will build on areas of high-volume (HVNodes). Should the market trend for a period of time, this will be identified by a low-volume area (LVNodes). The LVNodes denote directional conviction and ought to offer support on any test.
If participants auction and find acceptance in an area of a prior LVNode, then future discovery ought to be volatile and quick as participants look to the nearest HVNodes for more favorable entry or exit.
POCs: Areas where two-sided trade was most prevalent in a prior day session. Participants will respond to future tests of value as they offer favorable entry and exit.
Volume-Weighted Average Prices (VWAPs): A metric highly regarded by chief investment officers, among other participants, for quality of trade. Additionally, liquidity algorithms are benchmarked and programmed to buy and sell around VWAPs.
About
The author, Renato Leonard Capelj, spends the bulk of his time at Physik Invest, an entity through which he invests and publishes free daily analyses to thousands of subscribers. The analyses offer him and his subscribers a way to stay on the right side of the market.
You may view this letter’s content calendar at this link.
Disclaimer
Do not construe this newsletter as advice. All content is for informational purposes. Capelj and Physik Invest manage their own capital and will not solicit others for it.
Physik Invest’s Daily Brief is read free by thousands of subscribers. Join this community to learn about the fundamental and technical drivers of markets.
Graphic updated 5:40 AM ET. Sentiment Neutral if expected /MES open is inside of the prior day’s range. /MES levels are derived from the profile graphic at the bottom of this letter. Click here for the latest levels. SqueezeMetrics Dark Pool Index (DIX) and Gamma (GEX) with the latter calculated based on where the prior day’s reading falls with respect to the MAX and MIN of all occurrences available. A higher DIX is bullish. The lower the GEX, the more (expected) volatility. Click to learn the implications of volatility, direction, and moneyness. Breadth reflects a reading of the prior day’s NYSE Advance/Decline indicator. The CBOE VIX Volatility Index (INDEX: VVIX) reflects the attractiveness of owning volatility. UMBS prices via MND. Click here for the economic calendar.
Administrative
Morning, team. Still working on a bigger write-up for later this week. Here are some key things to know. Have a good day!
Positioning
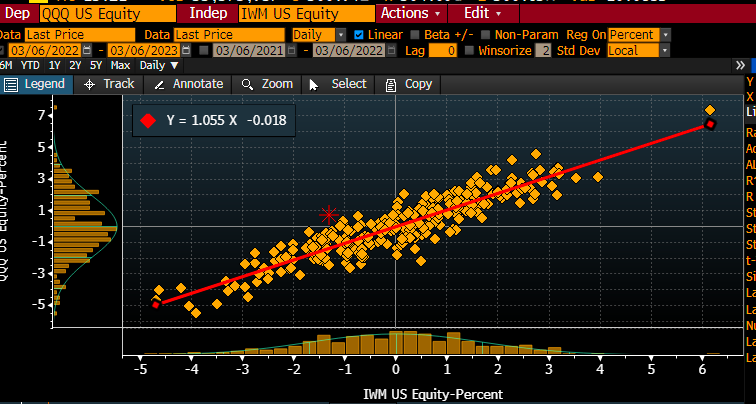
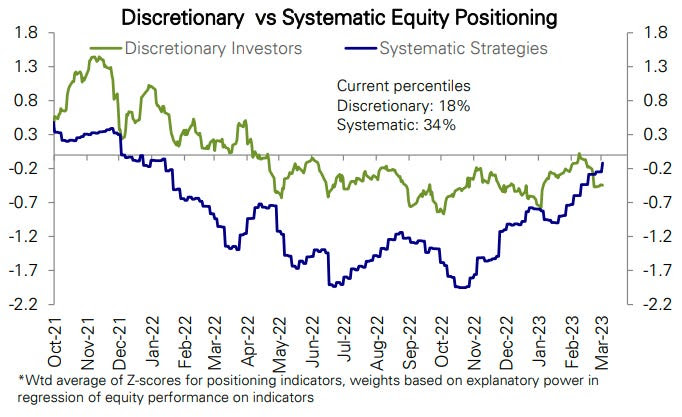
After a boost bolstered by systematic-type investors acting on changes in trend and volatility, the market is at a pivot of sorts.
Graphic: Retrieved from Danny Kirsch of Piper Sandler Companies (NYSE: PIPR). The move in [Nasdaq 100] relative to [the Russell 2000], [S&P 500 versus Russell 2000] looks similar. Ties into re-grossing theme, adding longs (QQQ+SPY) and shorts (IWM). Also fits with recent bid for credit.”
After a test of key areas of confluence, measures of the market’s strength weakened heading into the late-day equity weakness, Monday.
Graphic: Key market internals retrieved from TradingView.
Further, lots of the bullishness of the trend change and falling volatility was spent. The market is in a precarious state heading into Jerome Powell’s testimony, today.
Following Powell’s testimony, ranges likely expand.
On one hand, FOMO-type demand for call options exposures, coupled with CTAs further “raising their equity exposure” on trend signals and lower volatility, may boost markets into a “more combustible” state the Daily Brief for February 17 explained.
Graphic: Retrieved from Deutsche Bank AG (NYSE: DB) via Bloomberg.
On the other hand, in the context of liquidity coming off of the table and the increased competition between equities and fixed income, should Powell disappoint, expansion of implied volatility (IVOL) on demands for protection, alone, could “draw markets lower” into the March 17 options expiration (OpEx), options data and insight provider SpotGamma says. For more on how to trade this precariousness and reduce portfolio downside, see the Daily Brief for March 3.
Technical
As of 5:30 AM ET, Tuesday’s regular session (9:30 AM – 4:00 PM ET), in the S&P 500, is likely to open in the upper part of a positively skewed overnight inventory, inside of the prior day’s range, suggesting a limited potential for immediate directional opportunity.
The S&P 500 pivot for today is $4,059.25.
Key levels to the upside include $4,071.25, $4,082.75, and $4,095.25.
Key levels to the downside include $4,045.25, $4,032.75, and $4,019.00.
Disclaimer: Click here to load the updated key levels via the web-based TradingView platform. New links are produced daily. Quoted levels likely hold barring an exogenous development.
Graphic: 65-minute profile chart of the Micro E-mini S&P 500 Futures.
Definitions
Volume Areas: Markets will build on areas of high-volume (HVNodes). Should the market trend for a period of time, this will be identified by a low-volume area (LVNodes). The LVNodes denote directional conviction and ought to offer support on any test.
If participants auction and find acceptance in an area of a prior LVNode, then future discovery ought to be volatile and quick as participants look to the nearest HVNodes for more favorable entry or exit.
POCs: Areas where two-sided trade was most prevalent in a prior day session. Participants will respond to future tests of value as they offer favorable entry and exit.
Volume-Weighted Average Prices (VWAPs): A metric highly regarded by chief investment officers, among other participants, for quality of trade. Additionally, liquidity algorithms are benchmarked and programmed to buy and sell around VWAPs.
About
The author, Renato Leonard Capelj, spends the bulk of his time at Physik Invest, an entity through which he invests and publishes free daily analyses to thousands of subscribers. The analyses offer him and his subscribers a way to stay on the right side of the market.
You may view this letter’s content calendar at this link.
Disclaimer
Do not construe this newsletter as advice. All content is for informational purposes. Capelj and Physik Invest manage their own capital and will not solicit others for it.
Physik Invest’s Daily Brief is read free by thousands of subscribers. Join this community to learn about the fundamental and technical drivers of markets.
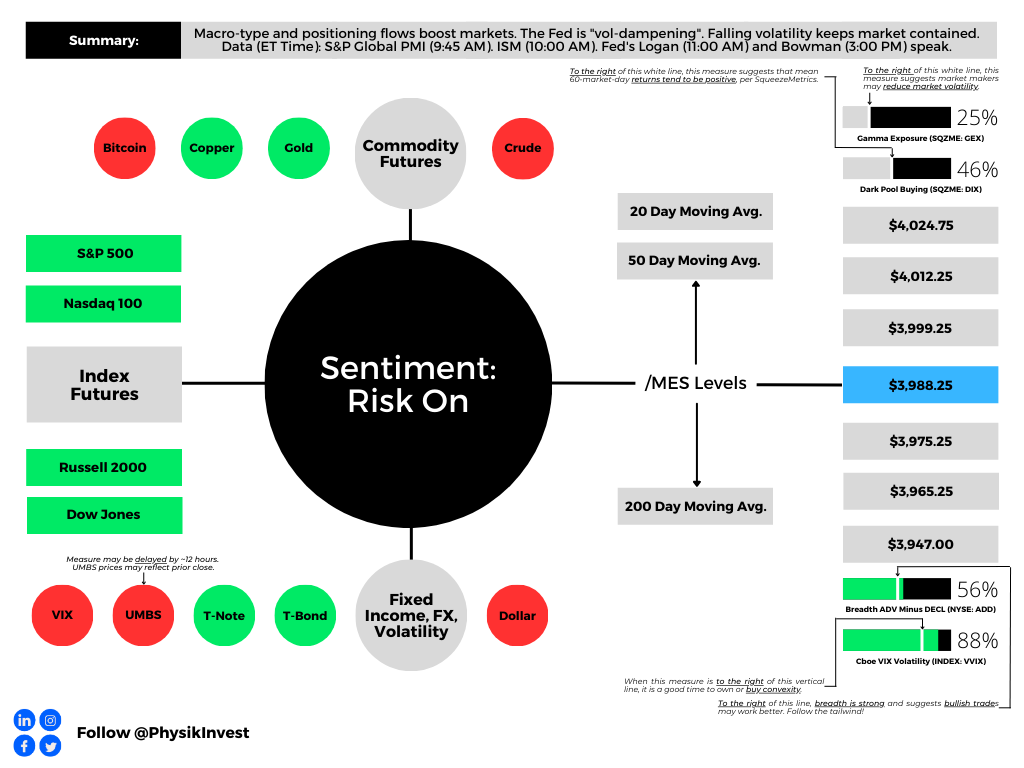
Graphic updated 7:00 AM ET. Sentiment Risk-On if expected /MES open is above the prior day’s range. /MES levels are derived from the profile graphic at the bottom of this letter. Click here for the latest levels. SqueezeMetrics Dark Pool Index (DIX) and Gamma (GEX) with the latter calculated based on where the prior day’s reading falls with respect to the MAX and MIN of all occurrences available. A higher DIX is bullish. The lower the GEX, the more (expected) volatility. Click to learn the implications of volatility, direction, and moneyness. Breadth reflects a reading of the prior day’s NYSE Advance/Decline indicator. The CBOE VIX Volatility Index (INDEX: VVIX) reflects the attractiveness of owning volatility. UMBS prices via MND. Click here for the economic calendar.
Administrative
Lots of content today but a bit rushed at the desk. If anything is unclear, we will clarify it in the coming sessions. Have a great weekend! – Renato
Fundamental
Physik Invest’s Daily Brief for March 2 talked about balancing the implications of still-hot inflation and an economy on solid footing. Basically, the probability the economy is in a recession is lower than it was at the end of ‘22. For the probabilities to change markedly, there would have to be a big increase in unemployment, for one.
According to a blog by Unlimited’s Bruce McNevin, if the unemployment rate rises by about 1%, recession odds go up by 29%. If the non-farm payroll employment falls by about 2% or 3 million jobs, recession odds increase by about 74%. After a year or so of tightening, unemployment measures are finally beginning to pick up.
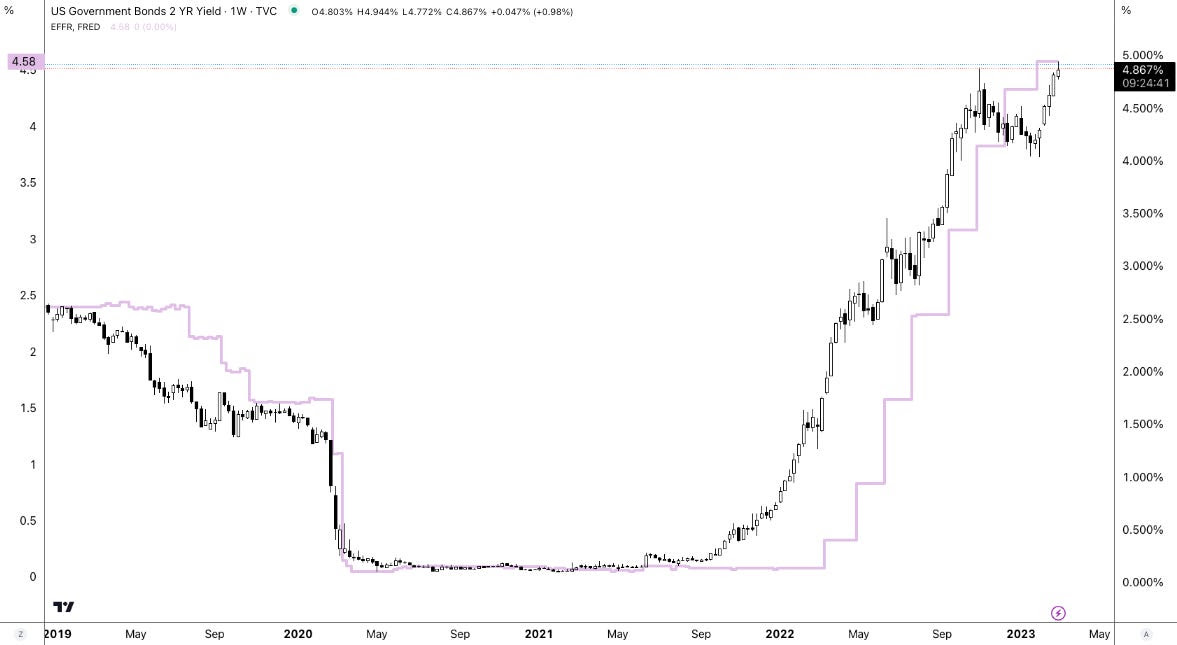
Policymakers, per recent remarks, maintain that more needs to be done, however. For instance, the Federal Reserve’s (Fed) Raphael Bostic, who generally carries an easier stance on monetary policy, mulled whether the Fed should raise interest rates beyond the 5.00-5.25% terminal rate consensus he previously endorsed. This commentary, coupled with newly released economic data, has sent yields surging at the front end.
Graphic: Retrieved from TradingView.
Traders are wildly repricing their terminal rate expectations this week. The terminal rate over the past few days has gone up from 5.25-5.50% to 5.50-5.75%, and back down to 5.25-5.50%.
Graphic: Retrieved from CME Group Inc (NASDAQ: CME).
Positioning
Stocks and bonds performed poorly. Commodity hedges are uninspiring also in that they do not hedge against (rising odds of) recession, per the Daily Brief for March 1.
In navigating this precarious environment, this letter has put forward a few trade ideas including the sale of call options structures to finance put options structures, after the mid-February monthly options expiration (OpEx). Though measures suggest “we can [still] get cheap exposure to convexity while a lot of people are worried,” the location for similar (short call, long put) trades is not optimal. Rather, trades including building your own structured note, now catching the attention of some traders online, appear attractive now with T-bill rates surging.
Such trades reduce portfolio volatility and downside while providing upside exposure comparable to poorly performing traditional portfolio constructions like 60/40.
As an example, per IPS Strategic Capital’s Pat Hennessy, with $1,000,000 to invest and rates at ~5% (i.e., $50,000 is 5% of $1,000,000), one could buy 1000 USTs or S&P 500 (INDEX: SPX) Box Spreads which will have a value of $1 million at maturity for the price of $950,000.
With $50,000 left in cash, one can use options for leveraged exposure to an asset of their choosing, Hennessy explained. Should these options expire worthless, the $50,000 gain from USTs, at maturity, provides “a full return of principal.”
For traders who are focused on short(er)-term movements, one could allocate the cash remaining toward structures that buy and sell call options over very short time horizons (e.g., 0 DTE).
Knowing that the absence of range expansion to the downside, positioning flows may build a platform for the market to rally, one could lean into structures like fixed-width call option butterflies.
For instance, yesterday, Nasdaq 100 (INDEX: NDX) call option butterflies expanded in value ~10 times (i.e., $5 → $50). An example 0 DTE trade is the BUTTERFLY NDX 100 (Weeklys) 2 MAR 23 12000/12100/12200 CALL. Such trade could have been bought near ~$5.00 in debit and, later, sold for much bigger credits (e.g., ~$40.00).
Such trade fits and plays on the narrative described in Physik Invest’s Daily Brief for February 24. That particular letter detailed Bank of America Corporation’s (NYSE: BAC) finding that “volume is uniquely skewed towards the ask early in the day but towards the bid later in the day” for these highly traded ultra-short-dated options.
Graphic: Retrieved from Goldman Sachs Group Inc (NYSE: GS) via Bloomberg.
Even options insight and data provider SqueezeMetrics agrees: “Buy 0 DTE call.” The typical “day doesn’t end above straddle b/e, but call makes money,” SqueezeMetrics explained. “Dealer and call-buyer both profit. Gap down, repeat.”
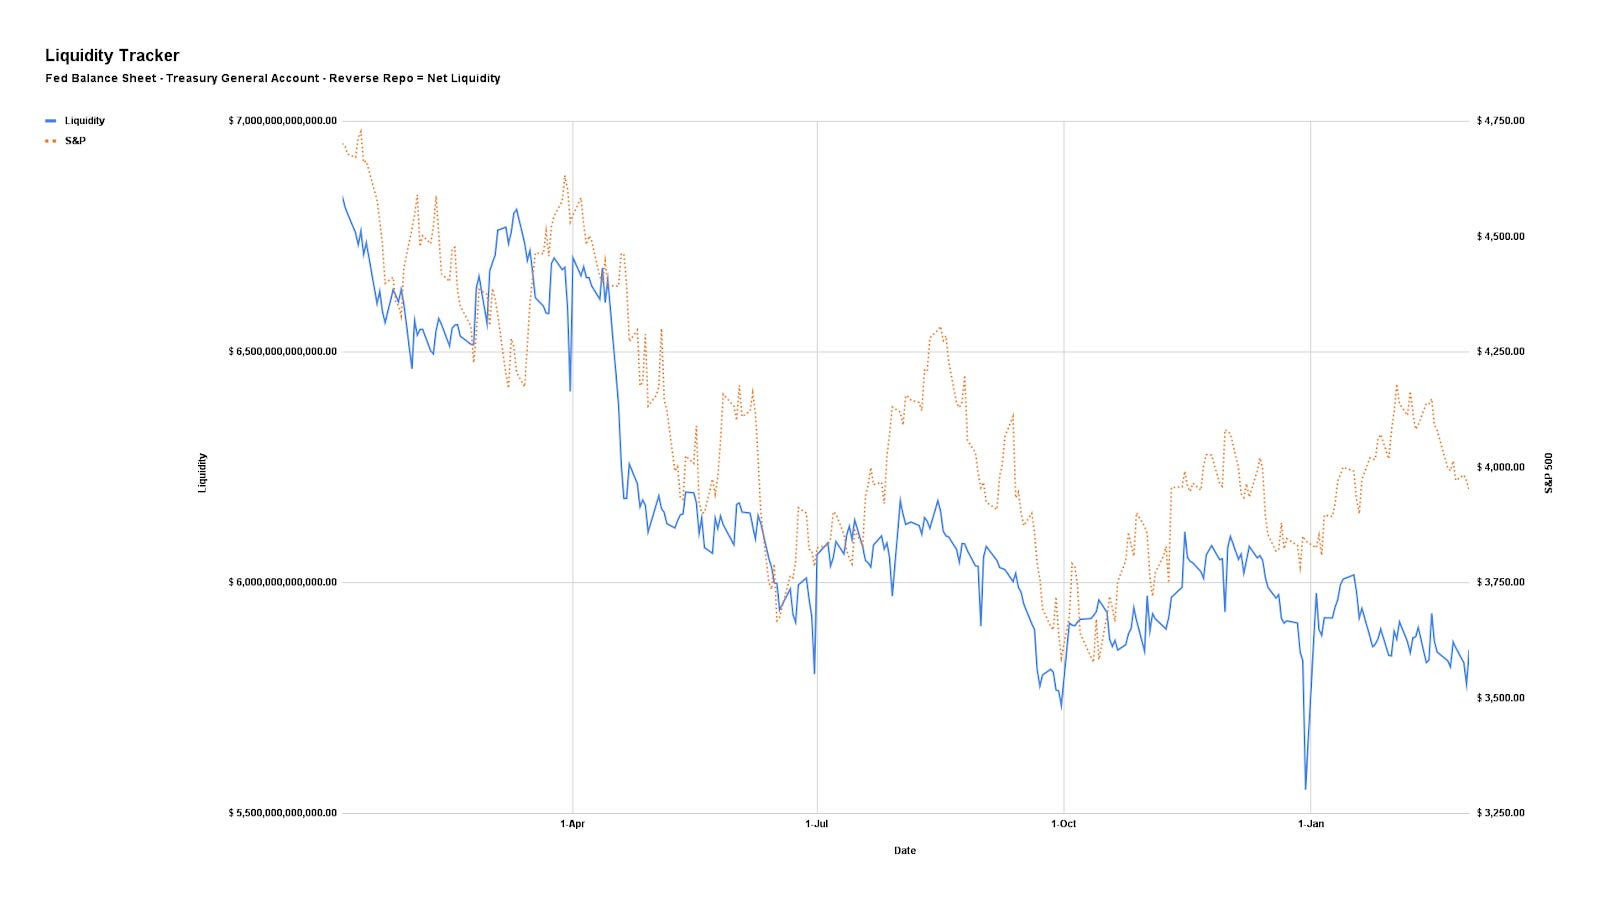
Anyways, back to the bigger trends impacted by liquidity coming off the table and increased competition between equities and fixed income.
Graphic: Via Physik Invest. Net Liquidity = Fed Balance Sheet – Treasury General Account – Reverse Repo.
As this letter put forth in the past, if the “market consolidates and doesn’t break,” as we see, the delta buy-back with respect to dropping implied volatility (IVOL) or vanna and buy-back with respect to the passage of time or charm could build a platform for a FOMO-driven call buying rally that ends in a blow-off.
Graphic: Retrieved from Piper Sandler’s (NYSE: PIPR) Danny Kirsch. Short volatility and short stocks was attractive to trade. As your letter writer put in a recent SpotGamma note: “With IV at already low levels, the bullish impact of it falling further is weak, hence the SPX trending lower all the while IV measures (e.g., VIX term structure) have shifted markedly lower since last week. If IV was at a higher starting point, its falling would work to keep the market in a far more positive/bullish stance.”
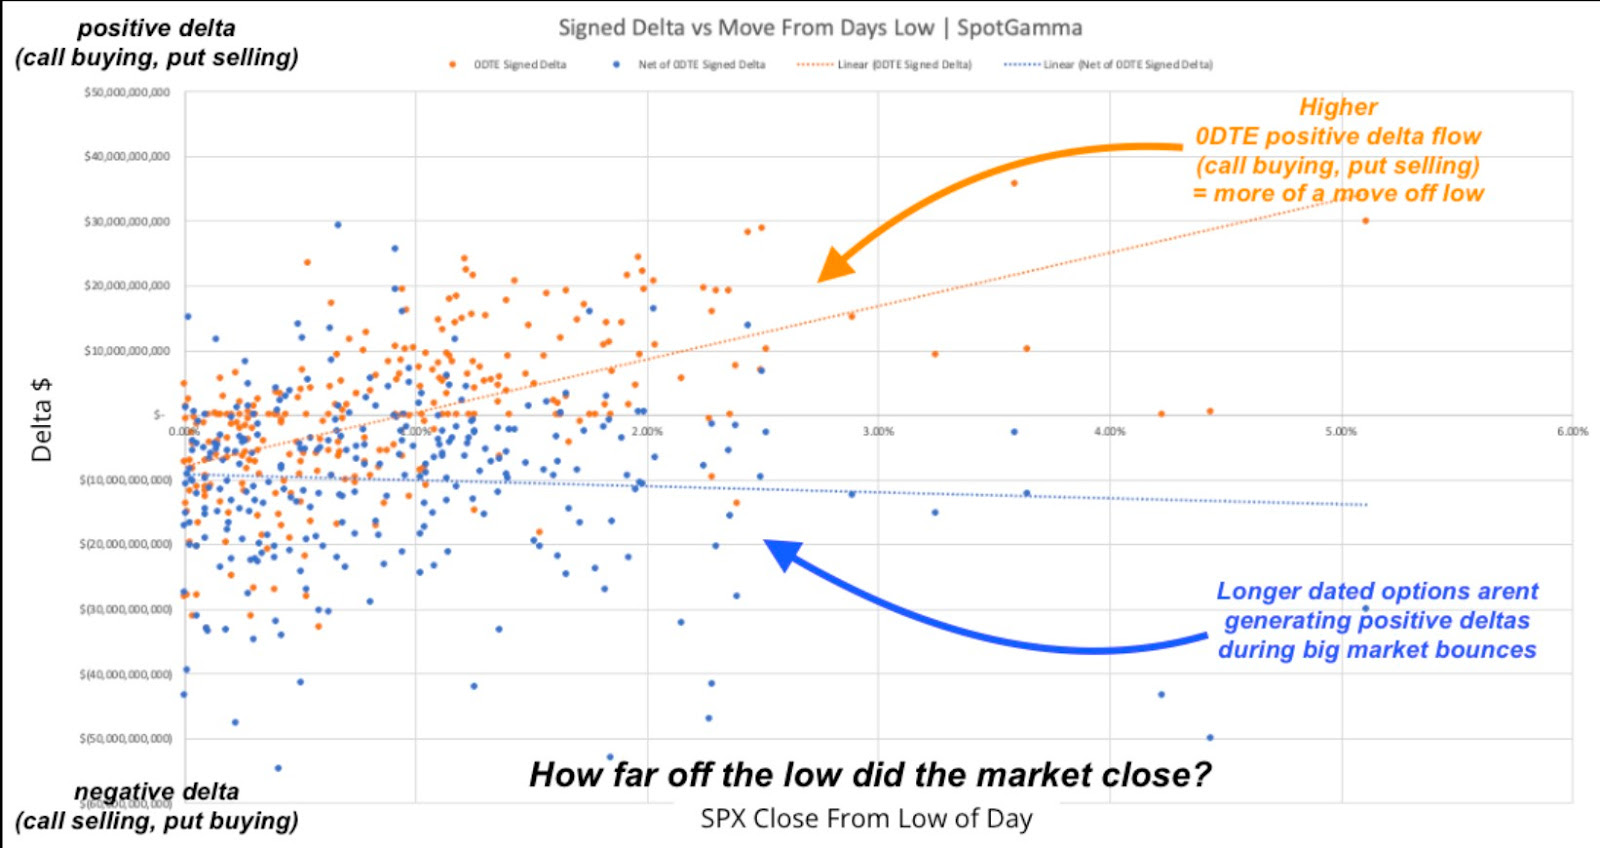
Per data by SpotGamma, another options insight and data provider your letter writer used to write for and highly recommends checking out, call buying, particularly over short time horizons, was often tied to market rallies.
“0DTE does not seem to be associated with betting on a large downside movement. Large downside market volatility appears to be driven by larger, longer-dated S&P volume,” SpotGamma founder Brent Kochuba said in the Bloomberg article. “Where 0DTE is currently most impactful is where it seems 0DTE calls are being used to ‘buy the dips’ after large declines. In a way this suppresses volatility.”
Anyways, the signs of a “more combustible situation” would likely show when “volatility is sticky into a rally,” explained Kai Volatiity’s Cem Karsan. To gauge combustibility, look to the Daily Brief for February 17.
Technical
As of 6:50 AM ET, Friday’s regular session (9:30 AM – 4:00 PM ET), in the S&P 500, is likely to open in the upper part of a positively skewed overnight inventory, outside of the prior day’s range, suggesting a potential for immediate directional opportunity.
The S&P 500 pivot for today is $3,988.25.
Key levels to the upside include $3,999.25, $4,012.25, and $4,024.75.
Key levels to the downside include $3,975.25, $3,965.25, and $3,947.00.
Disclaimer: Click here to load the updated key levels via the web-based TradingView platform. New links are produced daily. Quoted levels likely hold barring an exogenous development.
Graphic: 65-minute profile chart of the Micro E-mini S&P 500 Futures.
Definitions
Volume Areas: Markets will build on areas of high-volume (HVNodes). Should the market trend for a period of time, this will be identified by a low-volume area (LVNodes). The LVNodes denote directional conviction and ought to offer support on any test.
If participants auction and find acceptance in an area of a prior LVNode, then future discovery ought to be volatile and quick as participants look to the nearest HVNodes for more favorable entry or exit.
Vanna: The rate at which the Delta of an option changes with respect to implied volatility.
Charm: The rate at which the Delta of an option changes with respect to time.
POCs: Areas where two-sided trade was most prevalent in a prior day session. Participants will respond to future tests of value as they offer favorable entry and exit.
MCPOCs: Denote areas where two-sided trade was most prevalent over numerous sessions. Participants will respond to future tests of value as they offer favorable entry and exit.
Options Expiration (OPEX): Reduction in dealer Gamma exposure. Often, there is an increase in volatility after the removal of large options positions and associated hedging.
Options: Options offer an efficient way to gain directional exposure.
If an option buyer was short (long) stock, he or she could buy a call (put) to hedge upside (downside) exposure. Additionally, one can spread, or buy (+) and sell (-) options together, strategically.
Commonly discussed spreads include credit, debit, ratio, back, and calendar.
Credit: Sell -1 option closer to the money. Buy +1 option farther out of the money.
Debit: Buy +1 option closer to the money. Sell -1 option farther out of the money.
Ratio: Buy +1 option closer to the money. Sell -2 options farther out of the money.
Back: Sell -1 option closer to the money. Buy +2 options farther out of the money.
Calendar: Sell -1 option. Buy +1 option farther out in time, at the same strike.
Typically, if bullish (bearish), sell at-the-money put (call) credit spread and/or buy a call (put) debit/ratio spread structured around the target price. Alternatively, if the expected directional move is great (small), opt for a back spread (calendar spread). Also, if credit spread, capture 50-75% of the premium collected. If debit spread, capture 2-300% of the premium paid.
Be cognizant of risk exposure to the direction (Delta), movement (Gamma), time (Theta), and volatility (Vega).
Negative (positive) Delta = synthetic short (long).
Negative (positive) Gamma = movement hurts (helps).
Negative (positive) Theta = time decay hurts (helps).
The author, Renato Leonard Capelj, spends the bulk of his time at Physik Invest, an entity through which he invests and publishes free daily analyses to thousands of subscribers. The analyses offer him and his subscribers a way to stay on the right side of the market.
You may view this letter’s content calendar at this link.
Disclaimer
Do not construe this newsletter as advice. All content is for informational purposes. Capelj and Physik Invest manage their own capital and will not solicit others for it.
Physik Invest’s Daily Brief is read by thousands of subscribers. You, too, can join this community to learn about the fundamental and technical drivers of markets.
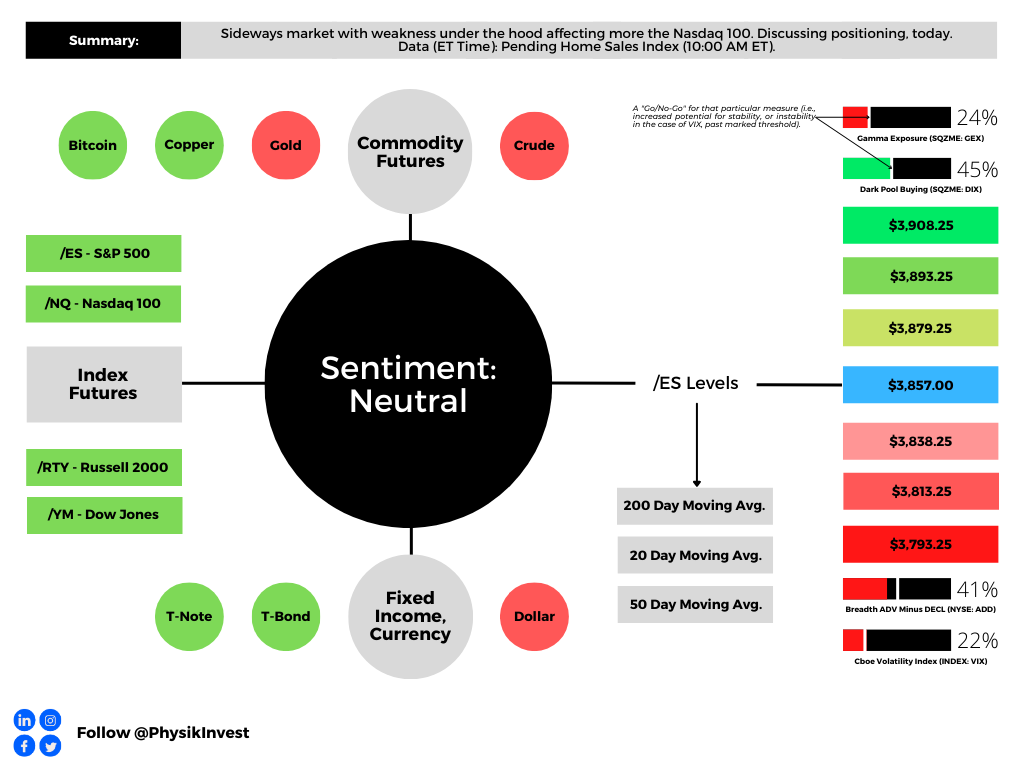
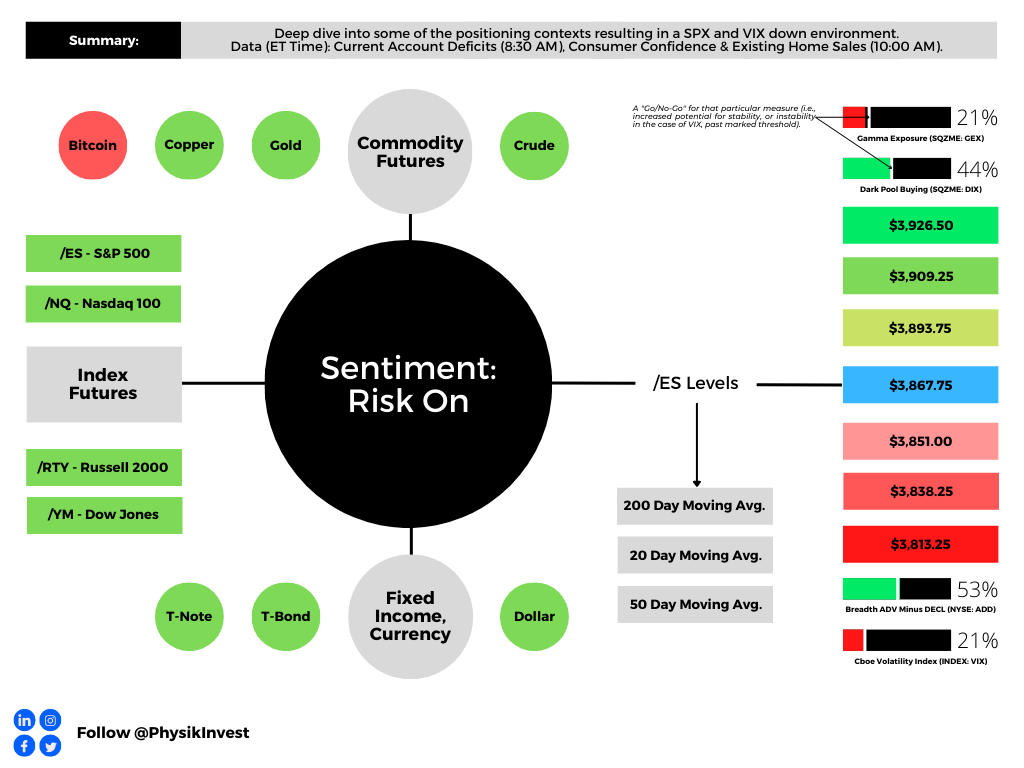
Graphic updated 6:40 AM ET. Sentiment Neutral if expected /ES open is inside of the prior day’s range. /ES levels are derived from the profile graphic at the bottom of this letter. Levels may have changed since initially quoted; click here for the latest levels. SqueezeMetrics Dark Pool Index (DIX) and Gamma (GEX) with the latter calculated based on where the prior day’s reading falls with respect to the MAX and MIN of all occurrences available. A higher DIX is bullish. At the same time, the lower the GEX, the more (expected) volatility. Click to learn the implications of volatility, direction, and moneyness. Breadth reflects a reading of the prior day’s NYSE Advance/Decline indicator. VIX reflects a current reading of the CBOE Volatility Index (INDEX: VIX) from 0-100.
Positioning
In Physik Invest’s Market Intelligence letter for December 21, we discussed the potential for “pressure on options prices [to] remain through December.” In short, on the odds that “nothing happens through the holidays,” it made sense to sell implied volatility (IVOL) after CPI and FOMC targeting an end-of-month expiration.
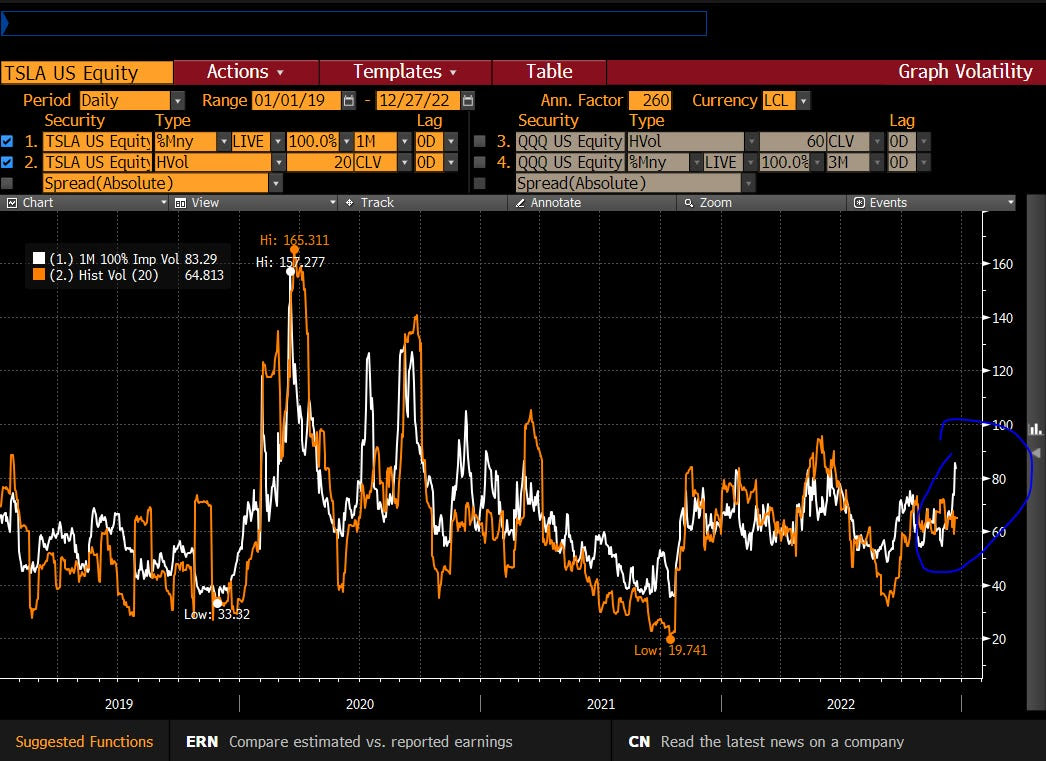
The downward trajectory in IVOL remains intact in spite of some pockets of weakness under the hood in index heavyweights like Tesla Inc (NASDAQ: TSLA); expectations of future movement remain mute at both the index and single stock levels. As a result, short volatility trades (e.g., short straddle) in the indexes and near current market prices, expiring later this month, are doing really well.
Graphic: Retrieved from Kris Sidial. Tesla Inc (NASDAQ: TSLA) 1-month IVOL “relatively muted throughout the pain.”
Part of the equation resulting in this sideways market and tame IVOL environment was discussed in the December 21 letter. Today we add color.
In short, traders’ anticipation of a market drop, as evidenced by them reducing equity exposures into and through the 2022 market decline, coupled with the exploitation of loopholes manifesting increased demand for short-dated exposure to movements (i.e., gamma), and a supply of IVOL that is farther-dated, has put a lid on broad equity IVOL measures like the Cboe Volatility Index (INDEX: VIX) and pushed skew lower.
Consequently, hedges performing well have a lot of +gamma intraday and exposure to realized volatility (RVOL), and less exposure to longer-dated IVOL. The other side of this trade (and those who may be warehousing this risk) has exposure to -gamma and, to hedge that, they must act in a manner that exacerbates realized movement, hence RVOL’s meaningful outperformance.
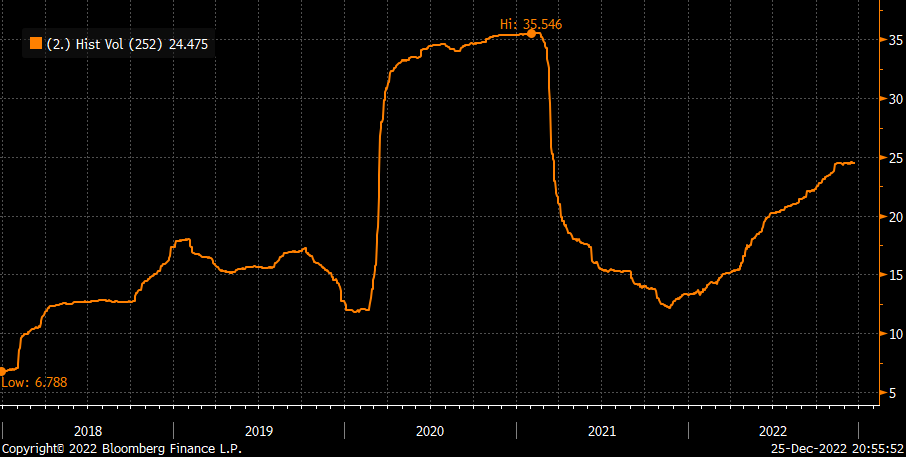
In fact, RVOL in 2022 is nearly two times the level of RVOL in 2021, all the while the IVOL term structure is basically at the “same place it was a year ago,” according to Danny Kirsch of Piper Sandler Companies (NYSE: PIPR).
Graphic: Retrieved from Danny Kirsch, the head of options at Piper Sandler Companies (NYSE: PIPR). “Rolling 1 year realized volatility [for] … 2022 nearly 2x the level of 2021, speaks to long gamma and not vega for 2022.”
In a two-and-a-half-hour Twitter Spaces discussion, Kai Volatility’s Cem Karsan discussed what is the potential cause of this. Some of the blame rests on the way margin calculations (i.e., the loophole mentioned earlier); less cash must be posted if trades are closed the same day, basically.
Anyways, at the macro level, yes, the trends continue. Generally speaking, IVOL is mute and not accounting for the activity in short-dated options, as discussed by The Ambrus Group’s recent paper, while RVOL is about two times the level it was in 2021, making +gamma profitable.
However, at the micro level, so to speak, as we started out this discussion, traders’ anticipation that “nothing happens through the holidays,” has resulted in the supply of short-dated volatility, boosting the stickiness of open interest at current market prices.
Let’s unpack this further and explain why this activity won’t continue forever.
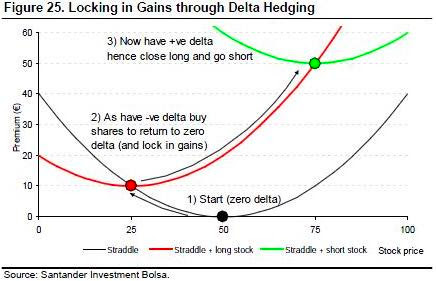
Near current market prices sit large concentrations of options positions. For instance, we have the $3,835.00 SPX strike (the call part of a massively popular collar trade that is rolled every quarter). At $3,835.00 is the short strike of a big collar trade.
This means the trader (or fund owner) is short the call, hence -delta and -gamma. The other side (or counterpart) is long the call, hence +delta and +gamma.
In theory, the other side, in response to this exposure, will buy weakness and sell strength. In other words, to hedge a long call, the other side sells futures. If the market falls, the call’s delta will fall and become less positive. Therefore, the other side will buy back some of their initial futures hedges (reduce -delta from short futures) to neutralize delta risk. If the market rises, the other side will have more exposure to +delta. To neutralize the delta, the other side will sell more futures.
As a consequence, the market pins.
Graphic: Retrieved from Banco Santander SA (NYSE: SAN).
This is a trend, as we discussed on December 21, that likely continues through year-end. After year-end, the market is likely to “move more freely,” per SpotGamma, “because this options activity that is promoting mean reversion will no longer be there,” and, therefore, the indexes likely trade more “in sync with its wild constituents of the likes of Tesla and beyond.”
More on what’s next:
As Karsan dissected, yesterday, there’s a “liquidity premium” that’s getting crowded short; in this less well-hedged market environment, traders’ realization with respect to liquidity and collateral needs for supporting trading activities may provide the context for some sharp drops. But first, it’s likely (though not certain) the market experiences some relief. Knowing that the long-end is cheap (hence near-zero percentile skew) on a supply and demand basis, it does not make sense to sell options blindly out in time.
Technical
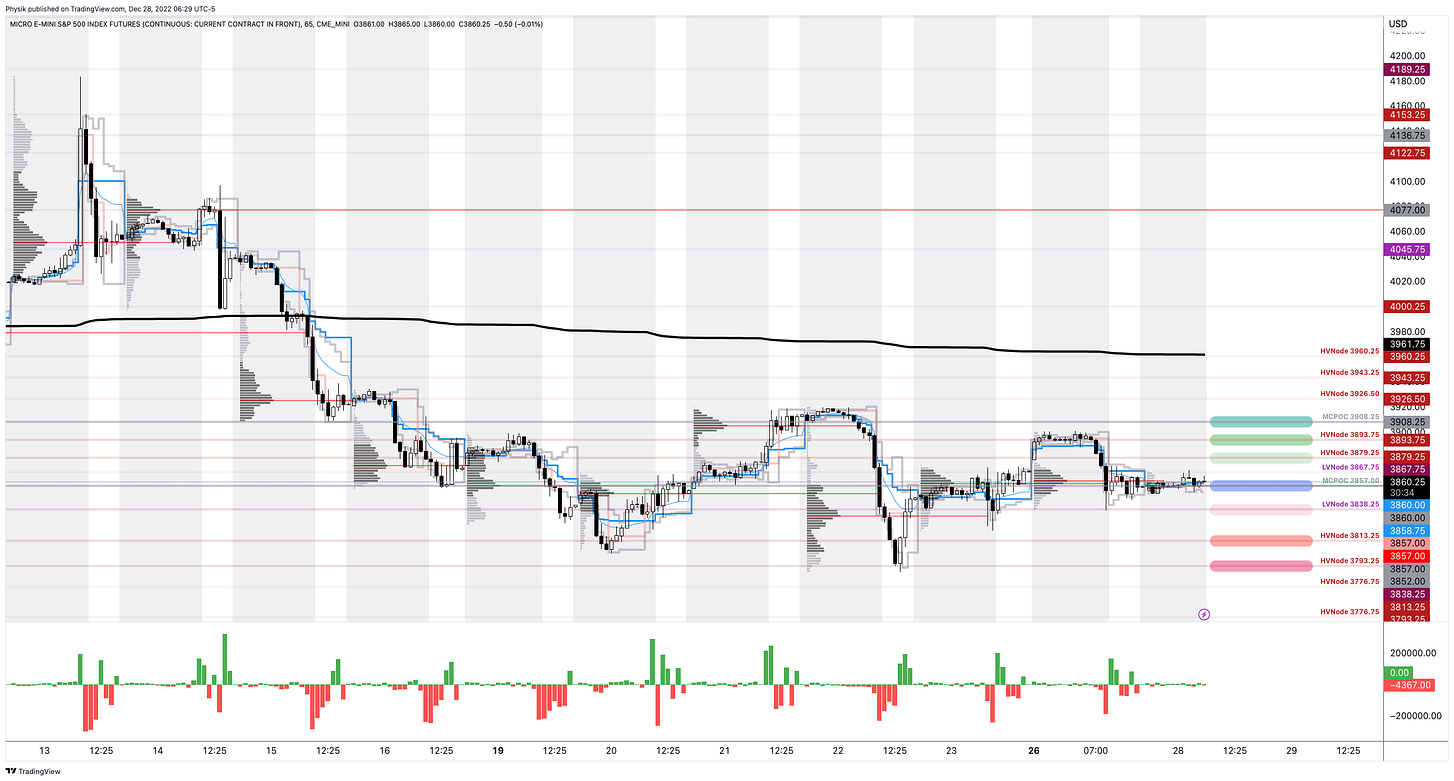
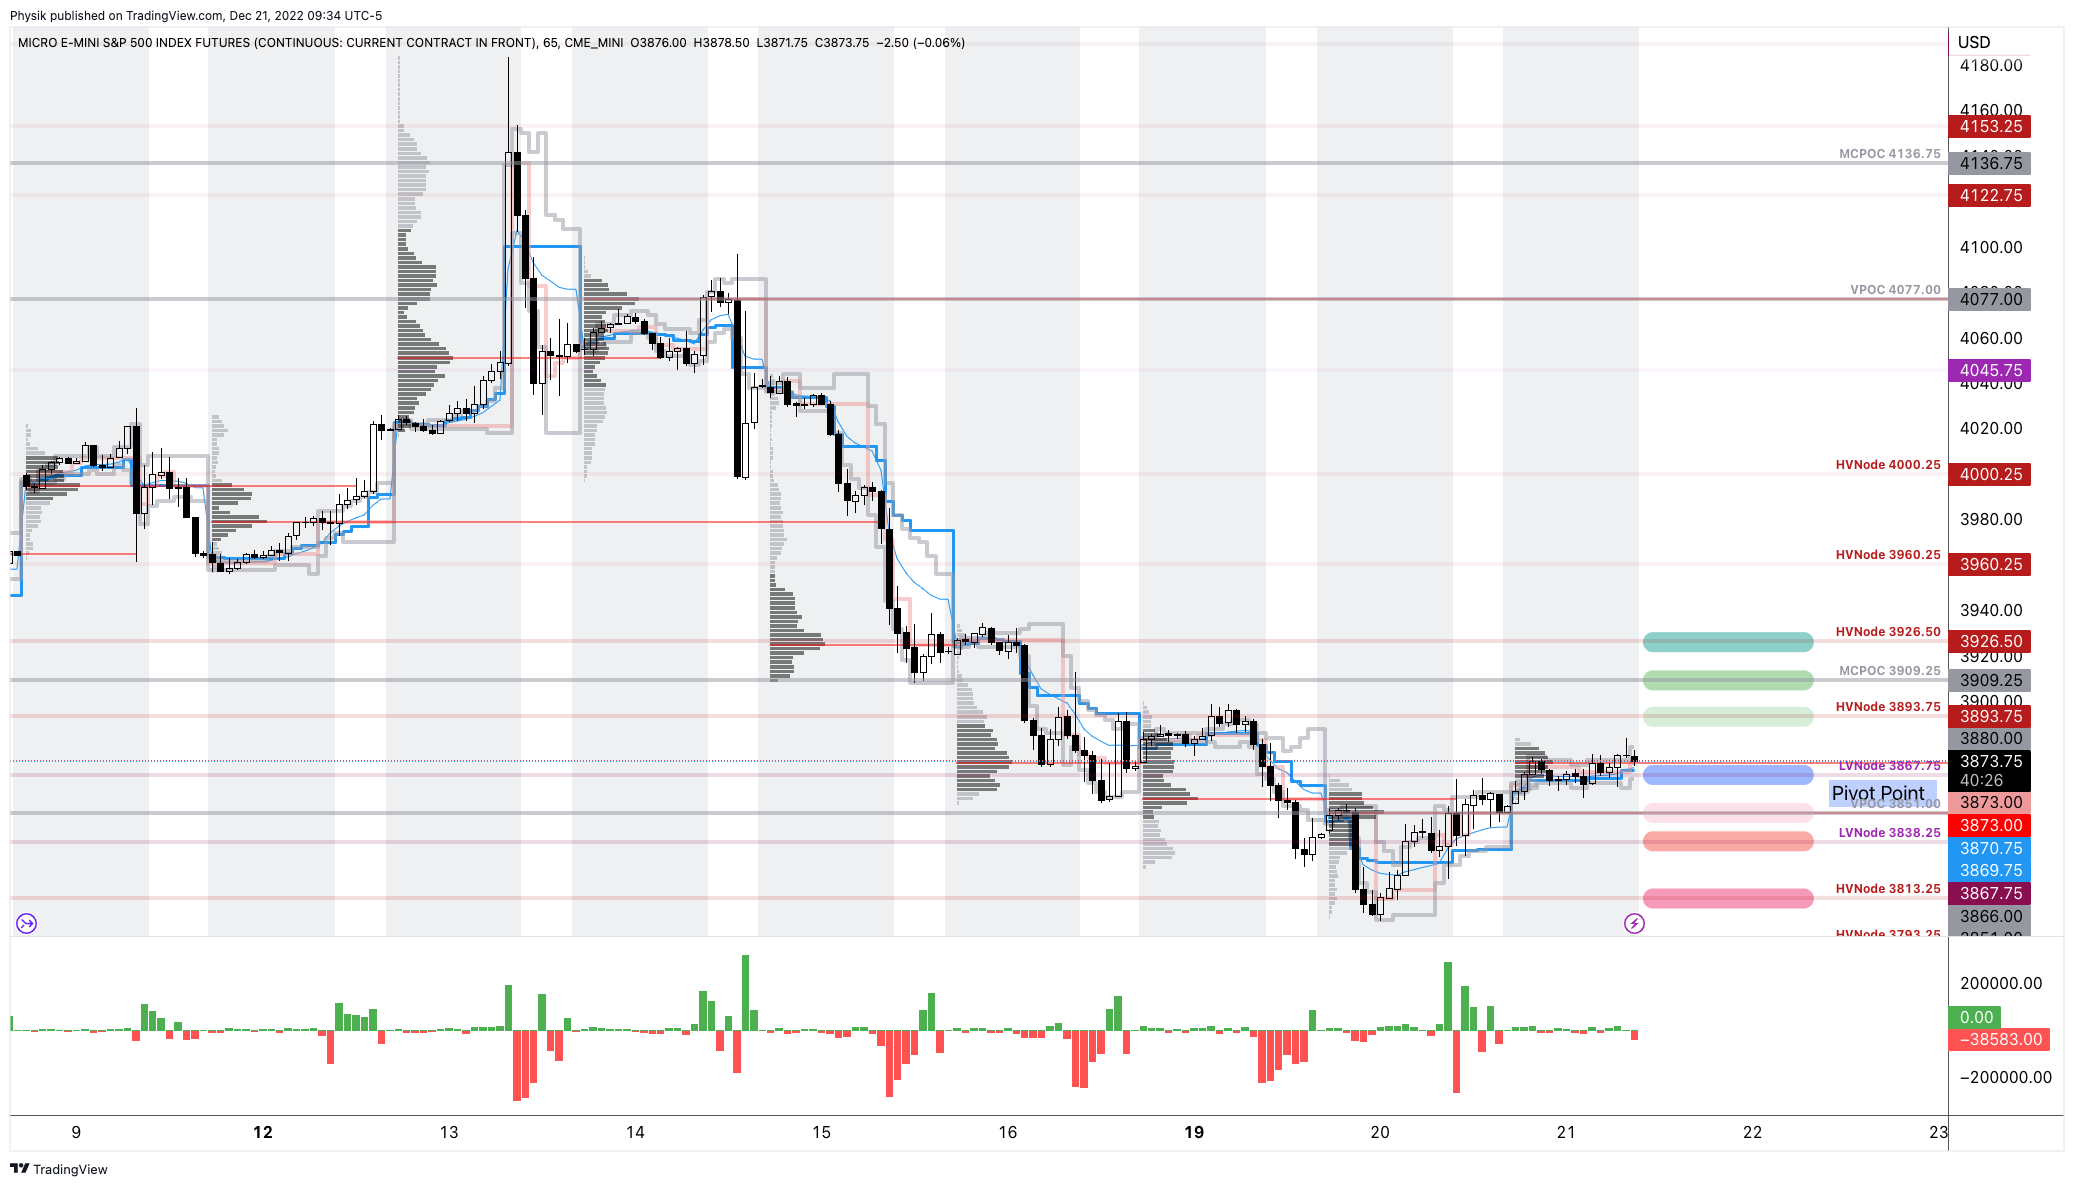
As of 6:30 AM ET, Wednesday’s regular session (9:30 AM – 4:00 PM ET), in the S&P 500, is likely to open in the middle part of a balanced overnight inventory, inside of prior-range and -value, suggesting a limited potential for immediate directional opportunity.
Our S&P 500 pivot for today is $3,857.00.
Key levels to the upside include $3,879.25, $3,893.75, and $3,908.25.
Key levels to the downside include $3,838.25, $3,813.25, and $3,793.25.
Click here to load today’s key levels into the web-based TradingView platform. All levels are derived using the 65-minute timeframe. New links are produced, daily.
Graphic: 65-minute profile chart of the Micro E-mini S&P 500 Futures.
Definitions
Volume Areas: Markets will build on areas of high-volume (HVNodes). Should the market trend for long periods of time, it will be identified by low-volume areas (LVNodes). LVNodes denote directional conviction and ought to offer support on any test.
If participants auction and find acceptance in an area of a prior LVNode, then future discovery ought to be volatile and quick as participants look to HVNodes for favorable entry or exit.
MCPOCs: Denote areas where two-sided trade was most prevalent over numerous sessions. Participants will respond to future tests of value as they offer favorable entry and exit.
About
In short, an economics graduate working in finance and journalism.
Capelj spends most of his time as the founder of Physik Invest through which he invests and publishes daily analyses to subscribers, some of whom represent well-known institutions.
Separately, Capelj is an equity options analyst at SpotGamma and an accredited journalist interviewing global leaders in business, government, and finance.
Physik Invest’s Daily Brief is read by thousands of subscribers. You, too, can join this community to learn about the fundamental and technical drivers of markets.
Graphic updated 9:35 AM ET. Sentiment Risk-On if expected /ES open is above the prior day’s range. /ES levels are derived from the profile graphic at the bottom of this letter. Levels may have changed since initially quoted; click here for the latest levels. SqueezeMetrics Dark Pool Index (DIX) and Gamma (GEX) with the latter calculated based on where the prior day’s reading falls with respect to the MAX and MIN of all occurrences available. A higher DIX is bullish. At the same time, the lower the GEX, the more (expected) volatility. Click to learn the implications of volatility, direction, and moneyness. Breadth reflects a reading of the prior day’s NYSE Advance/Decline indicator. VIX reflects a current reading of the CBOE Volatility Index (INDEX: VIX) from 0-100.
Positioning
Traders may have observed a unique market dynamic occurring in the past sessions.
In spite of a down S&P 500 (INDEX: SPX), fixed-strike and top-line implied volatility (IVOL) measures such as the Cboe Volatility Index (INDEX: VIX), are on a downward trajectory. Let’s unpack.
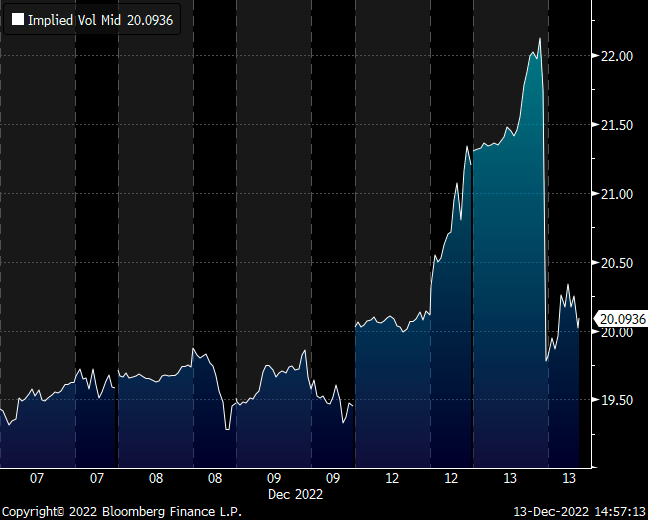
Heading into the December monthly options expiration (OPEX), traders were seeking to bet on and guard against large market movement. Traders’ demand for options, particularly those that are shorter-dated, bid IVOL markedly over the period running up to December OPEX.
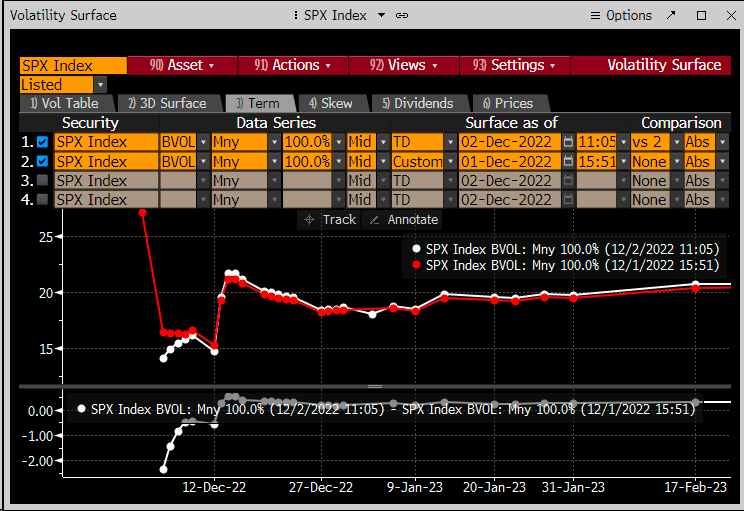
Graphic: Retrieved from Bloomberg via Michael Kramer. “No reason for the Cboe Volatility Index (INDEX: VIX) to rise when OPEX every day allows precision hedging.”
In fact, based on the pricing of options, the “consensus was a large right tail move in stocks,” SpotGamma explained in a recent note. Just look at the prices of options expiring December 15. There was a big premium in ultra-short-dated S&P 500 call options (left) versus puts (right).
Graphic: Retrieved by Physik Invest via the thinkorswim platform.
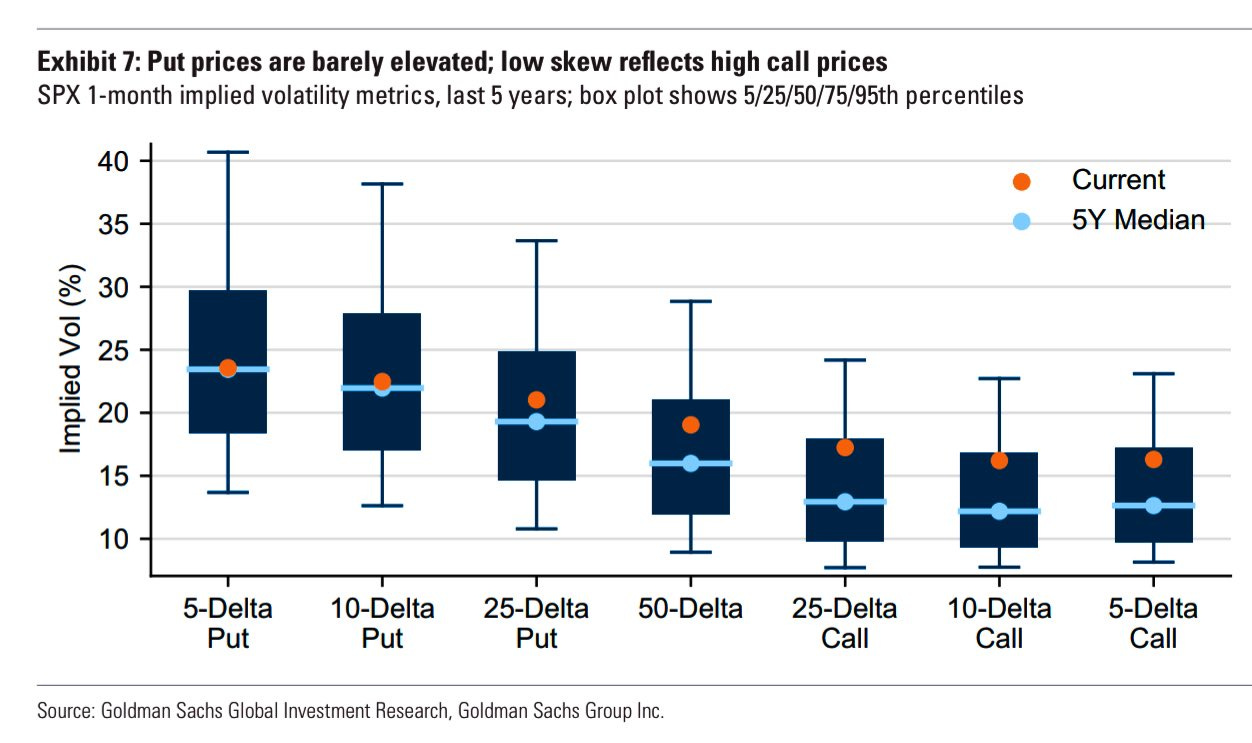
The same can be viewed via low volatility skew, in part the result of traders’ decreased interest in owning downside protection (as there is less reason to hold downside protection if you have sold your long stock and/or you have monetized existing protection during the 2022 decline).
Graphic: Retrieved from Goldman Sachs Group Inc (NYSE: GS).
Anyways, as a result, counterparties (i.e., those who supplied traders their positive exposure to movement) were left “short a massive amount of Gamma,” or negative exposure to movement, which often results in hedging that reduces market liquidity and fattens the tails of the potential distribution of returns (i.e., buying strength and selling weakness), Kai Volatility said in a letter; positioning boosted “crash risk” and the potential for “more melt-ups.”
A clear display of this was after the “CPI release on Tuesday … In a matter of hours, [the] market gapped up 4% [and] then gave it all back,” Kai Volatility said.
Graphic: Retrieved from Danny Kirsch of Piper Sandler Companies (NYSE: PIPR). S&P 500 (INDEX: SPX) January $4,100.00 call volatility down, while the market is up big, offsets rally.
To further explain, that is because short-dated options gain and lose value quickly given their increased sensitivity to changes in market movement (Gamma), as time passes. When the S&P 500 moved higher after CPI, call options gained a lot of value (Delta) very quickly. Those on the other side of that trade (i.e., counterparts), who had exposure to -Gamma or negative exposure to movement, went from having, for sake of brevity, very little -Delta to a lot of -Delta. Therefore, counterparts bought stock and futures (added +Delta) to hedge against an imbalance bolstering rapid up-market movement. When the short-dated exposure rolled off, these options risks were no longer there. Counterparts removed the +Delta they added (sold stock and futures back to the market) resulting in a move back down to where markets had started.
Moving on.
Following the events of last week, the absence of the unexpected (i.e., what traders sought to hedge and/or bet on), resulted in options selling (supply of protection), a pressure on options prices that remained through December’s large monthly OPEX.
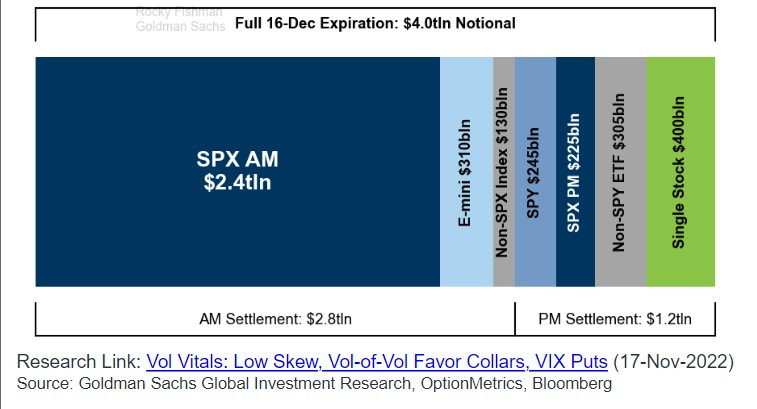
Graphic: Retrieved from Goldman Sachs Group Inc (NYSE: GS) via Bloomberg. OPEX removed open interest that was demanded at higher levels of IVOL and skew over the past three years, per Kai Volatility’s Cem Karsan. The associated compression of IVOL (Vanna flow) and the passage of time (Charm flow) you would expect to see this December period (i.e., bullish seasonality), coupled with a dash-for-cash and tax-loss selling seen following the calendar flip, was front-run creating the context for this market down, IVOL down environment.
These pressures are expected to last through January 10, as it’s easy to sell high IVOL likely to expire worthless (knowing there are good odds that nothing happens through the holidays), and own IVOL on the back of that period which is cheap.
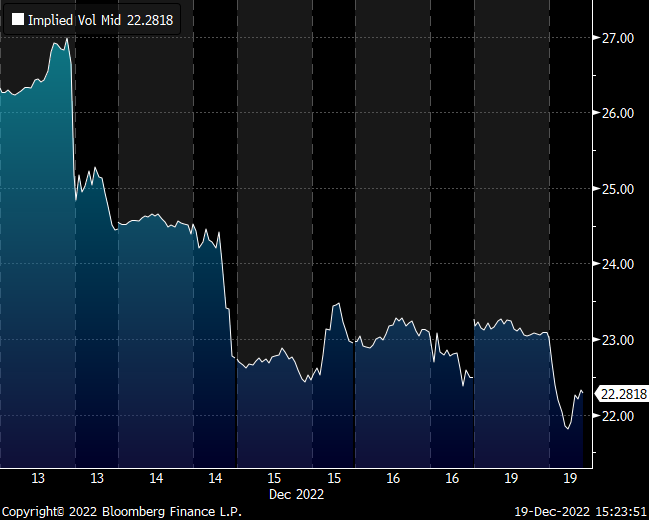
Graphic: Retrieved from Danny Kirsch of Piper Sandler Companies (NYSE: PIPR). S&P 500 (INDEX: SPX) January $3,800.00 put volatility down while the market is down.
As Karsan puts it, “you’ll have some moments of minor excitement but no crazy tails,” until the week of January 10 when we are more likely to “see a countertrend rally.”
Following this period, as far out as May, there is a seasonal effect in the volatility space that could set the stage for a sharp leg lower. More on this later.
Technical
As of 9:30 AM ET, Wednesday’s regular session (9:30 AM – 4:00 PM ET), in the S&P 500, is likely to open in the upper part of a positively skewed overnight inventory, outside of prior-range and -value, suggesting a potential for immediate directional opportunity.
Our S&P 500 pivot for today is $3,867.75.
Key levels to the upside include $3,893.75, $3,909.25, and $3,926.50.
Key levels to the downside include $3,851.00, $3,838.25, and $3,813.25.
Click here to load today’s key levels into the web-based TradingView platform. All levels are derived using the 65-minute timeframe. New links are produced, daily.
Graphic: 65-minute profile chart of the Micro E-mini S&P 500 Futures.
Definitions
Volume Areas: Markets will build on areas of high-volume (HVNodes). Should the market trend for long periods of time, it will be identified by low-volume areas (LVNodes). LVNodes denote directional conviction and ought to offer support on any test.
If participants auction and find acceptance in an area of a prior LVNode, then future discovery ought to be volatile and quick as participants look to HVNodes for favorable entry or exit.
POCs: Denote areas where two-sided trade was most prevalent in a prior day session. Participants will respond to future tests of value as they offer favorable entry and exit.
About
In short, an economics graduate working in finance and journalism.
Capelj spends most of his time as the founder of Physik Invest through which he invests and publishes daily analyses to subscribers, some of whom represent well-known institutions.
Separately, Capelj is an equity options analyst at SpotGamma and an accredited journalist interviewing global leaders in business, government, and finance.
Editor’s Note: The Daily Brief is a free glimpse into the prevailing fundamental and technical drivers of U.S. equity market products. Join the 200+ that read this report daily, below!
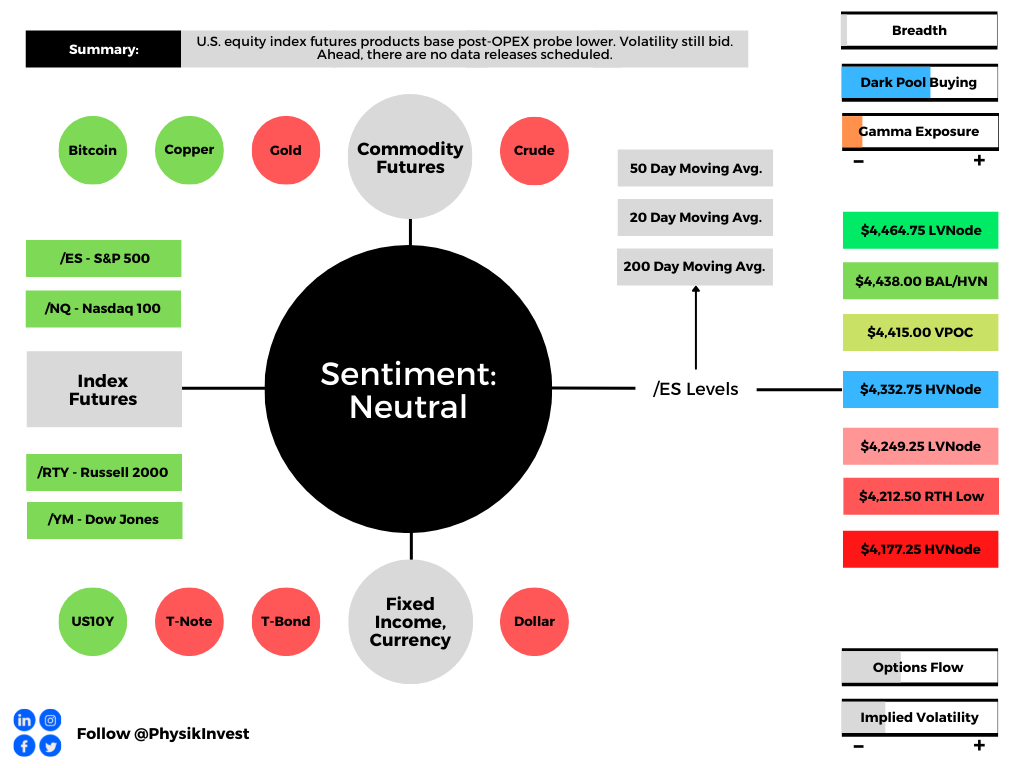
Overnight, equity index futures traded sideways to higher after Monday’s post-options expiration (OPEX) probe lower. Ahead, there are no data releases scheduled.
Graphic updated 6:15 AM ET. Sentiment Neutral if expected /ES open is inside of the prior day’s range. /ES levels are derived from the profile graphic at the bottom of the following section. Levels may have changed since initially quoted; click here for the latest levels. SqueezeMetrics Dark Pool Index (DIX) and Gamma (GEX) calculations are based on where the prior day’s reading falls with respect to the MAX and MIN of all occurrences available. A higher DIX is bullish. At the same time, the lower the GEX, the more (expected) volatility. Learn the implications of volatility, direction, and moneyness. SHIFT data used for S&P 500 (INDEX: SPX) options activity. Note that options flow is sorted by the call premium spent; if more positive, then more was spent on call options. Breadth reflects a reading of the prior day’s NYSE Advance/Decline indicator. VIX reflects a current reading of the CBOE Volatility Index (INDEX: VIX) from 0-100.
What To Expect
Fundamental: At what point are monetary tightening and geopolitical tensions priced in?
According to some strategists, such as JPMorgan Chase & Co’s (NYSE: JPM) Marko Kolanovic, the sell-off is overdone and, if anything, Ukraine tensions “would likely prompt a dovish reassessment.”
“Short-term rates markets have likely moved too far vs. what CBs will ultimately deliver in hikes this year,” he adds. “We expect risky asset markets to rebound as they digest these risks and sentiment improves, aided by inflows from systematic investors and corporate buybacks.”
In the worst case, though, pursuant to notes by peers in the industry, Kolanovic nods to the fact that if selling were to continue, there would likely be a point the would Fed reassess tightening.
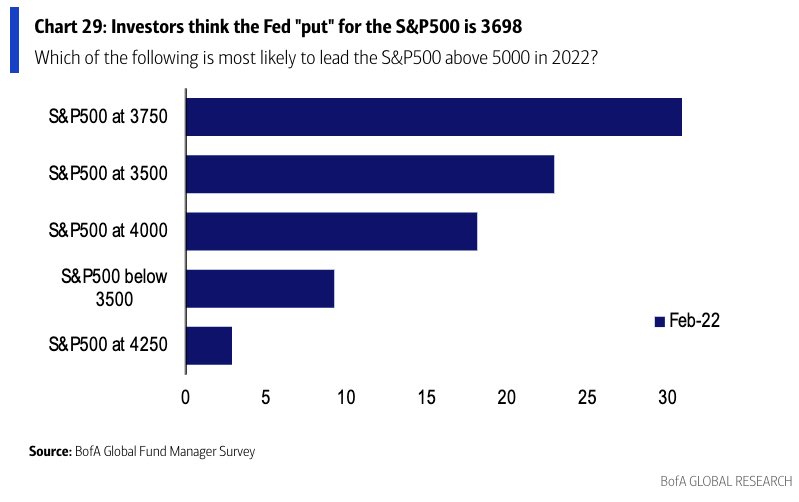
Basically, in the worst case, there is the potential that further selling invokes the so-called “Fed put,” which is about 15% below current prices.
“[R]isk is being repriced to fit the world where real rates are a lot higher, and the Fed put (is) much lower thanks to the Fed’s need to fight inflation,” says rates strategist Rishi Mishra.
Graphic: Via Bank of America Corporation (NYSE: BAC). Retrieved from Callum Thomas.
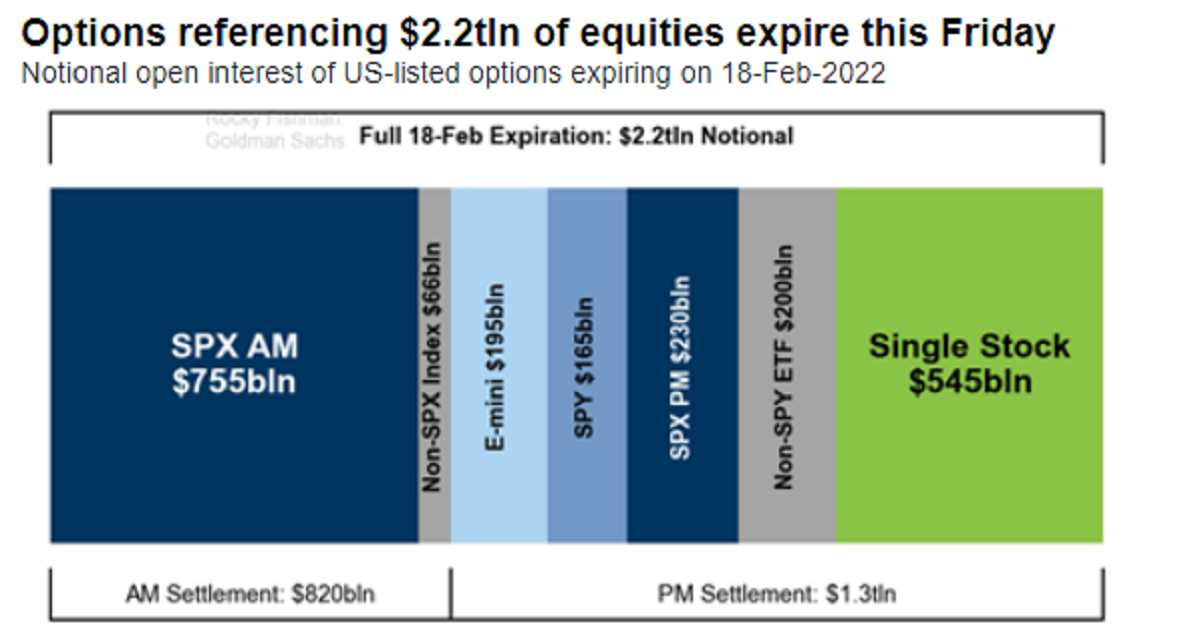
Positioning: Markets stabilize after last week’s large monthly options expiration (OPEX).
Graphic: Via Goldman Sachs Group Inc (NYSE: GS). Taken from Bloomberg.
Per Bloomberg, that event saw the roll-off of nearly $2.2 trillion in options. In the past, this event had bullish implications (i.e., markets rose into OPEX). That is not the case, really, any longer.
It is participants’ increased awareness of the implications of options and OPEX has resulted in a front running; according to SqueezeMetrics, “People didn’t know about the OpEx week effect (in this case, largely charm). Now everyone and their mother knows about it.”
For context, charm is a measure of an options delta’s change with respect to the passage of time. As time passes, delta “bleeds” as options decay.
As most participants, at least at the index level, own protection, the counterparties to this trade are short protection. These counterparties, therefore, have positive exposure to delta (i.e., as index falls [rises], position loses [makes] money) and negative exposure to gamma, or delta (directional) sensitivity to underlying price changes (i.e., as the index moves against short option exposure, losses are multiplied).
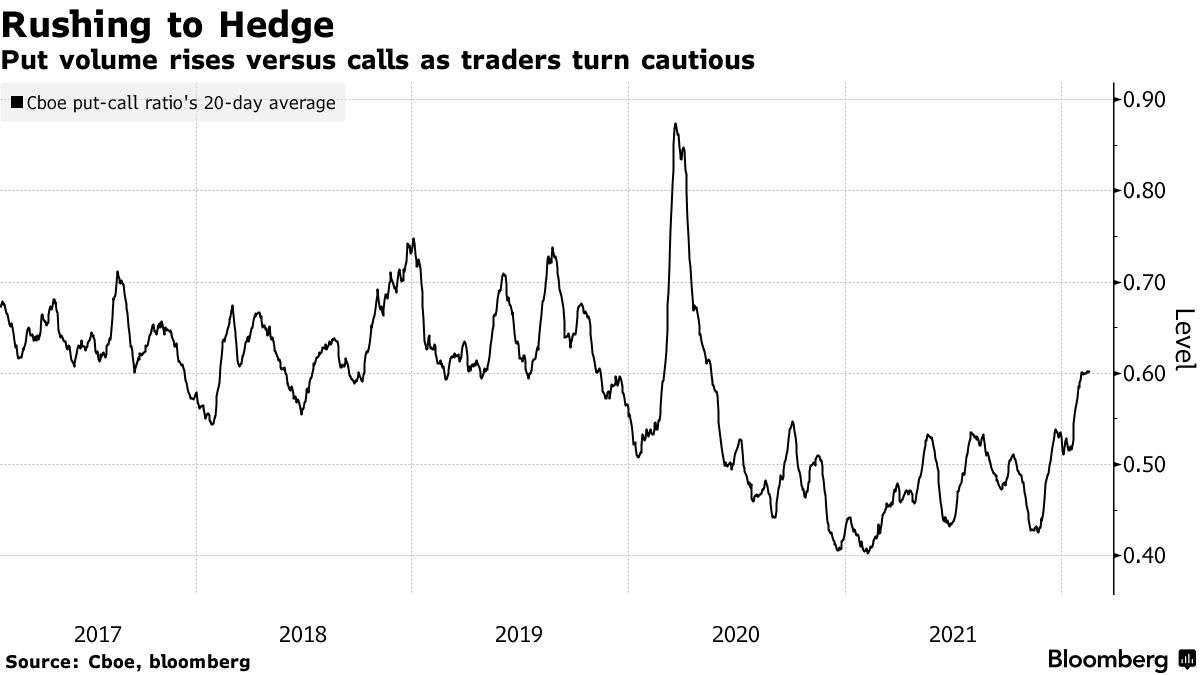
Moreover, given the growth of options volumes, participants’ heavy demand for protection matters more, to put simply. Counterparties, in light of this recent drop, pressured markets with their hedging. The decay (and eventual expiry) of this protection marks options deltas down.
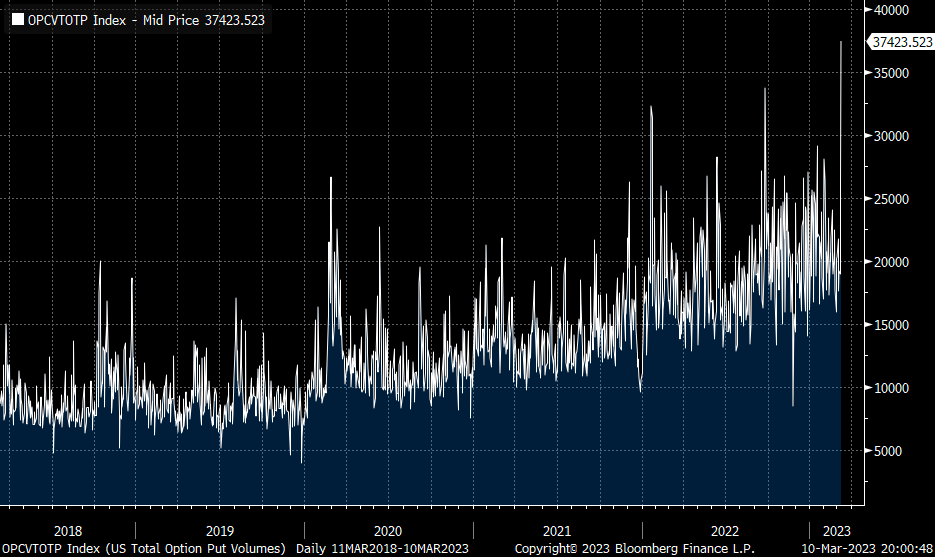
Graphic: Rising put volumes coincide with early 2022 market sell-off.
To re-hedge, counterparties buy back short stock and futures hedges. This supportive action is what has been front-run; the bullishness of the event happens days and weeks prior.
The unwind of these hedges now, as seen Friday-Tuesday, often culminates in a post-OPEX low. That “means chase-y accelerant flows from dealer hedging into moves and creating overshoots in both directions,” Nomura Holdings Inc’s (NYSE: NMR) Charlie McElligott wrote.
Taken together, according to SpotGamma, though “post-OPEX, the removal of linear short (-delta) hedges [to put-heavy exposures] may further bolster attempts higher, … [t]he removal of downside (put) protection may also open the door for weakness in a case where some outside (fundamental) event solicits real-money selling and a new demand for protection.”
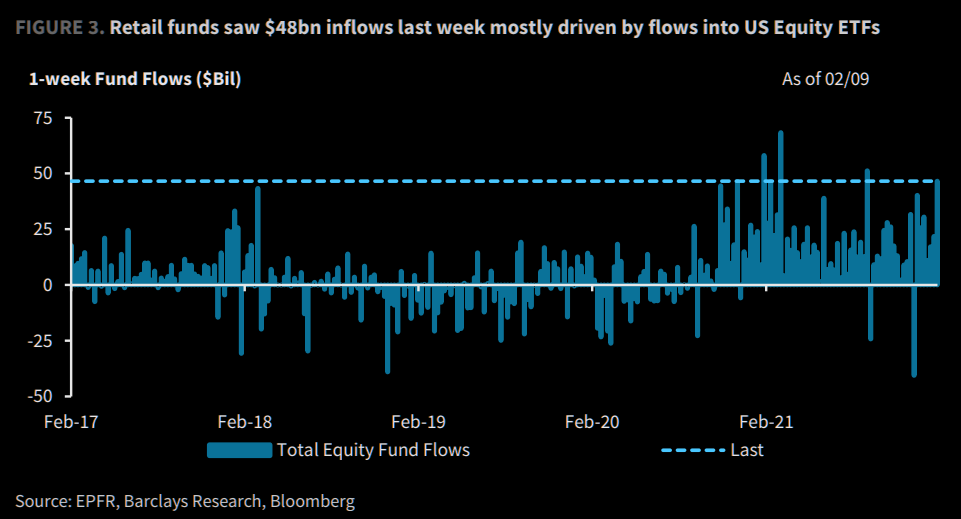
Graphic: Via EPFR, Barclays, and Bloomberg. Taken from The Market Ear.
“The market looks fairly well hedged and it’s why up until today we’ve had little follow-through on the downside despite negative headlines,” Danny Kirsch, head of options at Piper Sandler Companies (NYSE: PIPR), said in an interview.
“We’ll see if things open up after the February expiry.”
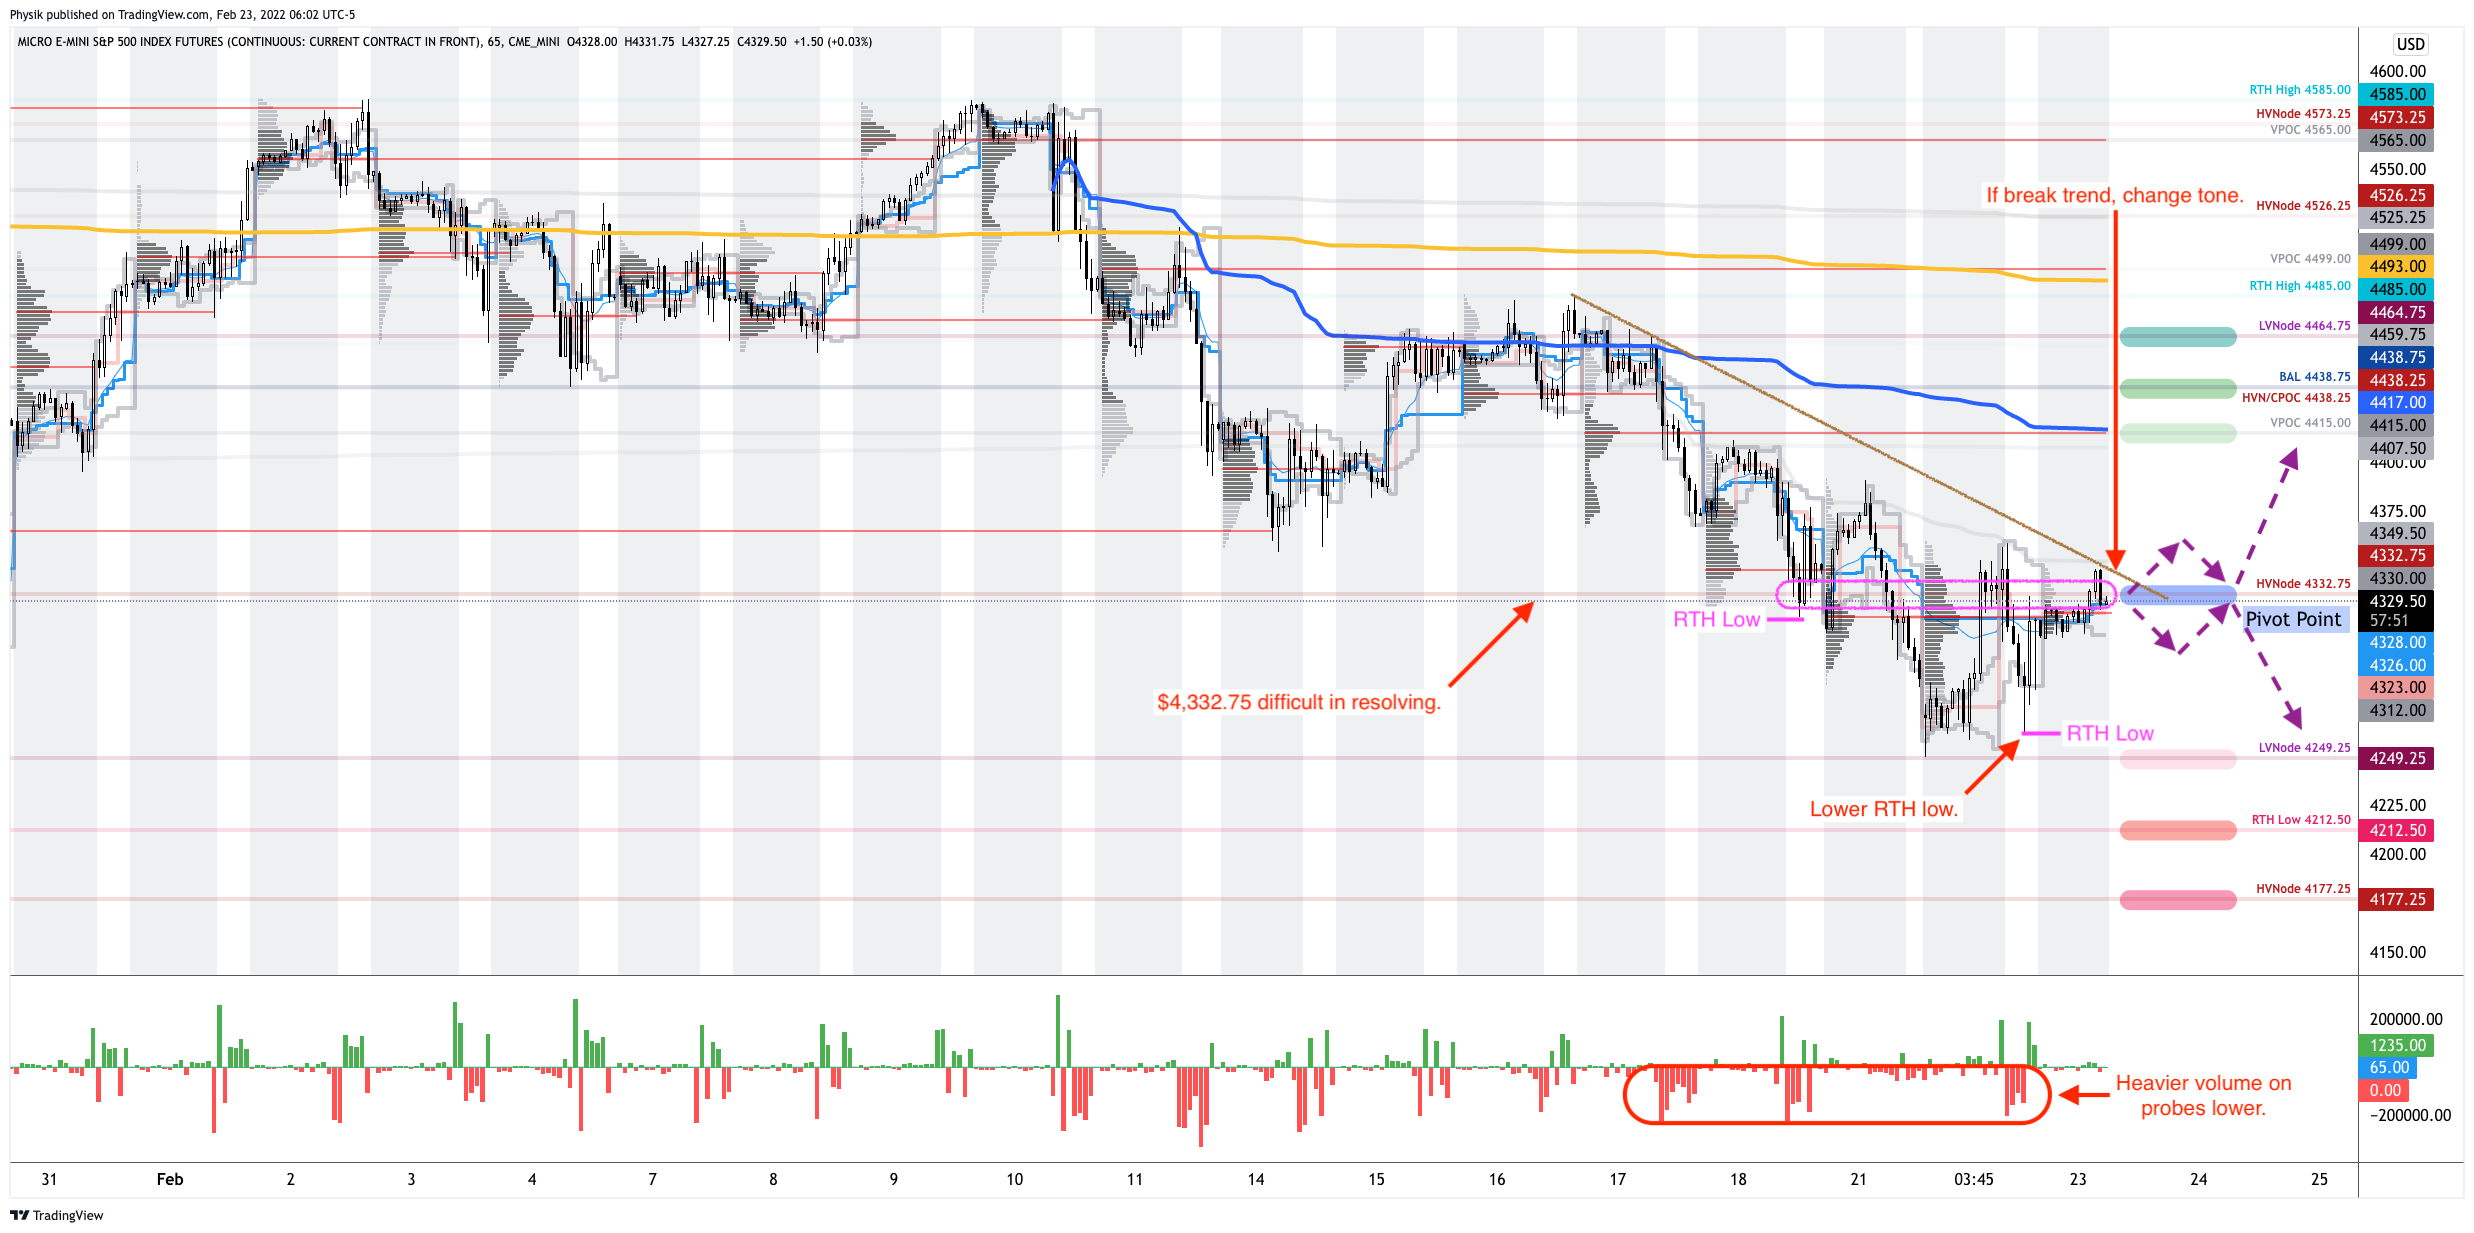
Technical: As of 6:30 AM ET, Wednesday’s regular session (9:30 AM – 4:00 PM ET), in the S&P 500, will likely open in the upper part of its overnight inventory, inside of prior-range and -value, suggesting a limited potential for immediate directional opportunity.
In the best case, the S&P 500 trades higher; activity above the $4,332.75 high volume area (HVNode) puts in play the $4,415.00 untested point of control (VPOC). Initiative trade beyond the VPOC could reach as high as the $4,438.00 key response area and $4,464.00 low volume area (LVNode), or higher.
In the worst case, the S&P 500 trades lower; activity below the $4,332.75 HVNode puts in play the $4,249.00 LVNode. Initiative trade beyond the LVNode could reach as low as the $4,212.50 regular trade low (RTH Low) and $4,177.25 HVNode, or lower.
Click here to load today’s key levels into the web-based TradingView charting platform. Note that all levels are derived using the 65-minute timeframe. New links are produced, daily.
Graphic: 65-minute profile chart of the Micro E-mini S&P 500 Futures.
What People Are Saying
Seriously, guys.
The ''bad news = good news'' narrative for markets doesn't work if the Fed is tightening amidst a slowdown and a military escalation risk.
Volume Areas: A structurally sound market will build on areas of high volume (HVNodes). Should the market trend for long periods of time, it will lack sound structure, identified as low volume areas (LVNodes). LVNodes denote directional conviction and ought to offer support on any test.
If participants were to auction and find acceptance into areas of prior low volume (LVNodes), then future discovery ought to be volatile and quick as participants look to HVNodes for favorable entry or exit.
Liquidation Breaks: The profile shape suggests participants were “too” long and had poor
Vanna: The rate at which the delta of an option changes with respect to volatility.
Charm: The rate at which the delta of an option changes with respect to time.
Options: If an option buyer was short (long) stock, he or she would buy a call (put) to hedge upside (downside) exposure. Option buyers can also use options as an efficient way to gain directional exposure.
POCs: POCs are valuable as they denote areas where two-sided trade was most prevalent in a prior day session. Participants will respond to future tests of value as they offer favorable entry and exit.
About
After years of self-education, strategy development, mentorship, and trial-and-error, Renato Leonard Capelj began trading full-time and founded Physik Invest to detail his methods, research, and performance in the markets.
Capelj is also a Benzinga finance and technology reporter interviewing the likes of Shark Tank’s Kevin O’Leary, JC2 Ventures’ John Chambers, FTX’s Sam Bankman-Fried, and ARK Invest’s Catherine Wood, as well as a SpotGamma contributor developing insights around impactful options market dynamics.
Disclaimer
Physik Invest does not carry the right to provide advice.
In no way should the materials herein be construed as advice. Derivatives carry a substantial risk of loss. All content is for informational purposes only.