What Happened
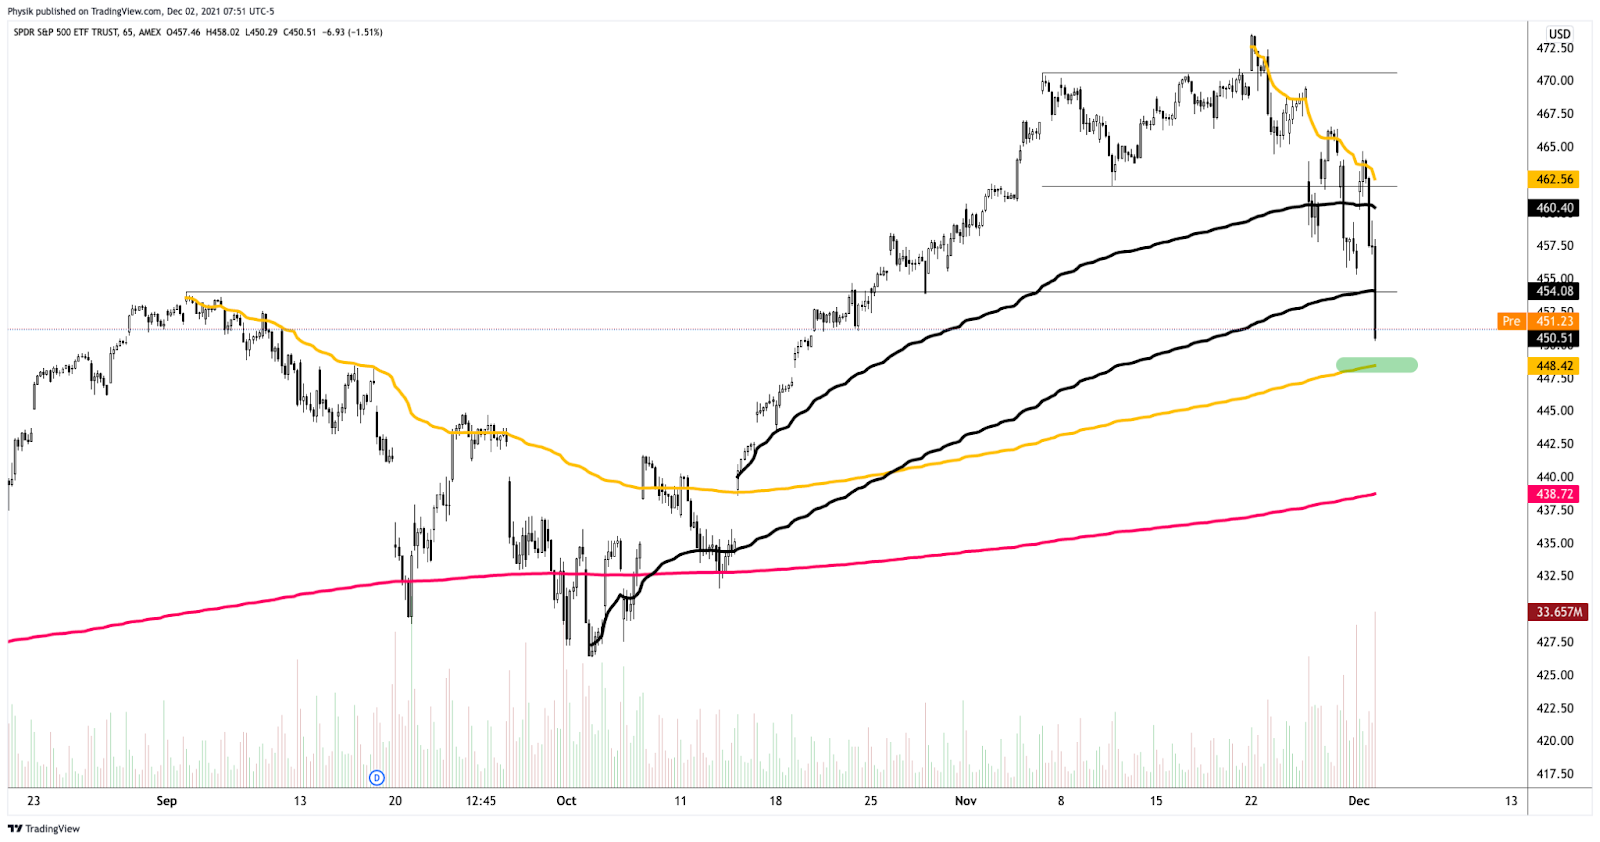
Equity index futures are lower after Monday’s failed balance-area breakout in the S&P 500 had that index rotate to and through the opposite end of a multi-day consolidation, yesterday.
This trade is in the face of expectations the Federal Reserve (Fed) will accelerate the taper to bond-buying, clearing the way for interest-rate hikes.
Rising rates, among other factors, have the potential to decrease the present value of future earnings, thereby making stocks, especially those that are high growth, less attractive.
The ruling narrative, so to speak, has resulted in the selling of expensive areas of the market.
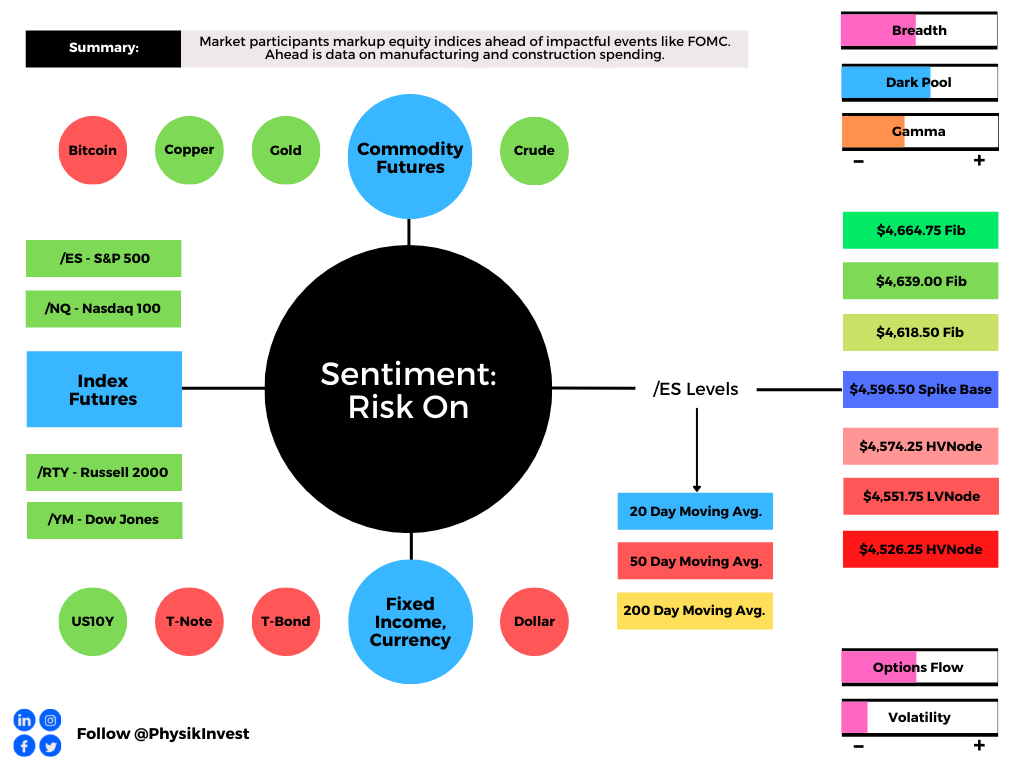
Ahead is retail sales, import prices, and Empire State Manufacturing Index (8:30 AM ET) data.
Then there are releases on the NAHB Home Builders’ Index, business inventories, inventory-sales ratio (10:00 AM ET). Later is a Federal Open Market Committee (FOMC) announcement (2:00 PM ET) and press conference (2:30 PM ET).
What To Expect
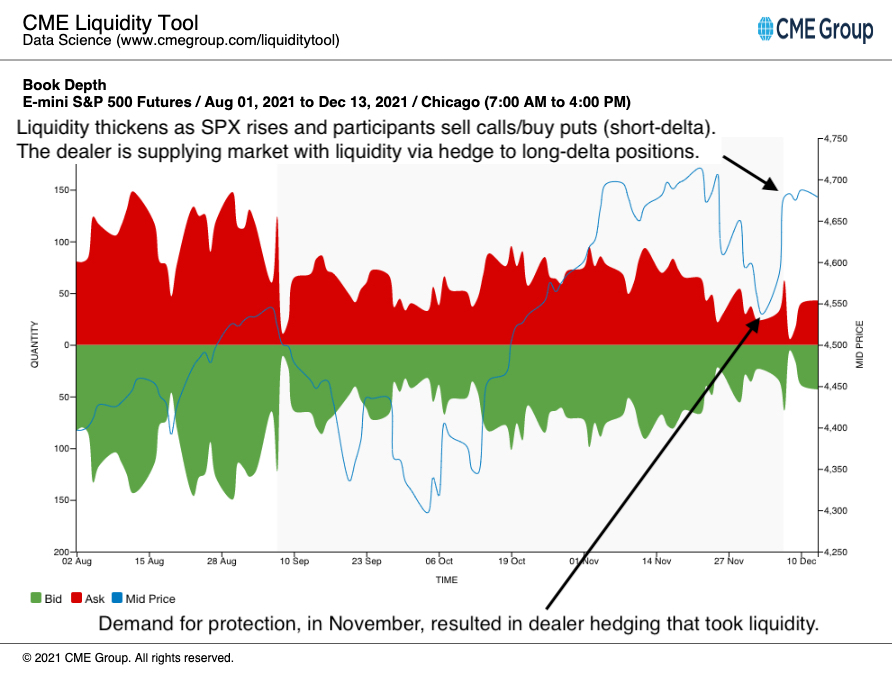
According to SpotGamma, into this week, participants had been increasing their short-delta exposure (via a lot of call selling and a bit of put buying).
This resulted in dealers selling (buying) futures into strength (weakness), a dynamic that promotes consolidation.
Later, as participants positioned for the FOMC event, demand for protection expanded and the S&P 500 made it to and through the low-end of the consolidation against the $4,700.00 high activity options strike.
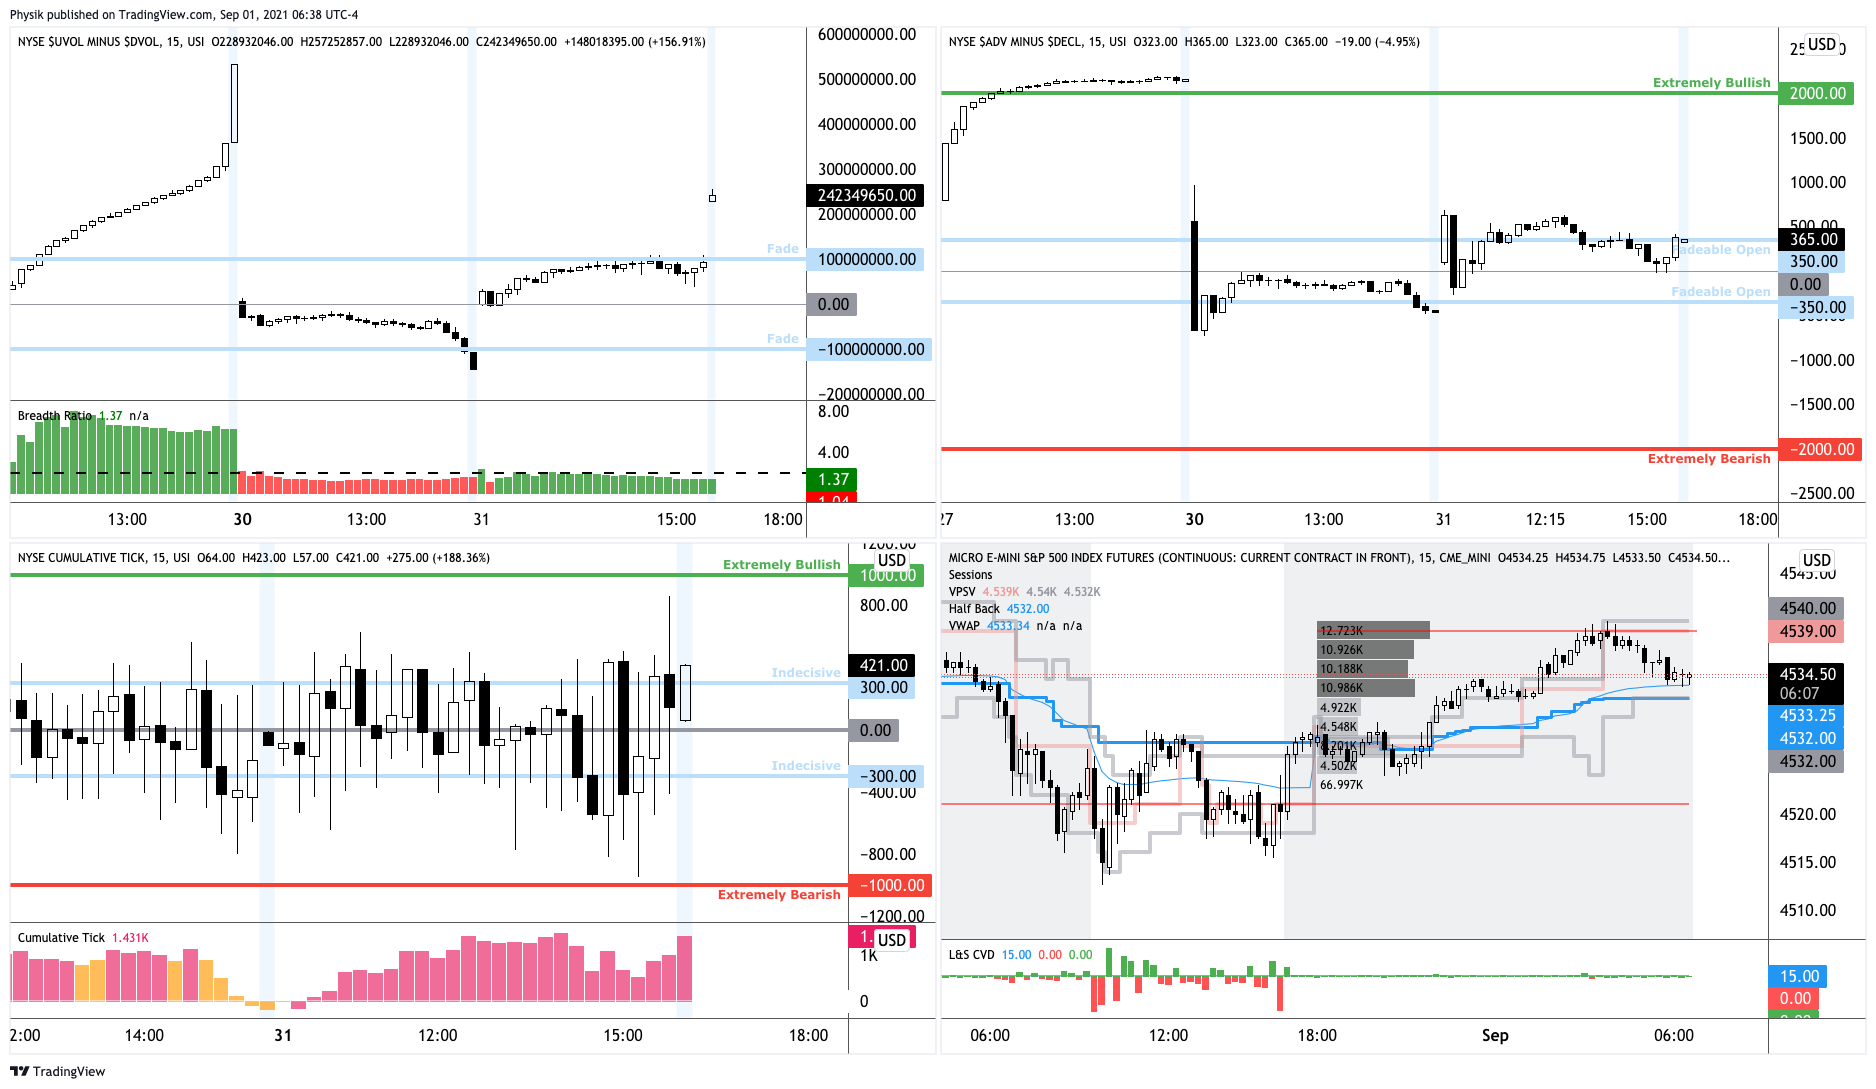
The trade built out areas of high volume (HVNode) via the cave-fill process in locations where prior discovery left weak structure – gaps and p-shaped emotional, multiple distribution profile structures (i.e., old-money covering shorts).
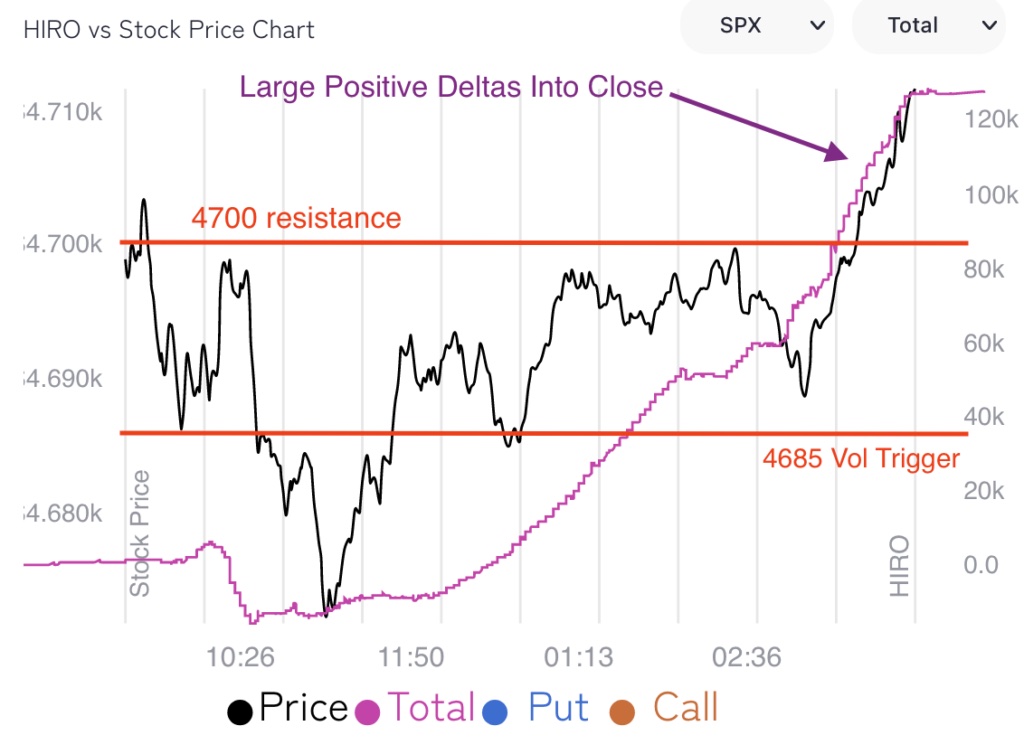
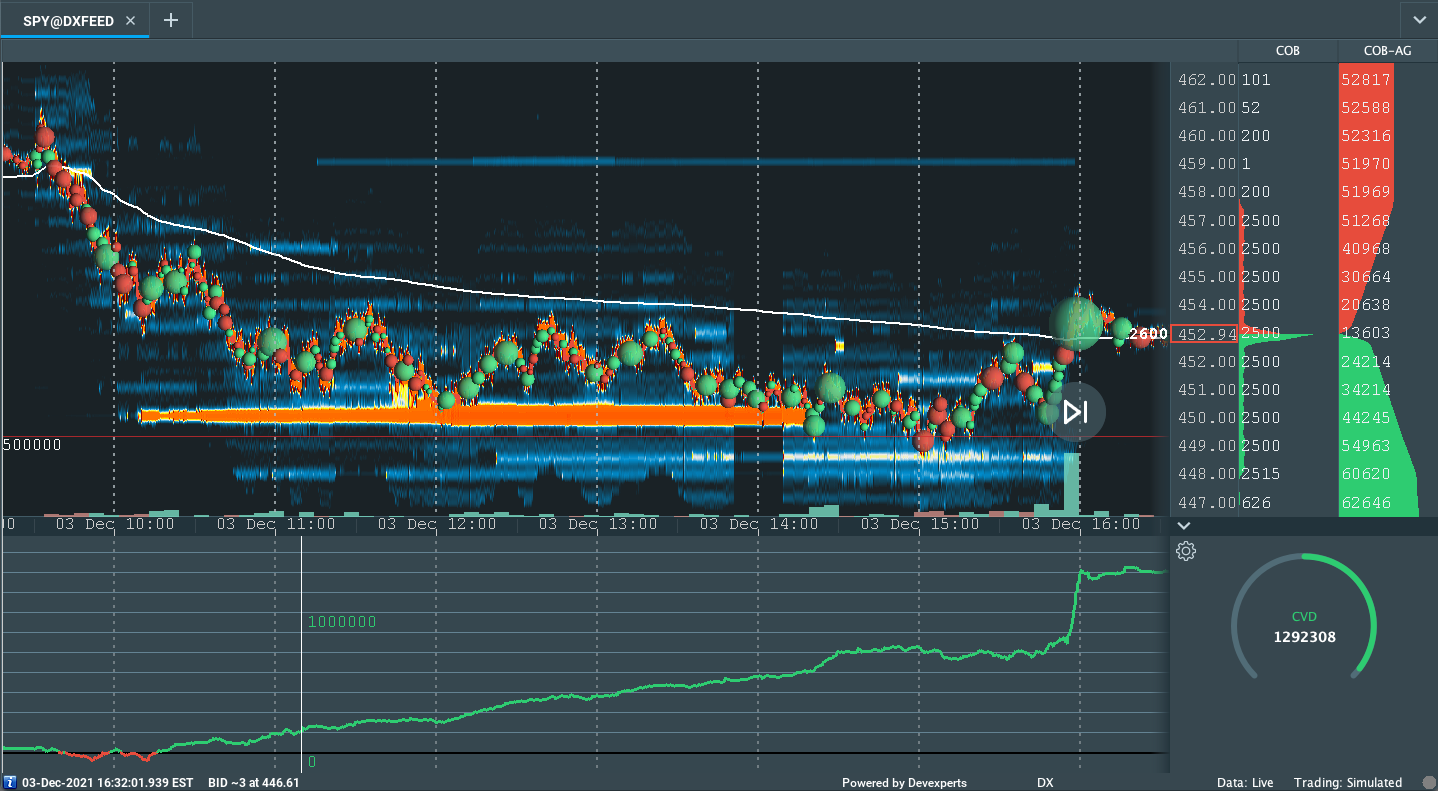
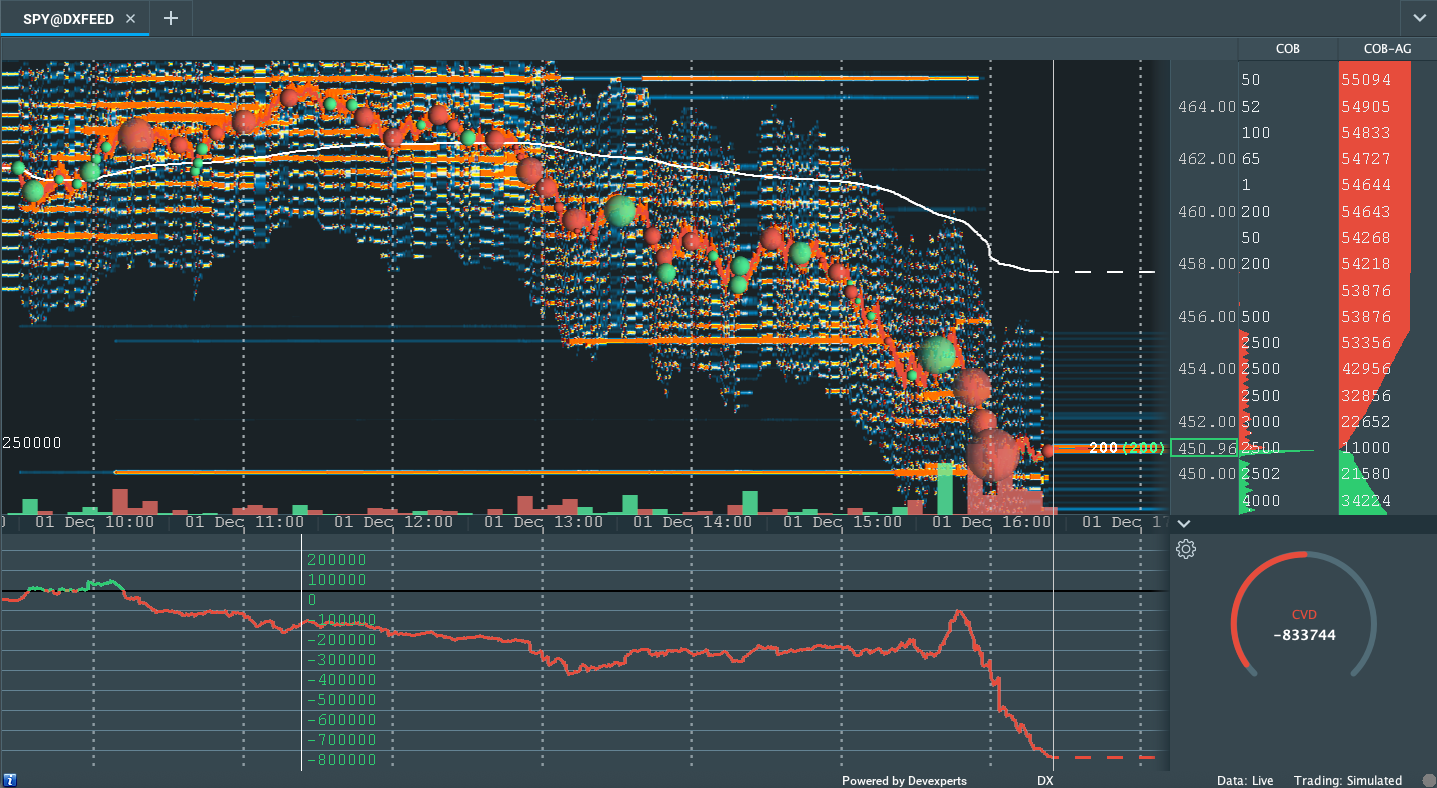
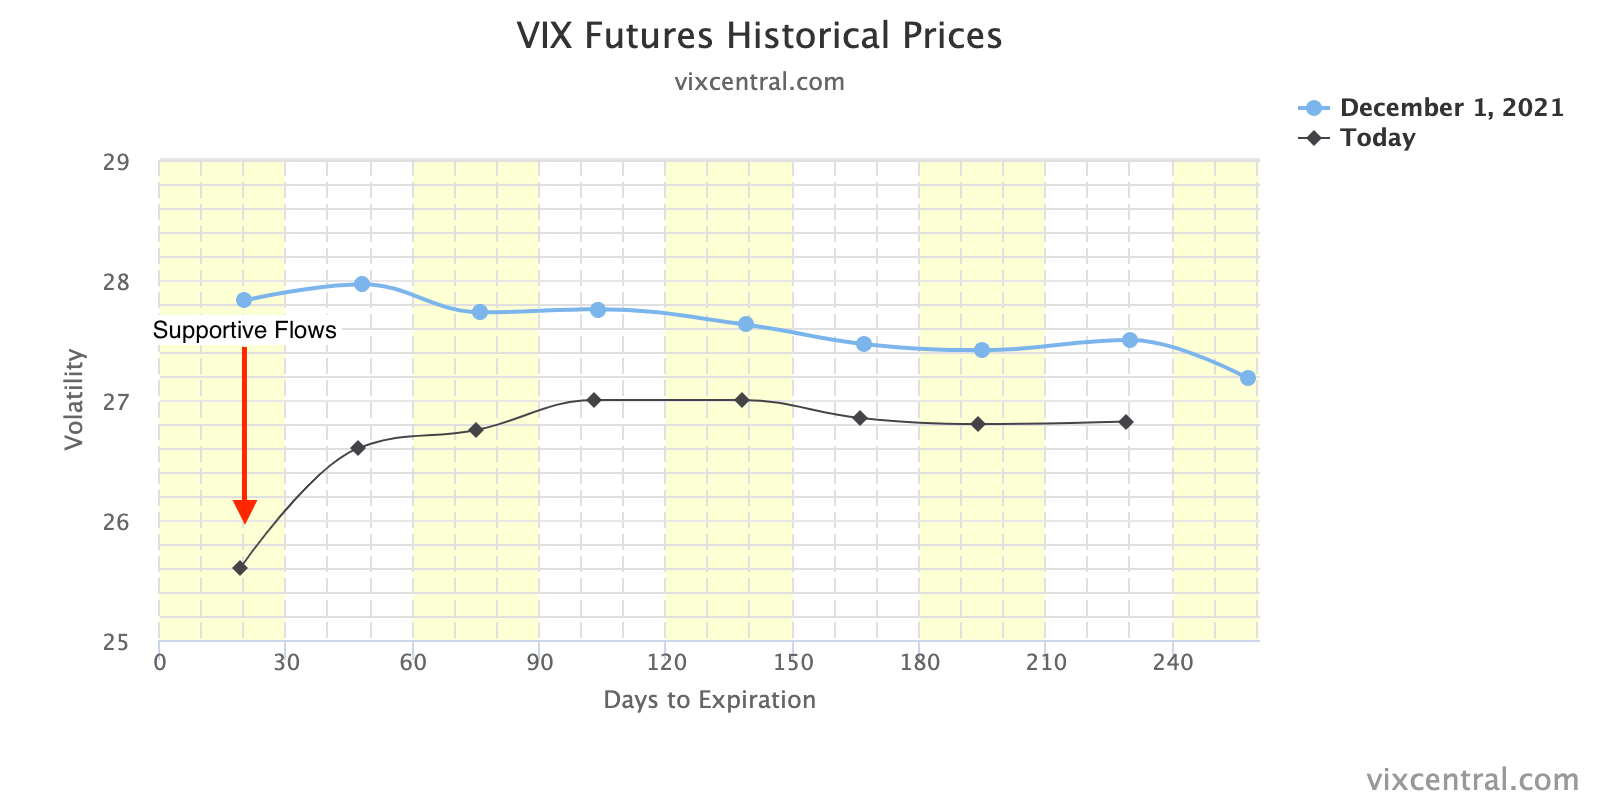
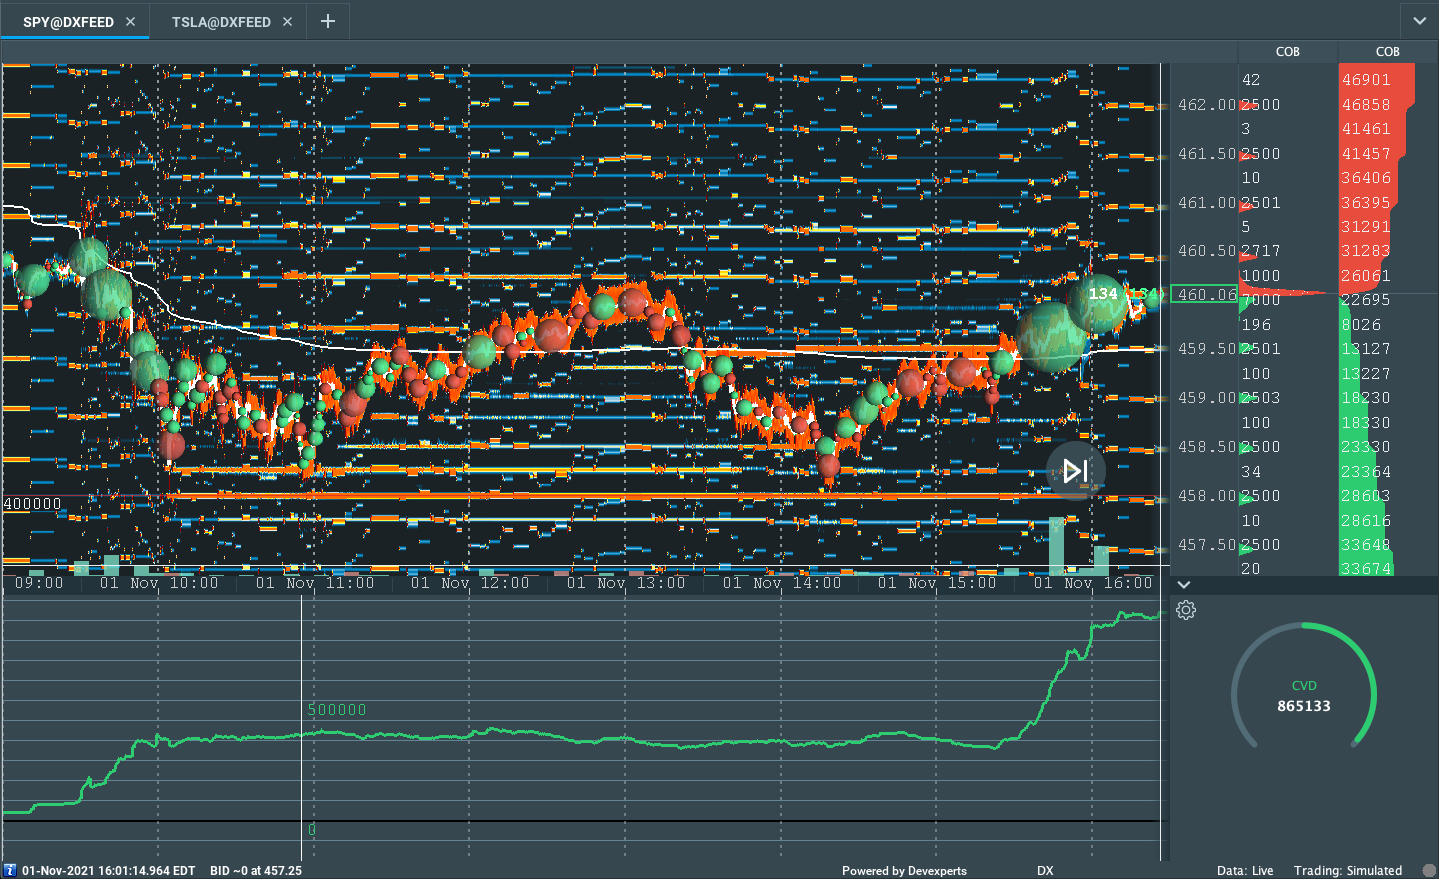
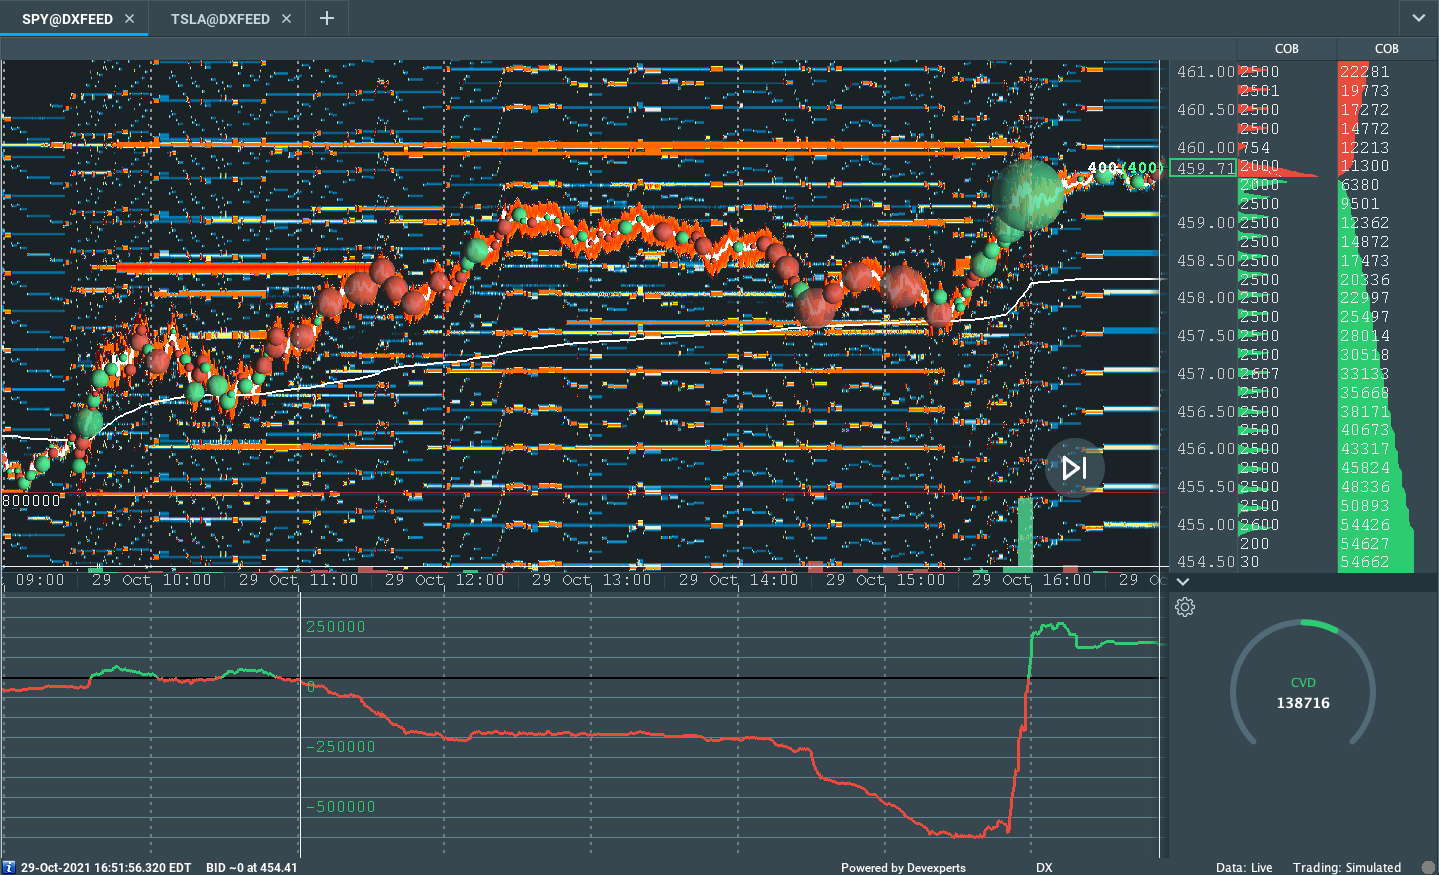
As evidenced by the divergent delta, below, responsive buyers surfaced at a key volume-weighted average price (VWAP) level (near $4,600.00 S&P 500), at which liquidity algorithms are benchmarked and programmed to buy and sell.
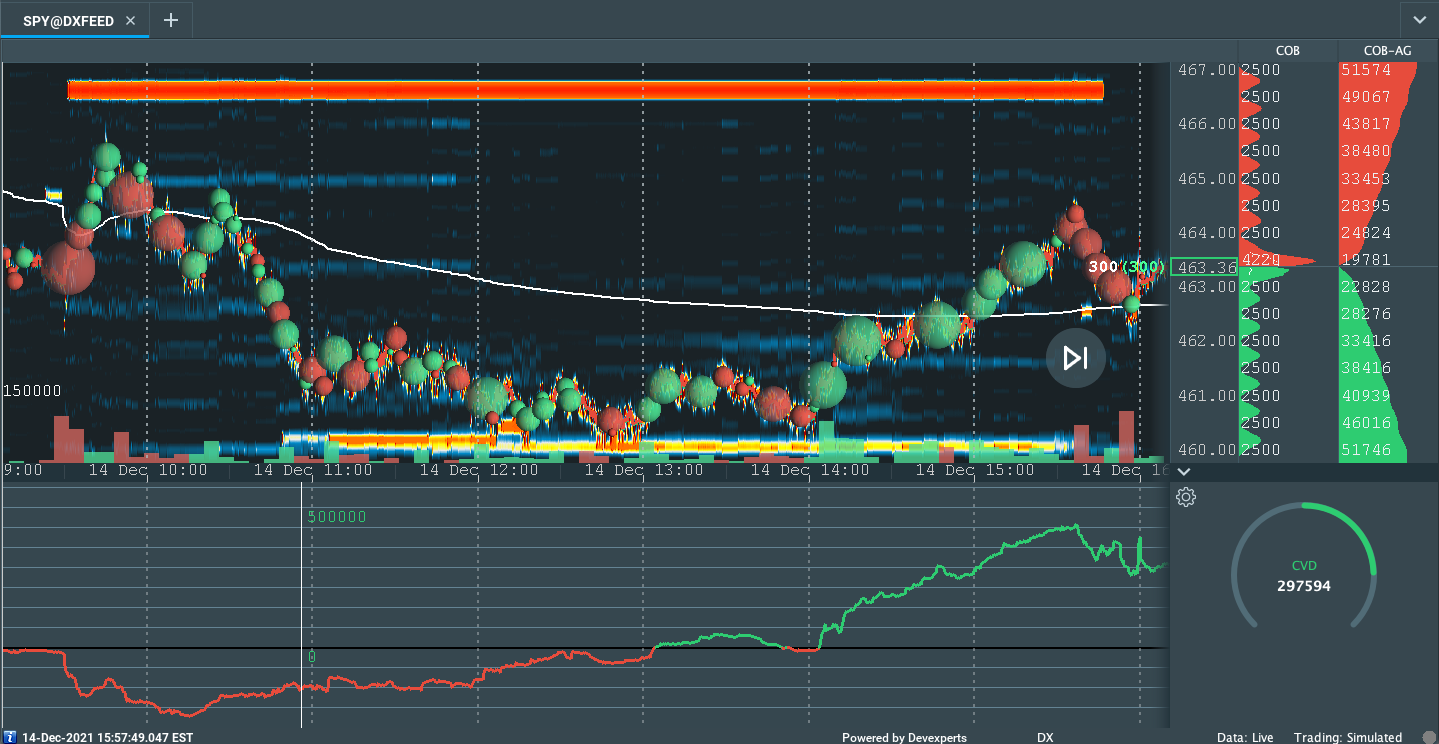
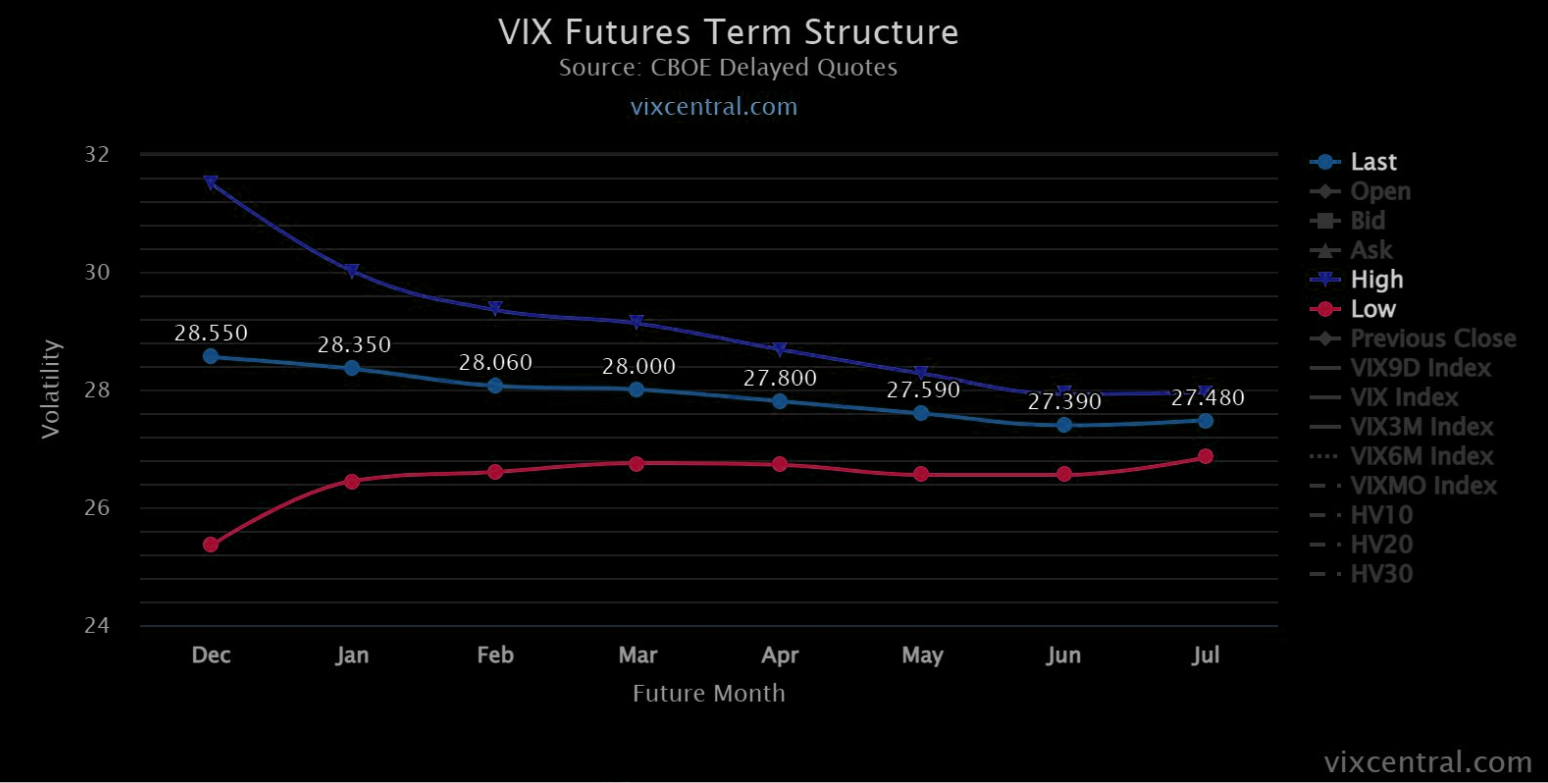
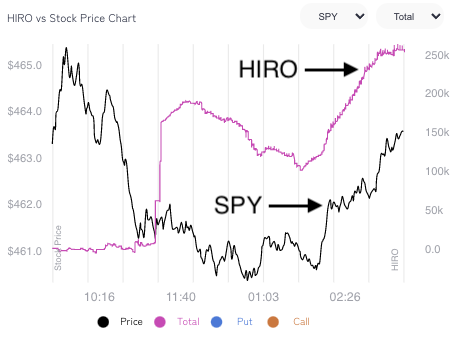
At the same time, as SpotGamma (beta) Hedging Impact of Real-Time Options (HIRO) indicator suggested “participants saw lower prices as an opportunity to express their opinion of lower volatility into Wednesday’s Federal Open Market Committee (FOMC) update.”
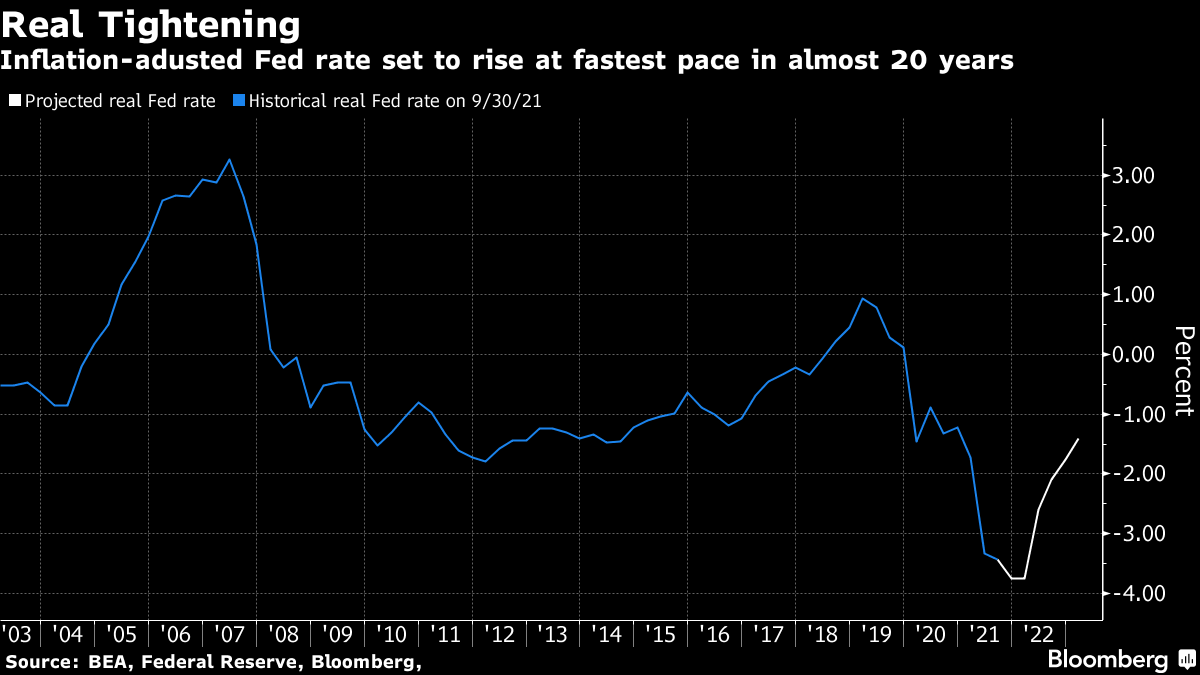
Context: Today, we get clarity from the Fed.
The expectation is that the asset purchases are scaled back by $30 billion per month versus the expected $15 billion. In doubling the pace of the taper to bond-buying, the odds of earlier rate hikes increase markedly.
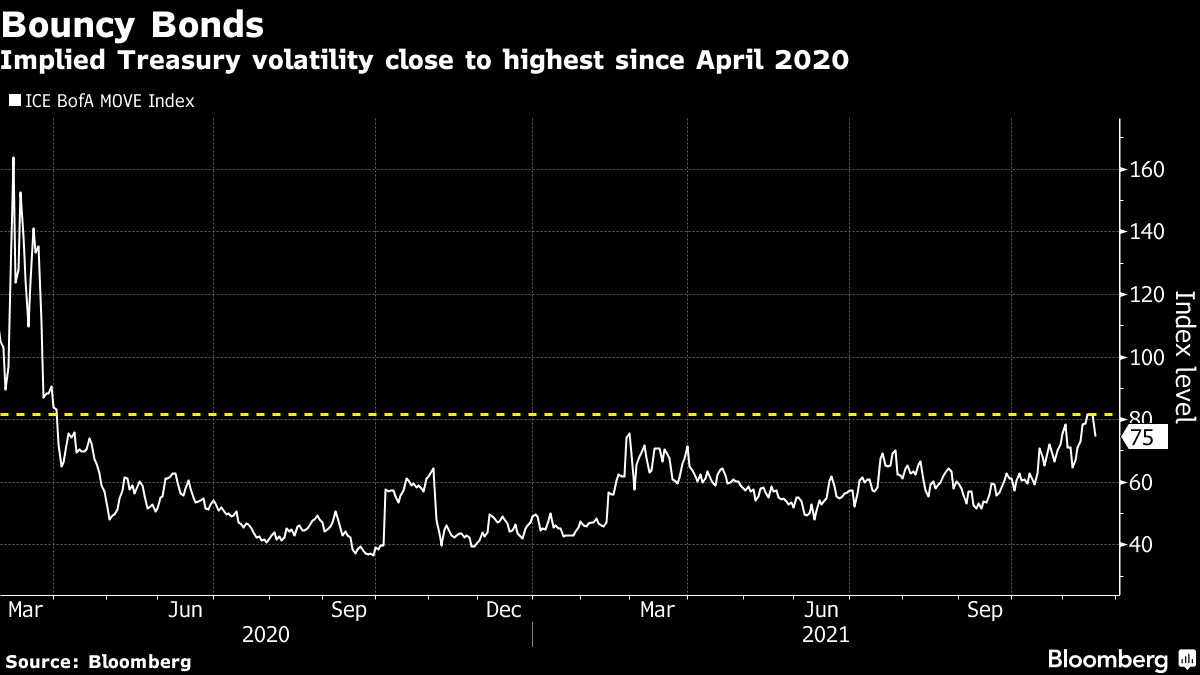
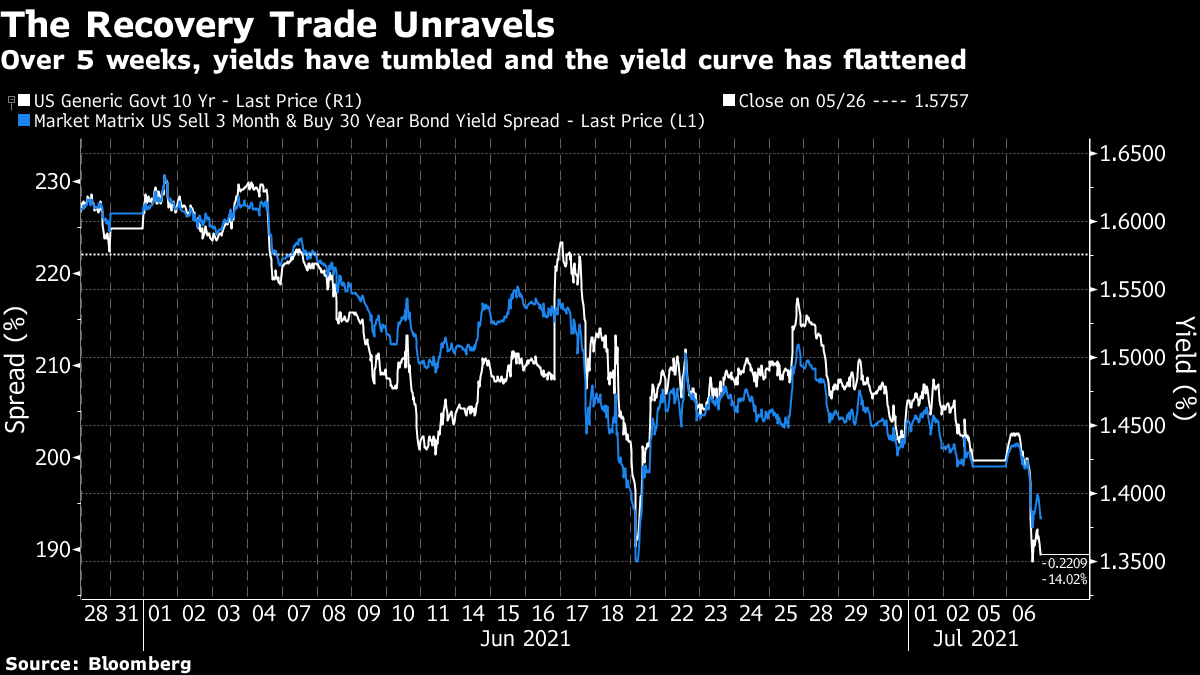
“If the Fed does not address inflation soon, they risk long rates shooting much higher,” says Jim Bianco of Bianco Research.

“But if they follow the market’s lead in aggressively hiking rates, they risk hurting the economy. We understand the Fed’s paralysis given the massive uncertainty coming out of the pandemic. However, the longer they wait to address inflation, the worse this conundrum will become.”
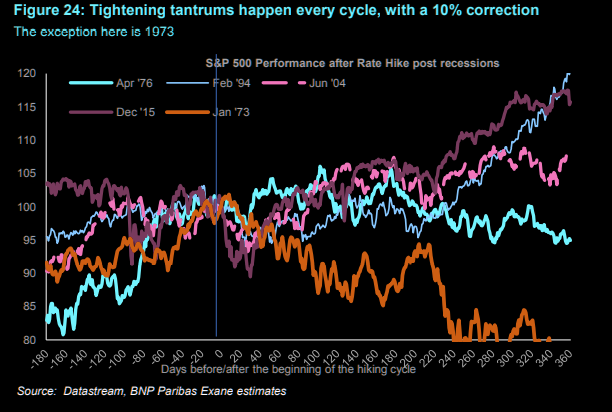
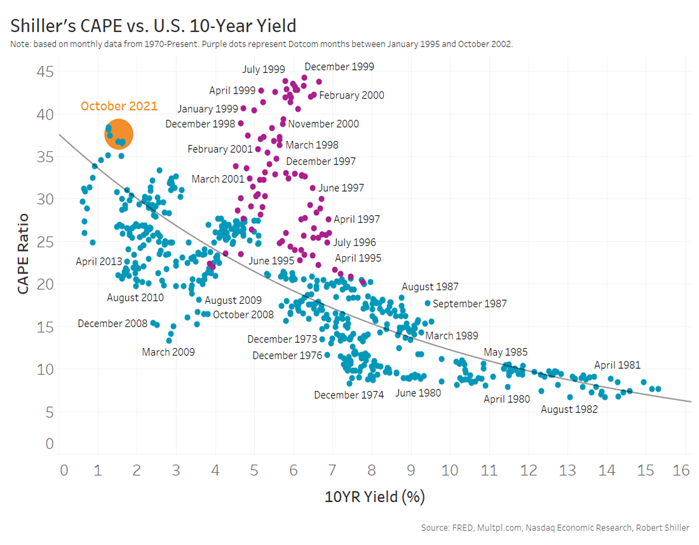
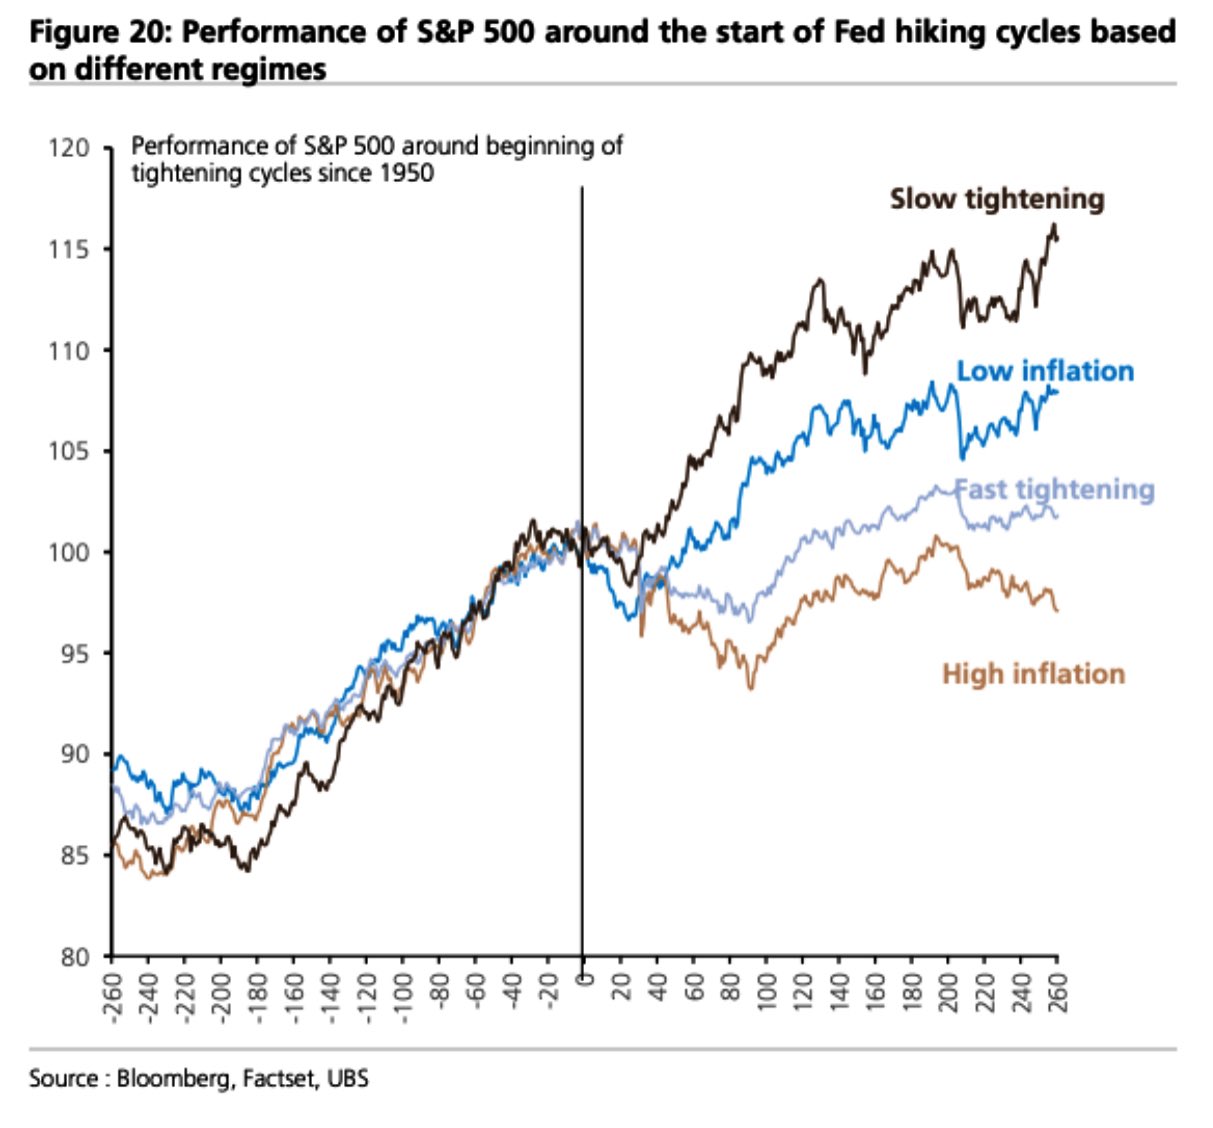
Notwithstanding, today’s rates are supporting validations better than in the ‘90s.
At the same time, equity markets tend to rally into the first hike; Moody’s Corporation’s (NYSE: MCO) forecast aligns with that – “the Dow Jones Industrial Average increases this quarter and peaks in early 2022, … [followed by] steady decline through 2022.”
Immediate risks, though, remain.
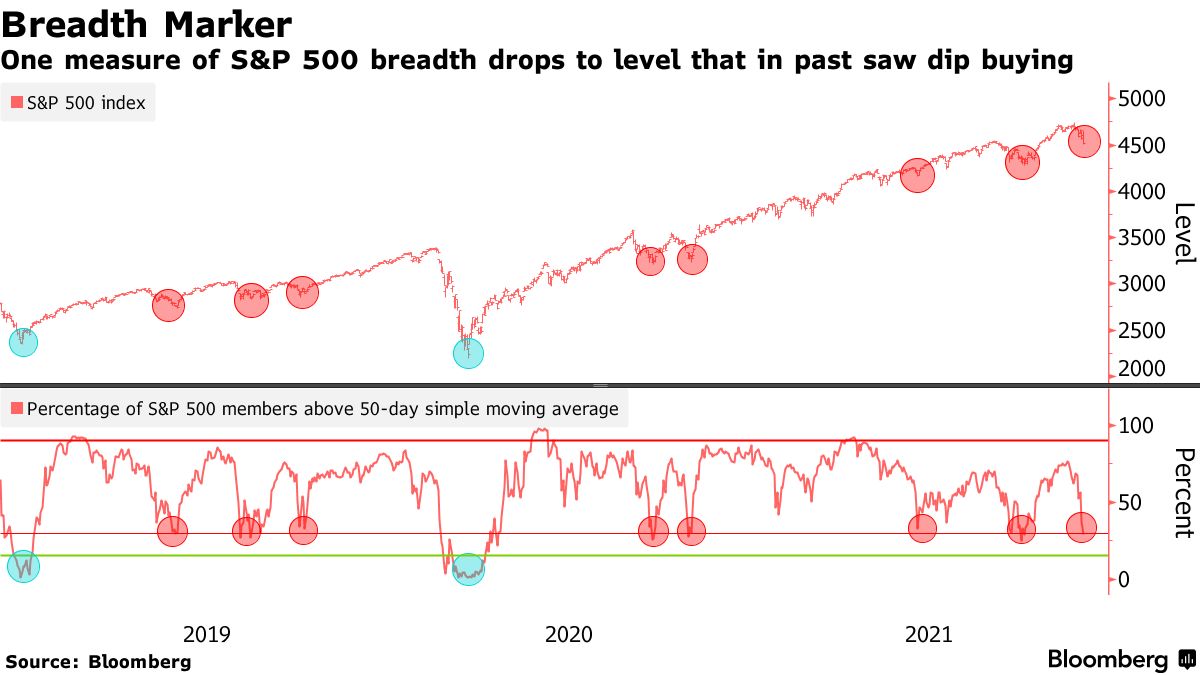
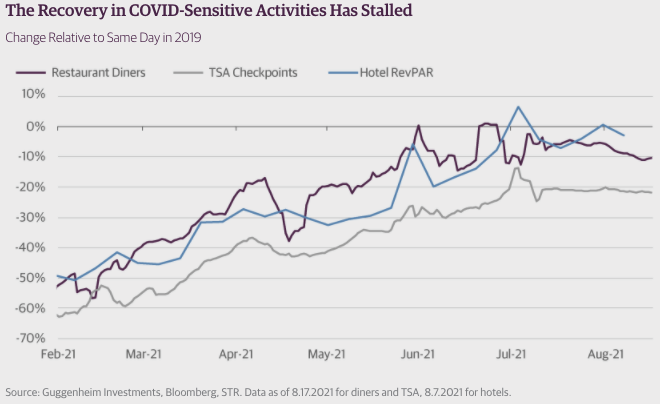
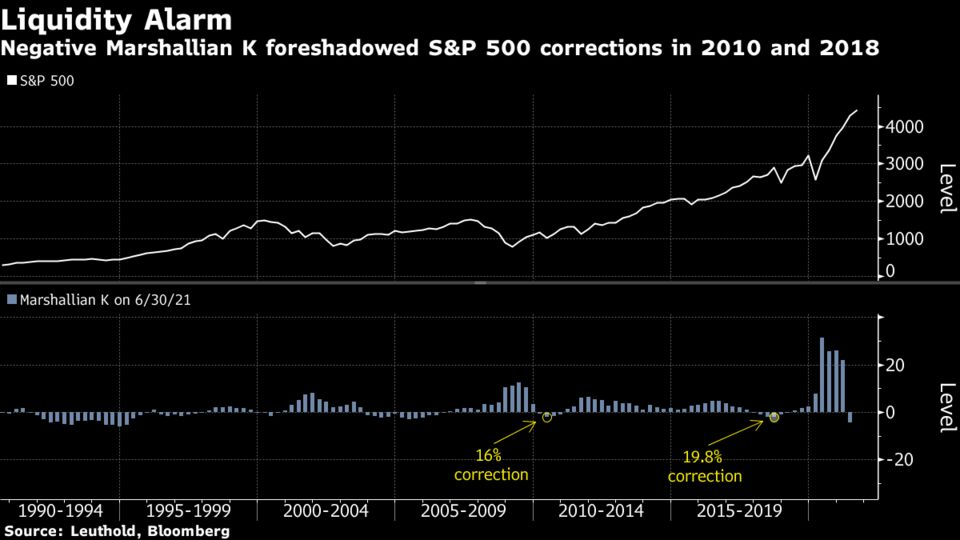
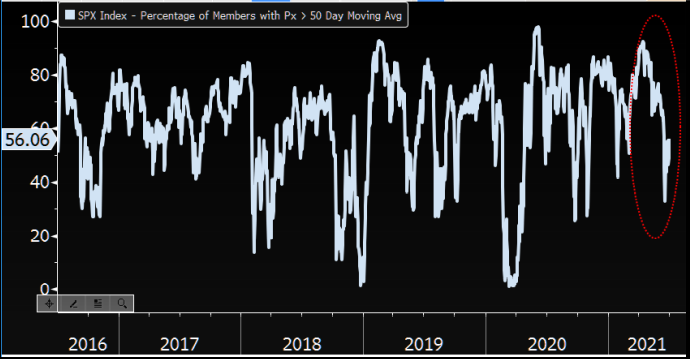
There are growing pockets of weakness – as evidenced by divergent breadth – in the face of U.S. stocks’ inflation-adjusted earnings yield turning negative.
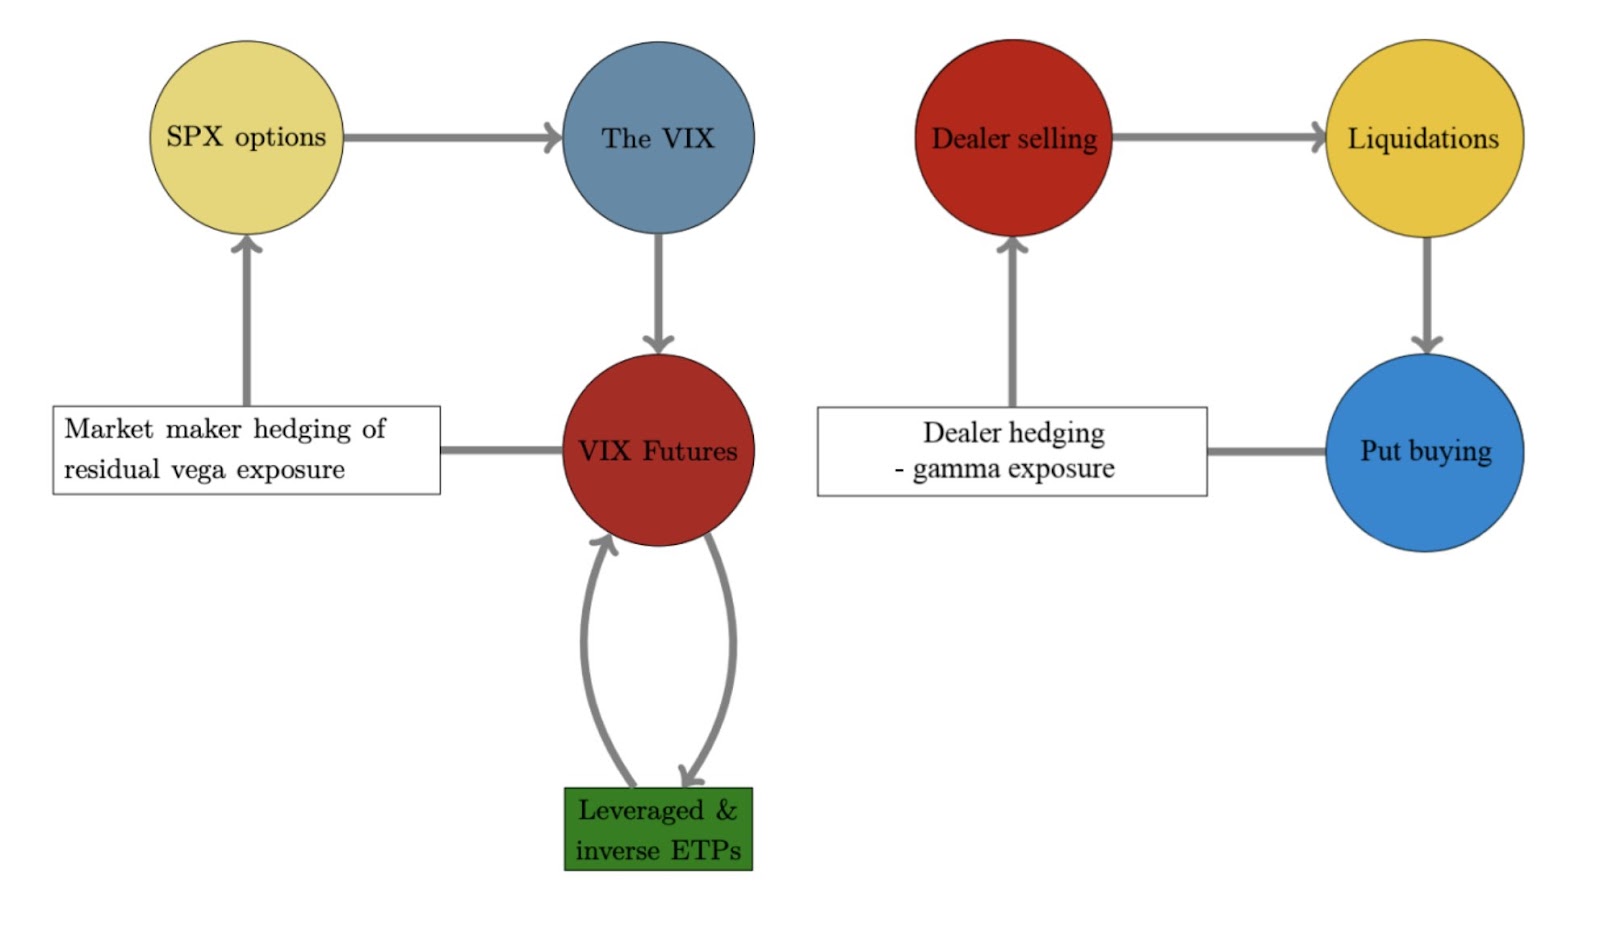
Similarly, participants are more exposed to leveraged products, among other things, which increases the speed with which volatility is realized.
“One potential catalyst would be an explosion in the value of margin accounts at brokers and dealers, which amounted to $595 billion in the second quarter, nearly double the pre-pandemic level. A drop in stock prices could trigger margin calls.”
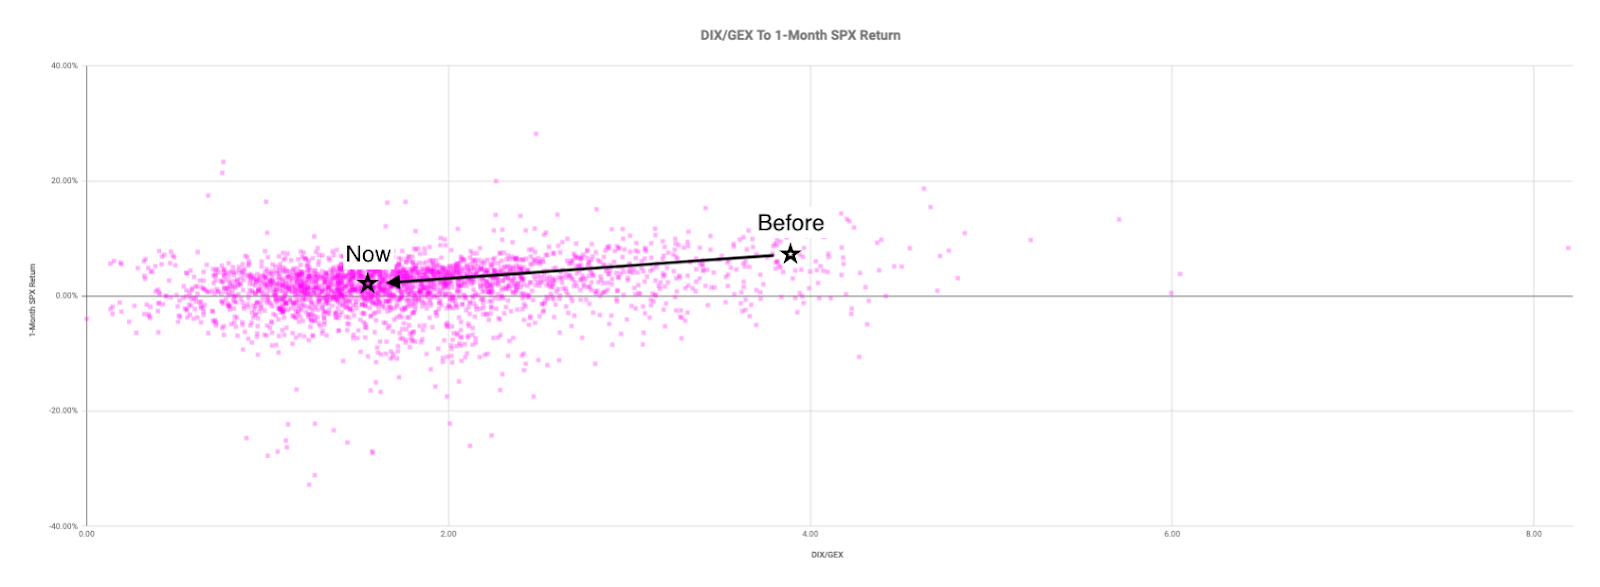
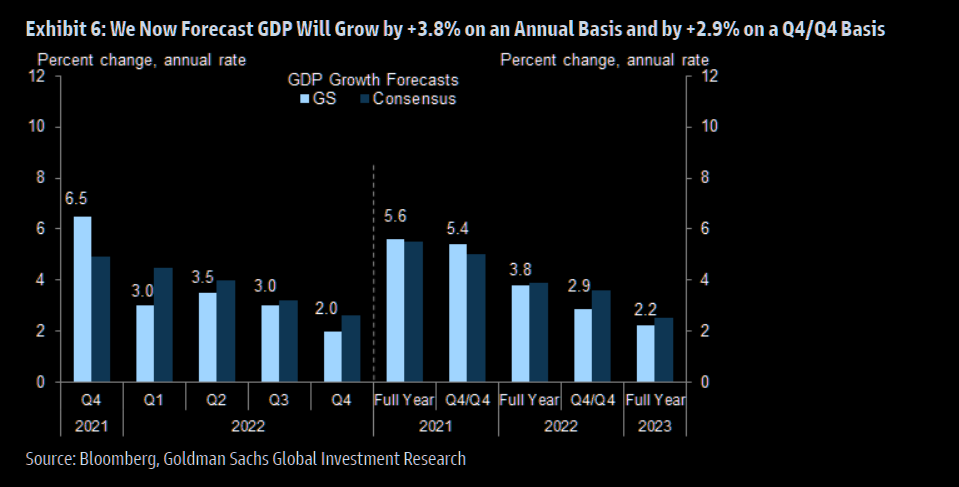
So despite “natural, passive buying support” and positioning metrics flashing a buy, as well as expectations of “the strongest quarterly nominal [economic] growth in more than three decades,” offsides positioning may prompt a reaction that exacerbates underlying price movements.
So what? The market is in a positive-gamma environment wherein the counterparties to customer options trades add market liquidity and temper realized volatility.
If participants’ monetary policy fears are assuaged, a collapse in event-related implied volatility ought to bring positive flows as the long delta (from dealers’ exposure to short puts) decreases.
The decrease in dealer supply (short delta) post-FOMC and -OPEX, via the covering of short stock/futures hedges to put-heavy positioning, ought to bolster any attempt higher.
That’s not to say that some of the vulnerabilities like participants’ large exposure to leveraged products (which increases the speed with which volatility is realized) couldn’t prompt a round of destabilizing demand for downside protection.
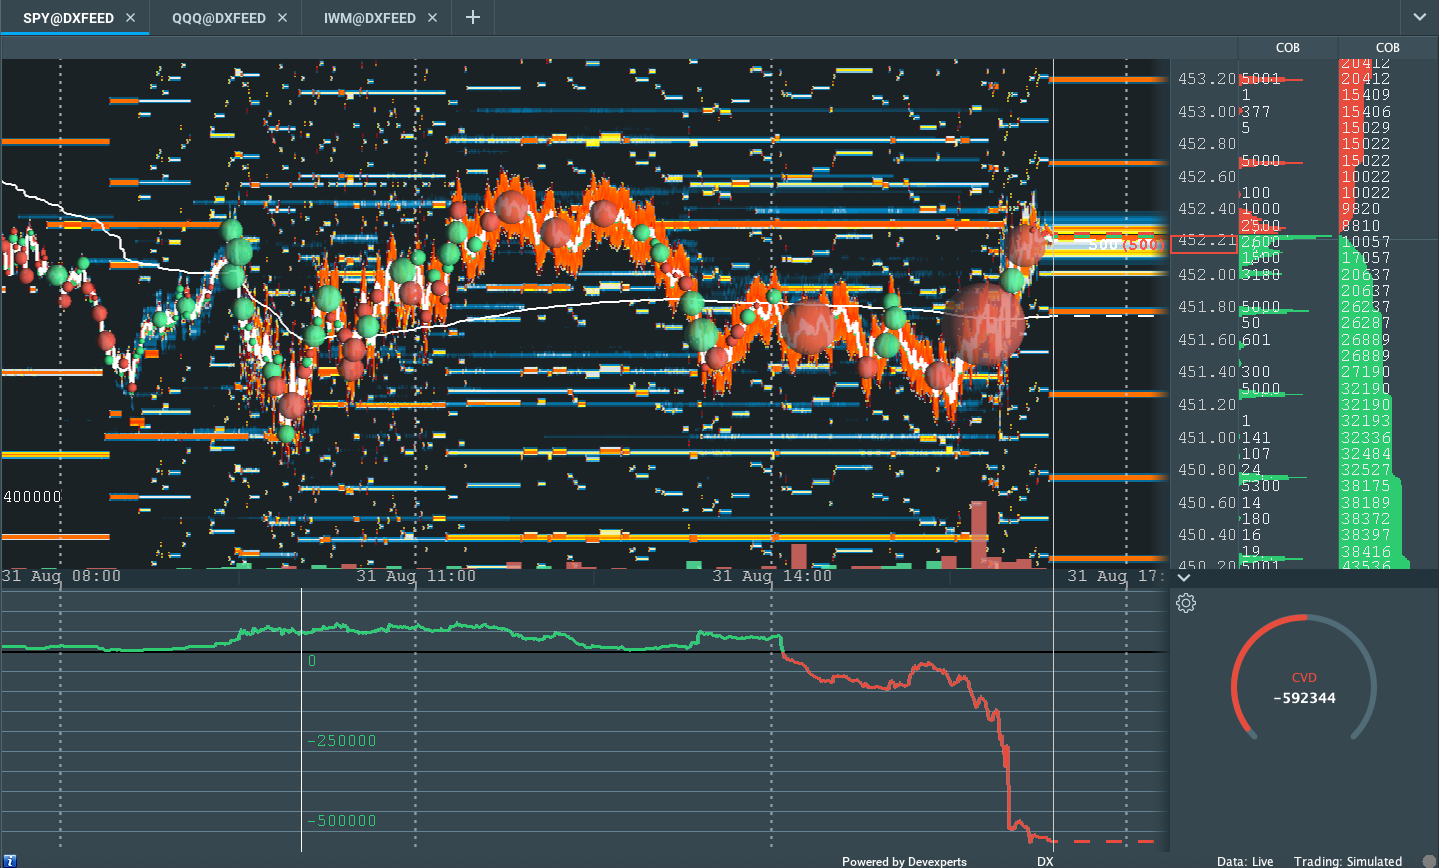
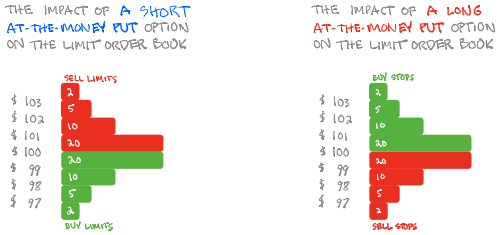
Though order book depth “in isolation is not the correct method to gauge liquidity,” it can help in roughly assessing participants’ demand/supply as volatility (and stress, by that token) increases.
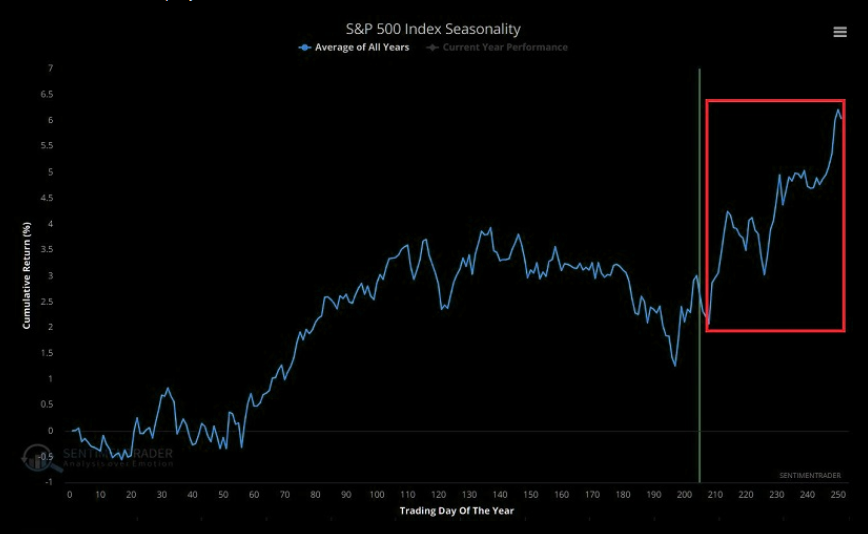
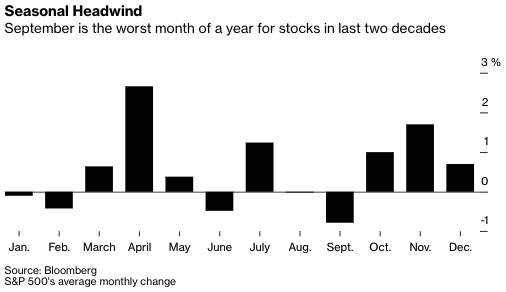
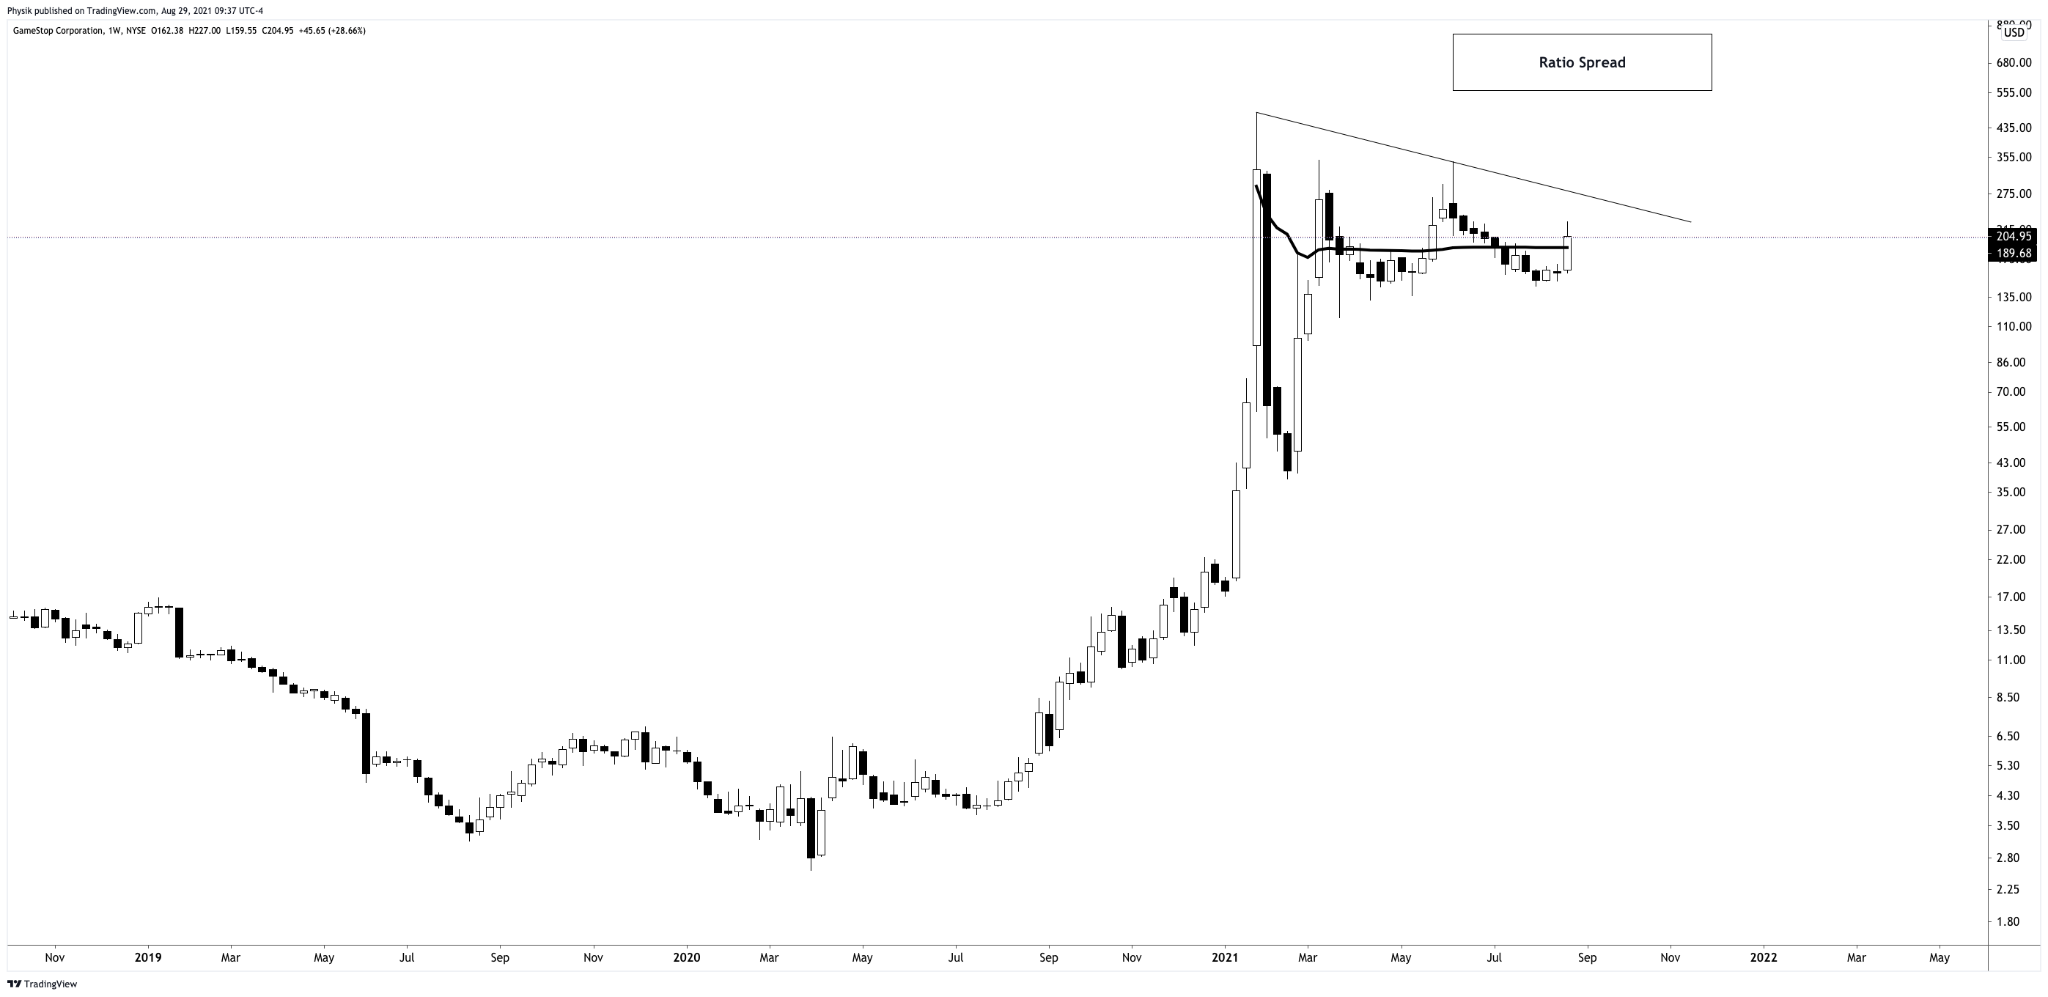
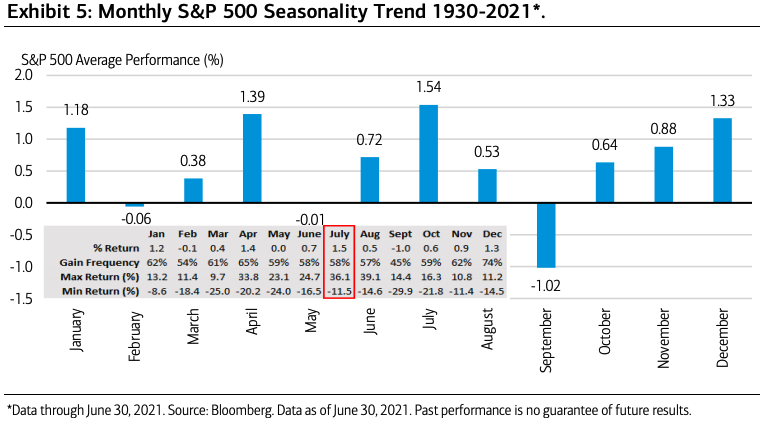
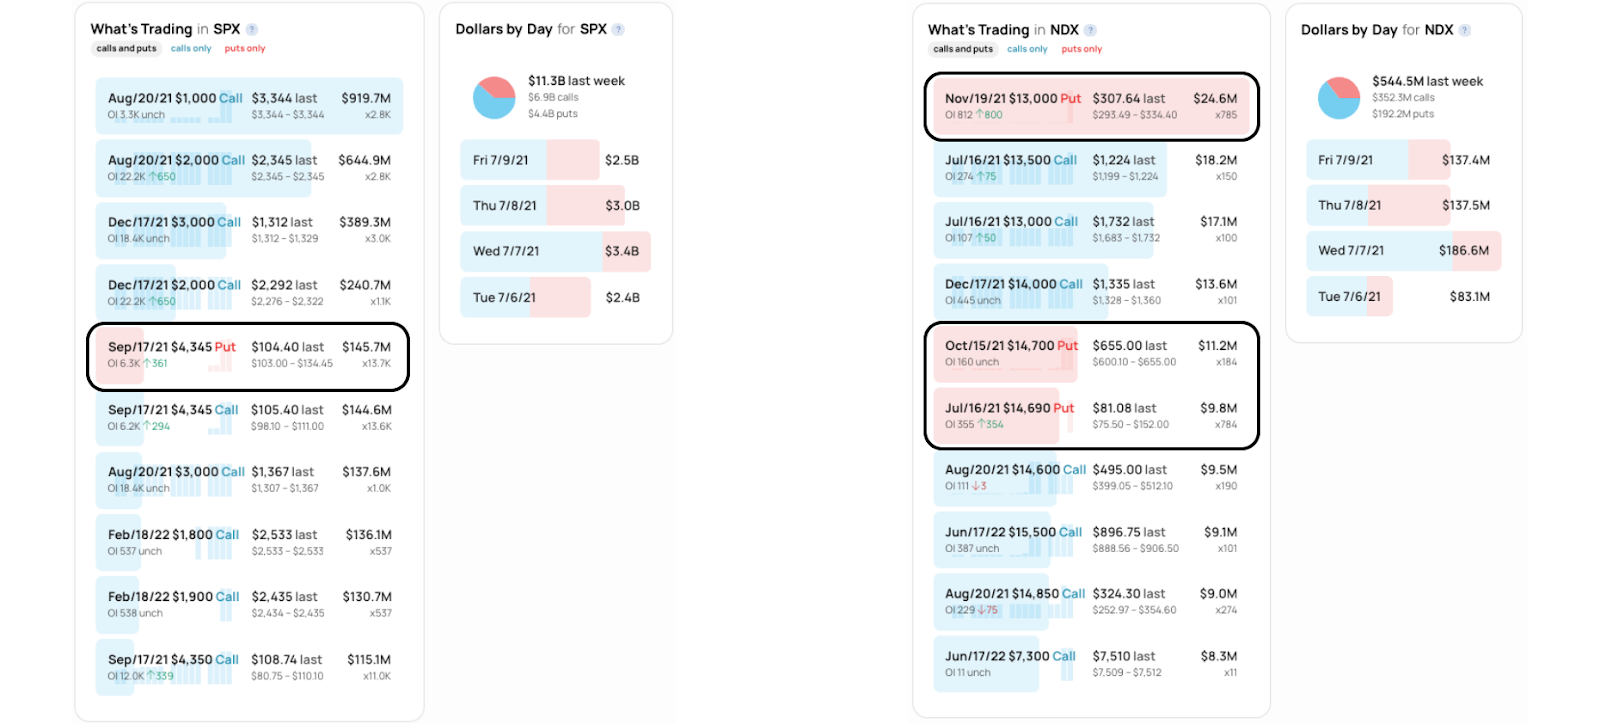
Already, according to Bloomberg, some participants are positioning for “a seasonably favorable period for stocks” in 2021; “someone purchase[d] roughly 20,000 call spreads that are linked to the S&P 500 and expire right before the Christmas holiday. The transaction involved selling calls with a strike price at 4,750 to fund bullish options exercisable at 4,650.”
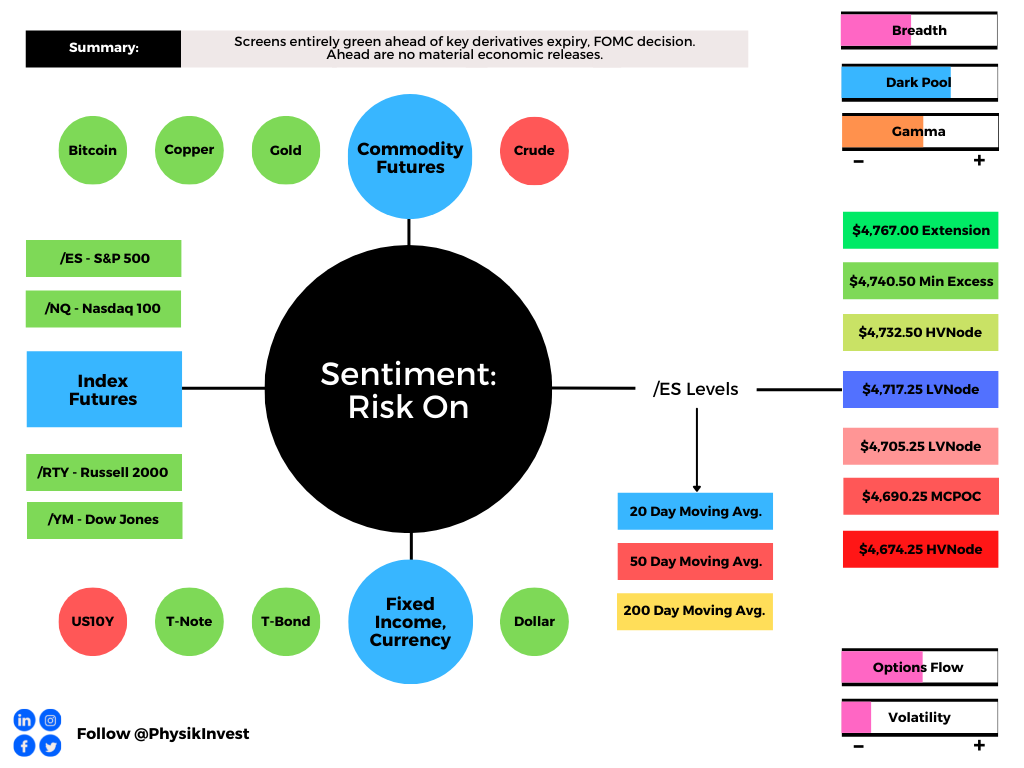
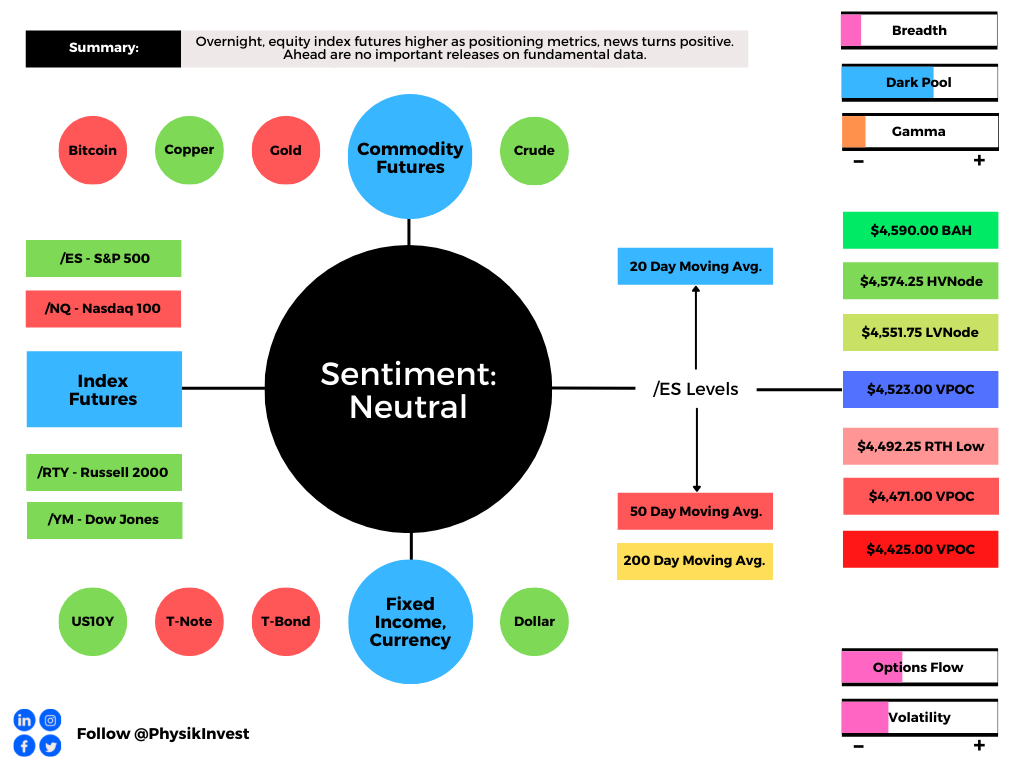
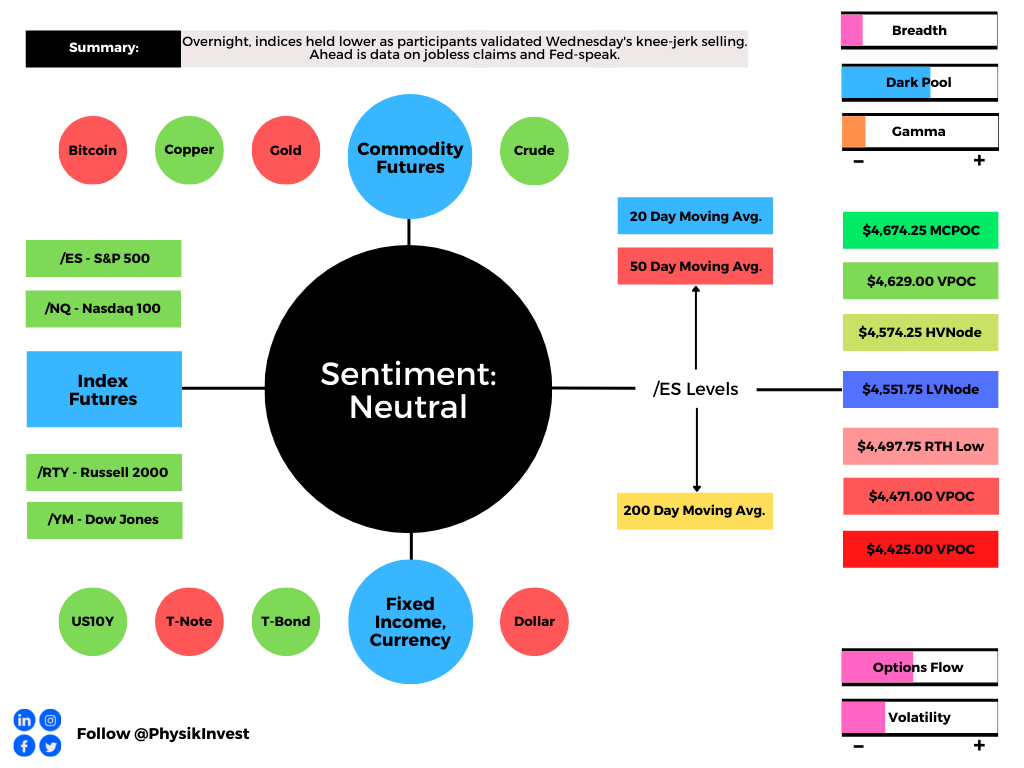
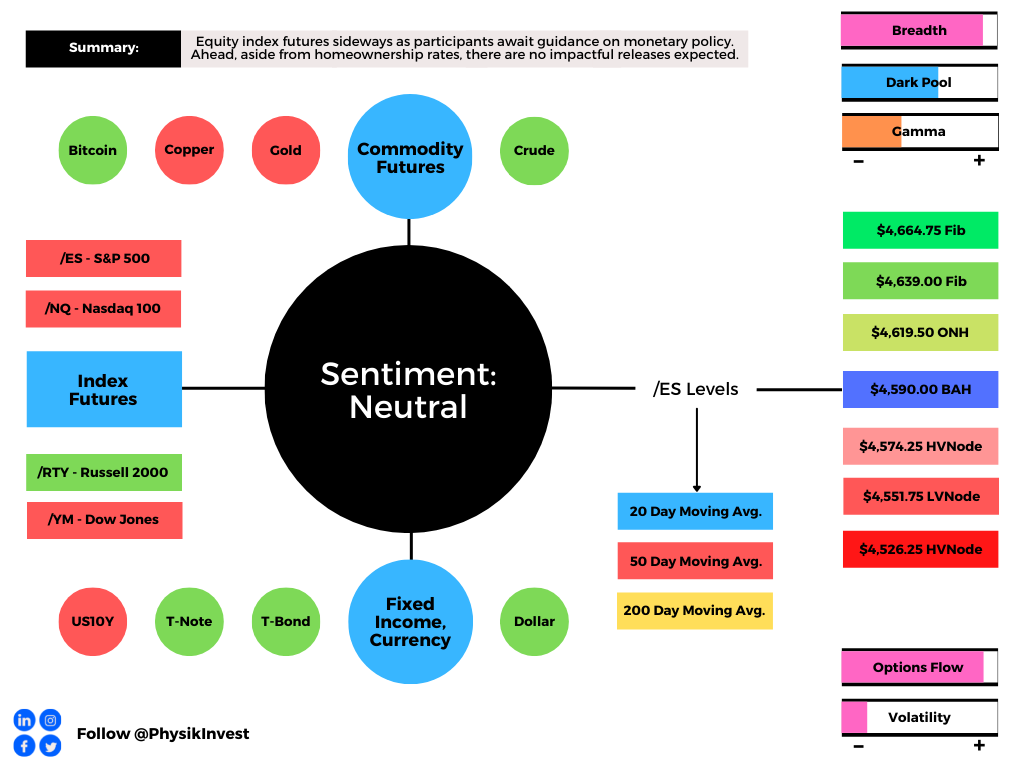
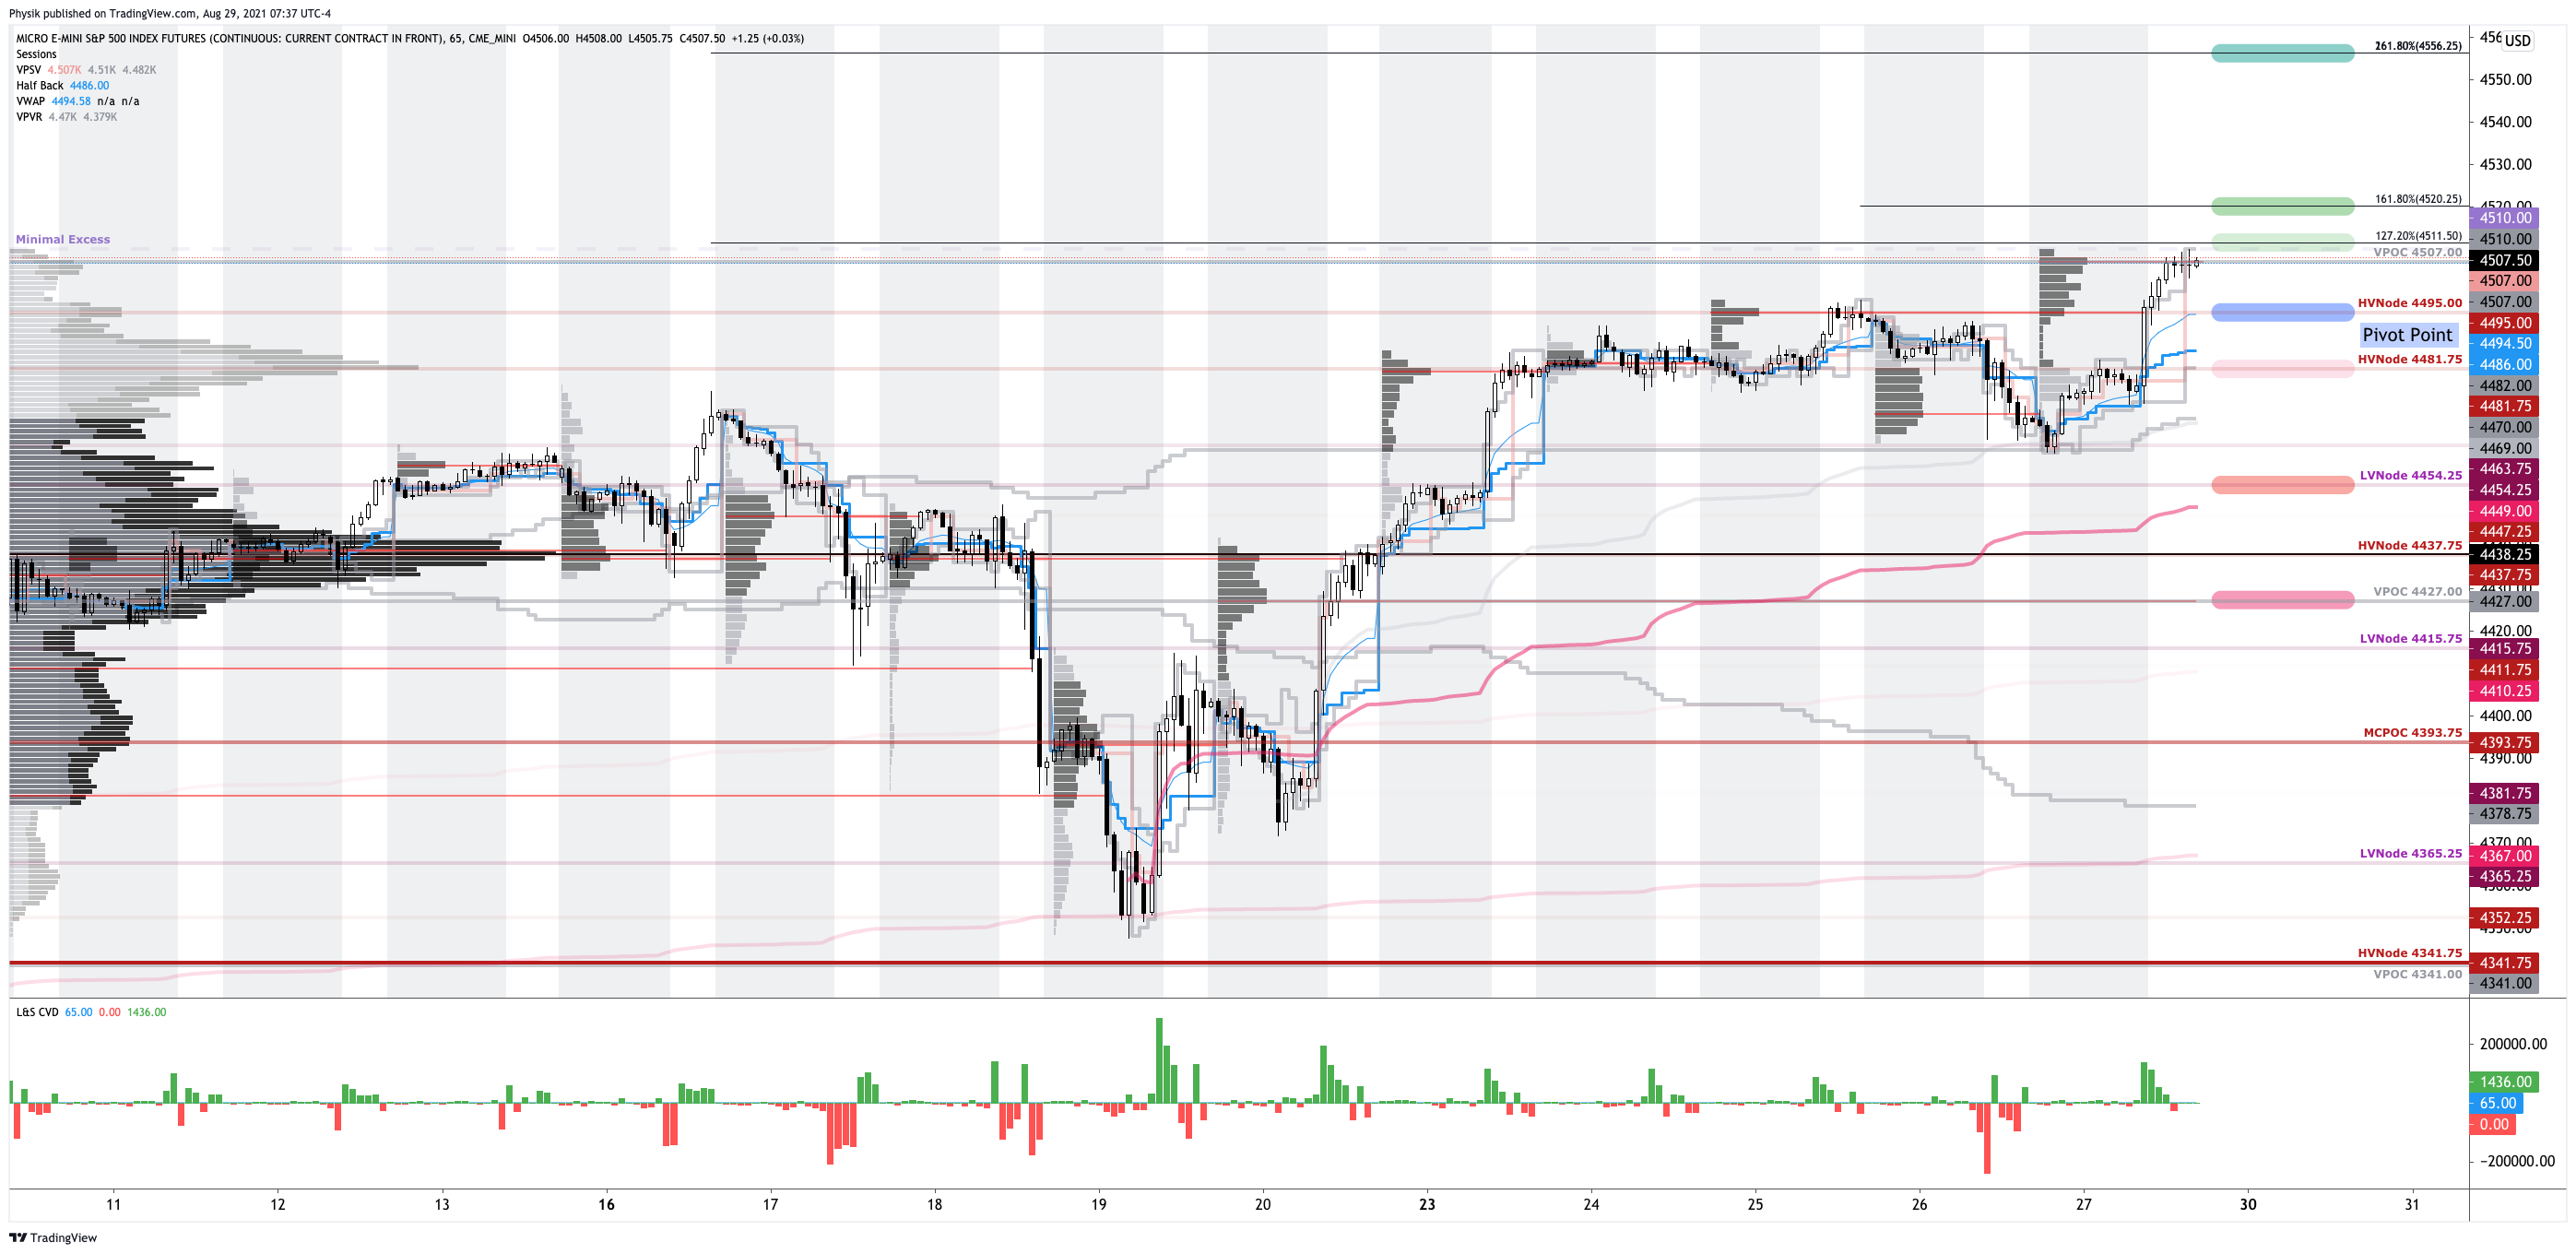
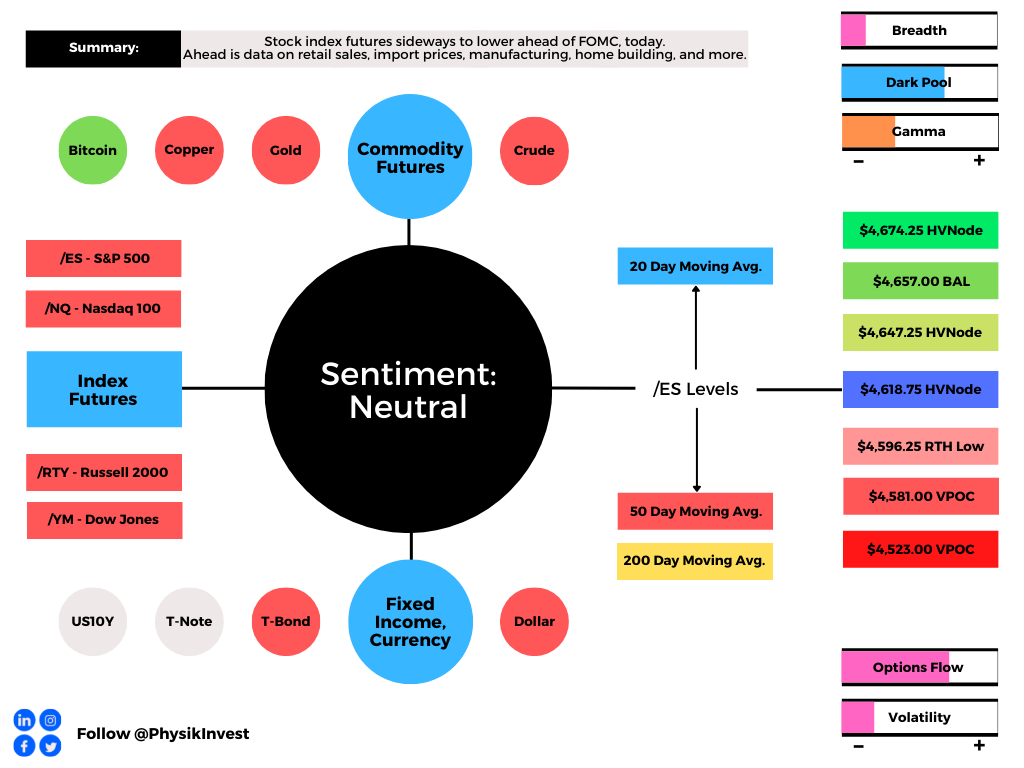
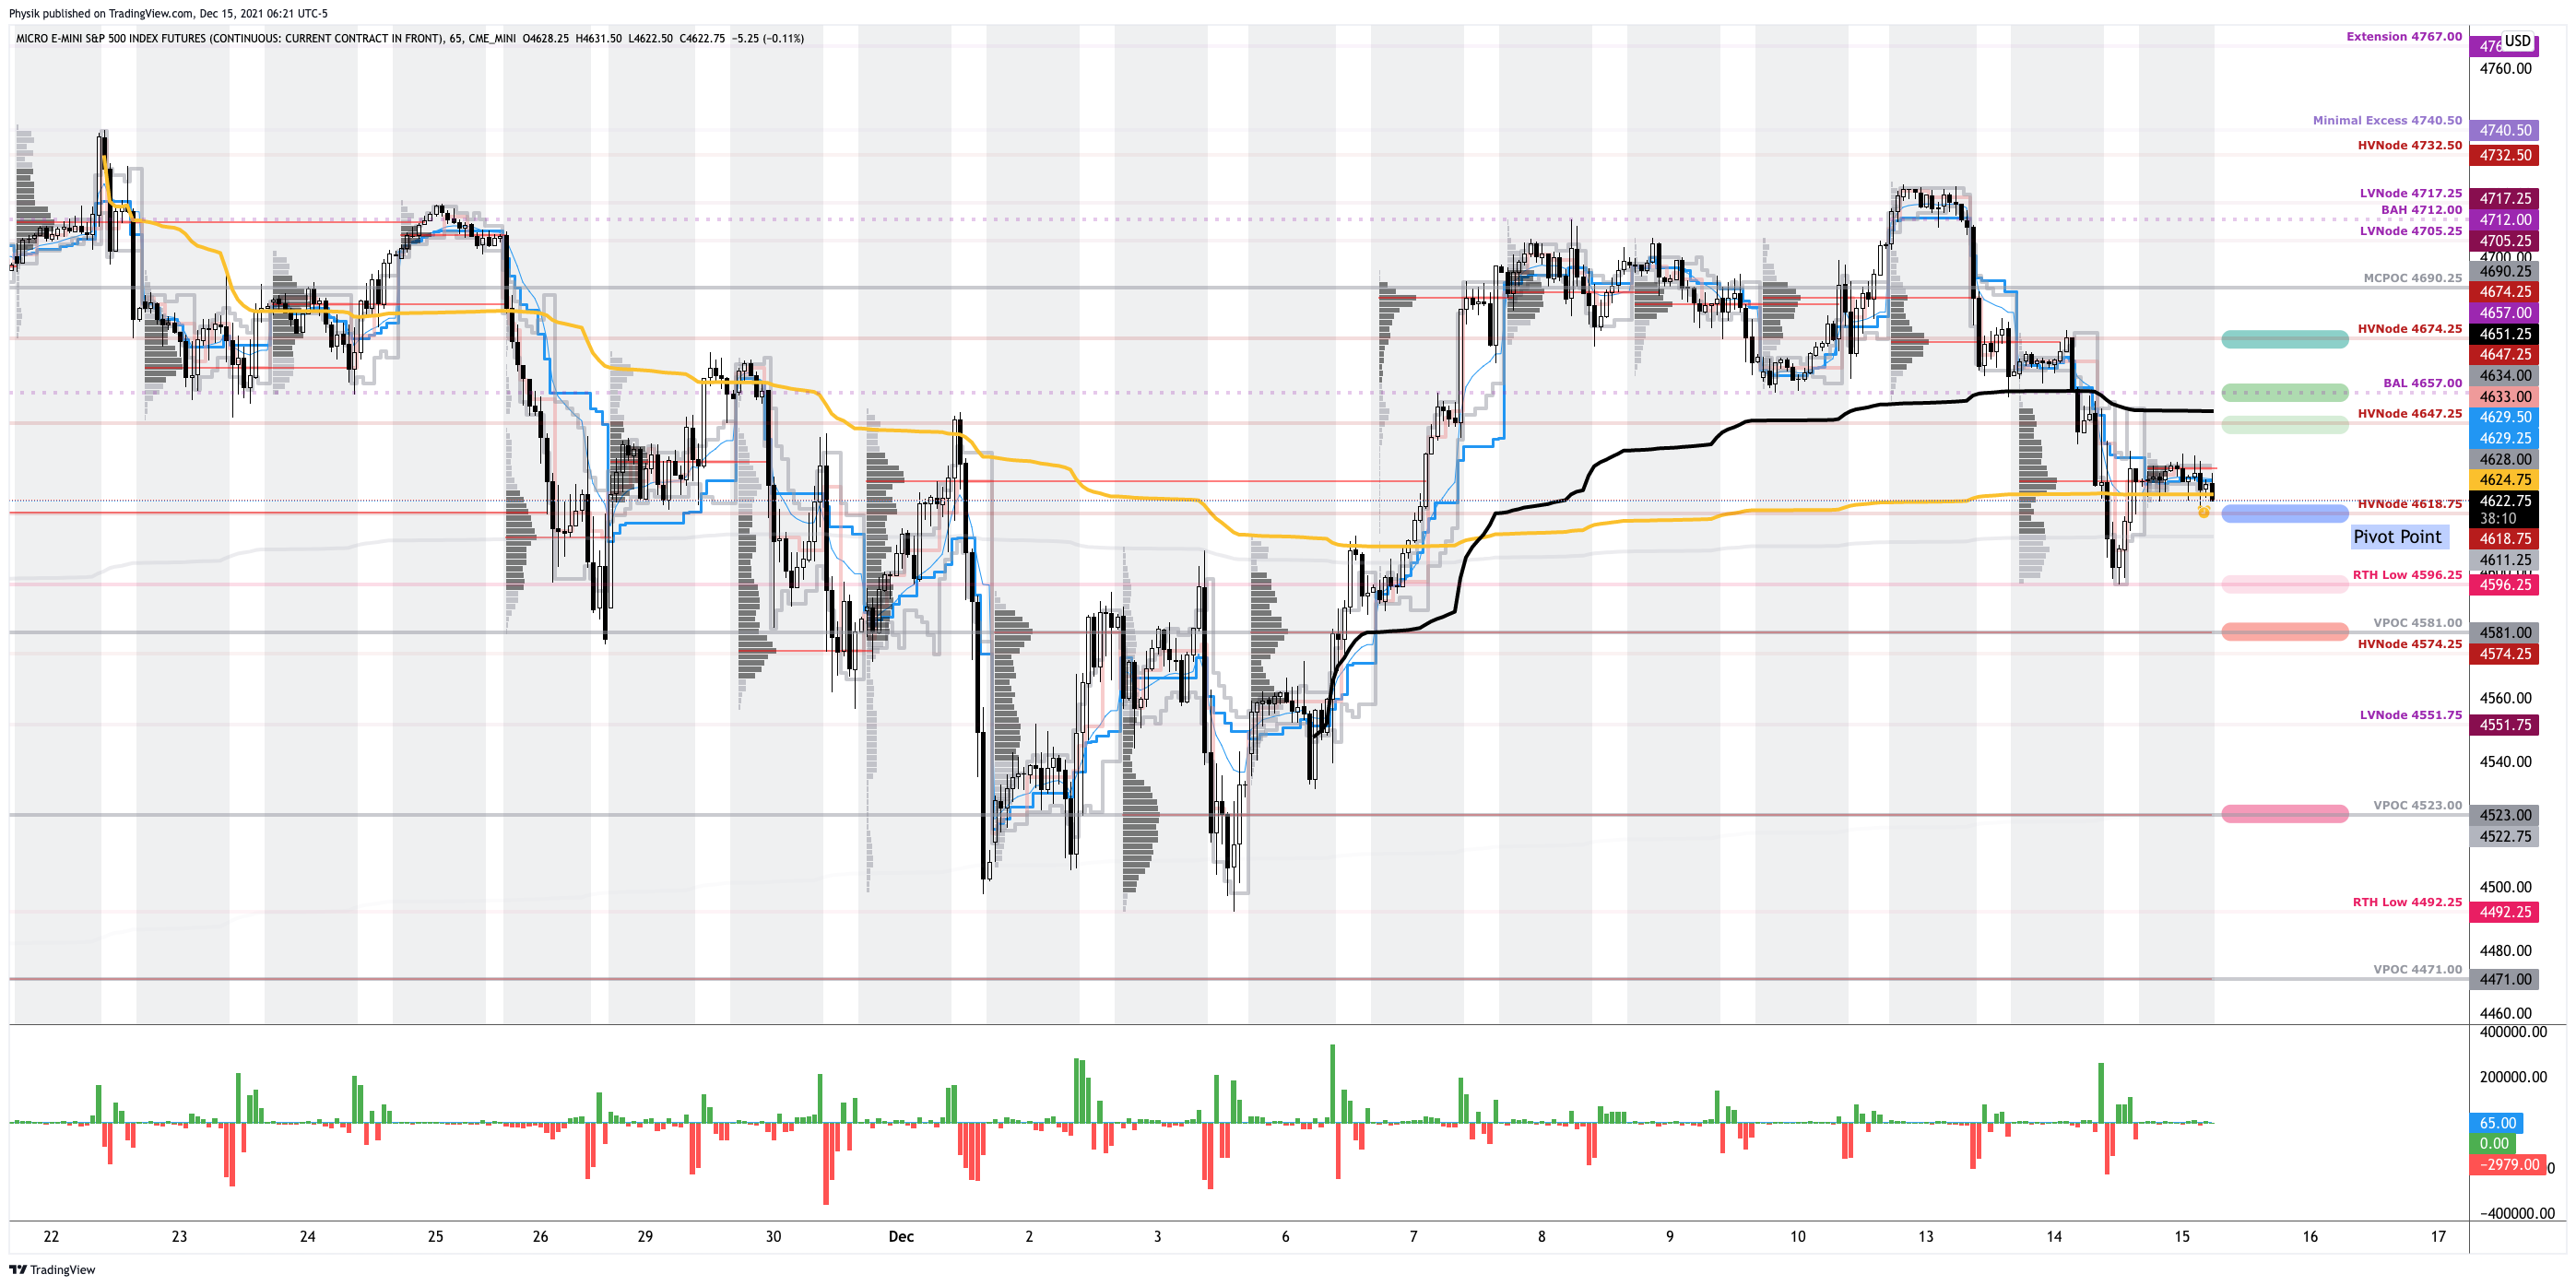
Expectations: As of 6:25 AM ET, Wednesday’s regular session (9:30 AM – 4:00 PM ET), in the S&P 500, will likely open in the middle part of a balanced overnight inventory, inside of prior-range and -value, suggesting a limited potential for immediate directional opportunity.
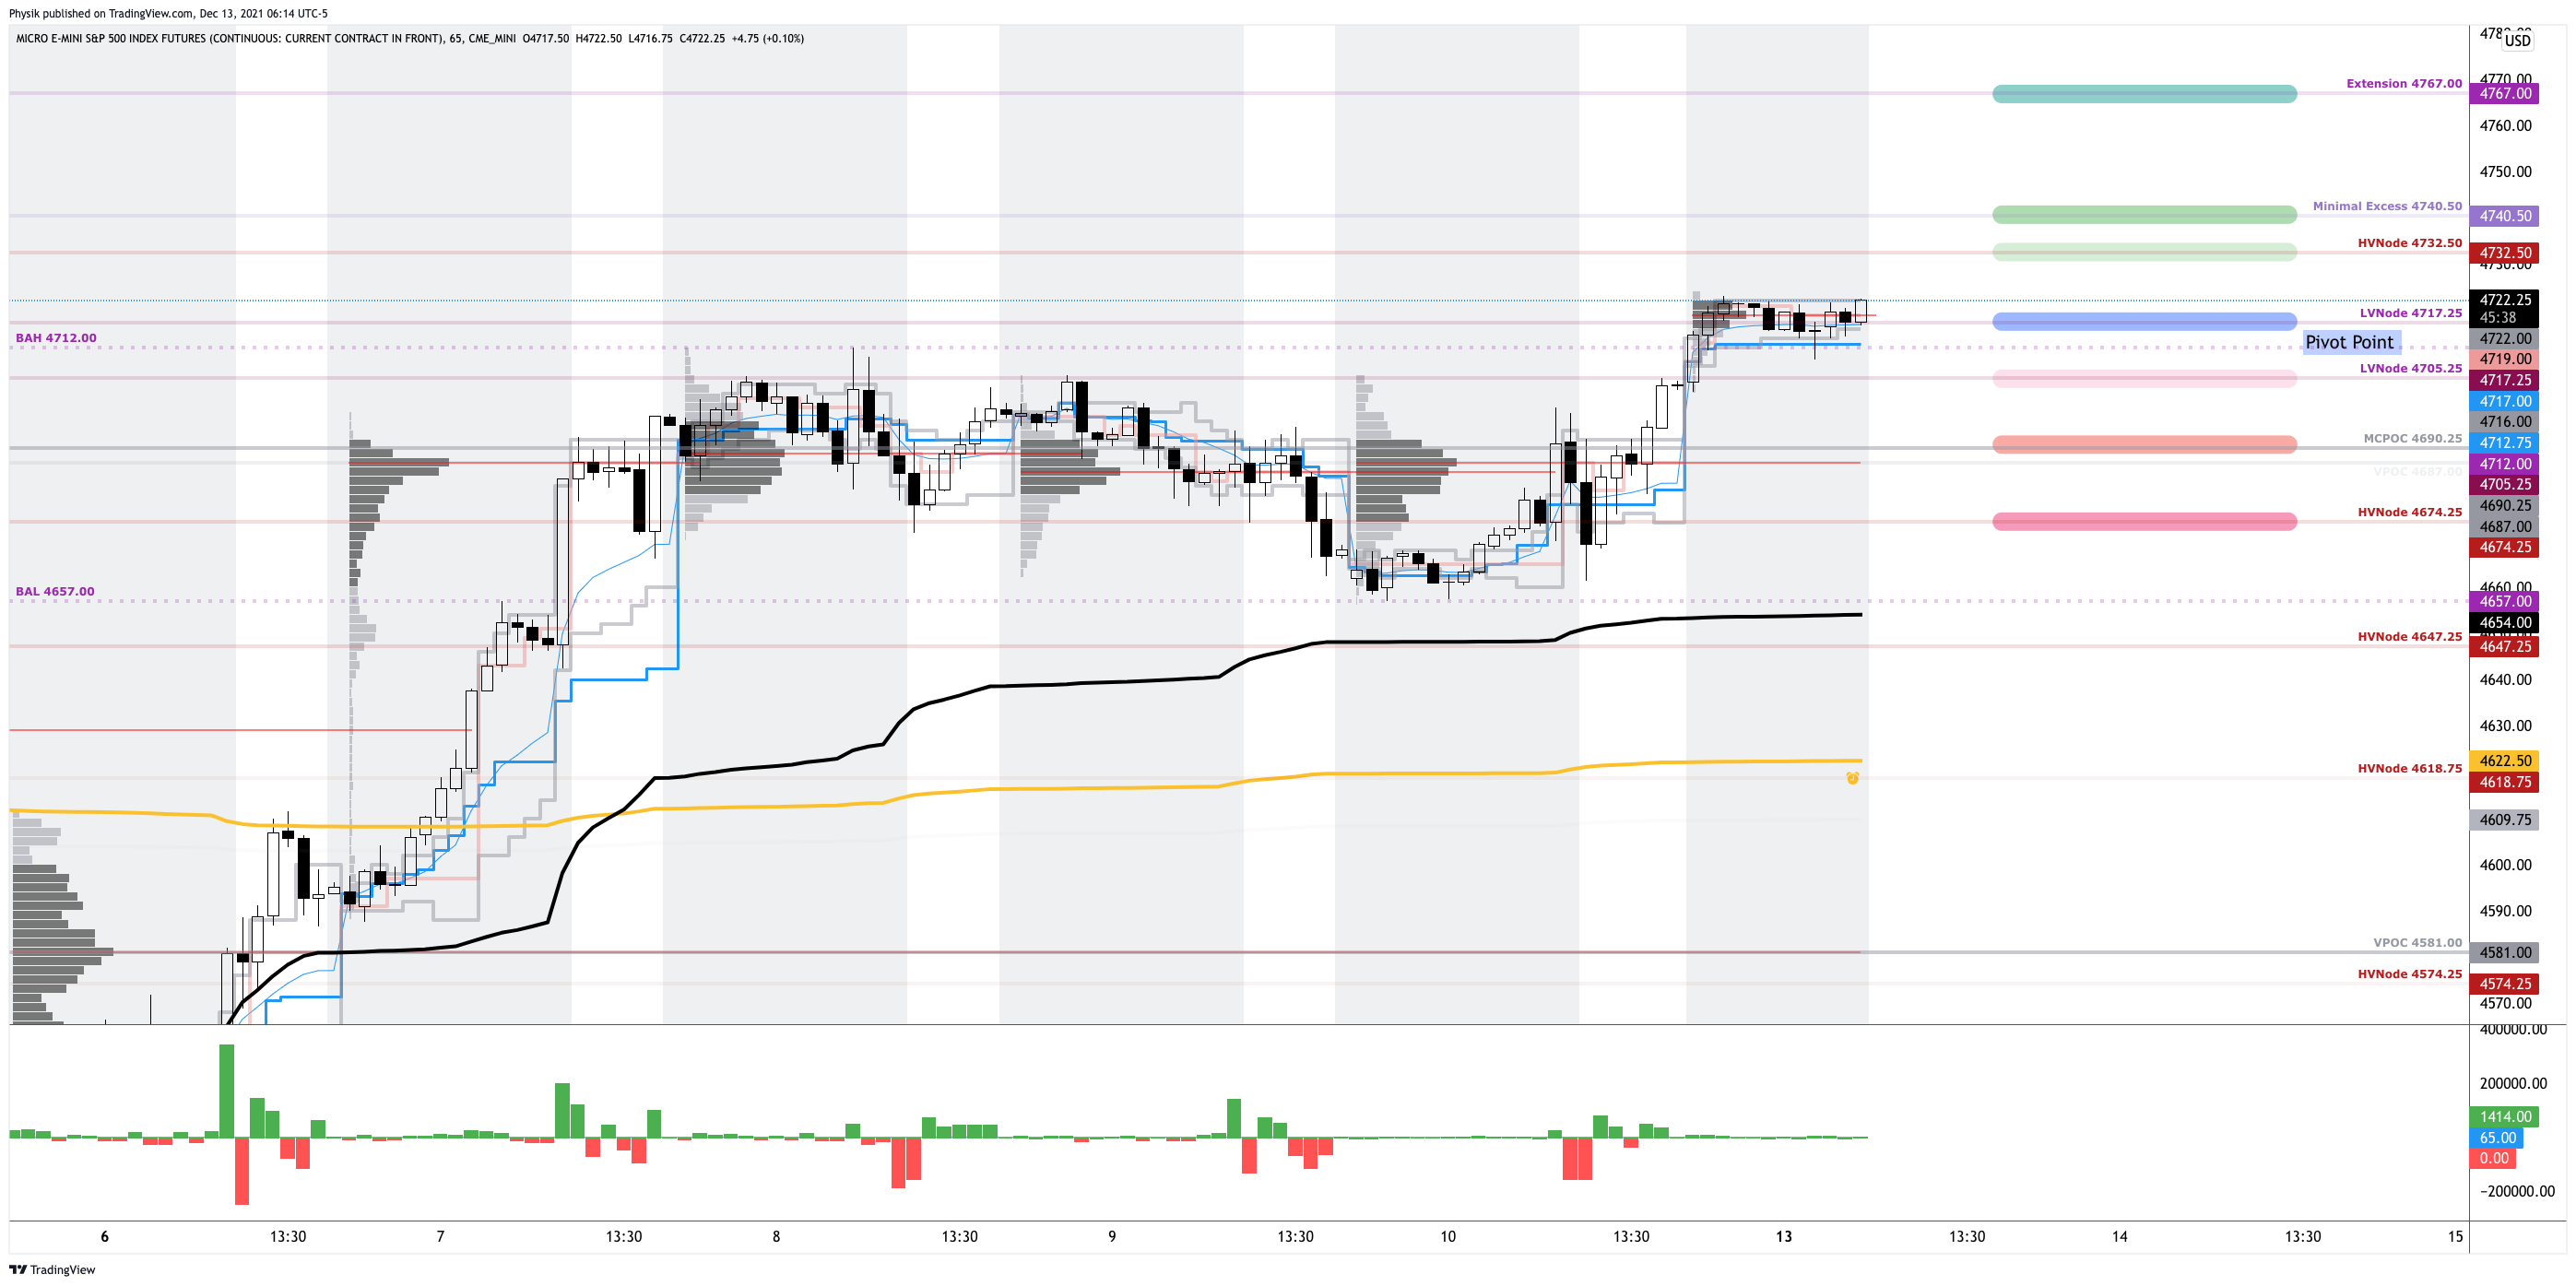
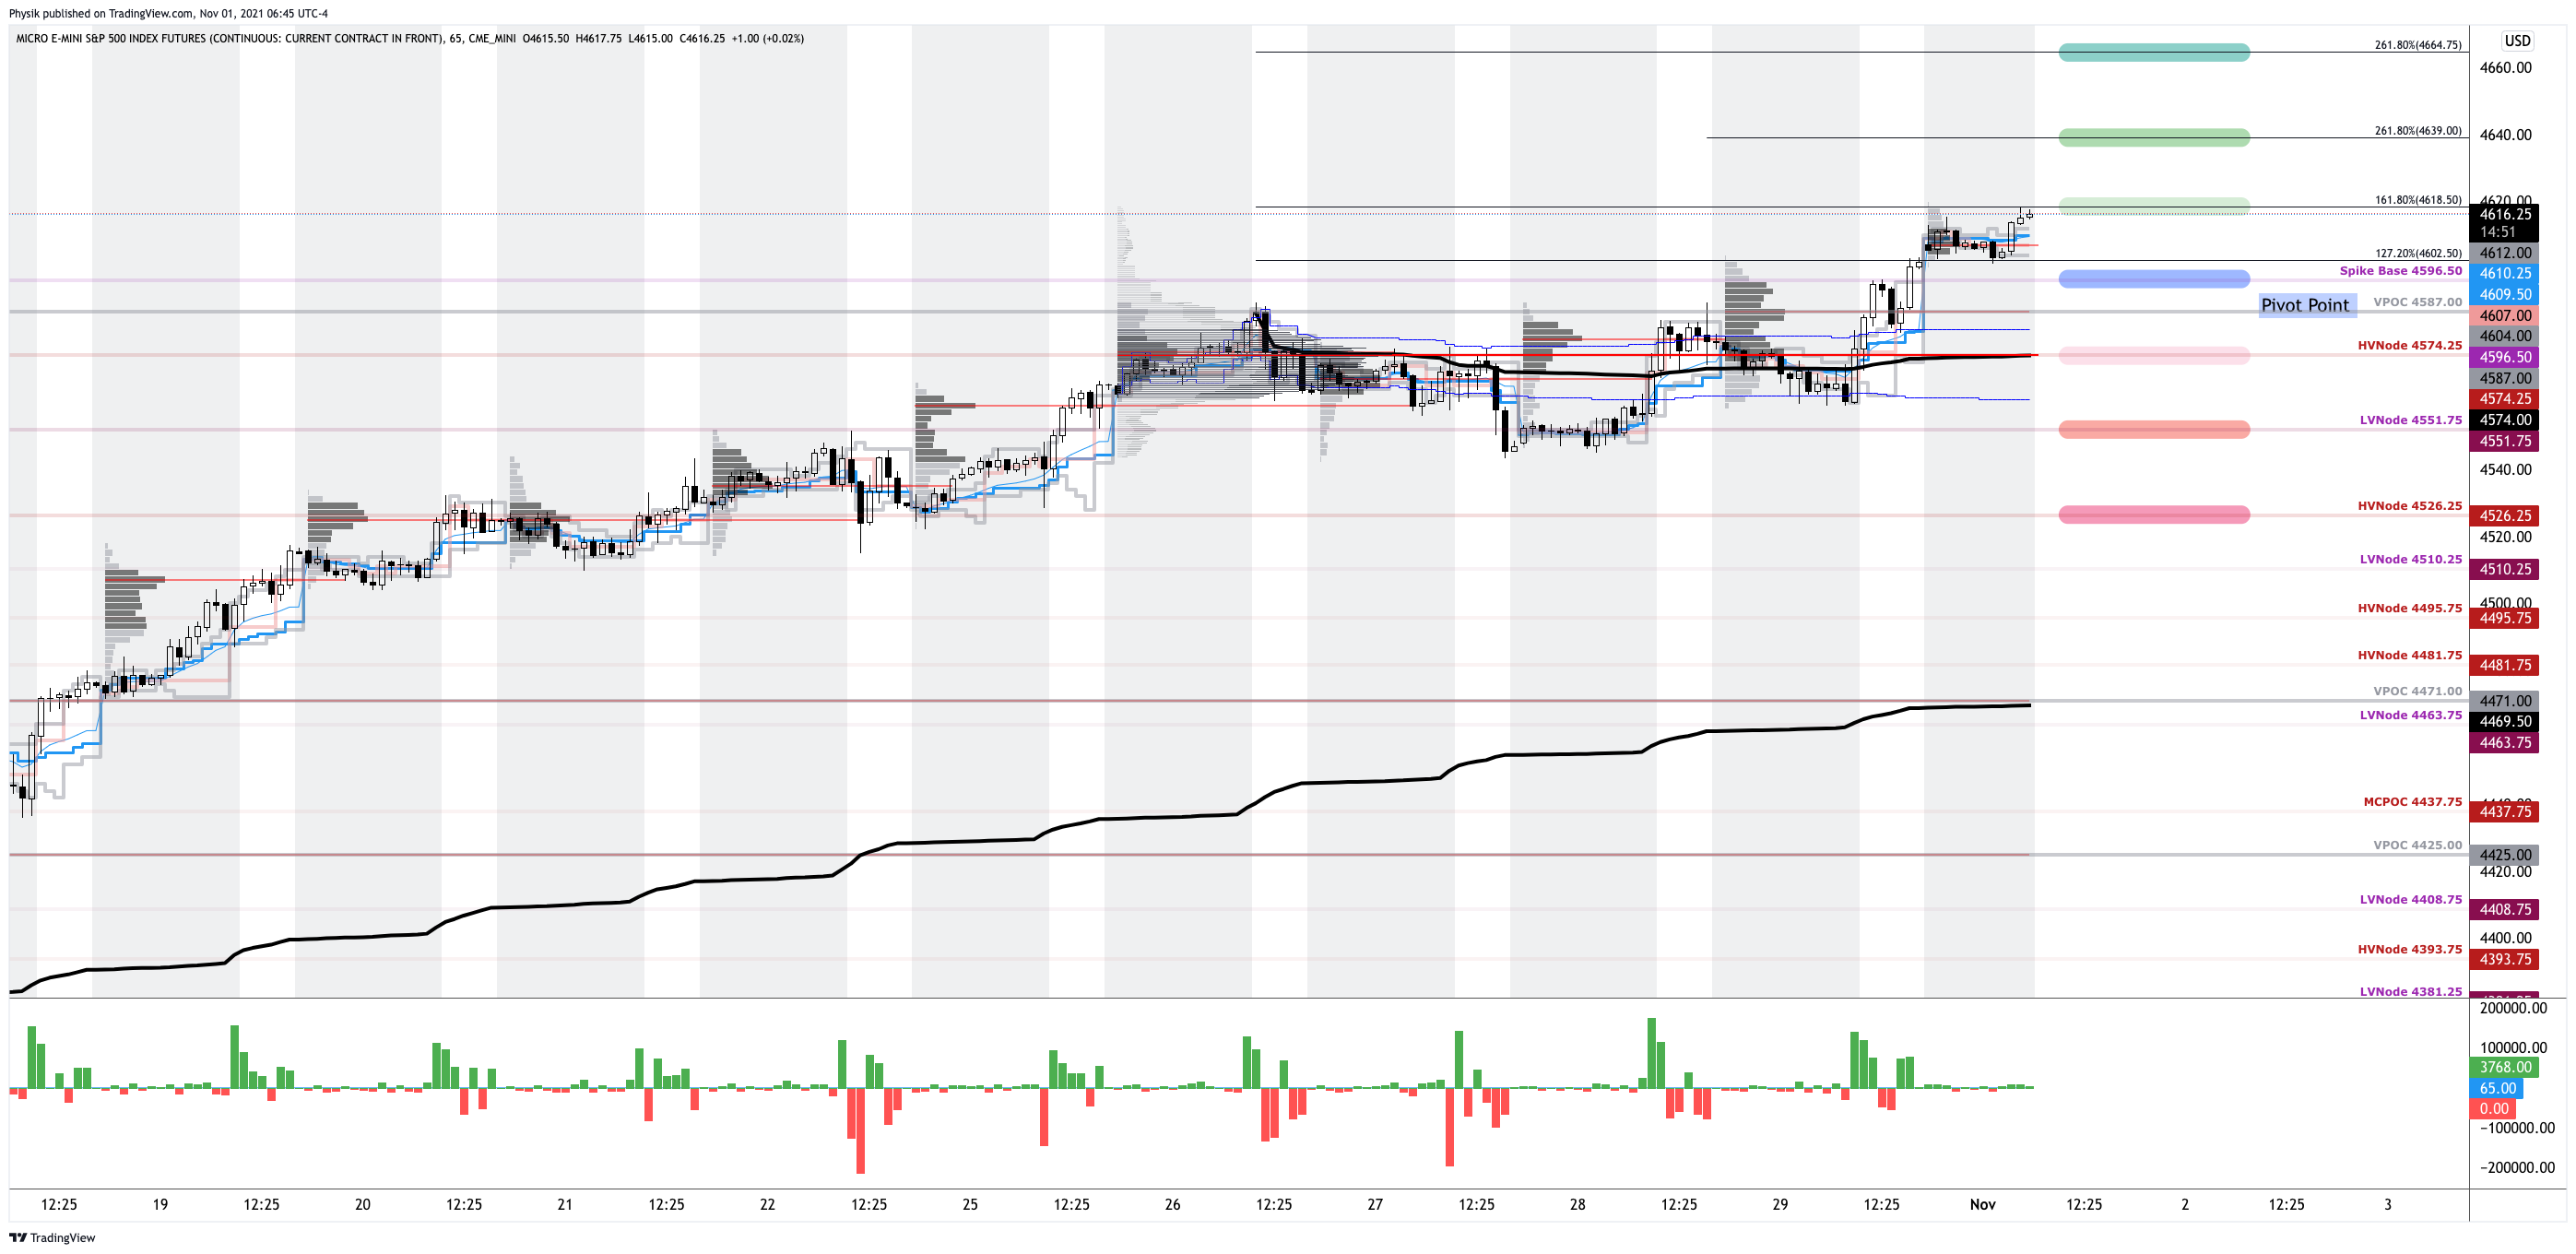
In the best case, the S&P 500 trades sideways or higher; activity above the $4,618.75 high volume area (HVNode) puts in play the $4,647.25 HVNode. Initiative trade beyond the latter could reach as high as the $4,657.00 balance area low (BAL) and $4,674.25 HVNode, or higher.
In the worst case, the S&P 500 trades lower; activity below the $4,618.75 HVNode puts in play the $4,596.25 regular trade low (RTH Low). Initiative trade beyond the RTH Low could reach as low as the $4,581.00 and $4,523.00 untested point of control (VPOC), or lower.
Click here to load today’s key levels into the web-based TradingView charting platform. Note that all levels are derived using the 65-minute timeframe. New links are produced, daily.
What People Are Saying
Definitions
Volume Areas: A structurally sound market will build on areas of high volume (HVNodes). Should the market trend for long periods of time, it will lack sound structure, identified as low volume areas (LVNodes). LVNodes denote directional conviction and ought to offer support on any test.
If participants were to auction and find acceptance into areas of prior low volume (LVNodes), then future discovery ought to be volatile and quick as participants look to HVNodes for favorable entry or exit.
POCs: POCs are valuable as they denote areas where two-sided trade was most prevalent in a prior day session. Participants will respond to future tests of value as they offer favorable entry and exit.
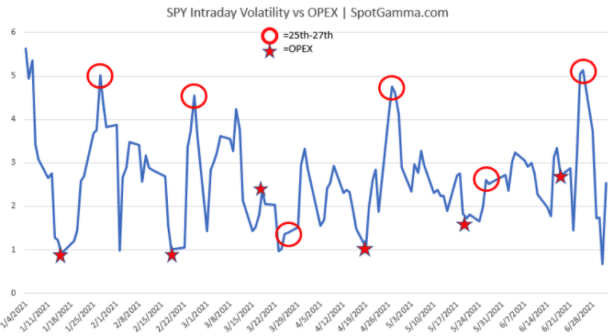
Options Expiration (OPEX): Traditionally, option expiries mark an end to pinning (i.e, the theory that market makers and institutions short options move stocks to the point where the greatest dollar value of contracts will expire) and the reduction dealer gamma exposure.
About
After years of self-education, strategy development, and trial-and-error, Renato Leonard Capelj began trading full-time and founded Physik Invest to detail his methods, research, and performance in the markets.
Additionally, Capelj is a Benzinga finance and technology reporter interviewing the likes of Shark Tank’s Kevin O’Leary, JC2 Ventures’ John Chambers, and ARK Invest’s Catherine Wood, as well as a SpotGamma contributor, helping develop insights around impactful options market dynamics.
Disclaimer
At this time, Physik Invest does not carry the right to provide advice. In no way should the materials herein be construed as advice. Derivatives carry a substantial risk of loss. All content is for informational purposes only.