First Republic Bank (NYSE: FRC) is in the news for its failure. FRC was known for handing out mortgages at rock-bottom rates. When interest rates rose, the bank’s book of mortgages was hurt and left it with not enough to suffice withdrawals.
“FRC believed its business model of extraordinary customer service and product pricing would result in superior customer loyalty through all cycles,” wrote Timothy Coffey of Janney Montgomery Scott. “Instead, too many FRC customers showed their true loyalties were to their own fears.”
This “marks the second-biggest bank failure in U.S. history, behind the 2008 collapse of Washington Mutual Inc.,” reports WSJ; after the instability in March, the bank finally succumbed to the Federal Reserve’s (Fed) rate increases and depositor worry.
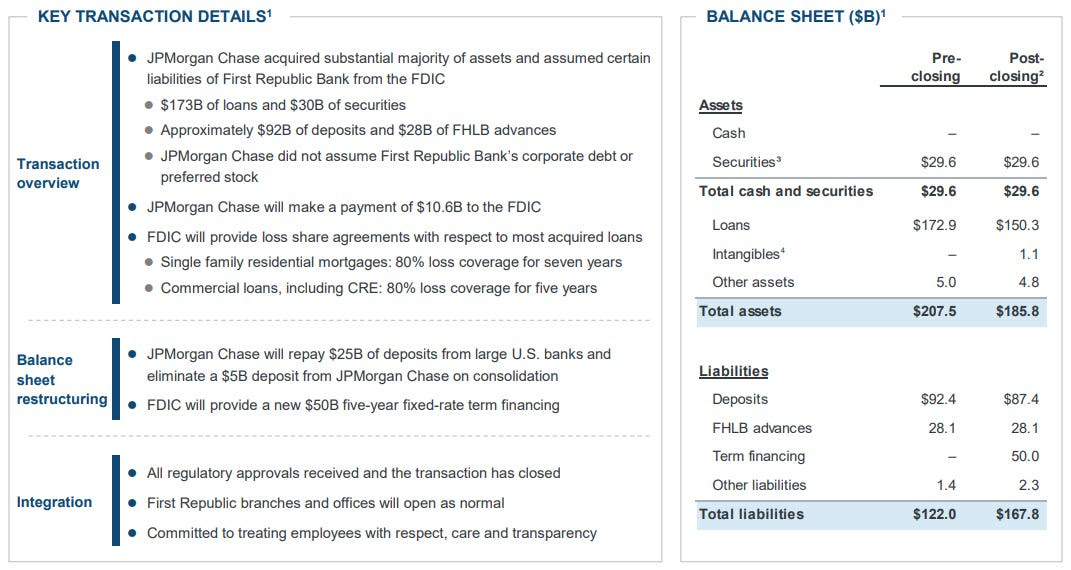
JPMorgan Chase & Co (NYSE: JPM) acquired the bulk of FRC’s operations.
Graphic: Retrieved from JPM. See a nice summary by @brandonjcarl.
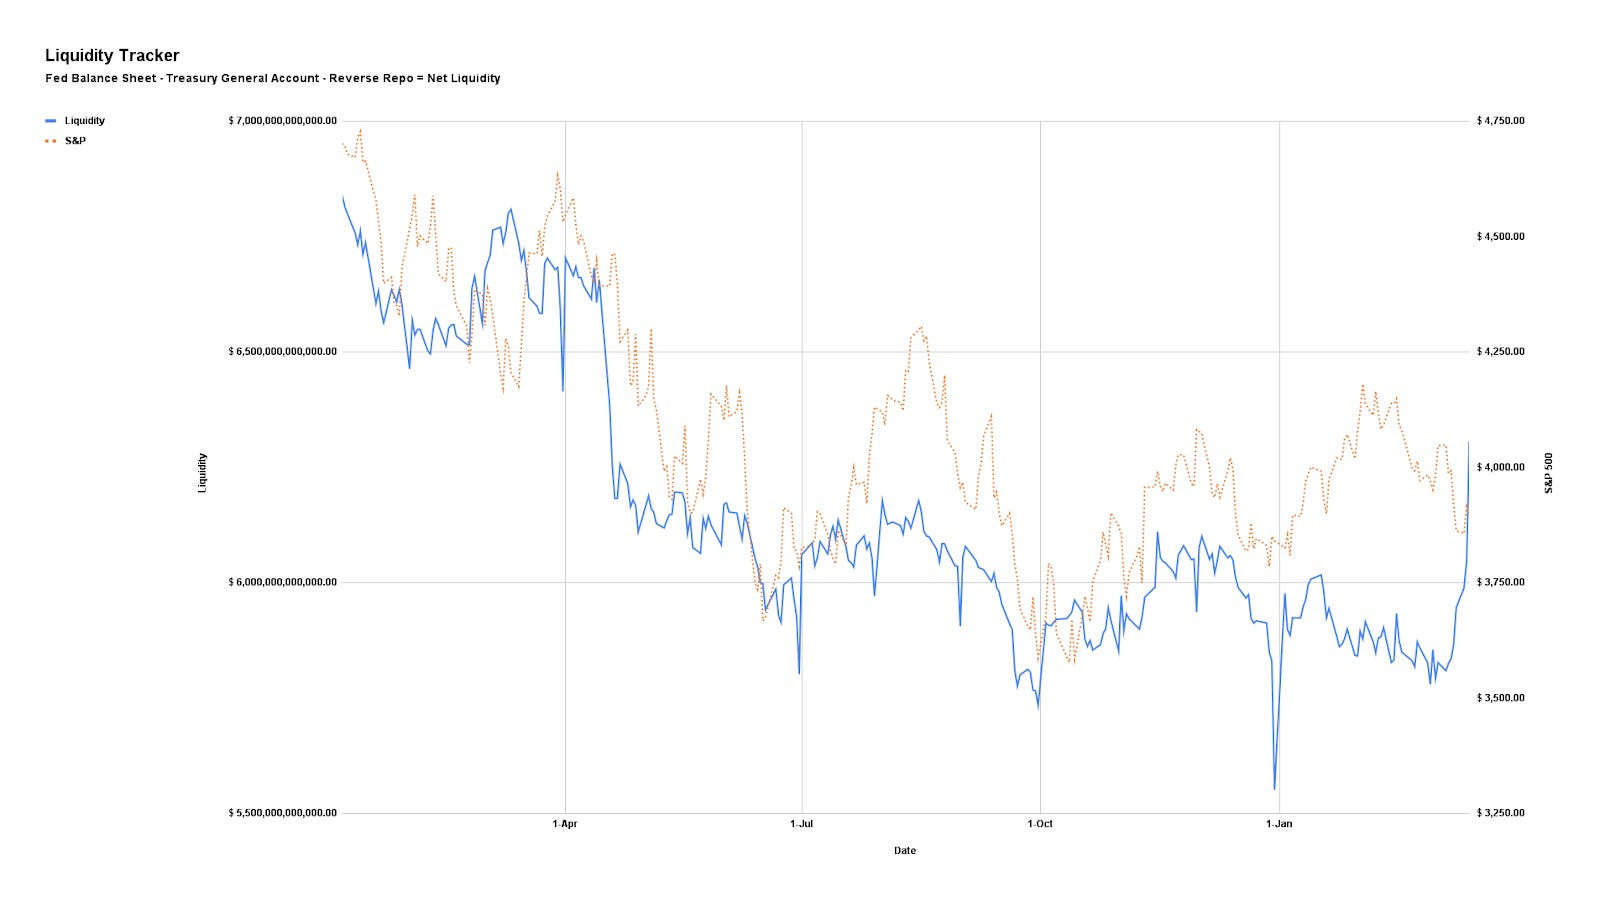
Further, research shows money is getting tighter, a headwind for the economy, while inflation is sticky and the Fed’s bond holdings are preventing tightening from being effective; WSJ reports the Fed’s balance sheet loaded with bonds may be insulating stocks from interest rate policies.
“Quantitative easing locked the Fed into a position that is difficult to unwind,” said Stephen Miran of Amberwave Partners. Quantitative easing, or QE, made stocks less sensitive to interest rates. “It’s made tightening both slower and less effective than it should have been.”
Graphic: Retrieved from Bloomberg. The Fed’s favorite measure of inflation, the core PCE index, has been consistently stuck around 4-5% since 2022. The employment cost index, which shows wage growth at around 4-5%, is inconsistent with a 2% inflation target.
Not “adjusting balance-sheet policy,” but raising rates to 5.00-5.25% as expected, ‘is akin to “hitting the same nail with a hammer over and over again.’” Therefore, stocks, which are higher alongside surprising economic and earnings data, though risky, can do “ok” for longer, comments Andy Constan of Damped Spring Advisors.
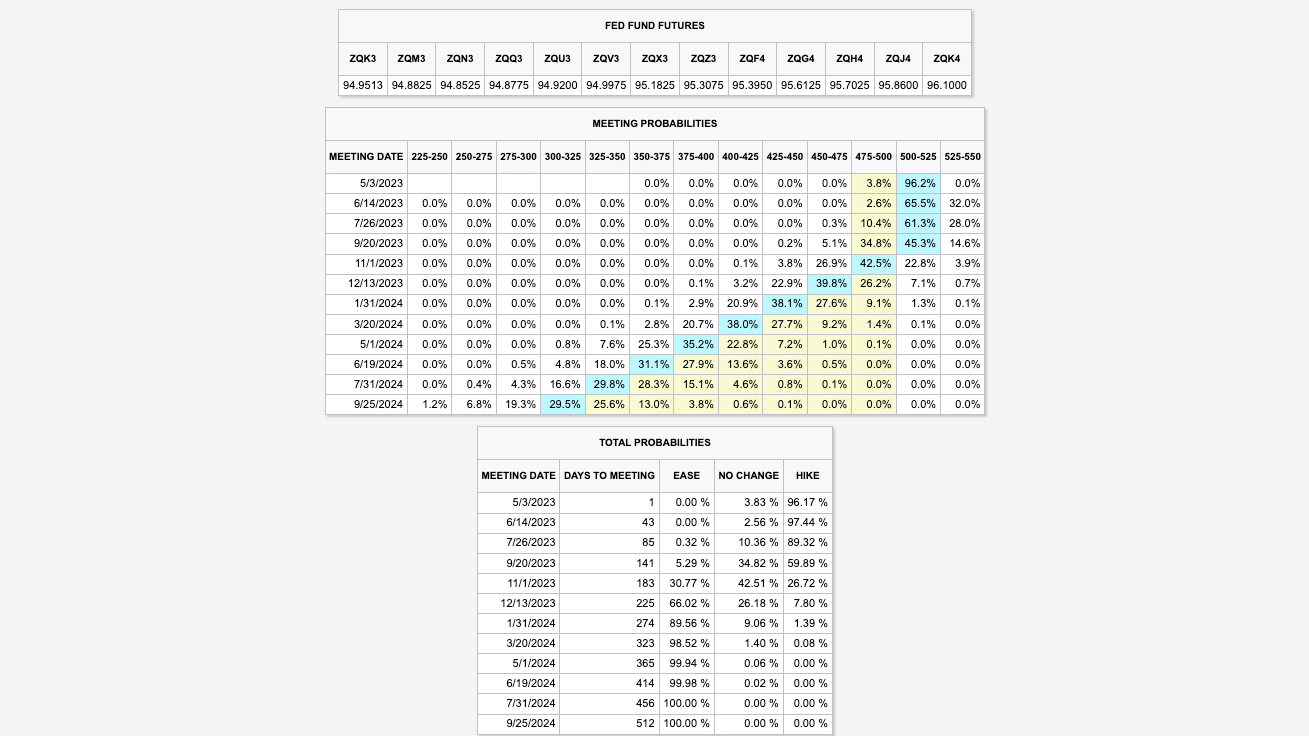
Graphic: Retrieved from CME Group Inc’s (NASDAQ: CME) FedWatch Tool.
The sale of volatility bolsters the stability and emboldens upside bettors, adds JPM’s Marko Kolanovic, who finds “selling of options forces intraday reversion, leaving the market price virtually unchanged many days.”
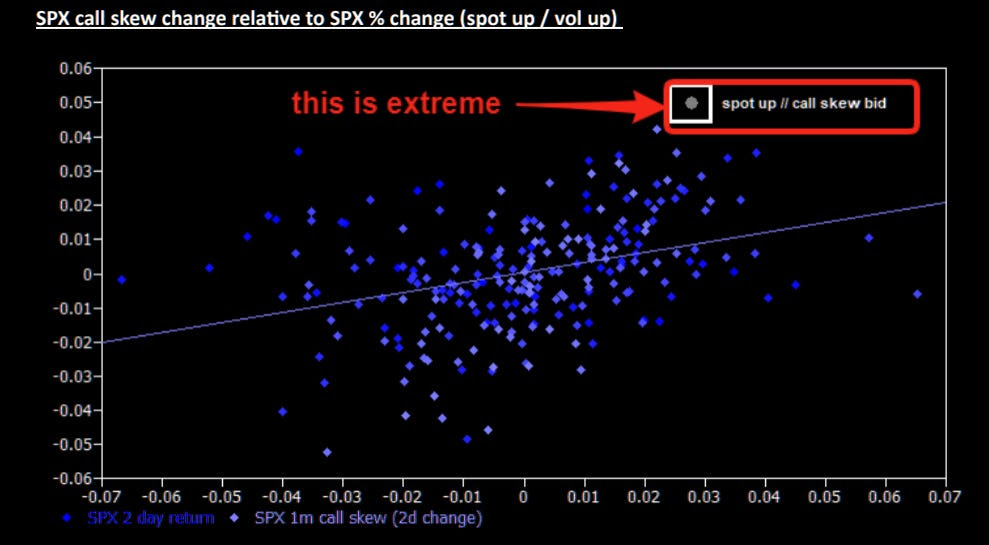
Graphic: Retrieved from Goldman Sachs Group Inc (NYSE: GS).
“This, in turn, drives buying of stocks by funds that mechanically increase exposure when volatility declines (e.g., volatility targeting and risk parity funds),” he elaborates. “This market dynamic artificially suppresses perceptions of fundamental macro risks. The low hurdle rate and robust fundamentals bode well for 1Q earnings results, but we advise using any market strength on reporting to reduce exposure.”
At this juncture, yes, stocks can move sideways or higher for a bit longer as a function of “momentum, not value,” Simplify Asset Management’s Michael Green concludes. Traders can position for this and various levels of potential upset later with structures included in a report we published last week.
About
Welcome to the Daily Brief by Physik Invest, a soon-to-launch research, consulting, trading, and asset management solutions provider. Learn about our origin story here, and consider subscribing for daily updates on the critical contexts that could lend to future market movement.
Separately, please don’t use this free letter as advice; all content is for informational purposes, and derivatives carry a substantial risk of loss. At this time, Capelj and Physik Invest, non-professional advisors, will never solicit others for capital or collect fees and disbursements. Separately, you may view this letter’s content calendar at this link.
Physik Invest’s Daily Brief is read free by thousands of subscribers. Join this community to learn about the fundamental and technical drivers of markets.
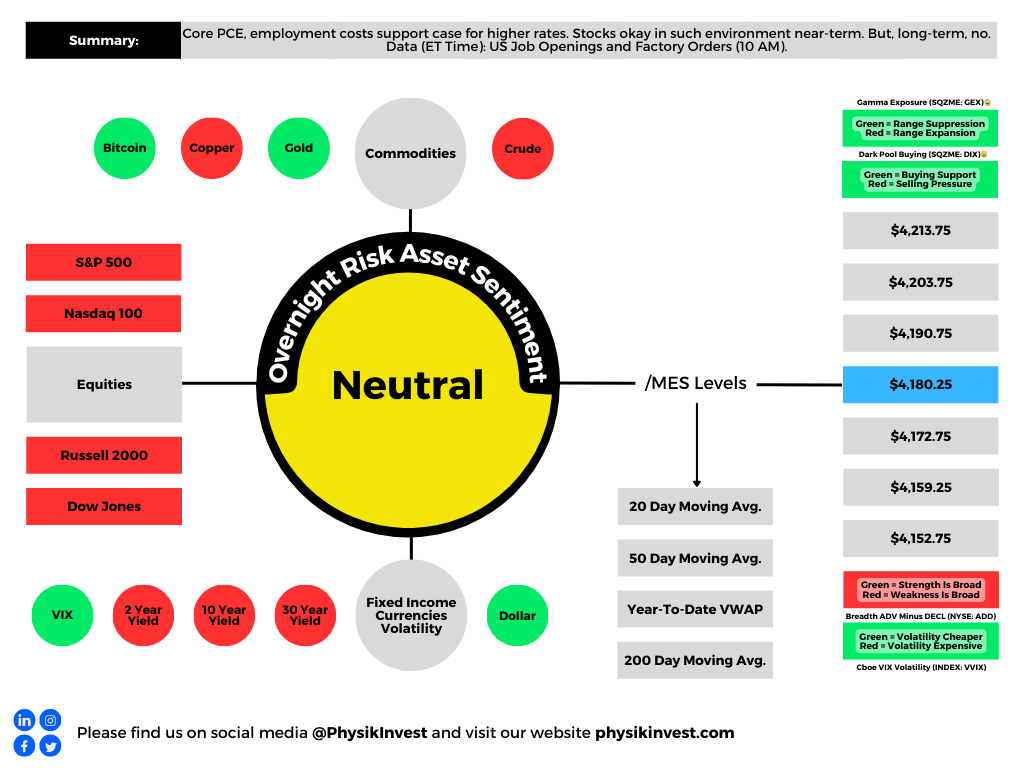
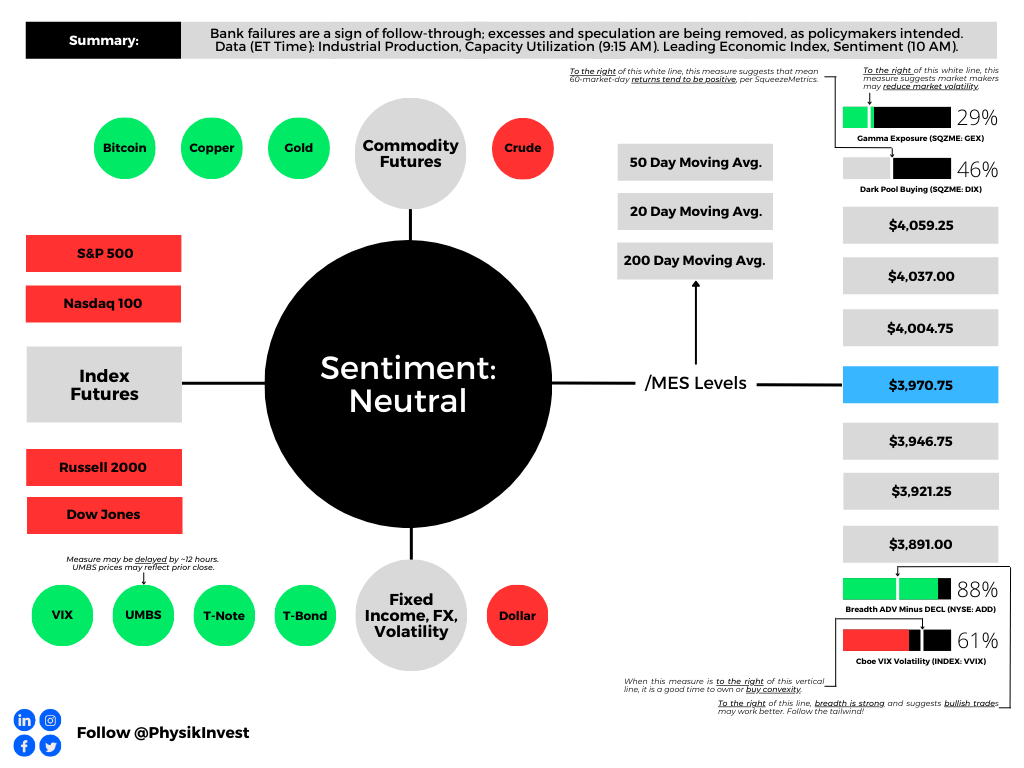
Graphic updated 8:50 AM ET. Sentiment Neutral if expected /MES open is inside of the prior day’s range. /MES levels are derived from the profile graphic at the bottom of this letter. Click here for the latest levels. SqueezeMetrics Dark Pool Index (DIX) and Gamma (GEX) with the latter calculated based on where the prior day’s reading falls with respect to the MAX and MIN of all occurrences available. A higher DIX is bullish. The lower the GEX, the more (expected) volatility. Click to learn the implications of volatility, direction, and moneyness. Breadth reflects a reading of the prior day’s NYSE Advance/Decline indicator. The CBOE VIX Volatility Index (INDEX: VVIX) reflects the attractiveness of owning volatility. UMBS prices via MND. Click here for the economic calendar.
Fundamental
Higher asset prices boosted household wealth and demand; consumers’ increased ability to spend more wealth pushed up inflation. If policymakers use their tools to lower household wealth and demand, this should cut down on inflation.
Kai Volatility’s Cem Karsan says the latter was a policy objective and recent financial institution failures are a sign of follow-through; excesses and speculation are being removed, as policymakers desired.
Policymakers don’t want liquidations, however. They want lower asset prices. Recent events put policymakers in an odd position after raising rates non-stop. In the Federal Reserve’s (Fed) case, and we paraphrase Karsan, policy/rates moved very quickly with little pause. With there being a lag, the Fed may want to pause and assess. However, they have to telegraph this carefully so that the market does not read it as a pivot. If the market rallies, that “makes things hotter,” Karsan says.
Before BTFP. Fire sale of assets from bank experiencing a run. Bank getting new deposit already has desired equity risk and no need to lever
After BTFP 1 year to sell assets of losing bank Bank getting new deposit already has desired equity risk and no need to lever
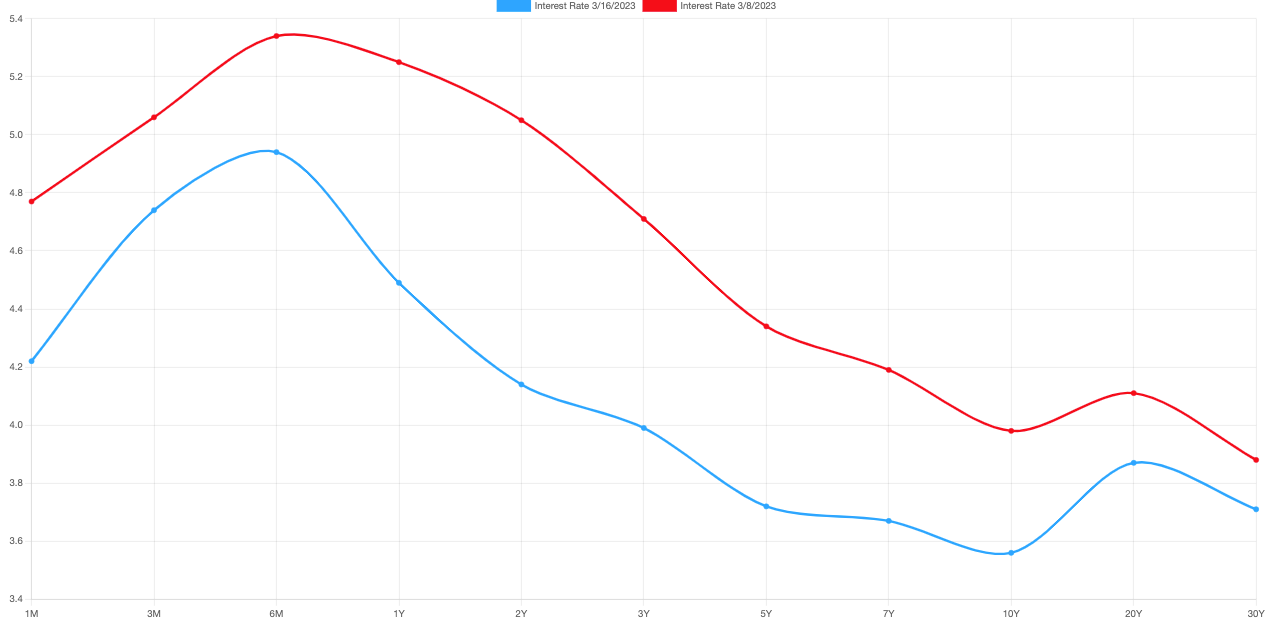
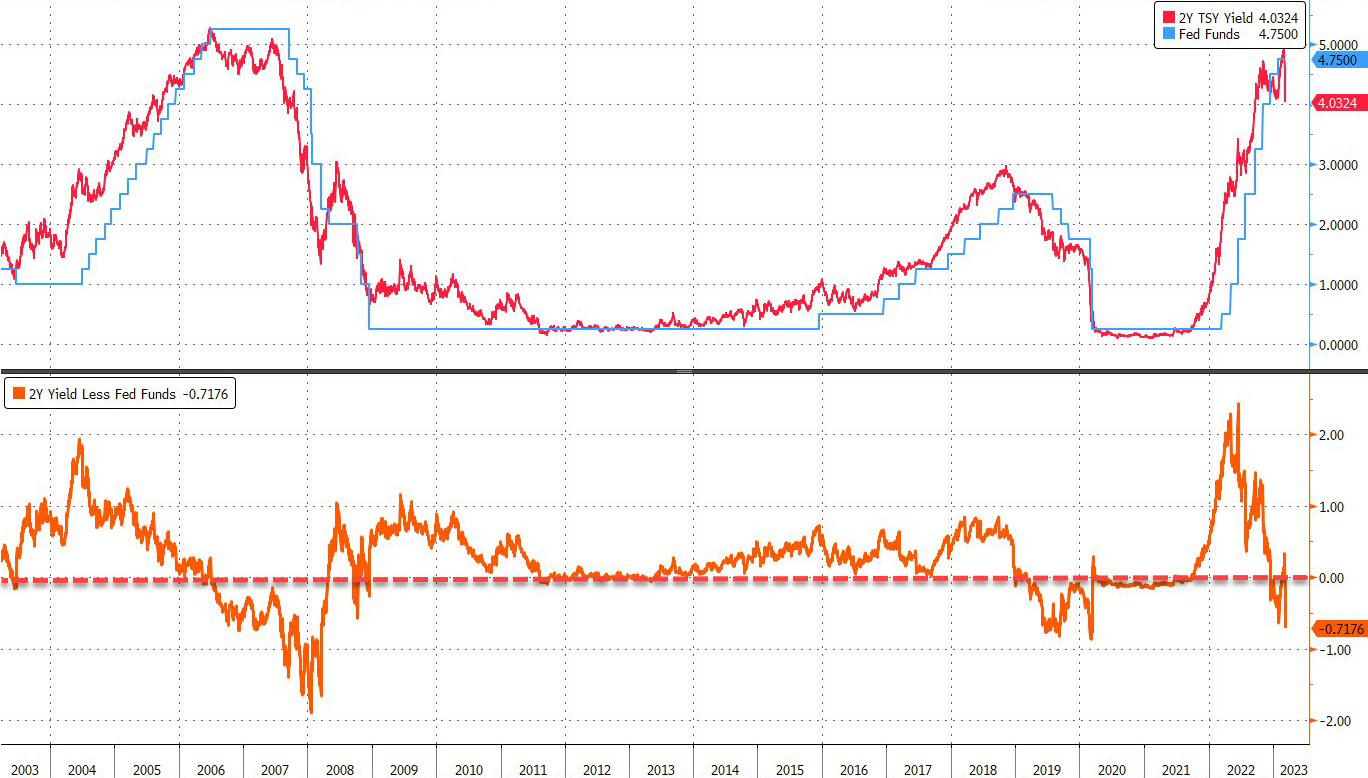
There’s already been an overreaction in the bond market, he adds, which is not ideal. The Fed does not want the long end of the yield curve to fall, as it has on the back of the turmoil and intervention, as well as data including housing starts which show more supply coming onto the market, likely a mortgage application booster in the near term.
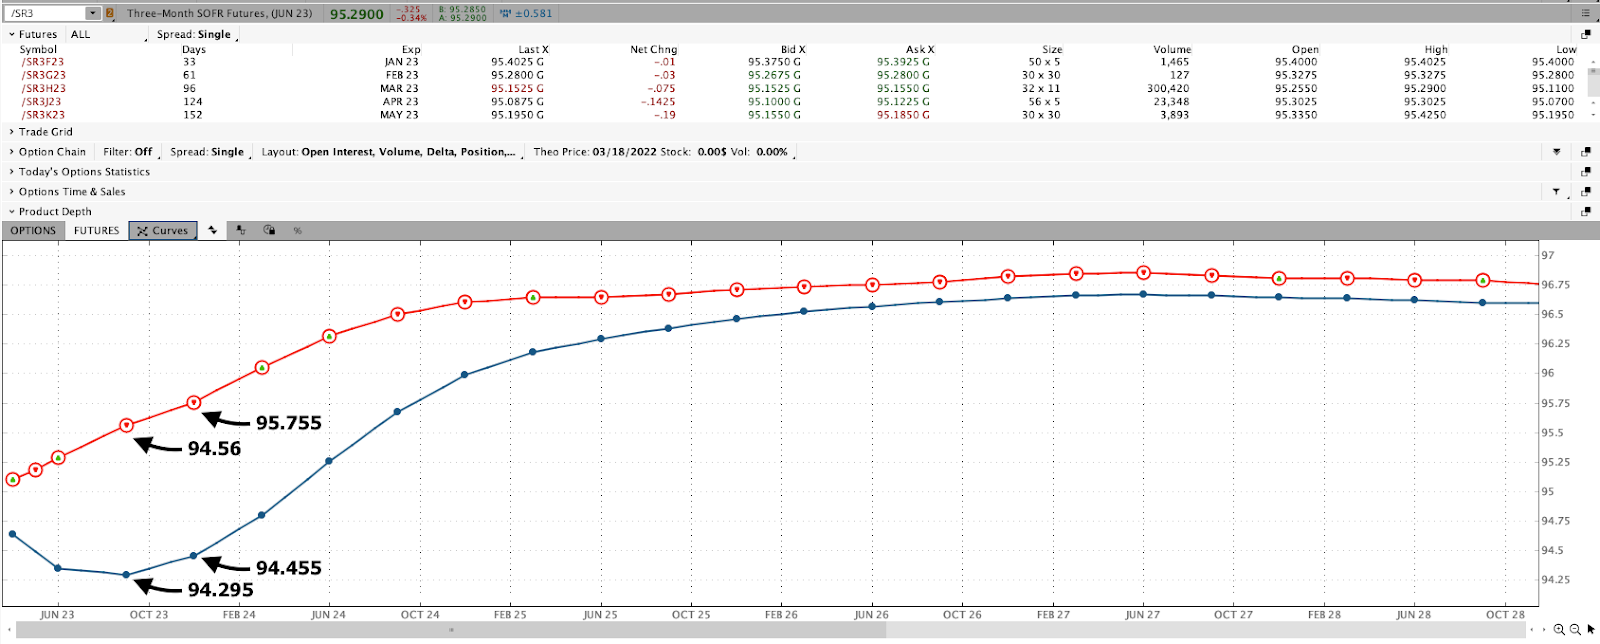
Even at the front end, there’s been lots of movement. This has “forc[ed] widespread risk liquidation,” Bloomberg says. Take a look at the Three-Month SOFR (FUTURE: /SR3), a tool used to hedge USD short-term interest rates.
Graphic: Retrieved from Charles Schwab Corporation-owned (NYSE: SCHW) TD Ameritrade’s thinkorswim platform.
The consensus, which Karsan agrees with, is that the Fed moves forward with a 25 basis point hike while telegraphing it wants the long end of the curve to rise or higher for longer as it is colloquially referred to.
Graphic: Retrieved from CME Group Inc’s (NASDAQ: CME) FedWatch Tool.
It is possible for the US policymakers to adopt a meeting-by-meeting stance, as their counterparts have in Europe, letting uncertainties regarding the likes of Credit Suisse Group AG (which just received a ~$54 billion or so liquidity backstop and is mulling a combination with other lenders), SVB Financial Group (NASDAQ: SVB) and First Republic Bank (NYSE: FRC) pan out.
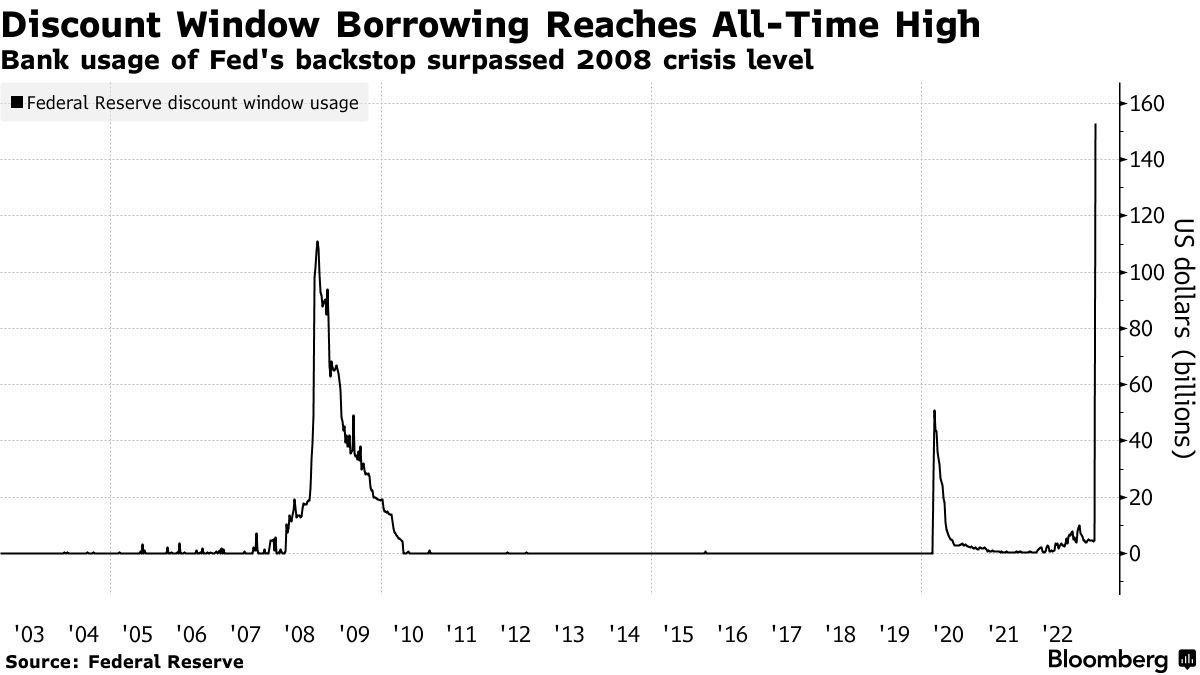
Graphic: Retrieved from Bloomberg. “[T]he credit extended through the two backstops show a banking system that is still fragile and dealing with deposit migration in the wake of the failure of Silicon Valley Bank of California and Signature Bank of New York last week.” Per John Authers: the phenomenal borrowing from the Fed’s discount window suggests that if these are just liquidity problems, they are widespread and serious. Further, the point of the exercise is to slow down the economy, which will in time tend to put pressure on banks’ solvency.”
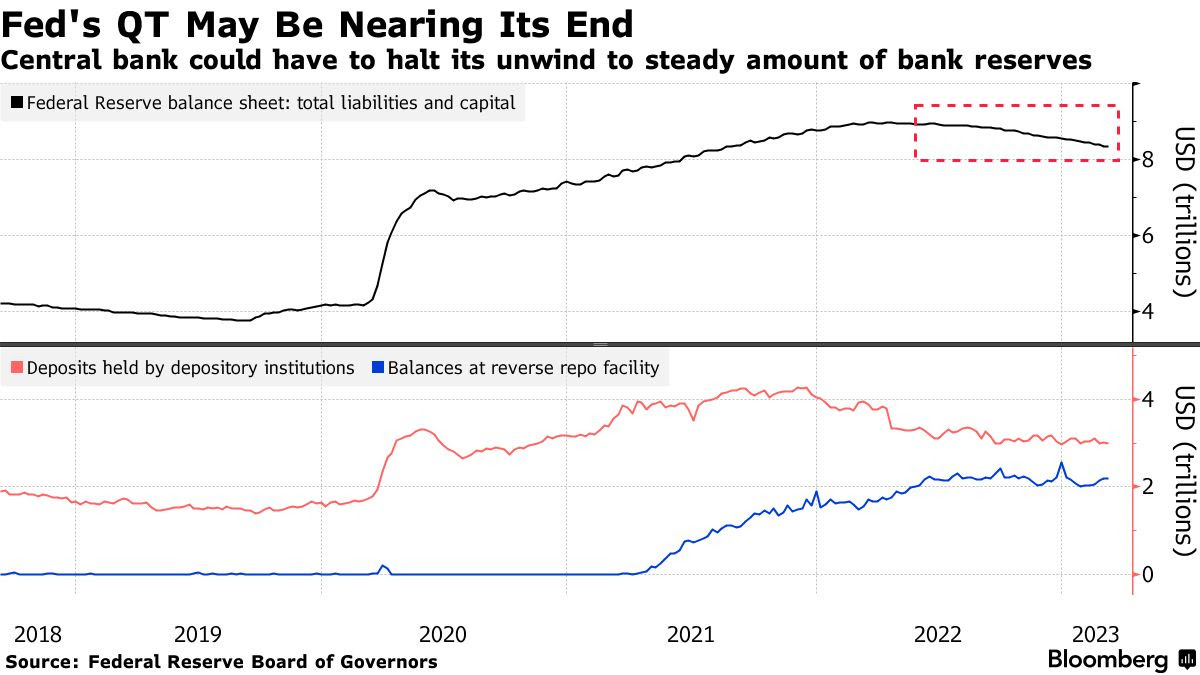
Pausing, or intending to pause explicitly, could raise inflation expectations or “boost the odds of a recession by spooking consumers and companies into believing that the economy is worse off than they thought,” Bloomberg explains, noting: “All told, the emergency loans reversed around half of the balance-sheet shrinkage that the Fed has achieved since it began so-called quantitative tightening — allowing its portfolio of assets to run down — in June last year.”
Graphic: Compiled by Physik Invest.Per Jefferies Financial Group Inc’s (NYSE: JEF) Christopher Wood: “2022 was the year when US equities suffered multiple contraction from monetary tightening. This year will be the year when earnings downgrades hit the stock market if the US recession forecast proves to be accurate. This is now the key issue in world financial markets. Then 2024 will be the year when markets will have to deal with the emerging credit problems in the private space.”
Positioning
Heading into this most recent market decline, investors foresaw increased volatility and were positioned for it as indicated by the pricing of tail risk and performance of implied volatility or IVOL (as investors continued to demand protection during this window of non-strength), said Laya Royer of Citadel Securities.
Recall that Kris Sidial warned us of this. Options, colloquially referred to as volatility, would serve as the only hedge in an environment wherein commodities, stocks, and bonds don’t combine or balance each other as well as they did in 2022.
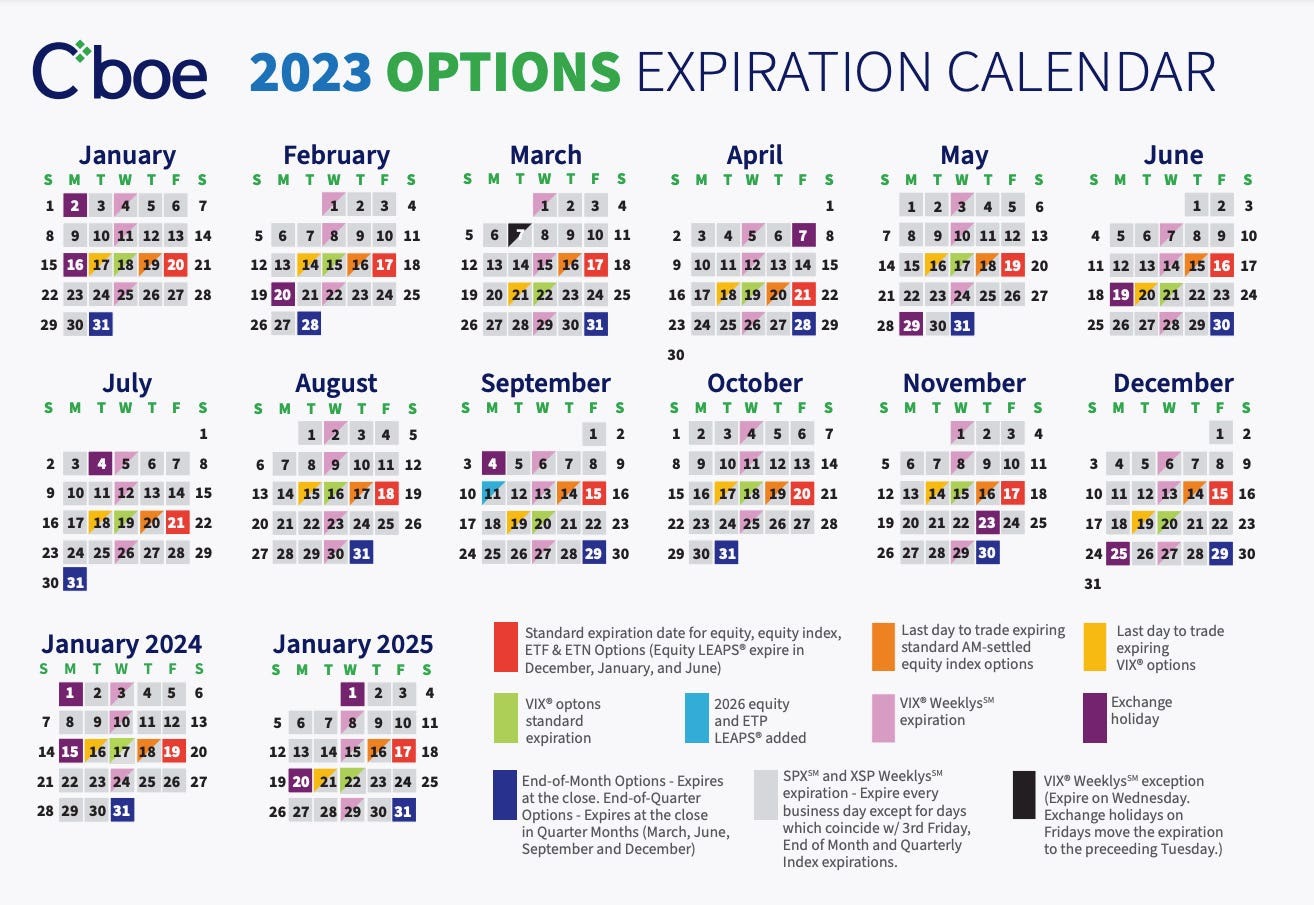
Now, there are options expirations (OpEx) nearing (March 16 and 31); monetization of profitable options structures, as well as volatility compression and options decay, have counterparties buying back their short stock and/or futures hedges (to the short put positions they have on), boosting the market (particularly the depressed and rate-sensitive Nasdaq 100) through this OpEx/triple witching window.
Graphic: Retrieved from Cboe Global Markets (BATS: CBOE).
Following this period, the “rollover” of existing positions may result in “price swings” that last, Bloomberg puts forth. “This quarterly expiry may help unpin the market.”
Structures proposed in the Daily Brief for March 14 may work in reducing portfolio downside while allowing you to participate directionally at less cost.
Technical
As of 8:50 AM ET, Friday’s regular session (9:30 AM – 4:00 PM ET), in the S&P 500, is likely to open in the lower part of a negatively skewed overnight inventory, inside of the prior day’s range, suggesting a limited potential for immediate directional opportunity.
The S&P 500 pivot for today is $3,970.75.
Key levels to the upside include $4,004.75, $4,037.00, and $4,059.25.
Key levels to the downside include $3,946.75, $3,921.25, and $3,891.00.
Disclaimer: Click here to load the updated key levels via the web-based TradingView platform. New links are produced daily. Quoted levels likely hold barring an exogenous development.
Graphic: 65-minute profile chart of the Micro E-mini S&P 500 (FUTURE: /MES) at the middle bottom.
Definitions
Volume Areas: Markets will build on areas of high-volume (HVNodes). Should the market trend for a period of time, this will be identified by a low-volume area (LVNodes). The LVNodes denote directional conviction and ought to offer support on any test.
If participants auction and find acceptance in an area of a prior LVNode, then future discovery ought to be volatile and quick as participants look to the nearest HVNodes for more favorable entry or exit.
POCs: Areas where two-sided trade was most prevalent in a prior day session. Participants will respond to future tests of value as they offer favorable entry and exit.
About
The author, Renato Leonard Capelj, spends the bulk of his time at Physik Invest, an entity through which he invests and publishes free daily analyses to thousands of subscribers. The analyses offer him and his subscribers a way to stay on the right side of the market.
You may view this letter’s content calendar at this link.
Disclaimer
Do not construe this newsletter as advice. All content is for informational purposes. Capelj and Physik Invest manage their own capital and will not solicit others for it.
Physik Invest’s Daily Brief is read free by thousands of subscribers. Join this community to learn about the fundamental and technical drivers of markets.
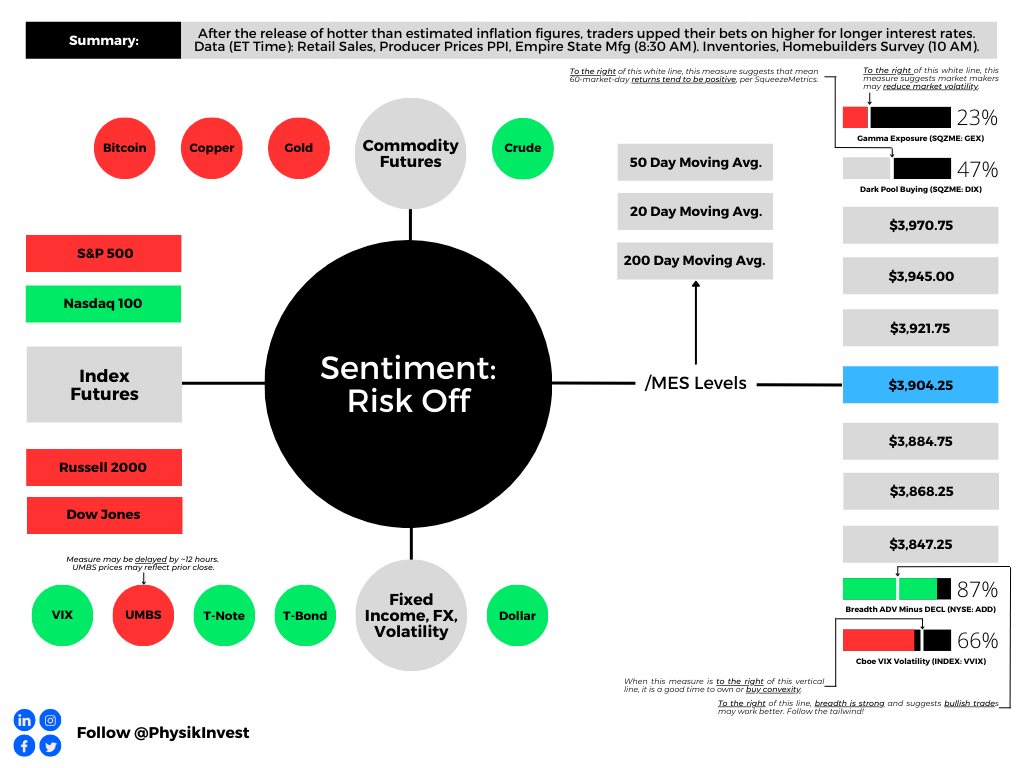
Graphic updated 6:15 AM ET. Sentiment Risk-Off if expected /MES open is below the prior day’s range. /MES levels are derived from the profile graphic at the bottom of this letter. Click here for the latest levels. SqueezeMetrics Dark Pool Index (DIX) and Gamma (GEX) with the latter calculated based on where the prior day’s reading falls with respect to the MAX and MIN of all occurrences available. A higher DIX is bullish. The lower the GEX, the more (expected) volatility. Click to learn the implications of volatility, direction, and moneyness. Breadth reflects a reading of the prior day’s NYSE Advance/Decline indicator. The CBOE VIX Volatility Index (INDEX: VVIX) reflects the attractiveness of owning volatility. UMBS prices via MND. Click here for the economic calendar.
Administrative
As indicated yesterday, through the end-of-this week, newsletters may be shorter due to the letter writer’s commitments. Therefore, please read the Daily Brief for March 14, if you haven’t already, for a big discussion on bond and equity market volatility, as well as the odds of the market falling apart or rising, and positioning contexts that support that movement. If there are any incomplete statements below, we shall complete them in the coming letters. We’re laying it all out for awareness. Take care!
Fundamental
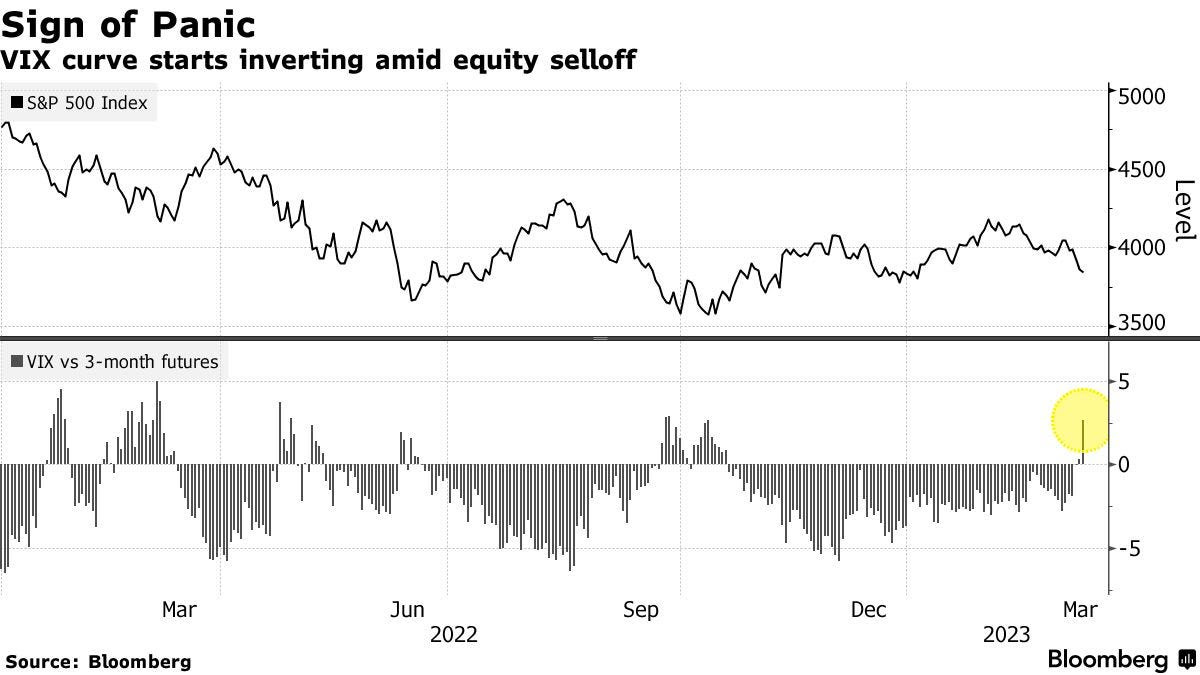
Headline inflation via CPI (Consumer Price Index) fell most on energy and core goods while shelter, food, and services inflation continues to be sticky. Core prices continue to be high, risking “inflationary psychology [] becoming ingrained,” Bloomberg’s John Authers explains.
“There’s nothing in this report to suggest that inflation is defeated already,” explained Authers. “Not to raise the fed funds rate next week, with median inflation above 7%, would be a sign of panic,” and an acknowledgment of uncertainties with regard to the banking system, as talked about in the Daily Brief on March 14.
To note, however, contagion appears contained, despite Moody’s Corporation (NYSE: MCO) cutting its outlook for the banking system to negative from stable, and placing lenders including First Republic Bank (NYSE: FRC) on a downgrade review.
JPMorgan Chase & Co’s (NYSE: JPM) Marko Kolanovic did cut his equity allocation warning that not all carry trades, something this letter has talked about numerous times before (i.e., borrow at a low rate and invest in something that provides higher return), can be bailed out. Kolanovic appears worried about commercial real estate, which Simplify Asset Management’s Michael Green just told your letter writer is in a bubble that “we’re seeing crack,” finally.
Graphic: Retrieved from Bloomberg. The Federal Reserve’s new Bank Term Funding Program or BTFP is “QE in another name – assets will grow on the Fed balance sheet which will increase reserves.” Recall that QE is the flow of capital into capital markets while QT is the opposite. Q is for quantitative while E is for easing and T is for tightening.
Anyways, following yesterday’s CPI, traders price higher odds of a 25 basis point hike which puts the terminal or peak fed funds rate at 4.75-5.00%. Following this spring, factoring potential inflation plateau and financial system uncertainties, traders foresee the Fed easing. By year-end, traders expect rates to fall down to 3.75-4.00%. Recall that at the beginning of last week, there were no expectations of easing in 2023. Also, traders thought the Fed would raise as high as 5.50-5.75%.
Mortgage rates, determined by changes in the price of mortgage-backed securities or MBSs, fell too.
ARK Invest’s Cathie Wood, who your letter writer had the honor of interviewing in person for Benzinga articles, thinks we’re on the cusp of the “roaring twenties” as inflation “is likely to surprise on the low side of expectations” with the banking crisis also leading to “bad deflation.”
“Today, five major innovation platforms are evolving at the same time – multiomics sequencing, robotics, energy storage, artificial intelligence, and blockchain technology, all of which are converging,” she elaborates.
“Once the Fed stops looking backward at CPI inflation and starts addressing the deflationary banking crisis that a 19-fold increase in short rates and an inverted yield have caused, we would not be surprised to see a return to the Roaring Twenties.”
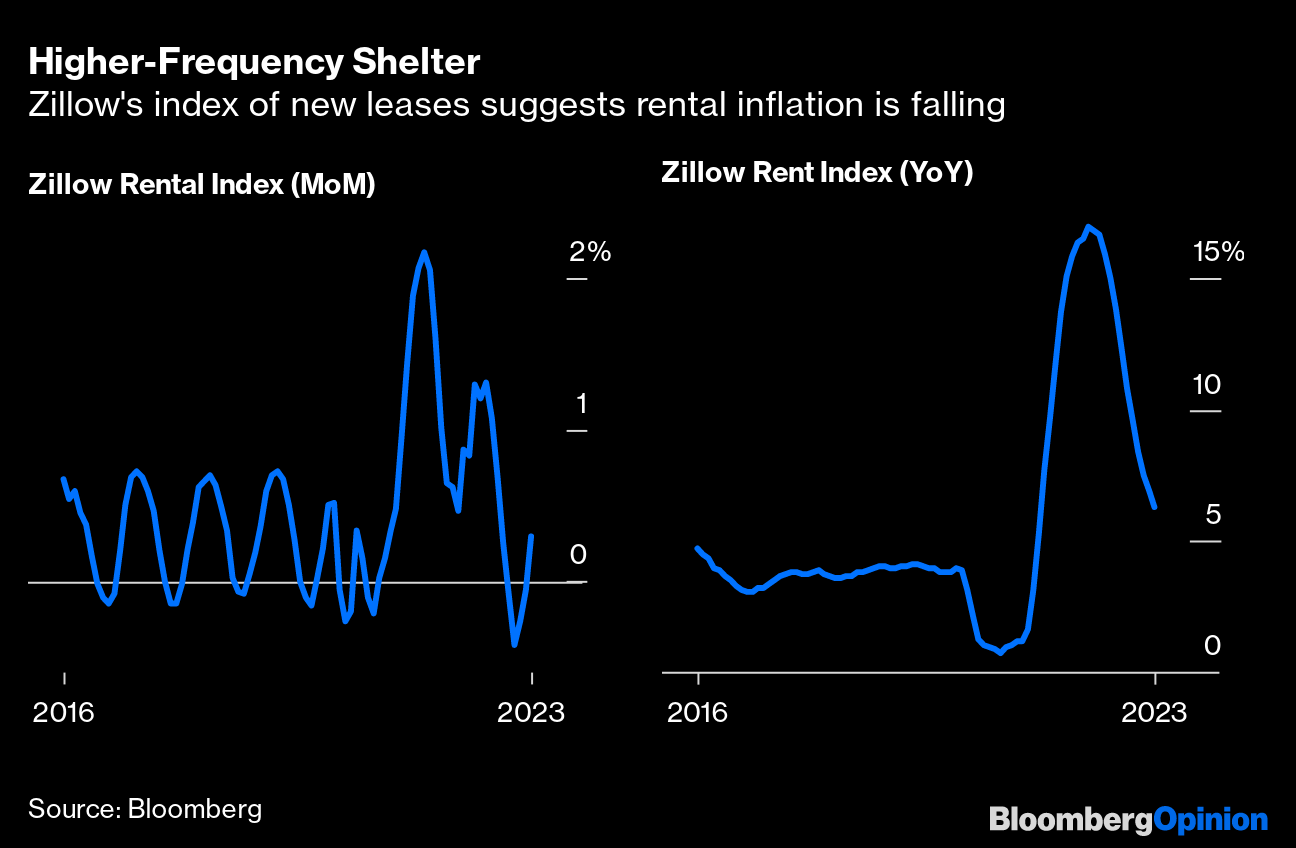
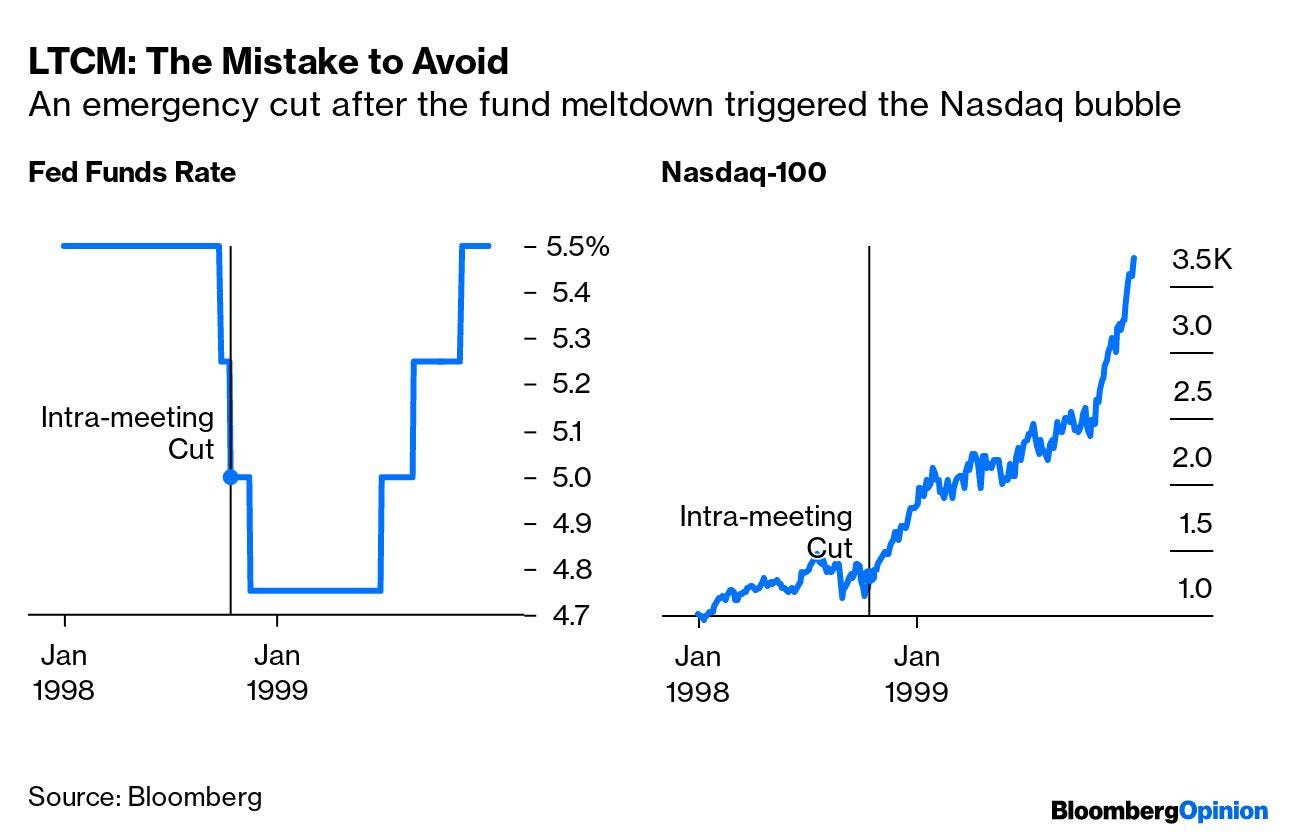
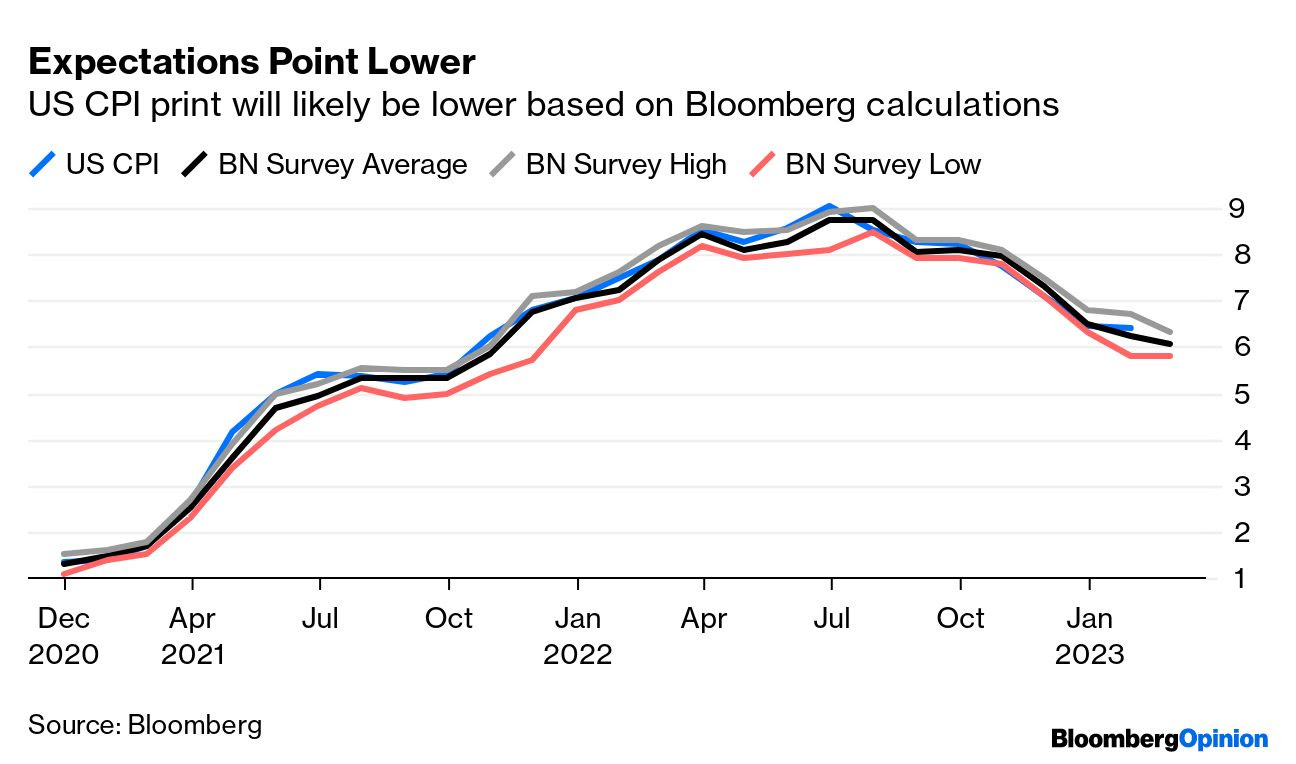
Graphic: Retrieved from Bloomberg.
On the backward-looking measures quote in the above paragraph, former Fed trader Joseph Wang notes that the Fed and central banks, in general, are aware segments of the market may break, but that won’t discourage them from tightening further.
“As the BOE saved the gilt market through purchases and kept tightening, so the Fed can save banks and keep tightening.”
Positioning
Tuesday’s letter said that following important events like CPI, the compression of wound implied volatility or IVOL, coupled with the nearing large options expirations (OpEx), sets the market up for potential short bursts of strength into the end of the month and next month.
That’s along the lines of what is happening. The S&P 500 rose mechanically after the release of CPI yesterday. Later, though the index succumbed, internally speaking the market remained strong through end-of-day, hence some short bursts boosted by some short-dated options activities, also.
As explained, yesterday, the recent re-grossing theme appears intact. Any further compression of wound IVOL and the passage of options expirations (OpEx) could support equities as month-end approaches. Though it may be too early to position for strength, one may consider it the way it was explained in the Daily Brief on March 14.
Technical
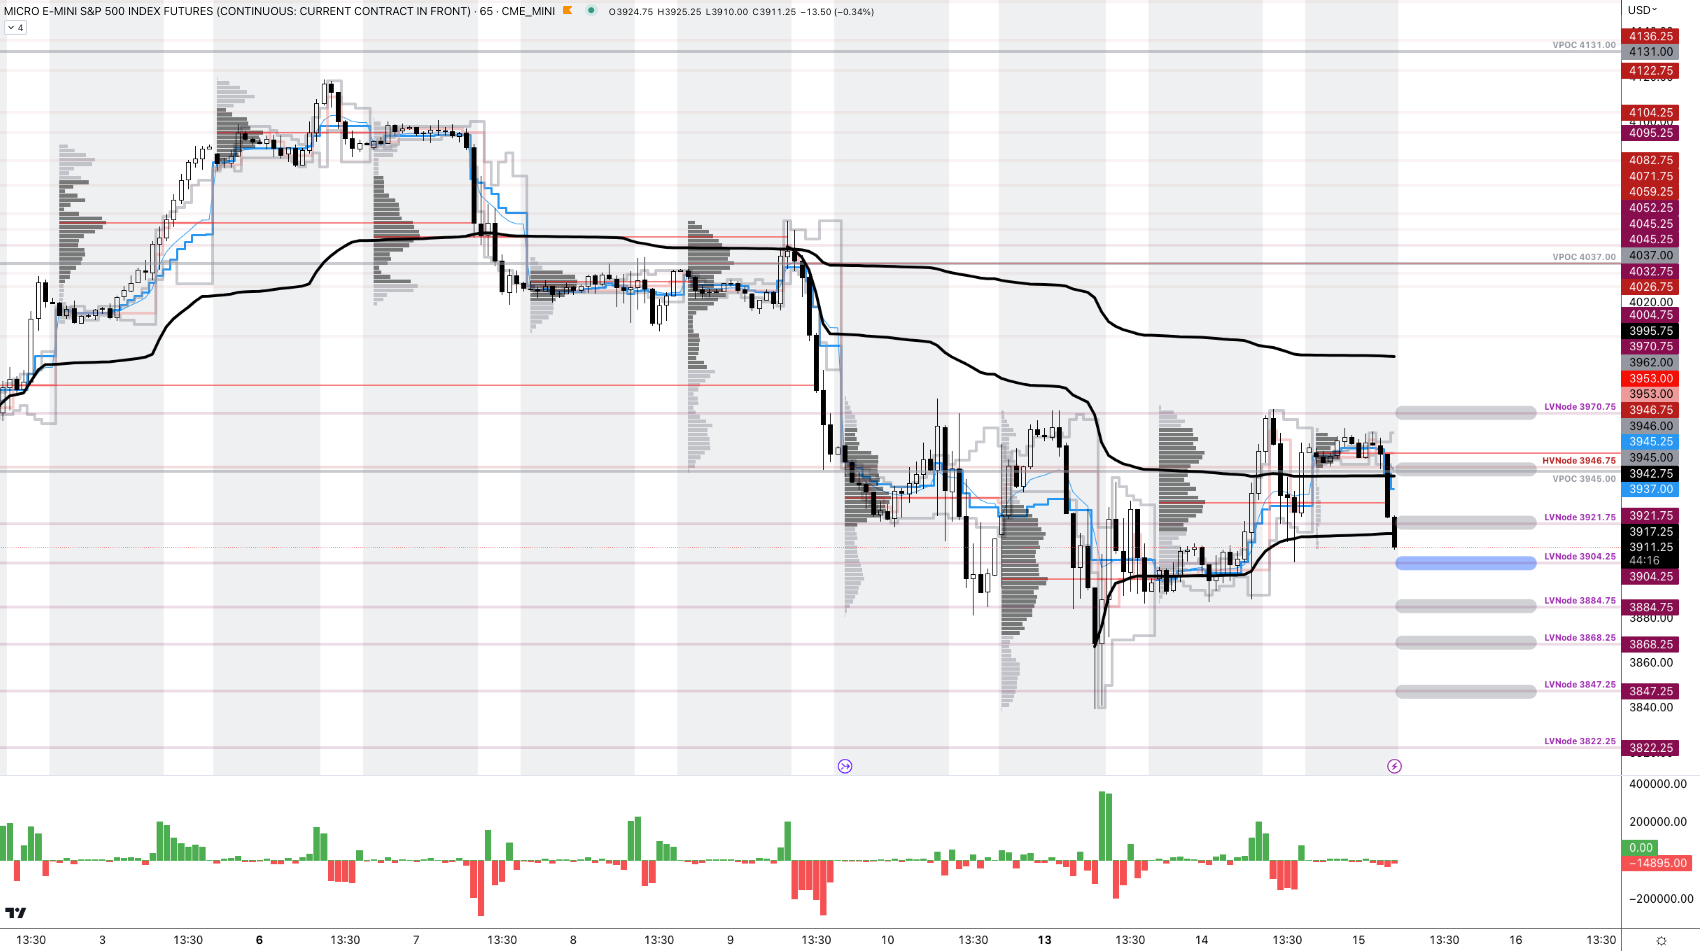
As of 6:15 AM ET, Wednesday’s regular session (9:30 AM – 4:00 PM ET), in the S&P 500, is likely to open in the middle part of a negatively skewed overnight inventory, inside of the prior day’s range, suggesting a limited potential for immediate directional opportunity.
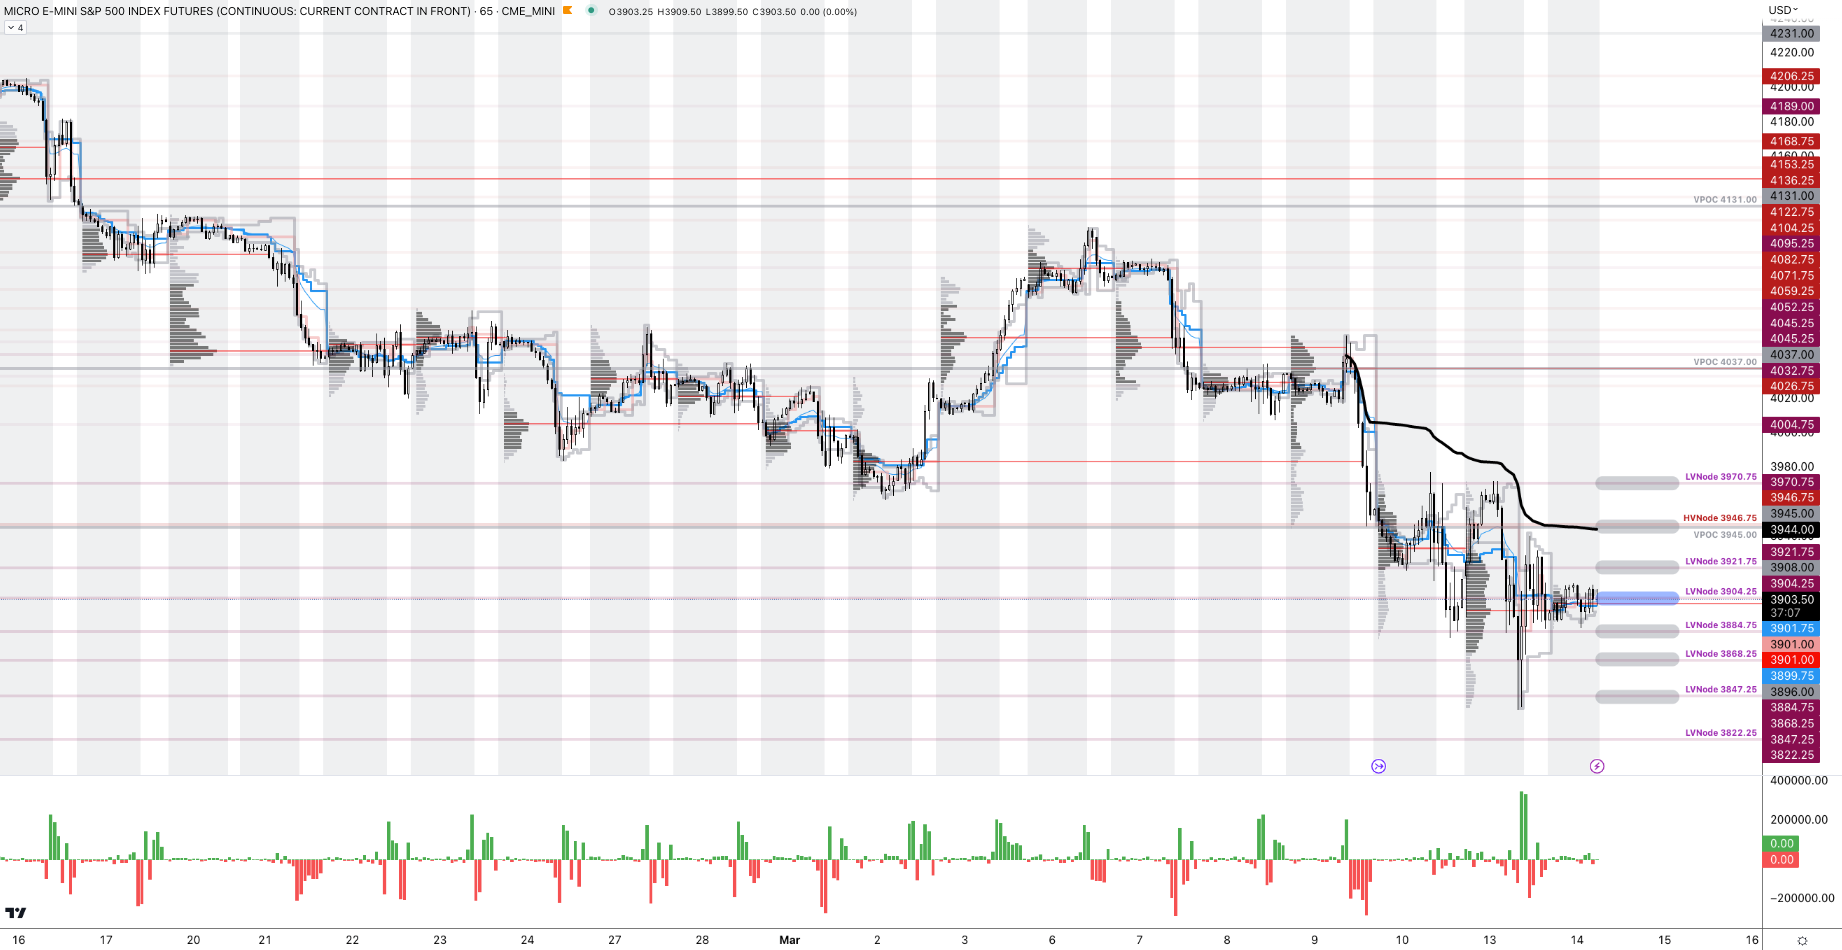
The S&P 500 pivot for today is $3,904.25.
Key levels to the upside include $3,921.75, $3,945.00, and $3,970.75.
Key levels to the downside include $3,884.75, $3,868.25, and $3,847.25.
Disclaimer: Click here to load the updated key levels via the web-based TradingView platform. New links are produced daily. Quoted levels likely hold barring an exogenous development.
Graphic: 65-minute profile chart of the Micro E-mini S&P 500 Futures.
Definitions
Volume Areas: Markets will build on areas of high-volume (HVNodes). Should the market trend for a period of time, this will be identified by a low-volume area (LVNodes). The LVNodes denote directional conviction and ought to offer support on any test.
If participants auction and find acceptance in an area of a prior LVNode, then future discovery ought to be volatile and quick as participants look to the nearest HVNodes for more favorable entry or exit.
POCs: Areas where two-sided trade was most prevalent in a prior day session. Participants will respond to future tests of value as they offer favorable entry and exit.
Volume-Weighted Average Prices (VWAPs): A metric highly regarded by chief investment officers, among other participants, for quality of trade. Additionally, liquidity algorithms are benchmarked and programmed to buy and sell around VWAPs.
About
The author, Renato Leonard Capelj, spends the bulk of his time at Physik Invest, an entity through which he invests and publishes free daily analyses to thousands of subscribers. The analyses offer him and his subscribers a way to stay on the right side of the market.
You may view this letter’s content calendar at this link.
Disclaimer
Do not construe this newsletter as advice. All content is for informational purposes. Capelj and Physik Invest manage their own capital and will not solicit others for it.
Physik Invest’s Daily Brief is read free by thousands of subscribers. Join this community to learn about the fundamental and technical drivers of markets.
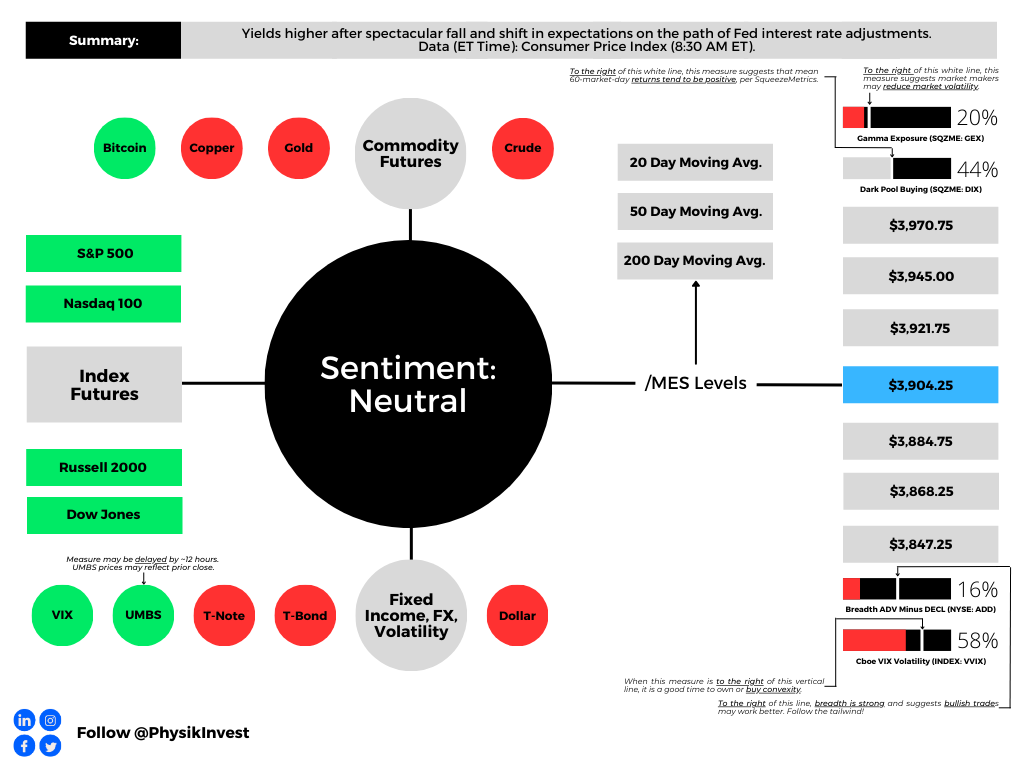
Graphic updated 6:30 AM ET. Sentiment Neutral if expected /MES open is inside of the prior day’s range. /MES levels are derived from the profile graphic at the bottom of this letter. Click here for the latest levels. SqueezeMetrics Dark Pool Index (DIX) and Gamma (GEX) with the latter calculated based on where the prior day’s reading falls with respect to the MAX and MIN of all occurrences available. A higher DIX is bullish. The lower the GEX, the more (expected) volatility. Click to learn the implications of volatility, direction, and moneyness. Breadth reflects a reading of the prior day’s NYSE Advance/Decline indicator. The CBOE VIX Volatility Index (INDEX: VVIX) reflects the attractiveness of owning volatility. UMBS prices via MND. Click here for the economic calendar.
Administrative
A long(er) letter, today. Through the end-of-this week, newsletters may be shorter due to the letter writer’s commitments. Take care!
Fundamental
Yesterday’s letter focused on the SVB Financial Group (NASDAQ: SIVB) failure, albeit with an optimistic tone. In short, the bank could not make good on fast accelerating withdrawals. Read more here.
According to one TechCrunch article, the likes of Founders Fund “reportedly advised their portfolio companies … to withdraw their money, … [and], if everybody is telling each other that SVB is in trouble, that will be a challenge,” as it was.
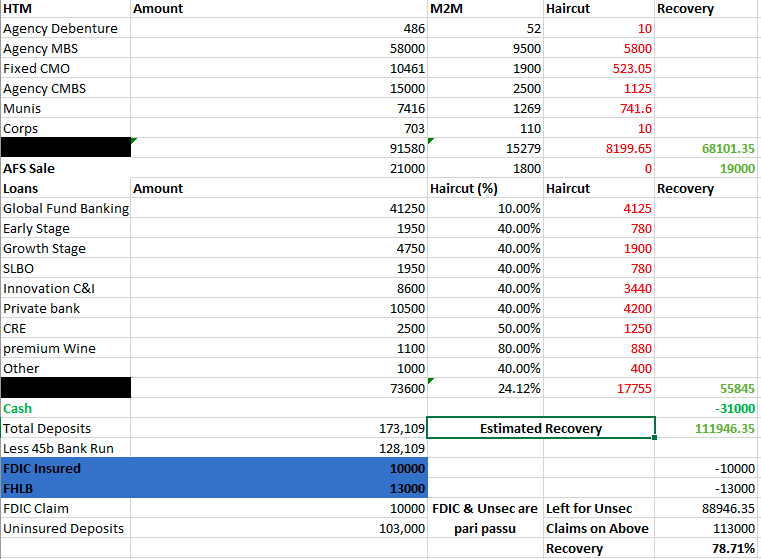
Graphic: Retrieved from @Citrini7. In the worst-case scenario, it was likely that uninsured depositors at SIVB would have received $0.80 on each dollar barring a bailout.
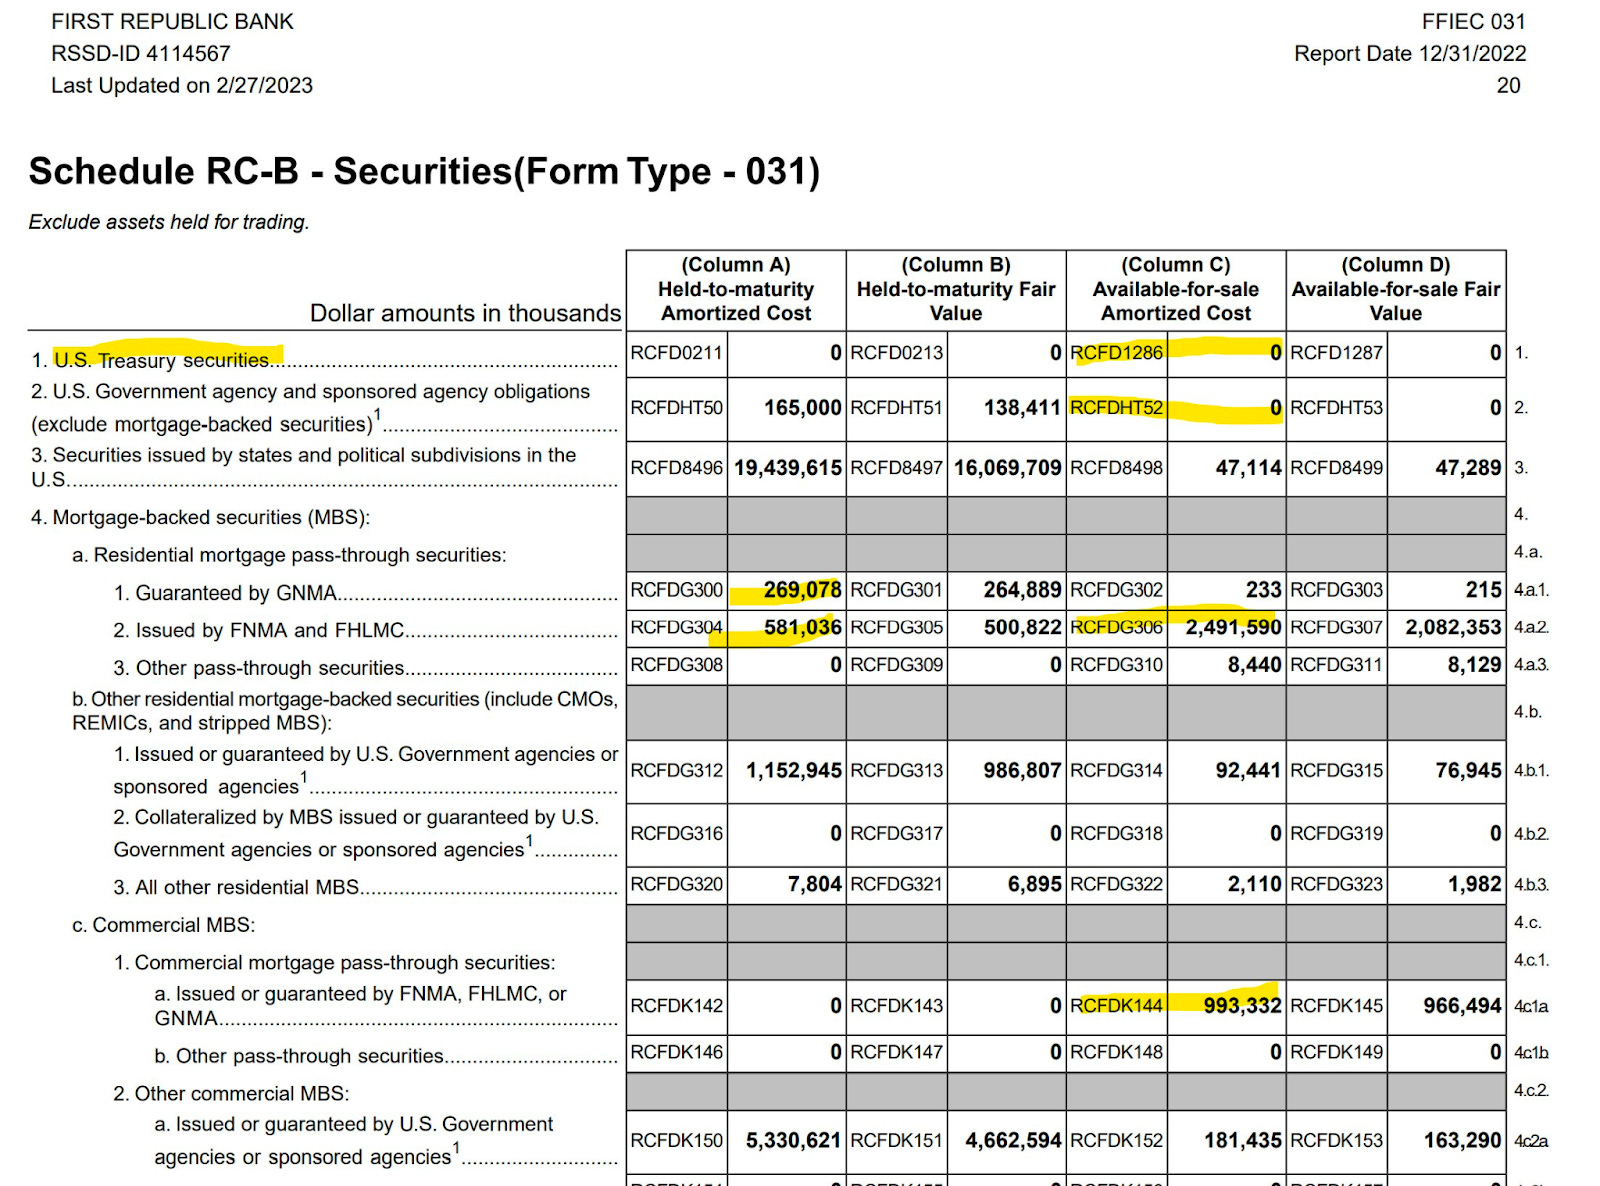
Authorities later put forth emergency measures guaranteeing all deposits. The effort shored up confidence in the banking system and markets strengthened, though some regional names such as First Republic Bank (NYSE: FRC) continued trading weak. In FRC’s case, the Federal Reserve’s (Fed) new bailout facility does not help. As former Fed trader Joseph Wang explains, “you need Treasuries and Agency MBS to tap the facility, and [FRC] barely owns any.”
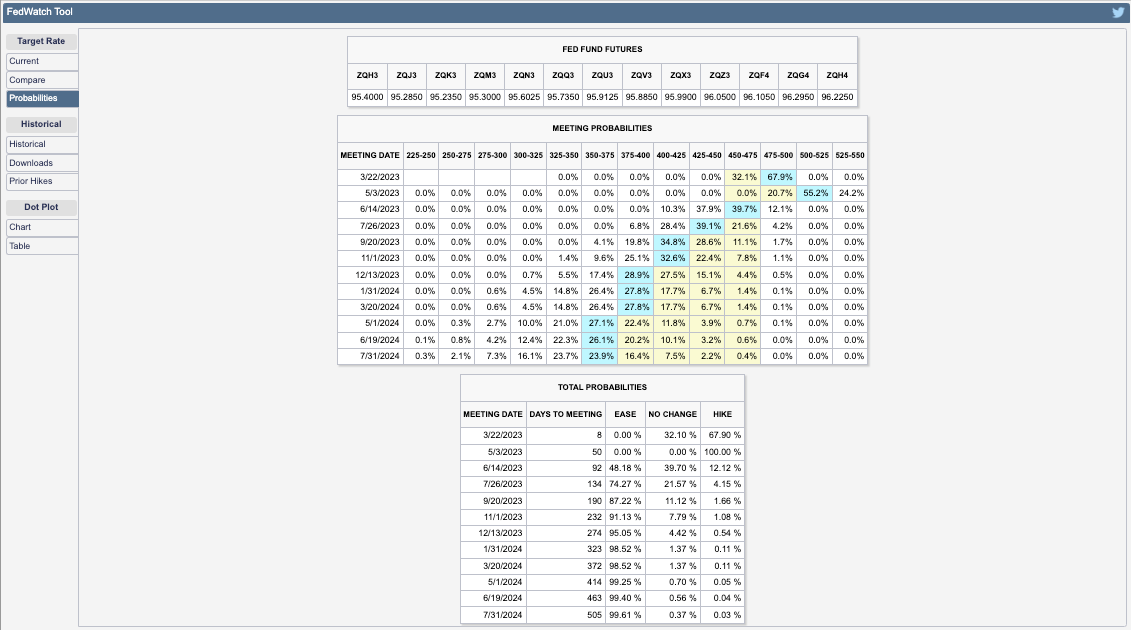
Anyways, as yesterday’s letter briefly mentioned, expectations on the path of Fed Funds shifted. Traders put the terminal/peak rate at 5.00-5.25%, down from 5.50-5.75%, while pricing cuts after spring. Previously, no cuts were expected in 2023.
Graphic: Retrieved from CME Group Inc’s (NASDAQ: CME) FedWatch Tool.
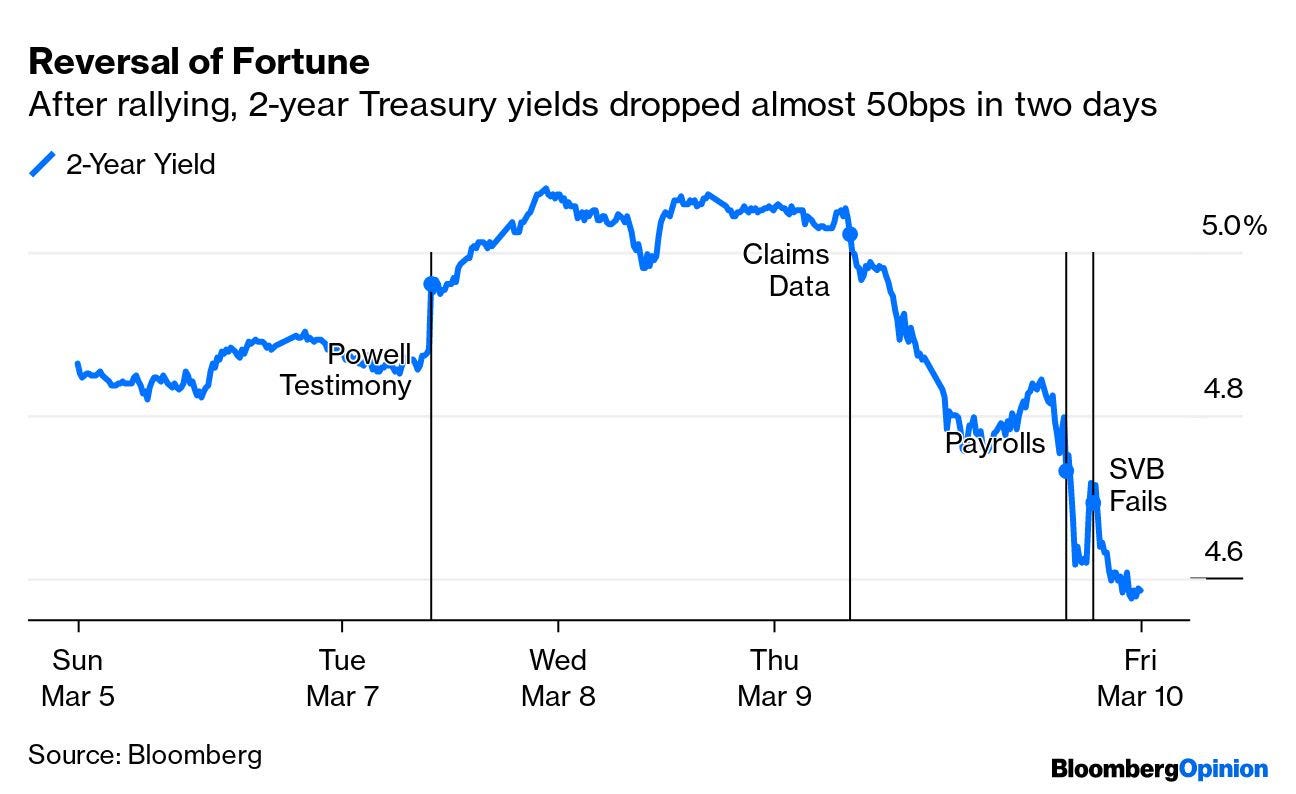
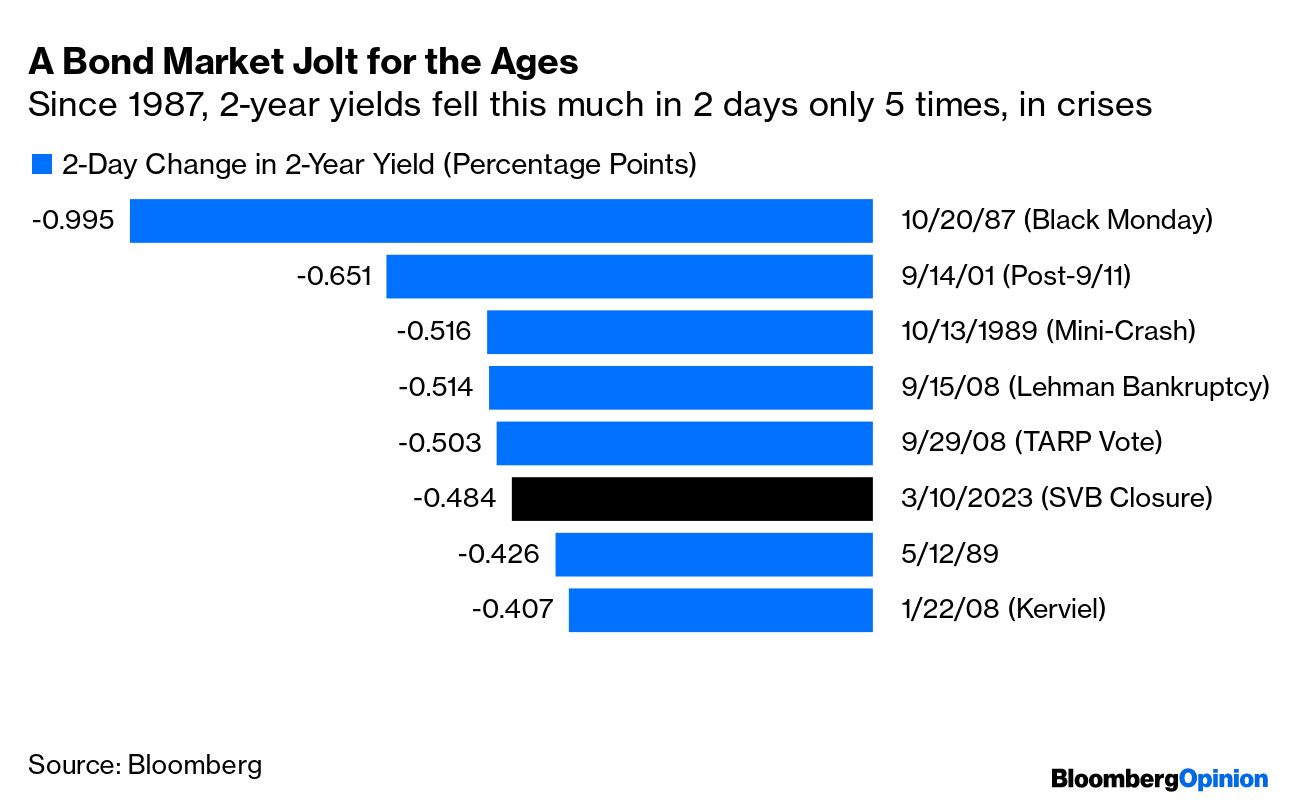
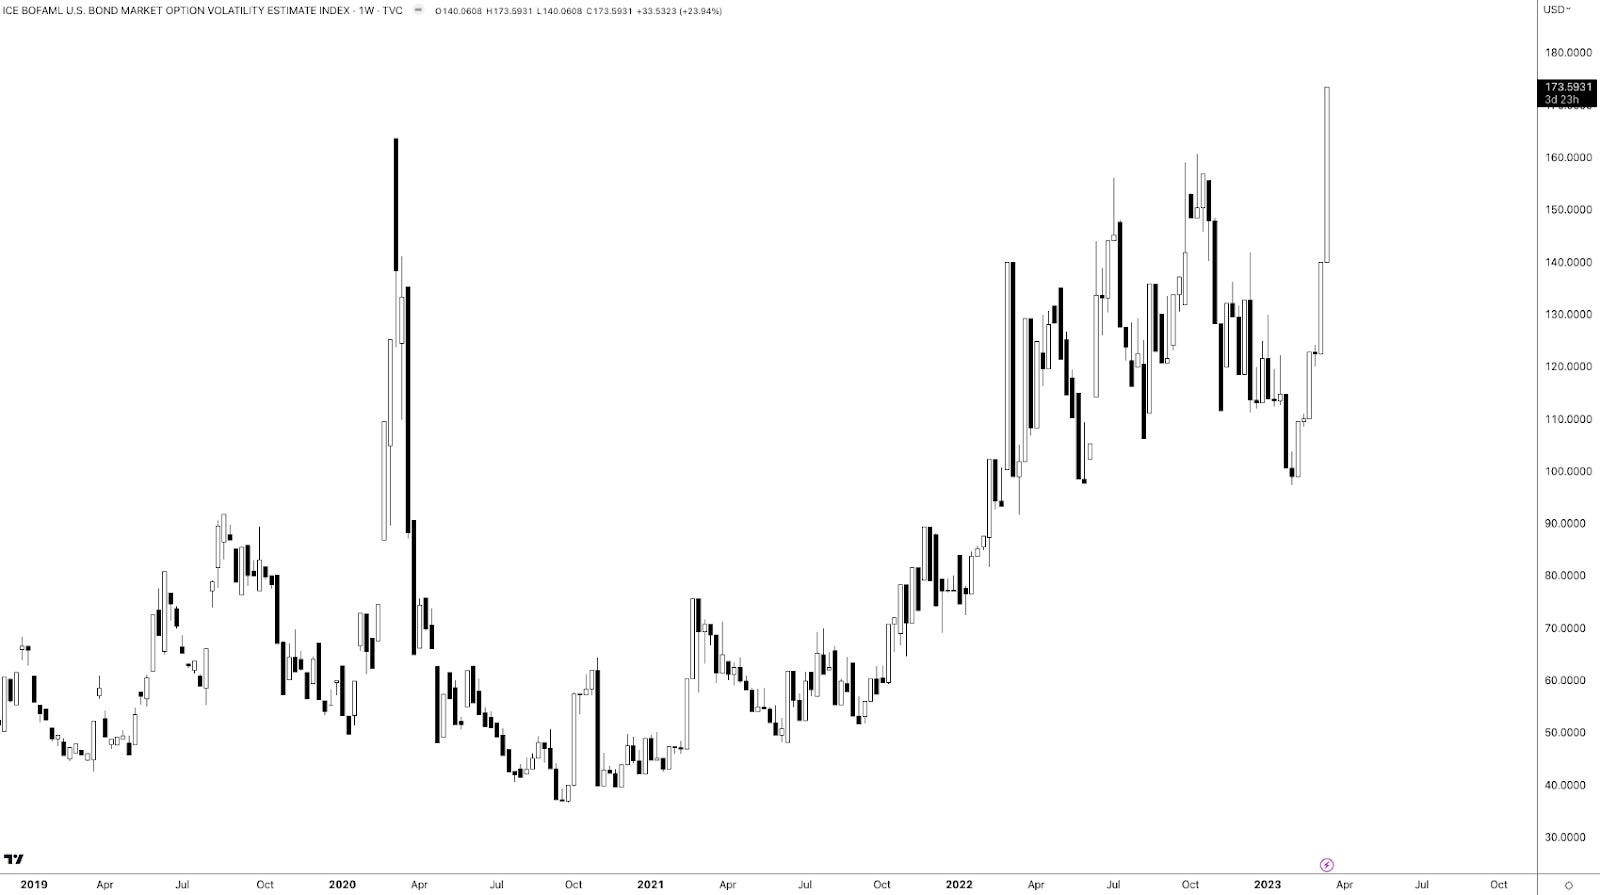
Measures of US Treasury yield volatility implied by options (i.e., bets or hedges on or against market movement) adjusted higher, accordingly. This is often a harbinger of equity market volatility.
Graphic: Merrill Lynch Option Volatility Estimate retrieved from TradingView
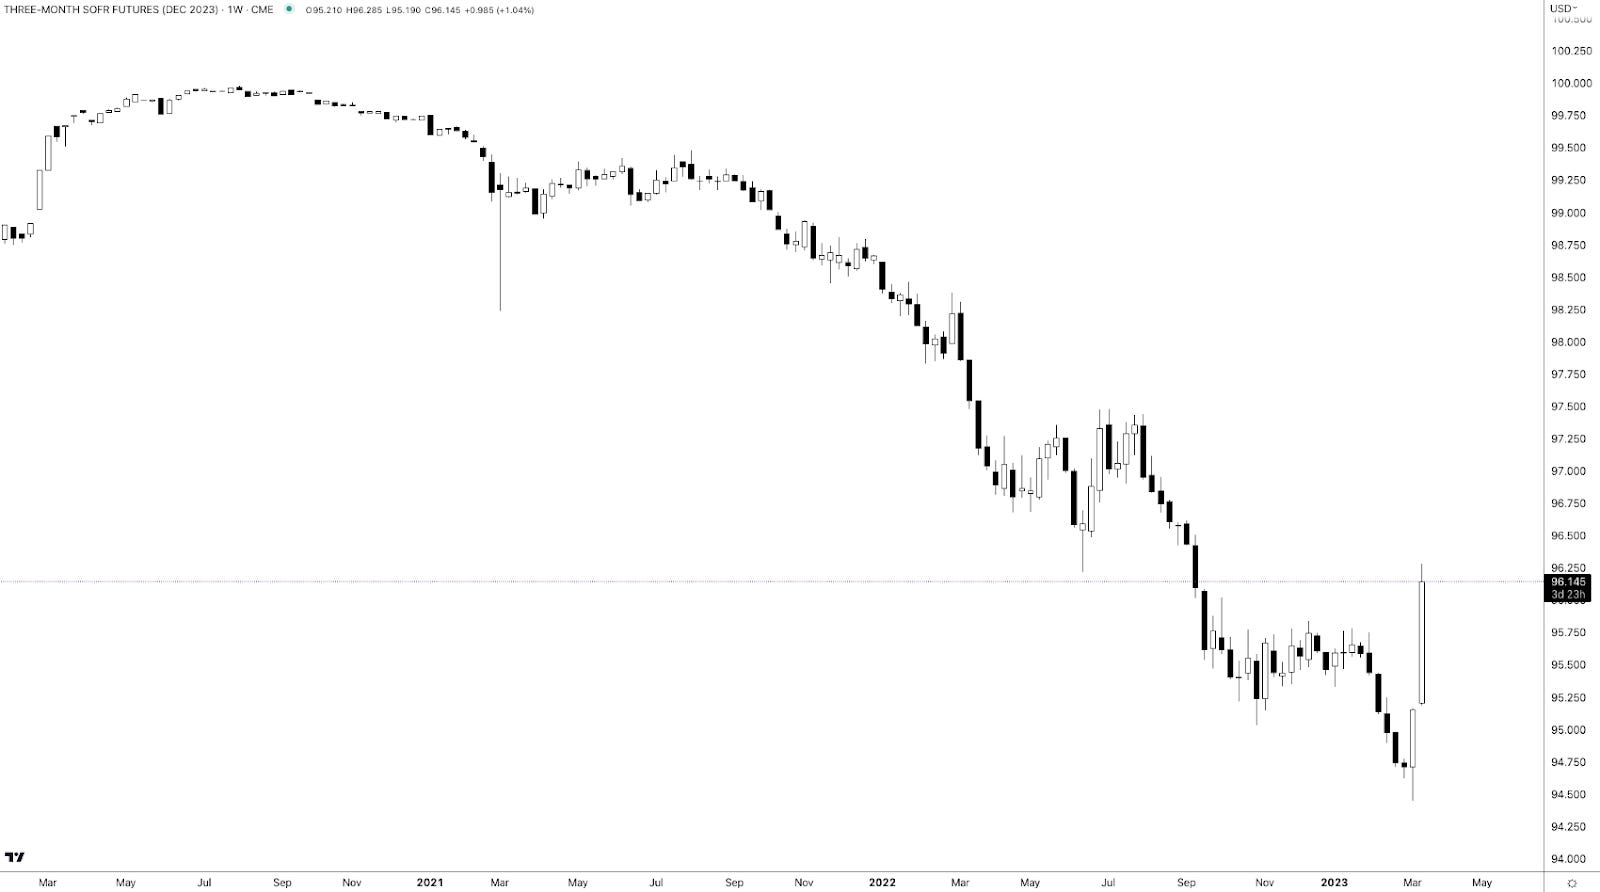
Call options on the three-month Secured Overnight Financing Rate (FUTURE: SOFR) future (i.e., bets on interest rates falling in the future) paid handsomely.
For instance, bull call spreads that expire in December 2023 (e.g., BUY +1 VERTICAL /SR3Z23:XCME 1/2500 DEC 23 /SR3Z23:XCME 96/97 CALL @.0375) increased in value by about 650.00% to $0.33 (i.e., $750.00 per contract).
Graphic: Retrieved via TradingView. Three-month SOFR Future (December 2023). When SOFR is at a lower (higher) number, the market is pricing an increase (decrease) in interest rates. Participants put the December 2023 SOFR rate at 100-96.145 = 3.855%.
In the equity space, some readers may have caught some commentary on spot-vol beta in the VIX complex strengthening like we have not seen in a while, a nod to the harbinger of equity market volatility remark a few paragraphs higher.
Recommended Readings:
Read: The Ambrus Group’s Kris Sidial on two major risks investors should watch out for in 2023. In short, volatility’s sensitivity to underlying prices (spot-vol beta) was low, and Sidial cast blame, in part, on commodity trading advisors and strong volatility supply.
Read: Simplify Asset Management’s Michael Green on using option and bond overlays to hedge big uncertainties facing markets. Following 2022, investors swapped poor-performing long-dated volatility exposures for ones with bounded risk and less time to expiry, hence the increase in 0 DTE trading.
Graphic: Retrieved from Piper Sandler’s (NYSE: PIPR) Danny Kirsch.
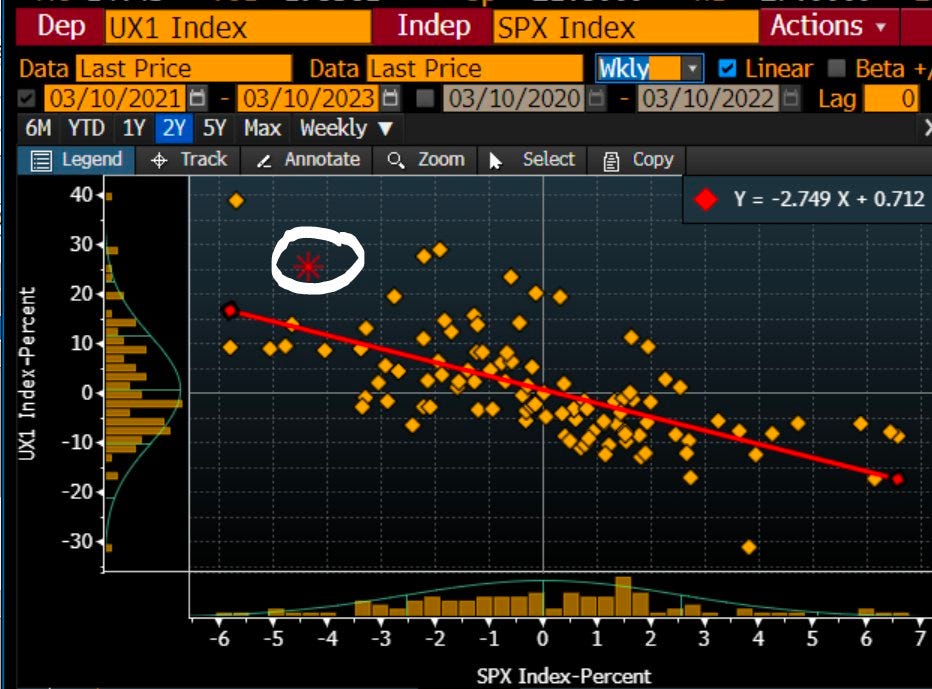
This spot-vol beta remark suggests that (at least some of) the volatility in rates, as well as certain small pockets of the equity and crypto market, manifested demand for crash protection in the S&P 500, “which feeds back into VIX,” one explanation put well.
Graphic: Retrieved from Piper Sandler’s (NYSE: PIPR) Danny Kirsch. “[Last] week finally got a bit of explosiveness in VIX as fixed strike volatility got bid. This is VIX generic front month future and move in SPX. Last time it really “paid” to have VIX upside was Jan of 2022 (point in upper left corner).”
Notwithstanding, for these options to keep their value and continue to perform well, realized volatility (RVOL) must pick up substantially, which is not likely.
Unlimited’s Bob Elliott comments: “the bond market is pricing a broad-based credit crunch, … [and though] it’s not crazy for the Fed to slow down here given the current uncertainty,” odds are financial problems are contained and the Fed moves forward with its mission to get (and keep) inflation down.
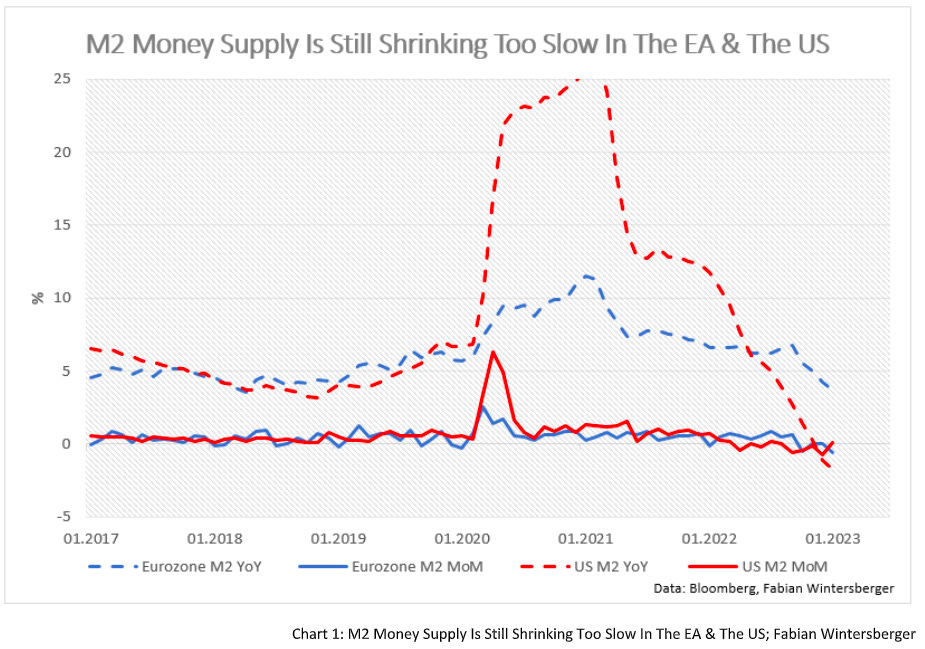
Graphic: Retrieved from Fabian Wintersberger. Just as the “monetary expansion supported the rise in equity and bond prices in January.”
Consequently, “the pricing of Dec23s and 5yr BEIs makes no sense,” Elliott adds. This means the example SOFR trade above is/was ripe for some monetization, and equity volatility must be dealt with carefully (i.e., price movements must be higher than they are now which would be difficult given that authorities/Fed do not want liquidations).
In support of siding with the less extreme take, we paraphrase Kai Volatility’s Cem Karsan who says that for years prior to the 2007-2008 turmoil, macro tourists were calling for a crash.
For markets to crumble, there would have to be an exogenous event far greater in implications than what just transpired with SIVB over the weekend. With odds that such turmoil doesn’t happen soon, coupled with participants easing up on their long-equity exposure (i.e., selling stock and not needing to hedge, hence the statement that owning equity volatility must be dealt with carefully), RVOL is likely to stay contained. That’s not to say that this volatility observed in the rates market can’t persist. It’s also not to say that markets can’t continue to trade lower (in fact, with interest rates rising and processes like quantitative tightening challenging bank liquidity, there is less incentive for investors to reside in lower-yielding equities). It just means that, barring some exogenous event, the market remains intact.
Graphic: Retrieved from Jack Farley. “Silicon Valley Bank owns >$80 Billion of Mortgage-Backed Securities (MBS), a market that is ‘more prone to bouts of volatility’ because ‘small investors & leveraged funds have become the main buyers’ as the Fed & banks step away from market, according to Dec 2022 BIS report.”
Positioning
Following important events like the release of the Consumer Price Index (CPI) today, the compression of implied volatility or IVOL, coupled with the nearing of big options expirations (OpEx), sets the market up for potential short bursts of strength heading into the end of the month and next month.
Graphic: Retrieved from Bloomberg. Inflation has been well within forecasts.
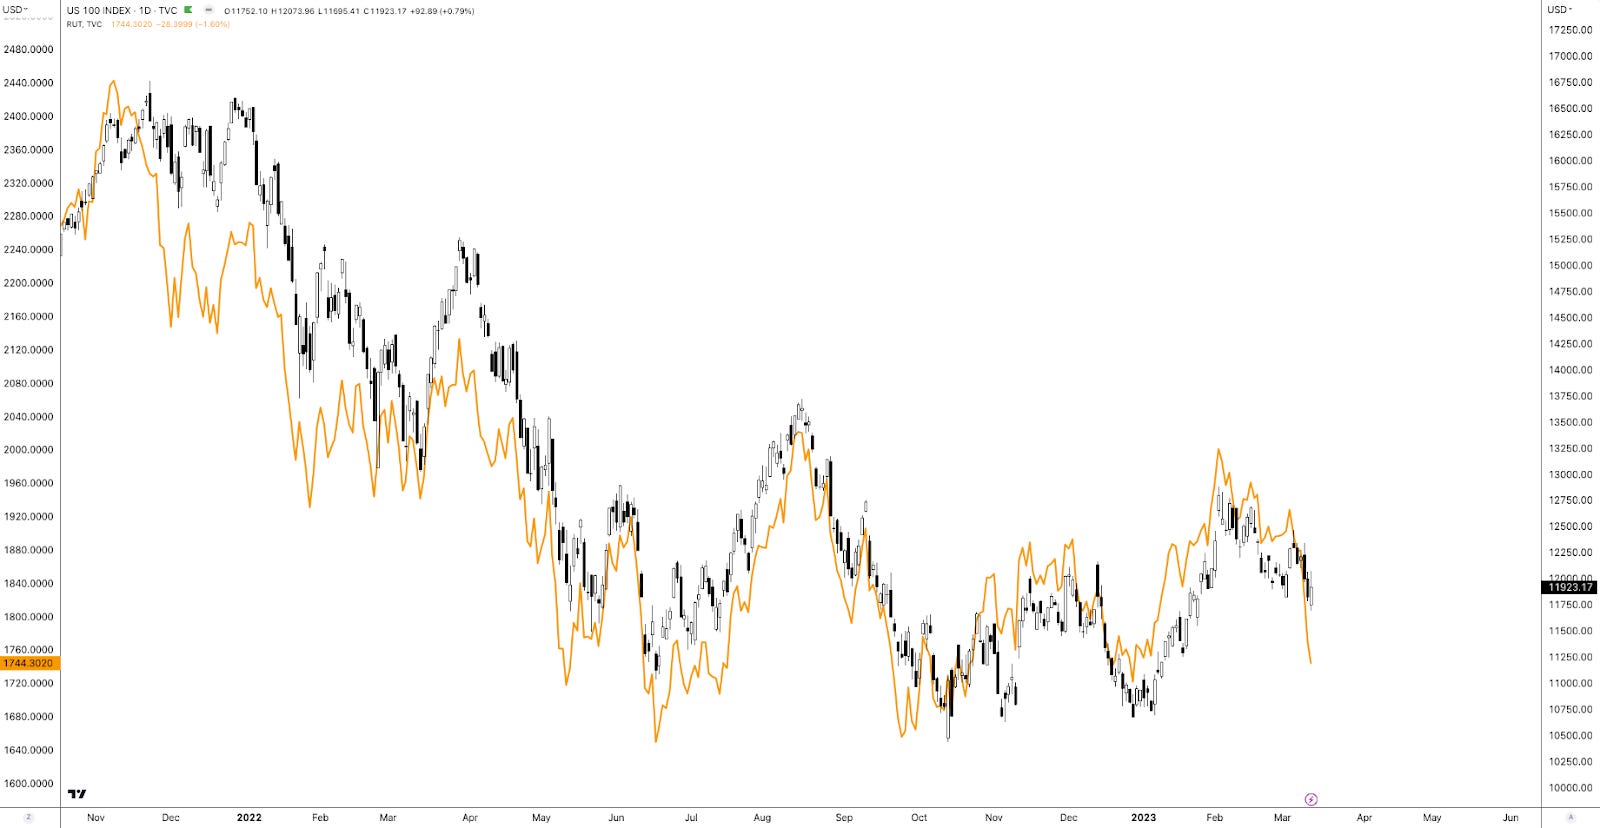
A quick comparison of the Russell 2000 (INDEX: RUT) and Nasdaq 100 (INDEX: NDX) suggests this options-induced strength may help keep the recent re-grossing theme intact. The compression of wound IVOL and passage of OpEx, coupled with the still-live re-grossing theme, may put a floor under equities.
Graphic: Retrieved from TradingView. Orange = RUT. Candles = NDX. Note the weakness in RUT. Note the strength of the Nasdaq relative to the Russell.
To play, one could place a portion of their cash in money market funds or T-bill ETFs or box spreads, for instance, while allocating another portion to leverage potential by way of some call options structures that use one or more short options to help bring down the cost of a long option that is closer to current market prices (e.g., a bull call spread or short ratio call spread). To note, based on options prices as of this writing, it may be too early to enter call structures (i.e., too expensive given the context).
DEFINED OUTCOME INVESTING
-Worried about the prospects of the 60/40 portfolio? -Looking for a strategy that takes advantage of higher interest rates? -Tired of market timing?
A 🧵on how to use exchange-traded options + U.S. Treasurys to define your risk today, for tomorrow.
As of 6:30 AM ET, Tuesday’s regular session (9:30 AM – 4:00 PM ET), in the S&P 500, is likely to open in the middle part of a balanced overnight inventory, inside of the prior day’s range, suggesting a limited potential for immediate directional opportunity.
The S&P 500 pivot for today is $3,904.25.
Key levels to the upside include $3,921.75, $3,945.00, and $3,970.75.
Key levels to the downside include $3,884.75, $3,868.25, and $3,847.25.
Disclaimer: Click here to load the updated key levels via the web-based TradingView platform. New links are produced daily. Quoted levels likely hold barring an exogenous development.
Graphic: 65-minute profile chart of the Micro E-mini S&P 500 Futures.
Definitions
Volume Areas: Markets will build on areas of high-volume (HVNodes). Should the market trend for a period of time, this will be identified by a low-volume area (LVNodes). The LVNodes denote directional conviction and ought to offer support on any test.
If participants auction and find acceptance in an area of a prior LVNode, then future discovery ought to be volatile and quick as participants look to the nearest HVNodes for more favorable entry or exit.
POCs: Areas where two-sided trade was most prevalent in a prior day session. Participants will respond to future tests of value as they offer favorable entry and exit.
Volume-Weighted Average Prices (VWAPs): A metric highly regarded by chief investment officers, among other participants, for quality of trade. Additionally, liquidity algorithms are benchmarked and programmed to buy and sell around VWAPs.
About
The author, Renato Leonard Capelj, spends the bulk of his time at Physik Invest, an entity through which he invests and publishes free daily analyses to thousands of subscribers. The analyses offer him and his subscribers a way to stay on the right side of the market.
You may view this letter’s content calendar at this link.
Disclaimer
Do not construe this newsletter as advice. All content is for informational purposes. Capelj and Physik Invest manage their own capital and will not solicit others for it.