Bloomberg reports that if the US defaults on its debt, which could happen as soon as June 1 if President Biden and House Speaker McCarthy fail to reach a deal on raising the ceiling, homebuyer borrowing costs may surge to 8.40%. As a consequence, the typical home’s monthly payment would increase by 22.00% and cool property sales; the monthly payment on a $500,000.00 mortgage may rise to $3,800.00, compared to about $3,095.00 at the current rate of 6.30%.
In prior letters, we concluded that past monetary action made stocks less sensitive to interest rates, quoting JPMorgan Chase & Co (NYSE: JPM) strategists that the market would likely continue to “artificially suppress perceptions of fundamental macro risks,” barring surprises like a debt limit breach.
With a debt limit breach a potential reality, Moody’s Corporation (NYSE: MCO) says a breach may compound recessionary pressures; expect a drop in equities, a volatility spike, and a disruption of funding markets.
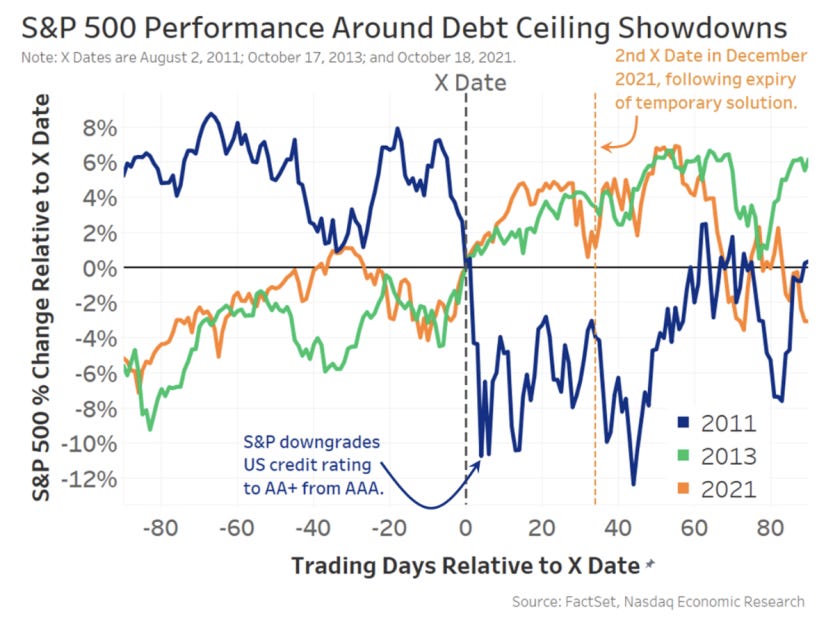
Graphic: Retrieved from Nasdaq Inc (NASDAQ: NDAQ).
“Data show that short-term bonds have the most predictable reaction – with interest rates and default insurance costs rising significantly – before quickly returning to normal after the uncertainty has passed,” Nasdaq’s Phil Mackintosh writes. “In reality, a crisis was averted in all [prior] cases, with the government able to increase or suspend the debt limit before the X Date.”
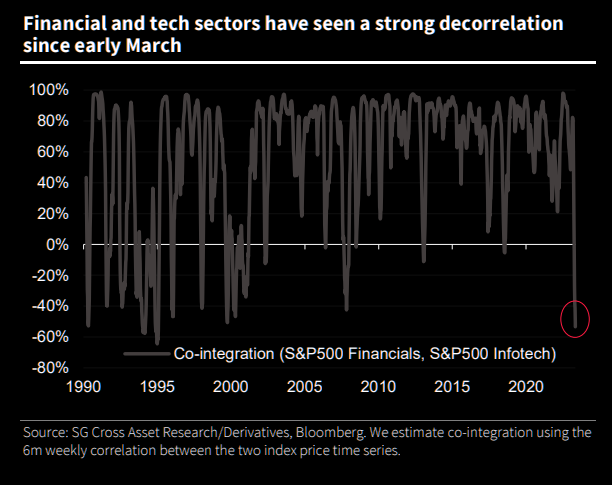
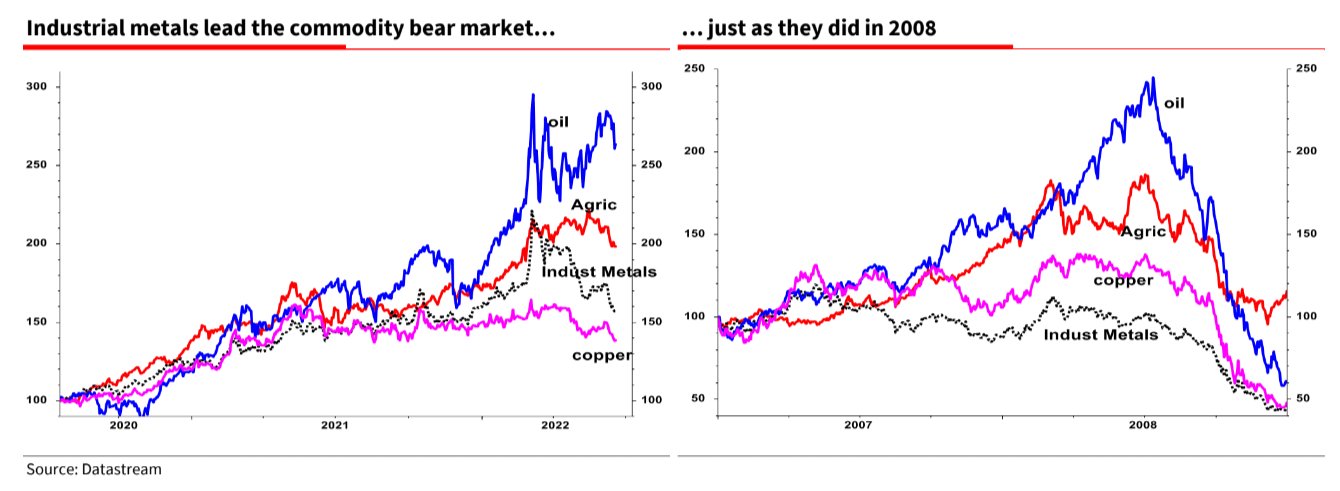
Notwithstanding the short-term uncertainty regarding the debt limit, Bank of America Corporation (NYSE: BAC) is adamant there will be a recession that manifests cracks in “credit and tech,” similar to the situation in 2008. BAC sees the bubble in technology, media, and telecommunication stocks soon deflating as they face higher-for-longer interest rates and a tempered earnings outlook.
Graphic: Retrieved from Societe Generale SA (OTC: SCGLY) via The Market Ear.While investors poured $3.8 billion into technology stocks in the week through May 10, $2.1 billion was pulled from financial equities, the most significant redemption since May 2022.
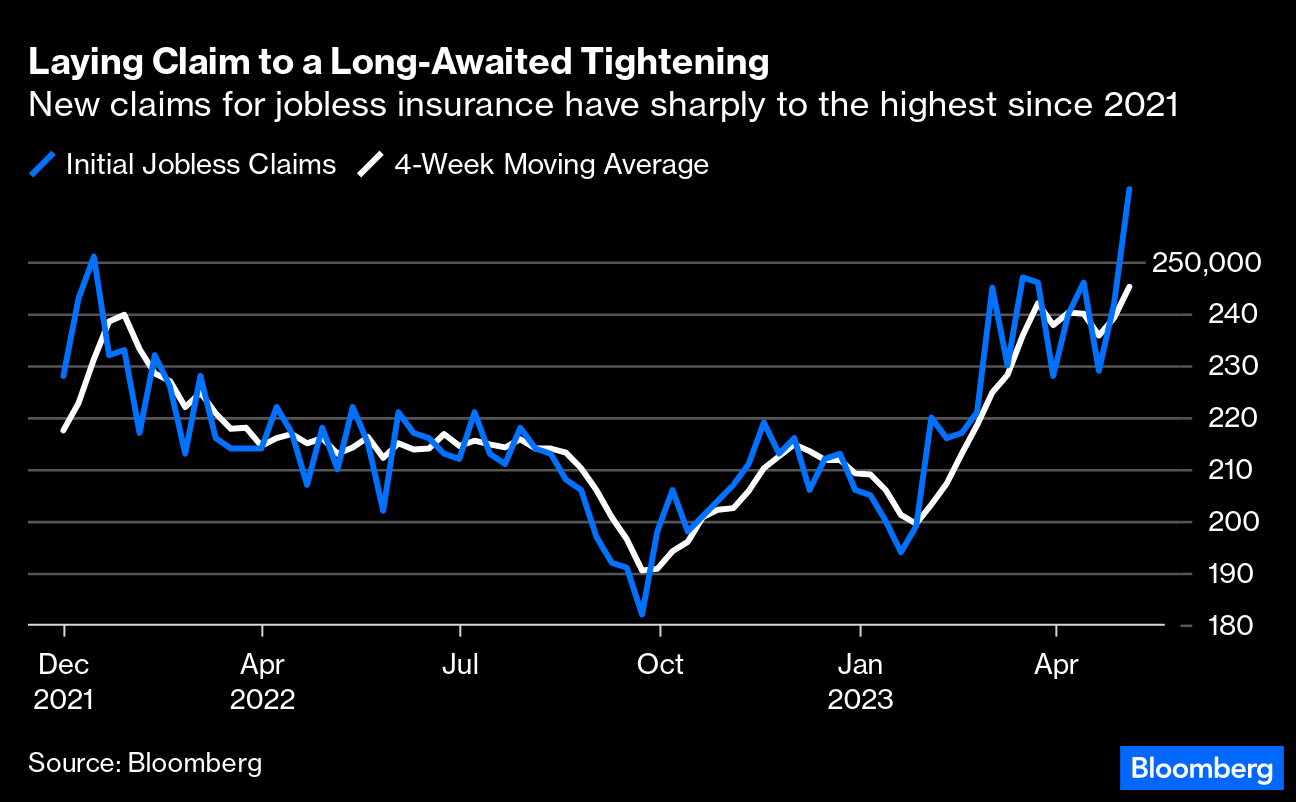
Compounding the recessionary pressures BAC sees, EPB Research adds, are banks’ funding costs, which have increased too much relative to prevailing asset yields. If the spread drops too low, bank lending tightens, and a recession occurs. Also, other data suggests tightening is finally starting to have an impact. Bloomberg reports that initial claims for unemployment insurance are on the rise. There has been a drop in overall wage growth to 5.1% last month, too, the biggest fall in the rate of increase since the series began.
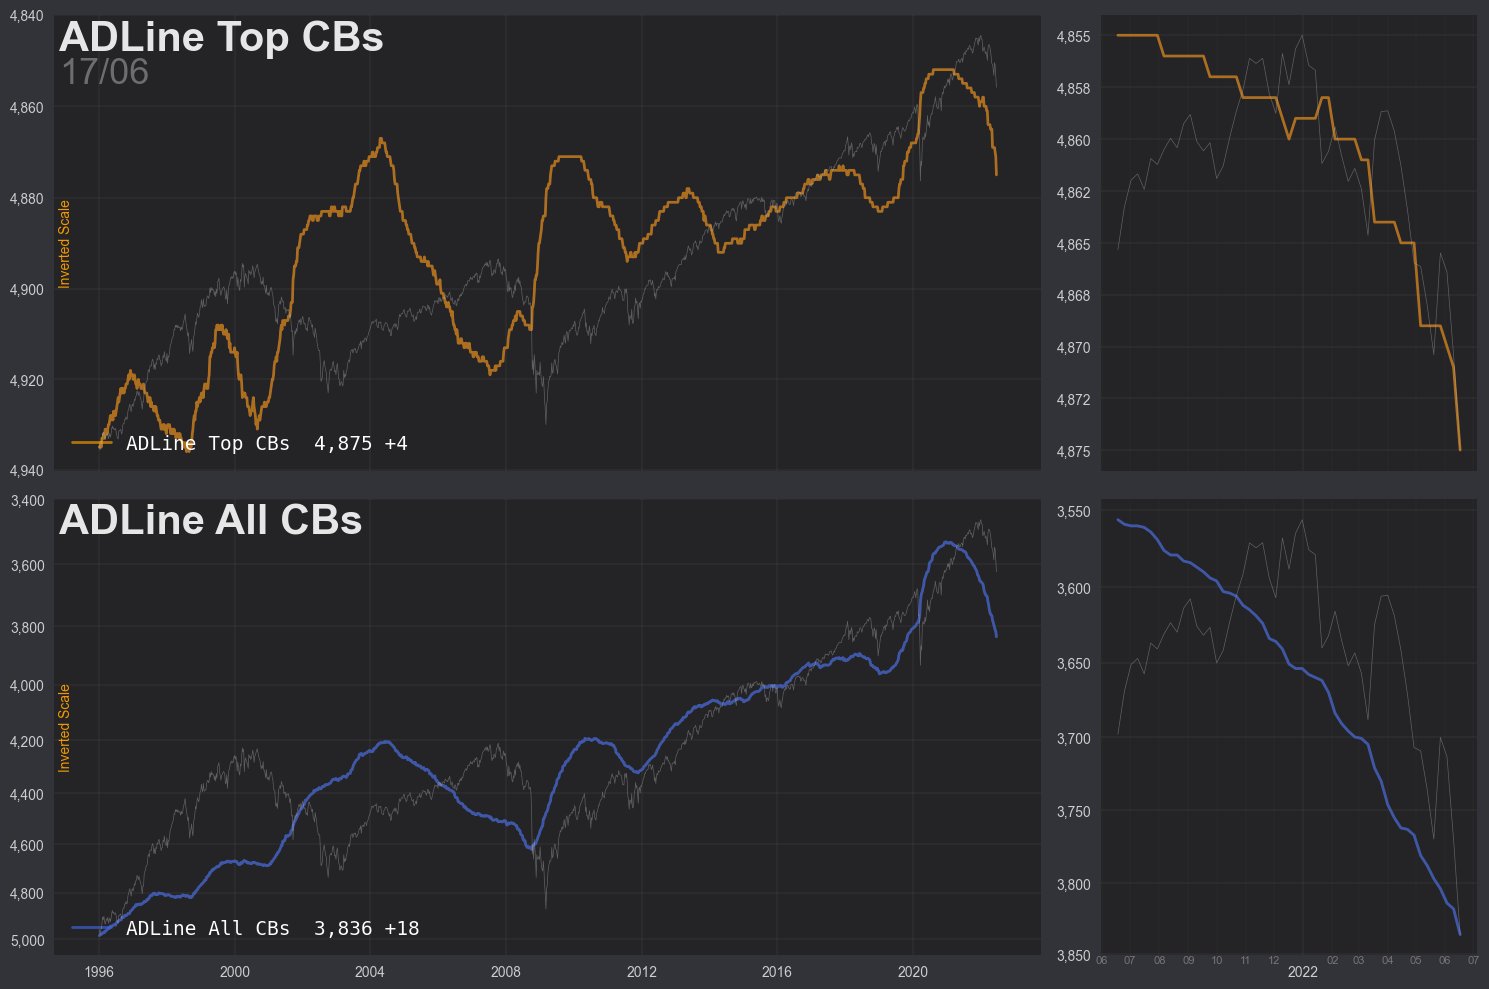
Separately, breadth divergences are becoming more frequent, with the Daily Advance-Decline (A-D) Line for the NYSE showing lower highs while DJIA and S&P 500 show slightly higher highs, McClellan Financial Publications writes. The bond CEF A-D Line is also showing a bearish divergence, indicating a shift in liquidity that could weigh on other stocks, including the big-cap stocks holding up the SP500 and the Nasdaq 100.
Graphic: Retrieved from McClellan Financial Publications.
McClellan adds that the A-D Line originated from data collected by Leonard Ayres and James Hughes in the 1920s. It was made famous in 1962.
Graphic: Retrieved from McClellan Financial Publications.
That’s when Joe Granville and Richard Russell commented on it in their newsletters, noting how it had shown a big bearish divergence ahead of the 1962 bear market.
Graphic: Retrieved from McClellan Financial Publications.
To end, the economic calendar next week is focused on manufacturing and housing. The housing market is showing some downside risk for existing-home sales for April due to a weak reading on pending sales, MCO says, adding that housing permits and starts are expected to move sideways as builders remain cautious amid high-interest rates and economic uncertainty. Regional Fed surveys in New York and Philadelphia will provide the first read on factory activity for May, with little hope for a significant rebound in manufacturing. Jobless claims will be critical, as continuing the recent trend would likely signal a rapid deceleration in monthly job gains. Other critical data to be released include retail sales, industrial production, and business inventories.
Should readers wish to hedge the debt ceiling debacle, June call options on the Cboe Volatility Index appear attractive, some suggest. But, with RVOL as low as it is, owning optionality is not generally warranted. The risk is lower lows in volatility.
Welcome to the Daily Brief by Physik Invest, a soon-to-launch research, consulting, trading, and asset management solutions provider. Learn about our origin story here, and consider subscribing for daily updates on the critical contexts that could lend to future market movement.
Separately, please don’t use this free letter as advice; all content is for informational purposes, and derivatives carry a substantial risk of loss. At this time, Capelj and Physik Invest, non-professional advisors, will never solicit others for capital or collect fees and disbursements. Separately, you may view this letter’s content calendar at this link.
The daily brief is a free glimpse into the prevailing fundamental and technical drivers of U.S. equity market products. Join the 750+ that read this report daily, below!
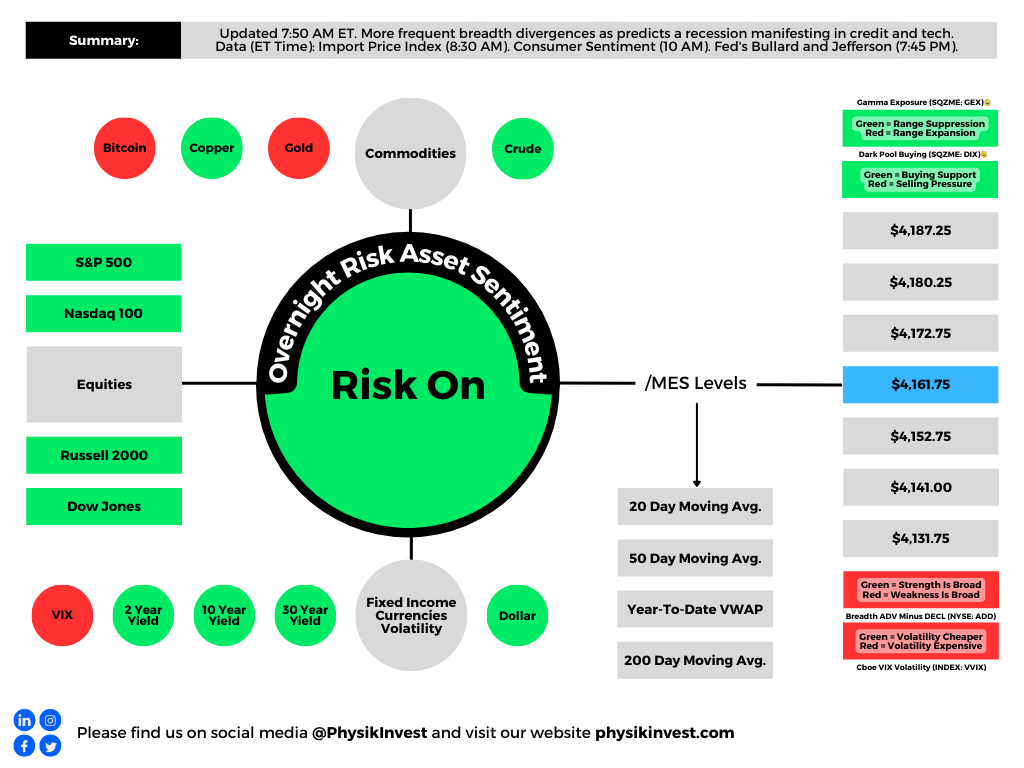
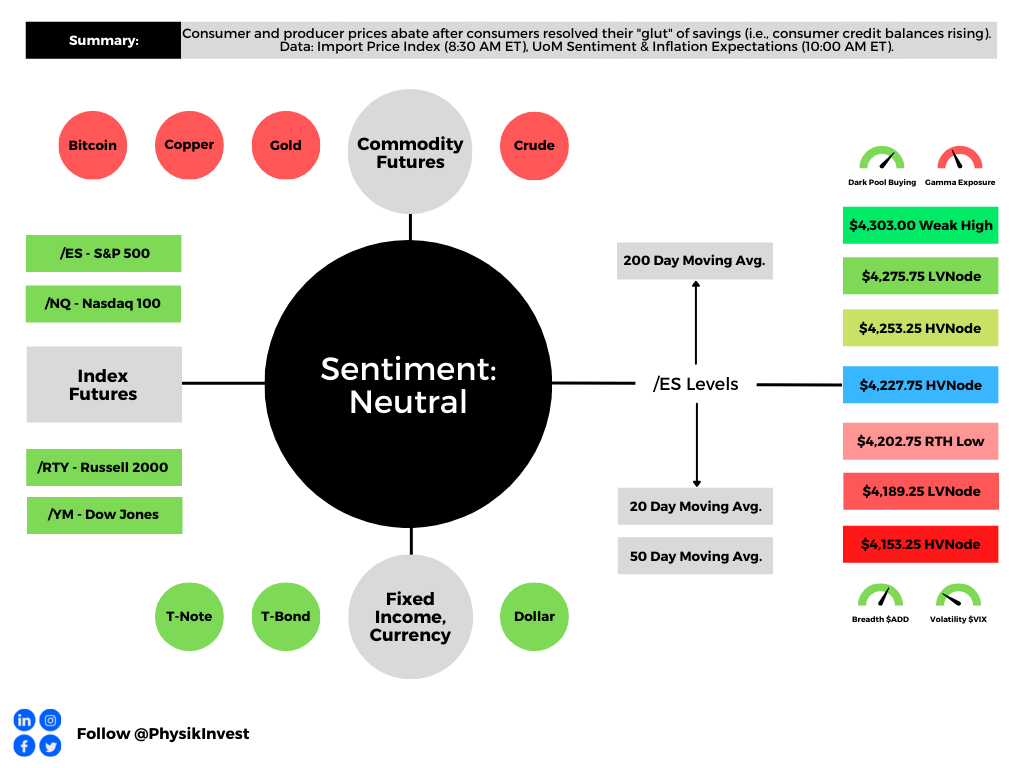
Graphic updated 7:00 AM ET. Sentiment Neutral if expected /ES open is inside of the prior day’s range. /ES levels are derived from the profile graphic at the bottom of the following section. Levels may have changed since initially quoted; click here for the latest levels. SqueezeMetrics Dark Pool Index (DIX) and Gamma (GEX) calculations are based on where the prior day’s reading falls with respect to the MAX and MIN of all occurrences available. A higher DIX is bullish. At the same time, the lower the GEX, the more (expected) volatility. Learn the implications of volatility, direction, and moneyness. Breadth reflects a reading of the prior day’s NYSE Advance/Decline indicator. VIX reflects a current reading of the CBOE Volatility Index (INDEX: VIX) from 0-100.
Fundamental
We’ll skip the fundamentals section, today, and do an in-depth review, sometime next week.
Positioning
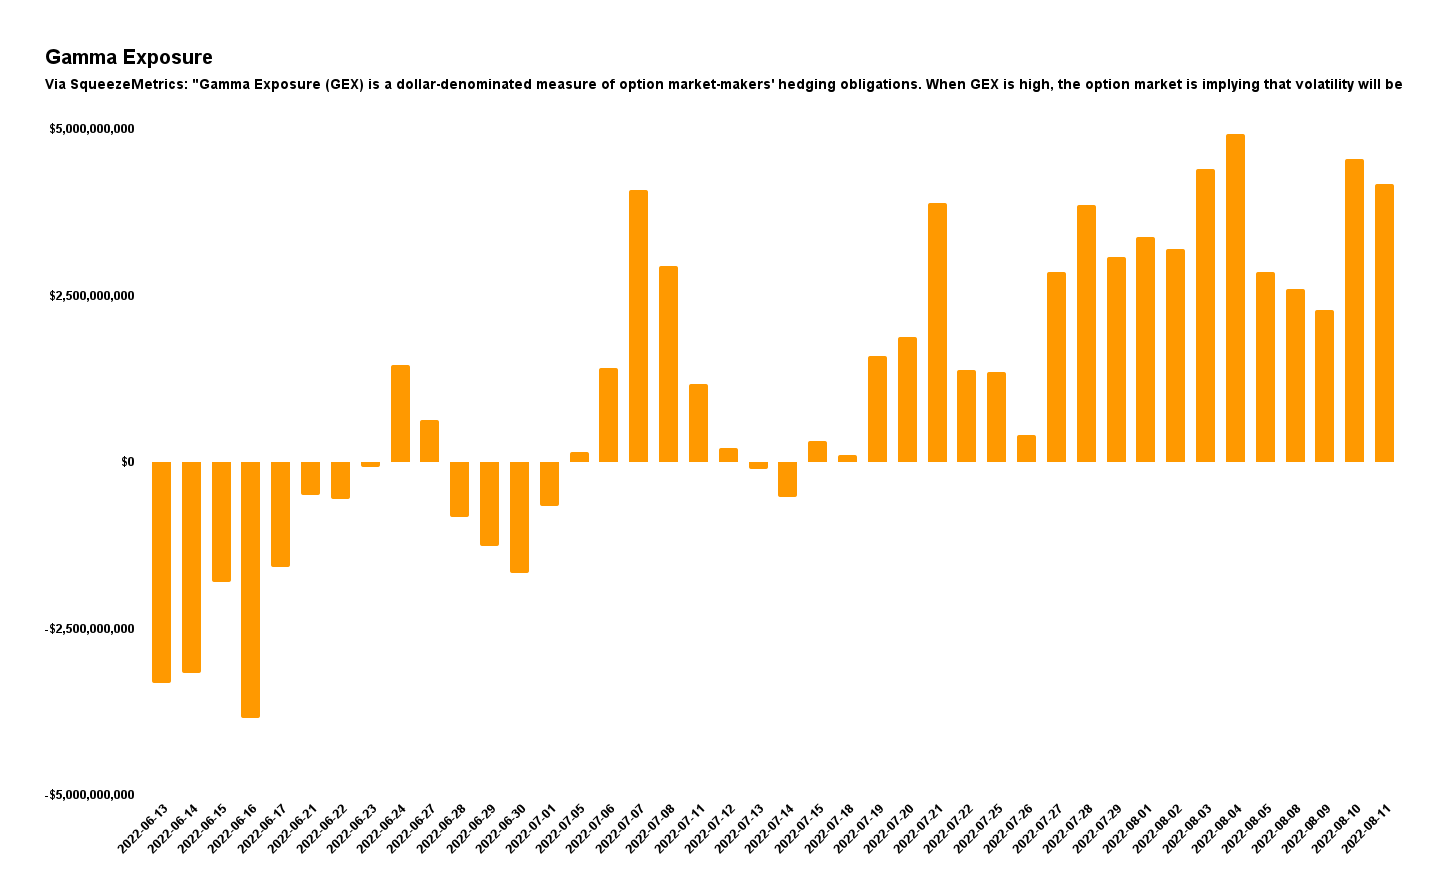
As of 7:00 AM ET, Friday’s expected volatility, via the Cboe Volatility Index (INDEX: VIX), sits at ~1.06%. Net gamma exposures generally rising may promote tighter trading ranges.
Graphic: Via Physik Invest. Data retrieved from SqueezeMetrics.
As stated yesterday, it may be beneficial for traders to shift their focus to dynamic structures. In other words, be a buyer of options structures (i.e., replace static directional exposures or Delta with those that are dynamic).
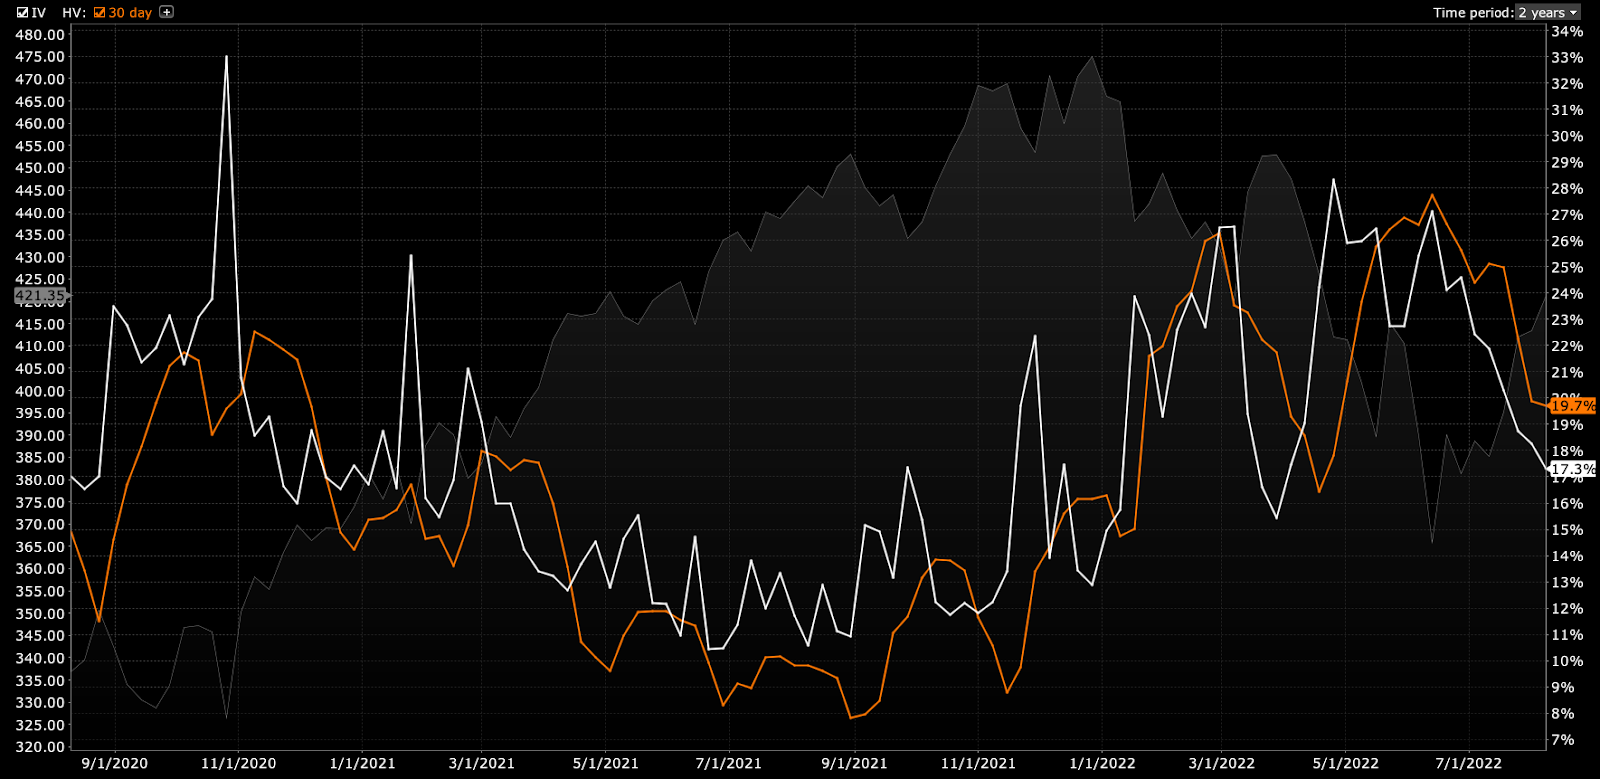
This is (1) due to where realized (RVOL) and implied (IVOL) volatility measures, and skew.
Graphic: Retrieved from Interactive Brokers Group Inc’s (NASDAQ: IBKR) Trader Workstation.
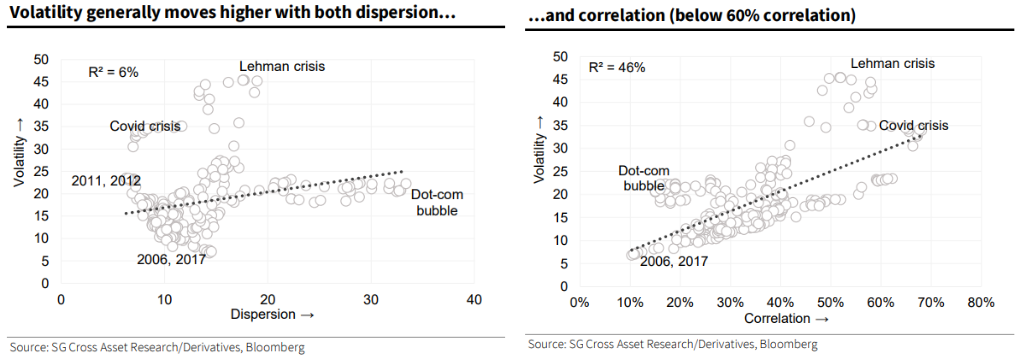
As well as (2) increased average stock correlation and lower return dispersion which, per Societe Generale SA (OTC: SCGLY) research, make stock picking hard(er).
It can be the case that Delta hedging becomes easier, too, as one asset, in a more correlated environment, can better offset the first-order sensitivities elsewhere.
Graphic: Retrieved from Bloomberg. Via Societe Generale.
The reason why?
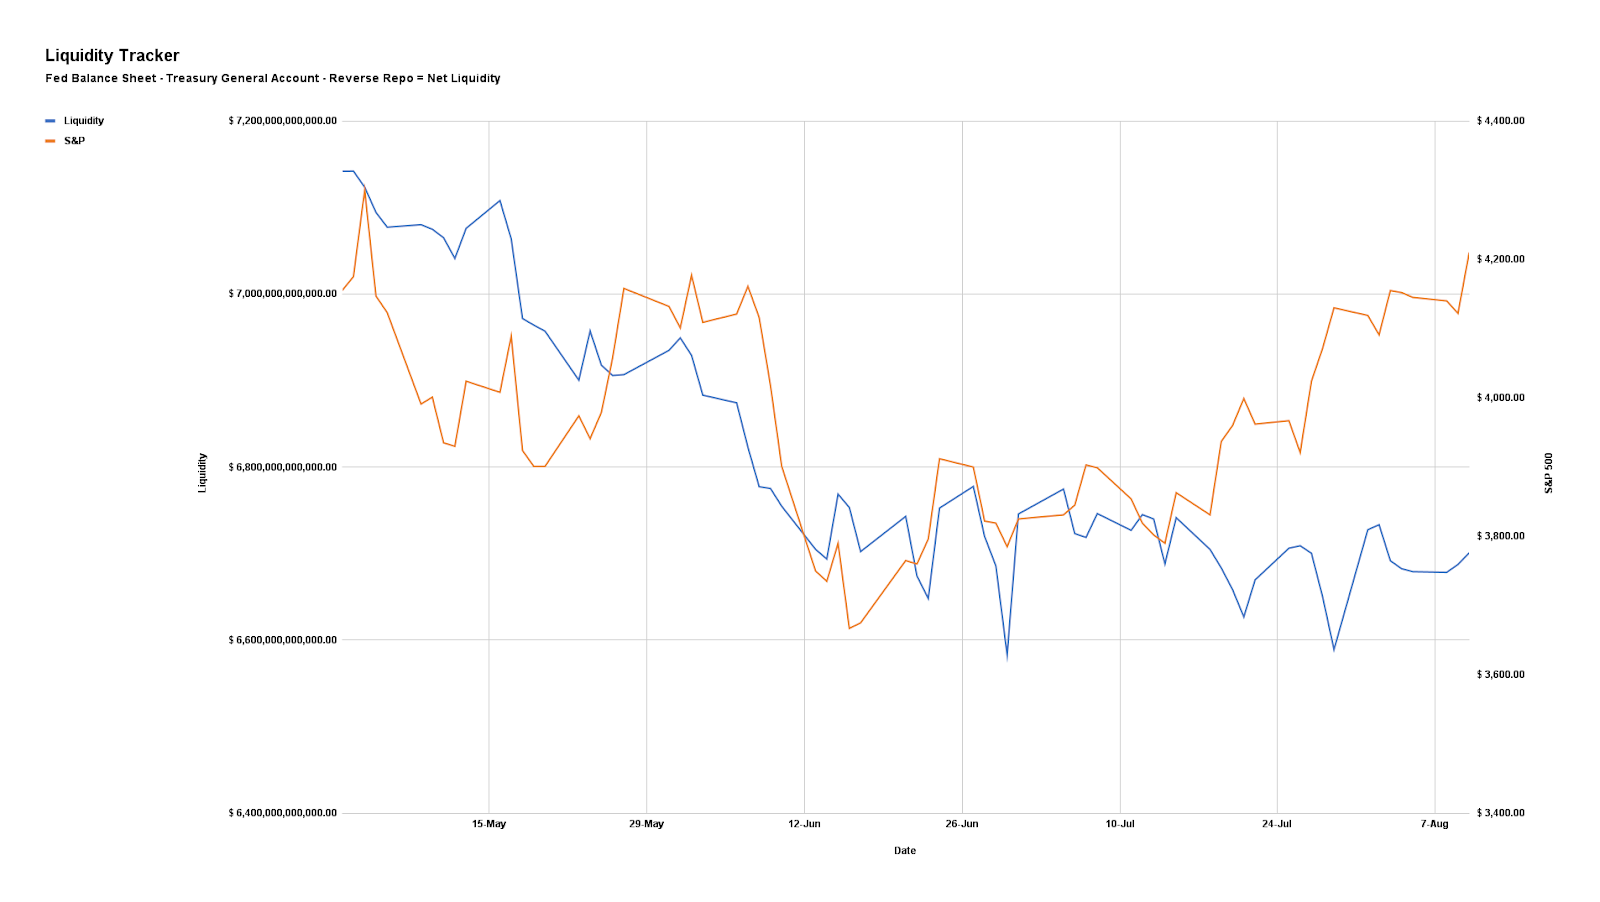
In regards to the correlation and dispersion remark, that’s more to do with the risk-off sentiment and the impact of tightening liquidity affecting all risk assets, basically.
Graphic: Via PhysikInvest. Data compiled by @jkonopas623. Fed Balance Sheet data, here. Treasury General Account Data, here. Reverse Repo data, here. NL = BS – TGA – RRP.
Regarding the volatility issue (RVOL, IVOL, and skew), that’s more to do with hedging trends.
Essentially, the monetization and counterparty hedging of existing customer hedges, as well as the sale of short-dated volatility, particularly in some of the single names where there was “rich” volatility, into the fall, lent to lackluster performance in IVOL and index mean reversion.
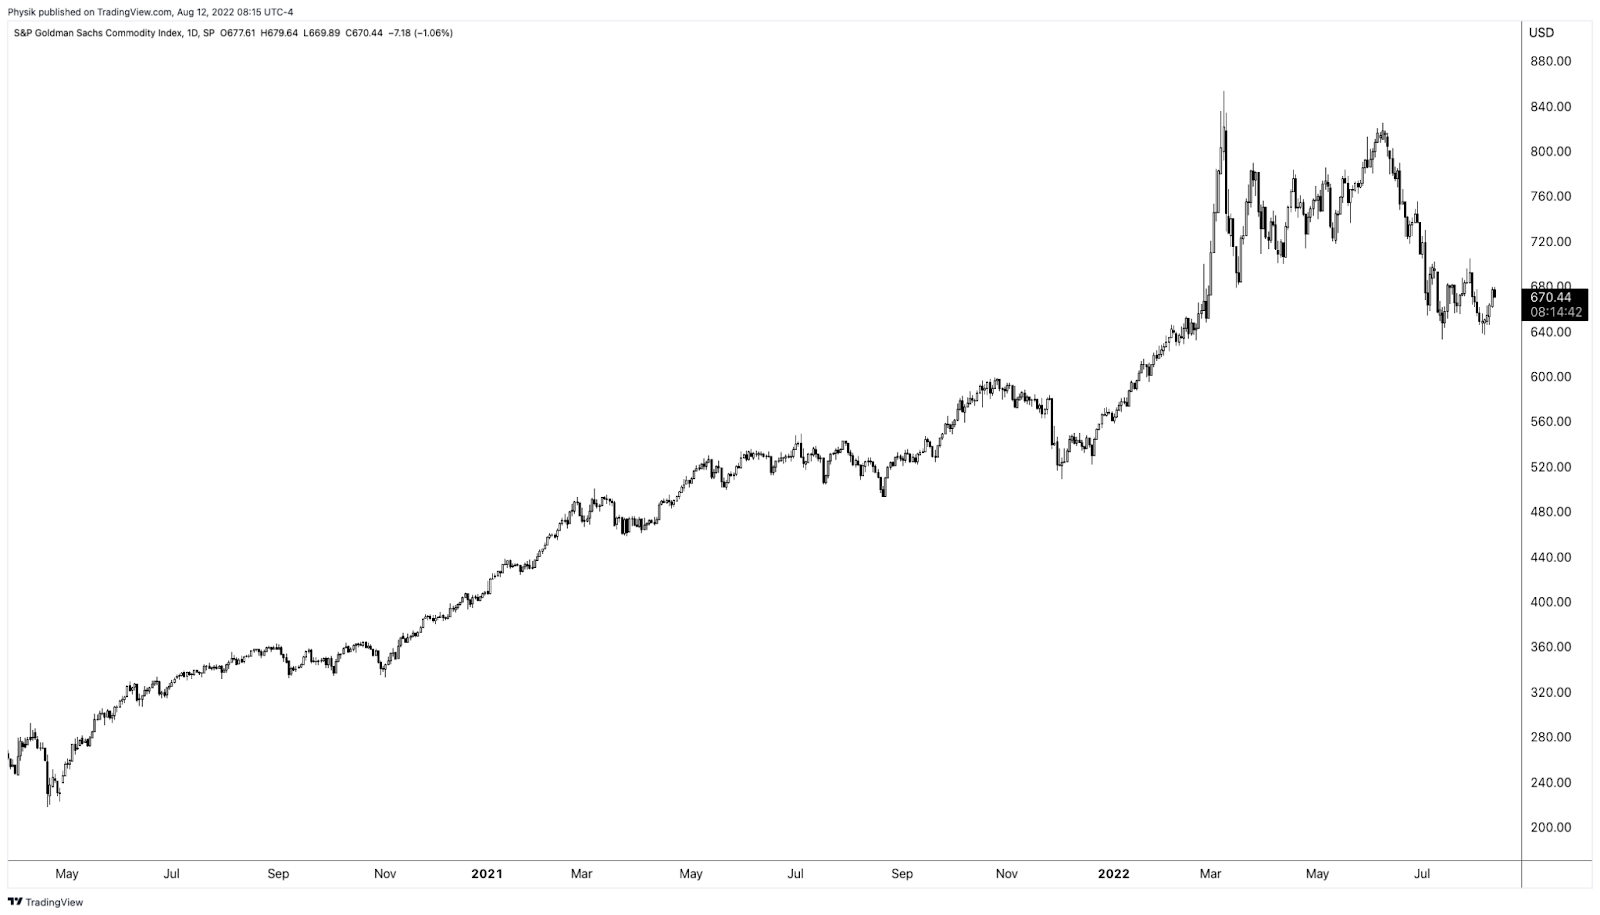
Accordingly, “if commodities are not performing … as a hedge, that opens the door,” to markets falling and traders demand equity volatility hedges, per The Ambrus Group’s Kris Sidial.
Learn about options dealer flows, inflation, and investing in a changing world with Cem Karsan.
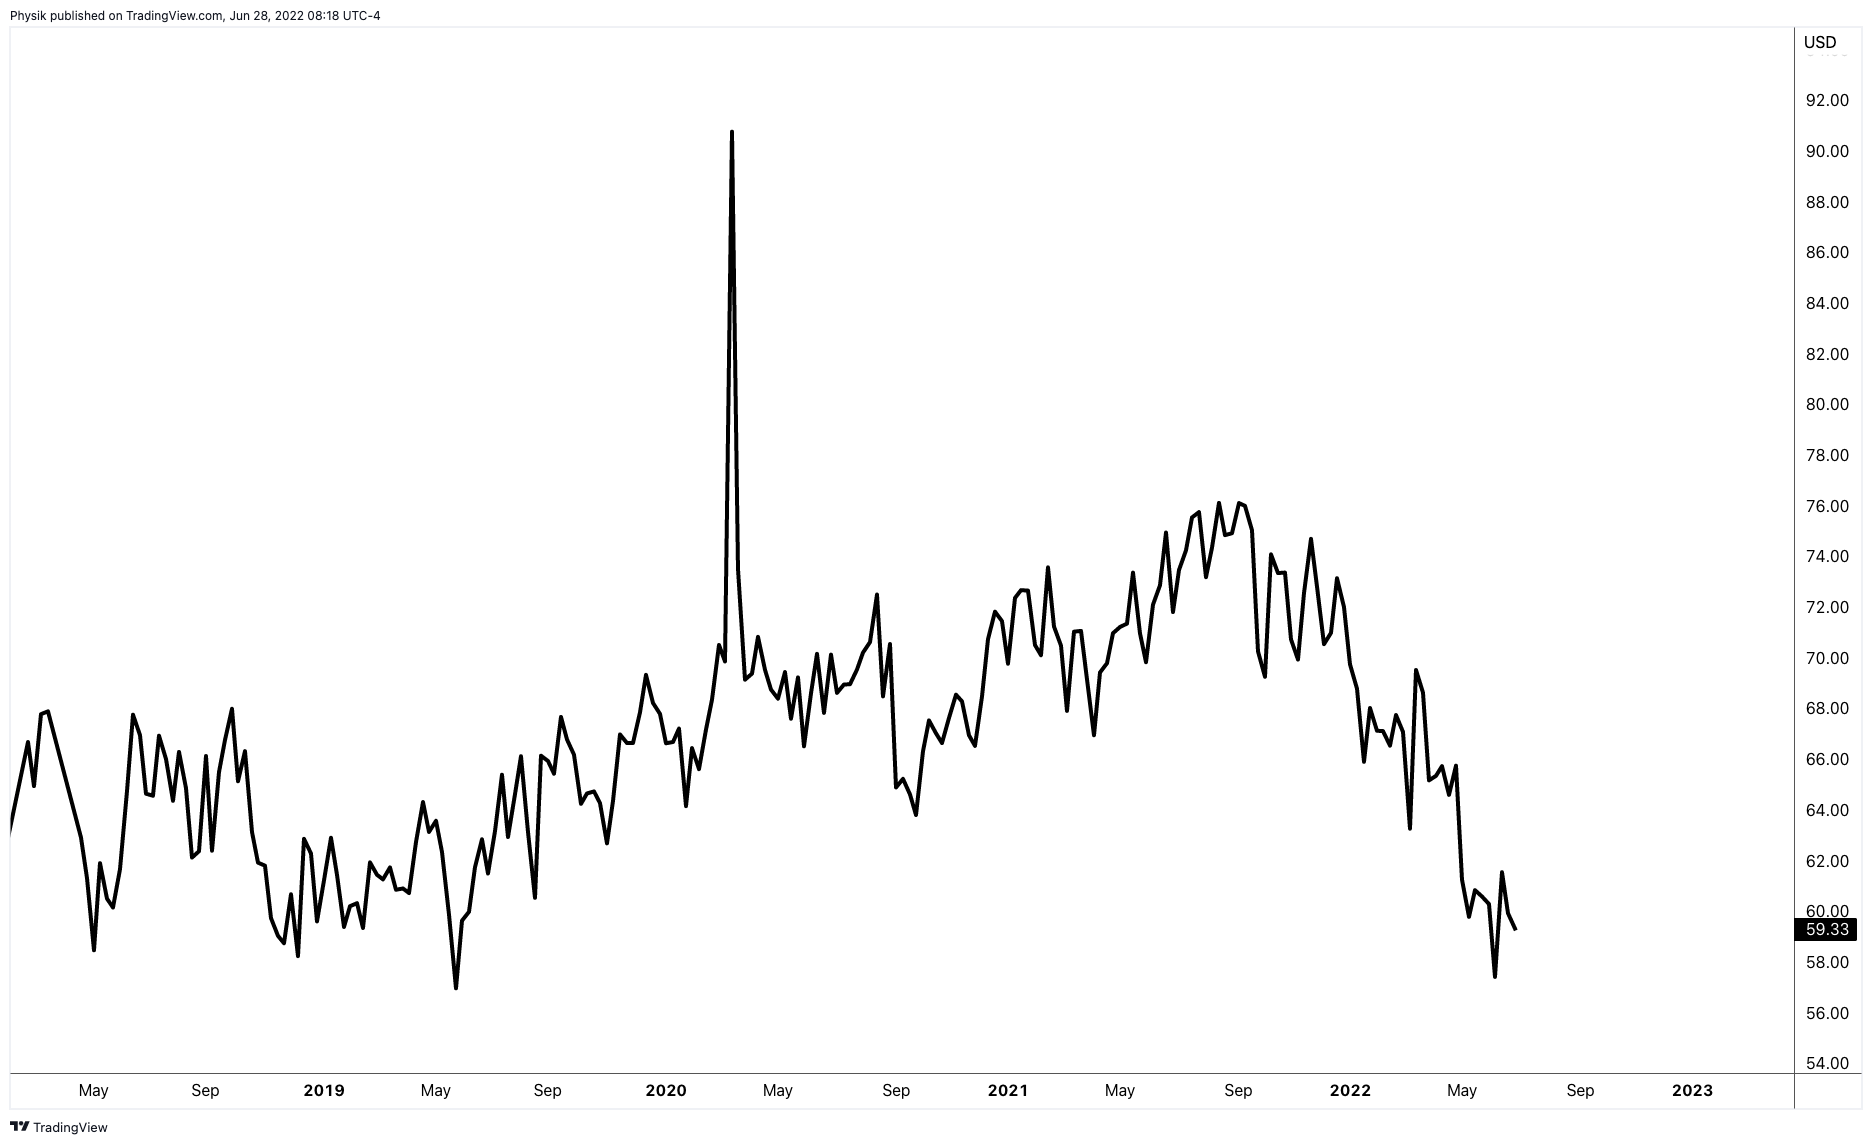
Graphic: Retrieved by Physik Invest from TradingView. S&P Goldman Sachs Commodity Index.
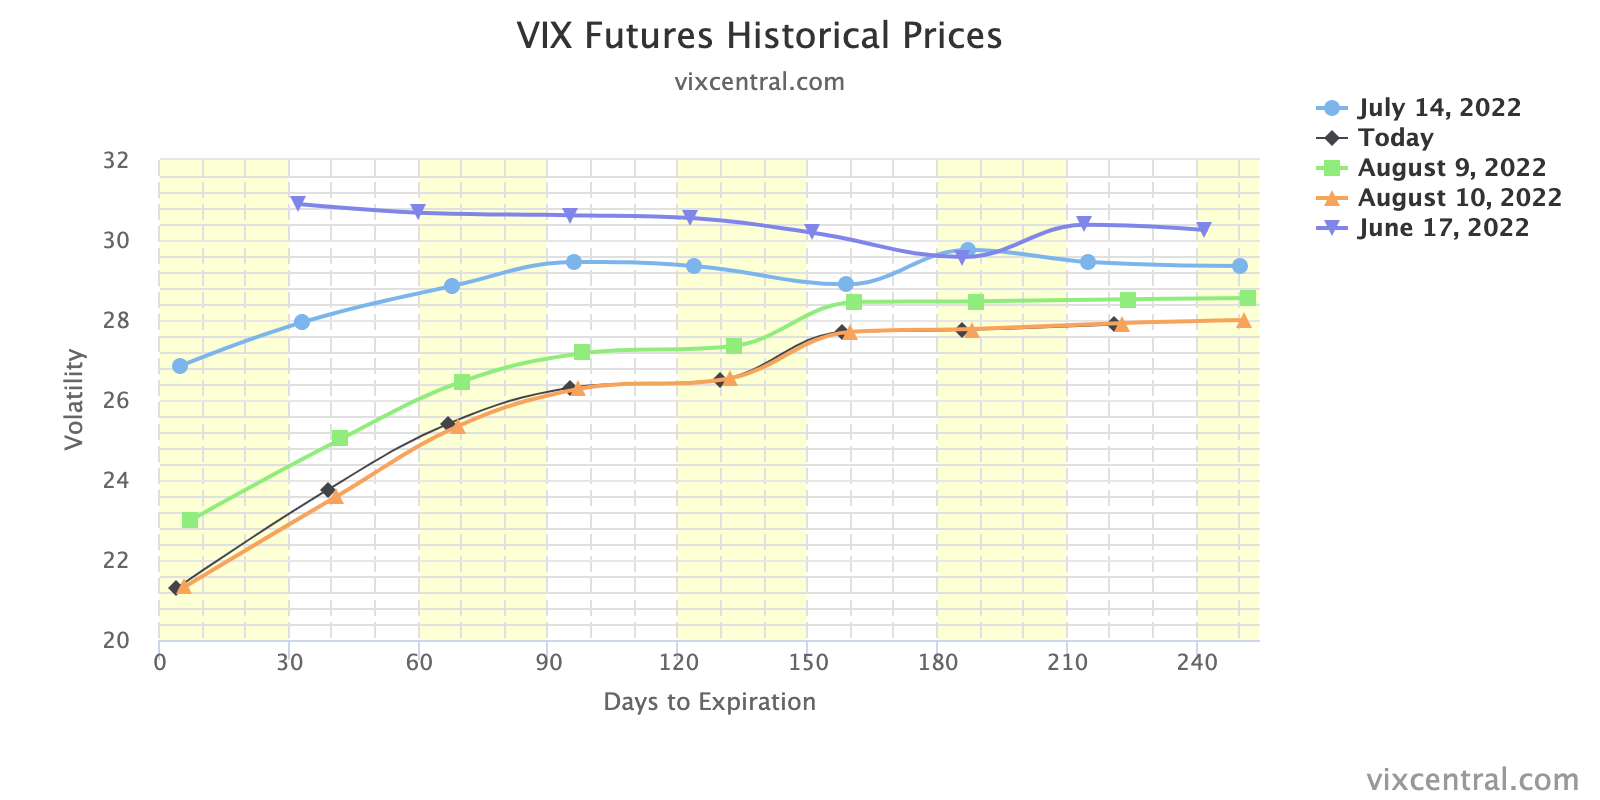
Adding, per to SpotGamma, “a lot of the boost from volatility compression has played out. With IVOL at a lower bound, it may be opportune to replace static Delta bets for those that are dynamic (i.e., long option exposures) and have less to lose in this lower volatility environment.”
Graphic: Retrieved from Vix Central. The term structure of IVOL.
“In a case where market participants see the Fed keeping its commitment to aggressive monetary policy action, negative Delta options exposures may outperform static short equity (bets on the downside).”
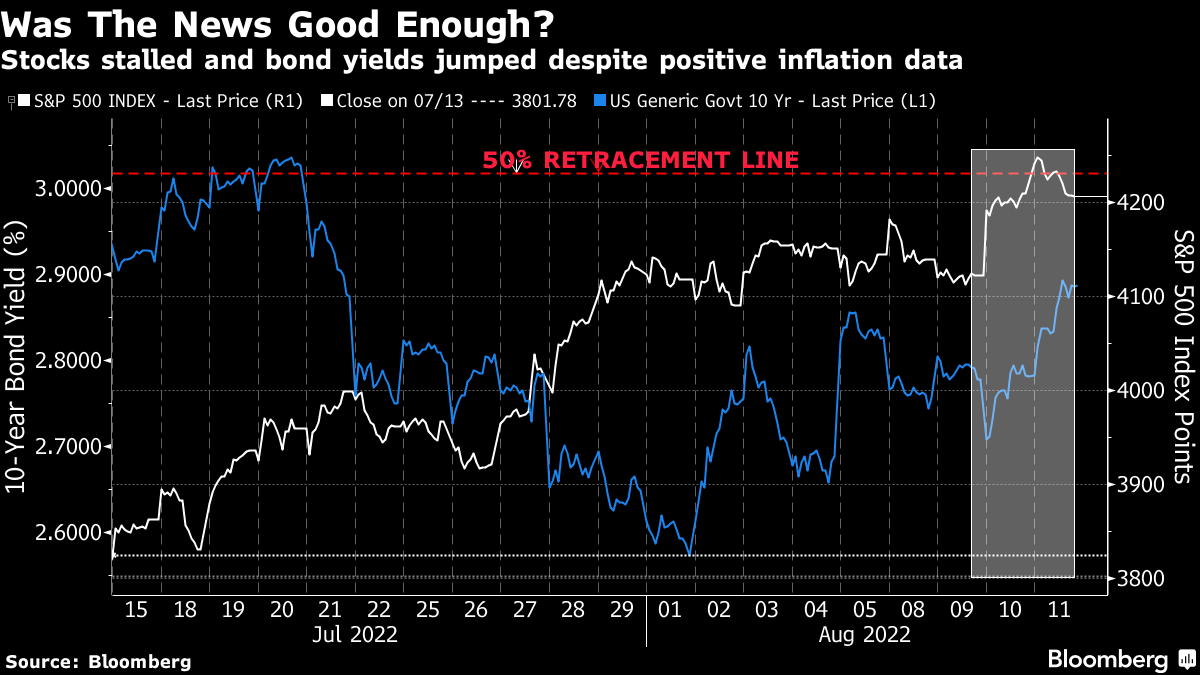
Graphic: Retrieved from Bloomberg. “Thursday’s message was that on mature reflection, the progress on the economy didn’t justify taking the stock market any higher than it was at the start of the day.”
If bullish, sample structures to consider, given a smiley skew, include low- or zero-cost bullish call ratio spreads, against the trend resistances in products like the S&P 500 (INDEX: SPX).
Graphic: Retrieved from Bloomberg. Drawn on by Physik Invest.
Technical
As of 7:00 AM ET, Friday’s regular session (9:30 AM – 4:00 PM ET), in the S&P 500, is likely to open in the middle part of a nearly balanced overnight inventory, inside of prior-range and -value, suggesting a limited potential for immediate directional opportunity.
In the best case, the S&P 500 trades higher.
Any activity above the $4,227.75 HVNode puts into play the $4,253.25 HVNode. Initiative trade beyond the latter could reach as high as the $4,275.75 LVNode and $4,303.00 Weak High, or higher.
In the worst case, the S&P 500 trades lower.
Any activity below the $4,227.75 HVNode puts into play the $4,202.75 RTH Low. Initiative trade beyond the RTH Low could reach as low as the $4,189.25 LVNode and $4,153.25 HVNode, or lower.
Click here to load today’s key levels into the web-based TradingView charting platform. Note that all levels are derived using the 65-minute timeframe. New links are produced, daily.
Graphic: 65-minute profile chart of the Micro E-mini S&P 500 Futures.
Definitions
Volume Areas: A structurally sound market will build on areas of high volume (HVNodes). Should the market trend for long periods of time, it will lack sound structure, identified as low volume areas (LVNodes). LVNodes denote directional conviction and ought to offer support on any test.
If participants were to auction and find acceptance into areas of prior low volume (LVNodes), then future discovery ought to be volatile and quick as participants look to HVNodes for favorable entry or exit.
POCs: POCs are valuable as they denote areas where two-sided trade was most prevalent in a prior day session. Participants will respond to future tests of value as they offer favorable entry and exit.
MCPOCs: POCs are valuable as they denote areas where two-sided trade was most prevalent over numerous day sessions. Participants will respond to future tests of value as they offer favorable entry and exit.
Volume-Weighted Average Prices (VWAPs): A metric highly regarded by chief investment officers, among other participants, for quality of trade. Additionally, liquidity algorithms are benchmarked and programmed to buy and sell around VWAPs.
About
After years of self-education, strategy development, mentorship, and trial-and-error, Renato Leonard Capelj began trading full-time and founded Physik Invest to detail his methods, research, and performance in the markets.
Capelj also develops insights around impactful options market dynamics at SpotGamma and is a Benzinga reporter.
In no way should the materials herein be construed as advice. Derivatives carry a substantial risk of loss. All content is for informational purposes only.
The daily brief is a free glimpse into the prevailing fundamental and technical drivers of U.S. equity market products. Join the 300+ that read this report daily, below!
Overnight, equity index futures rotated higher, along with commodities. Implied volatility was bid. Bonds were lower.
In the news were some changes to China’s COVID policies, the European Central Bank’s (ECB) intent to follow its peers and raise interest rates in July by 25 basis points, and the Group of Seven (G-7) leaders are talking about geopolitics and placing limitations on Russia.
At home, mortgage lenders are turning “desperate” as soaring rates roil their industry. Some are bracing for a 20% reduction in business as 30-year mortgage rates level out below 5.75%.
Pursuant to some of our analyses last week, Scion Asset Management founder Michael Burry suggested a “supply gut at retail is the bullwhip effect.” More on this, later.
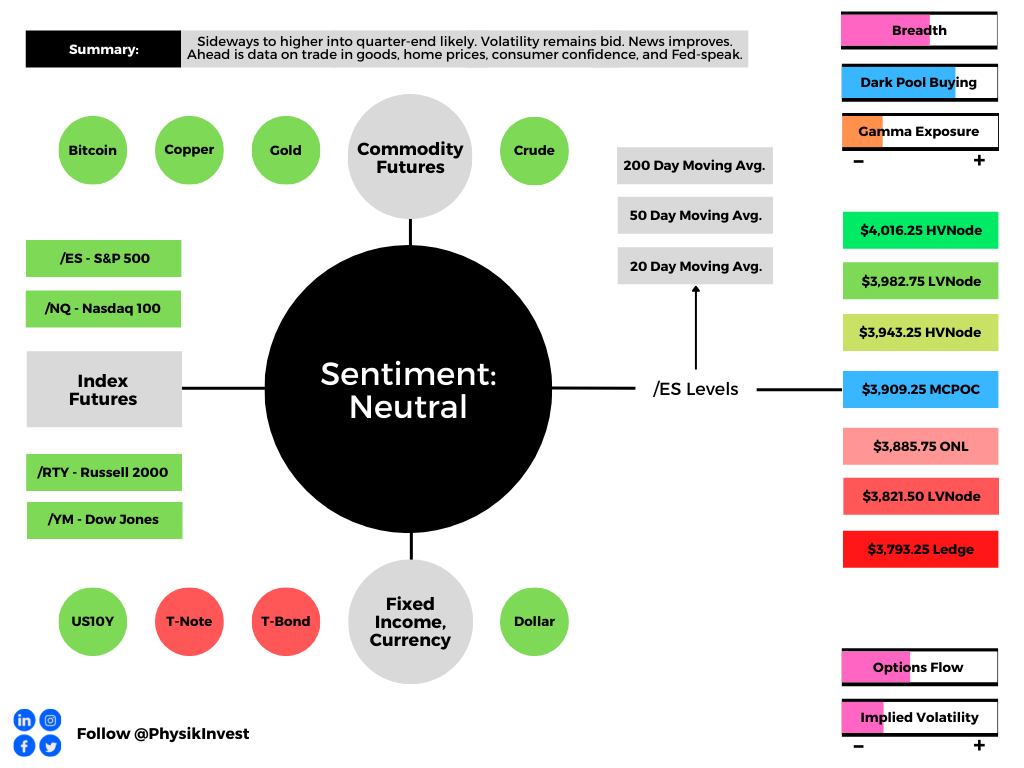
Ahead is data on trade in goods (8:30 AM ET), S&P Case-Shiller U.S. home price index (9:00 AM ET), consumer confidence index (10:00 AM ET), as well as updates by Federal Reserve (Fed) members (8:00 AM ET and 12:30 PM ET).
Graphic updated 6:30 AM ET. Sentiment Neutral if expected /ES open is inside of the prior day’s range. /ES levels are derived from the profile graphic at the bottom of the following section. Levels may have changed since initially quoted; click here for the latest levels. SqueezeMetrics Dark Pool Index (DIX) and Gamma (GEX) calculations are based on where the prior day’s reading falls with respect to the MAX and MIN of all occurrences available. A higher DIX is bullish. At the same time, the lower the GEX, the more (expected) volatility. Learn the implications of volatility, direction, and moneyness. SHIFT data used for S&P 500 (INDEX: SPX) options activity. Note that options flow is sorted by the call premium spent; if more positive, then more was spent on call options. Breadth reflects a reading of the prior day’s NYSE Advance/Decline indicator. VIX reflects a current reading of the CBOE Volatility Index (INDEX: VIX) from 0-100.
What To Expect
Fundamental: Though badly timed, last year ARK Invest’s Cathie Wood said inflation would be on its way out due in part to inventory build-ups and their impact on commodity prices.
Graphic: Via Societe Generale SA (OTC: SCGLY).
At the time, she asked whether the velocity of money was depressed given pent-up savings and demand for assets, putting forth disappointing GDP updates (which grew, mostly, on the back of inventories) and slightly negative retail final sales as support for her broader thesis.
Recall happenings in real estate – the iBuying debacle – late last year. Wood said this:
“This is unsustainable, … and I’m wondering if even the housing market inflation is going to give way, here.”
Participants were extending moneyness to nonmonetary assets, given monetary policies and an environment of debt and leverage that ultimately cuts into asset price volatility. Ultimately, these trends bolster the risks of carry when volatility does rise and the demand for money pushes deflation, particularly in asset prices.
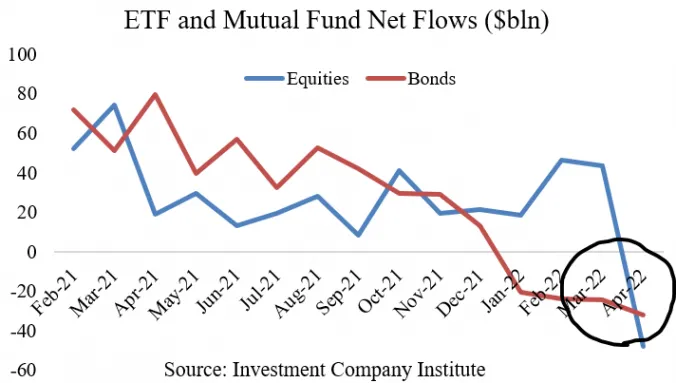
Graphic: Via the Investment Company Institute. Taken from Joseph Wang. “Investors are selling everything for cash.”
With bank deposits to drain about $1 trillion or so by year-end, that volatility is happening, now, as investors “continue to lower their selling prices to compete for the cash they want.”
Scion Asset Management’s Michael Burry nods at the “supply gut” in retail. Like Wood, he thinks that it is a deflationary pulse that manifests disinflation in consumer prices, prompting the Fed to reverse itself on rates and quantitative tightening (QT).
Read: DC’s Chartbook #16 on the “fundamental evolution in the global money markets.”
Graphic: Via Societe Generale SA (OTC: SCGLY).
That’s as Credit Suisse Group AG’s (NYSE: CS) Zoltan Pozsar, who gained much attention this year on his bold market commentary, said the Fed is likely to change course as it “can only deal with nominal [and] not real chokepoints.” This is as “nominal balance sheet and liquidity trends will, at some point, clash with the realities of a garden variety of supply chain issues.”
Graphic: Via @BarnabeBearBull. “[L]ast week 18 Central Banks tightened their monetary policy (12% of all monitored CBs), including 4 of the top 9. Strongest move in a while.”
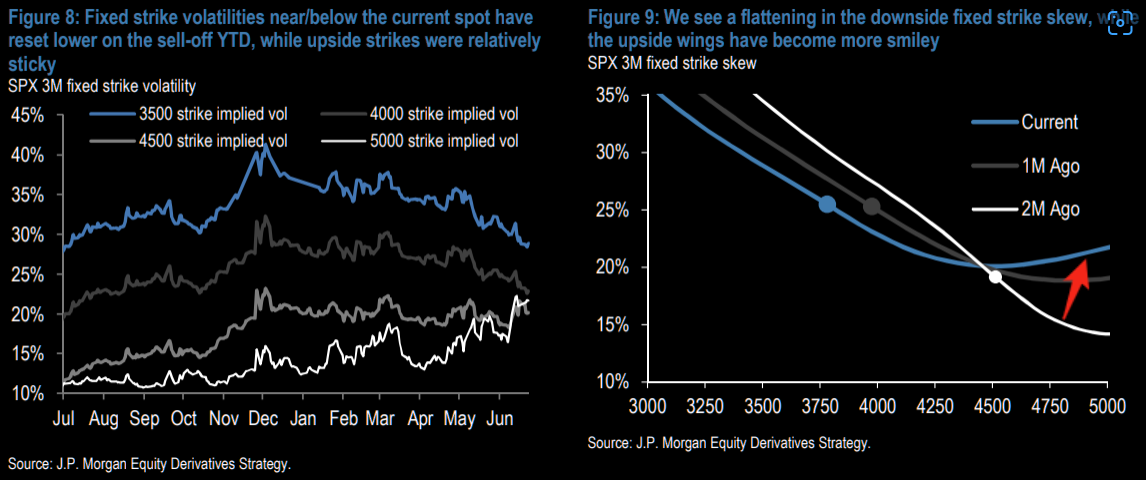
Positioning: Incredible is the still-depressed volatility skew we’ve talked about ad nauseam on.
Graphic: Via JPMorgan Chase & Co (NYSE: JPM). Taken from The Market Ear. “Overwriting longs and using the premium to buy downside protection is relatively cheaper now.”
It’s the strong supply of volatility. Participants are hedging, buying into volatility that is closer to current prices, and selling (skew) that which is farther out.
The counterparts are long that volatility further out, which they may sell into declines, and all of this, together, “results in vol underperformance on market declines,” per Sergei Perfiliev.
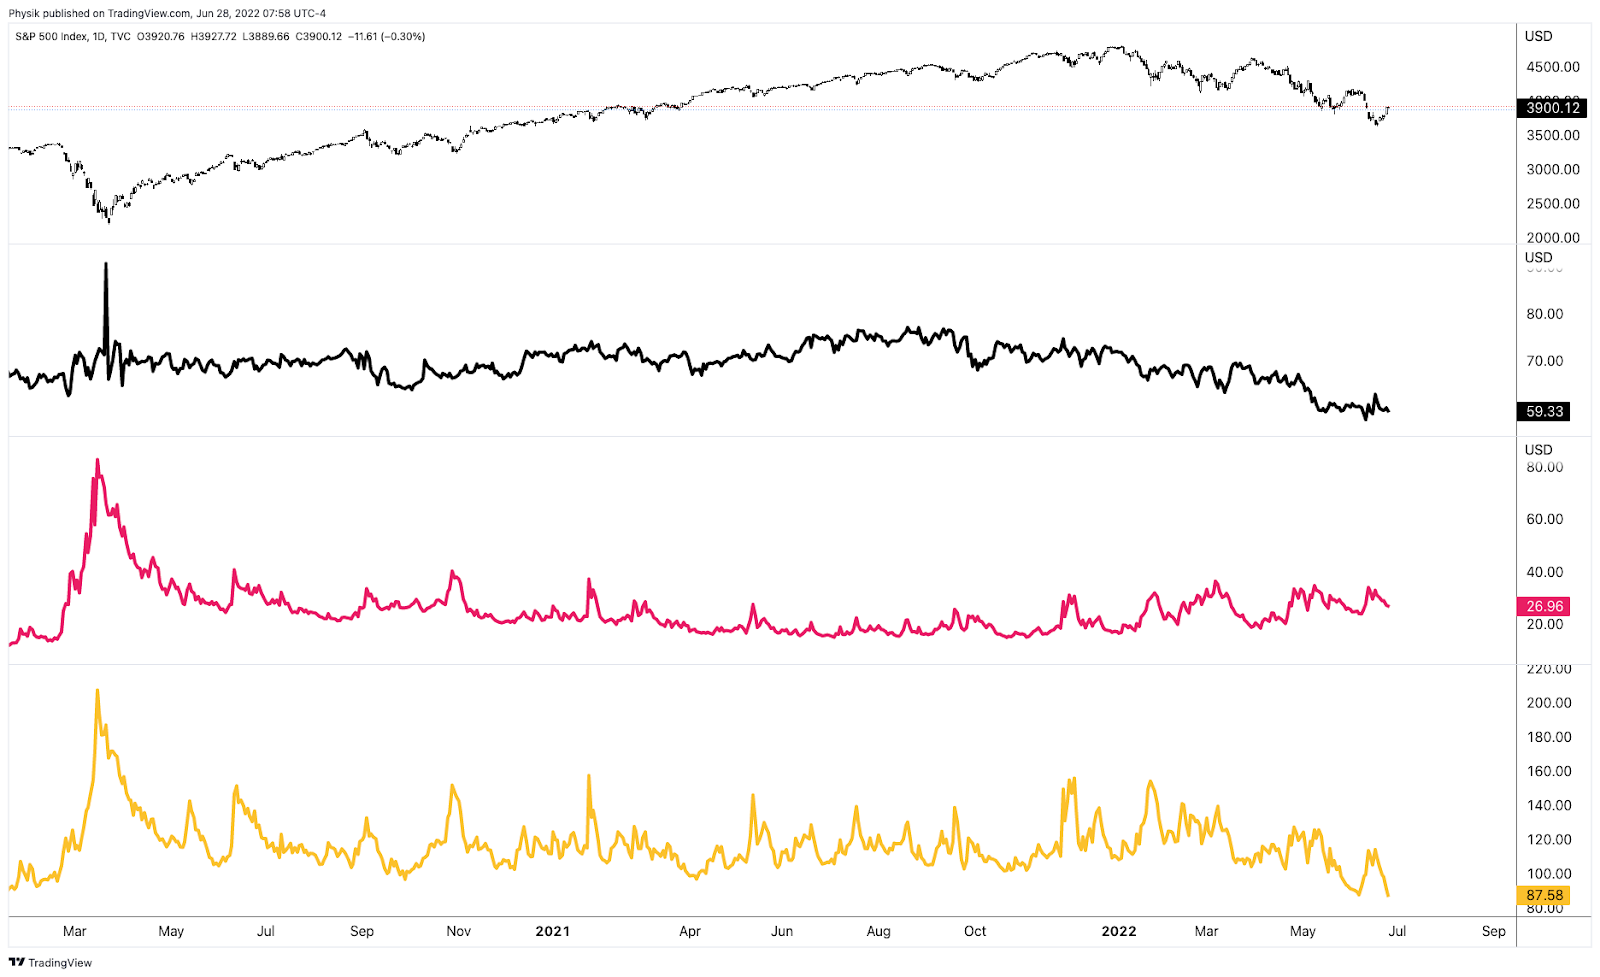
Graphic: Via Physik Invest. Taken from TradingView. The top is S&P 500 (INDEX: SPX). The second, from the top, is the Nations SkewDex (INDEX: SDEX), a clearer measure of options skew. The second from the bottom is the Cboe Volatility Index (INDEX: VIX). The bottom is the Cboe VVIX index (INDEX: VVIX), a naive measure of skew.
For that reason, the volatility that the markets are realizing (RVOL) is heightened and, at times, in excess of that implied.
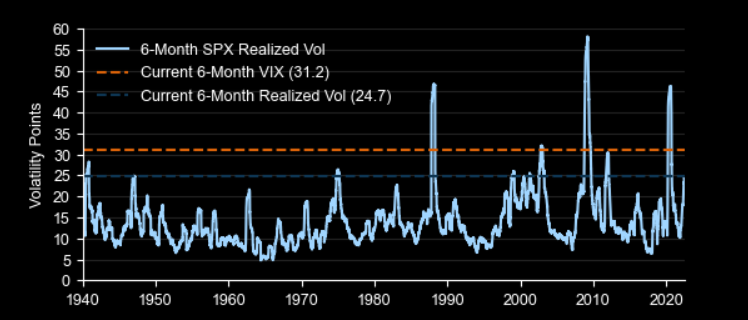
Graphic: Via Goldman Sachs Group Inc (NYSE: GS). Taken from The Market Ear. “SPX 6-month realized volatility is at a level rarely seen outside of major crises; current 6-month implied volatility has been exceeded in just 3 periods since 1940.”
As said, yesterday, given these dynamics, it makes sense to lean toward owning volatility, rather than selling it. A “higher starting point” in IVOL, and a still-present right-tail (from the positioning for a bear market rally), make it so we may position, for less cost, in short-dated structures with asymmetric payouts (call and put side), precisely as we’ve been talking about for half-a-year.
Graphic: Via Pat Hennessy. “[T]he performance of short-dated 1×2 put ratios in SPX this year. Despite being short the tail, the grind lower has been well captured by this trade structure.”
In the near term, from a positioning perspective, the front-running of quarter-end repositioning flow is (and is expected), in part, to add to the equity market upside.
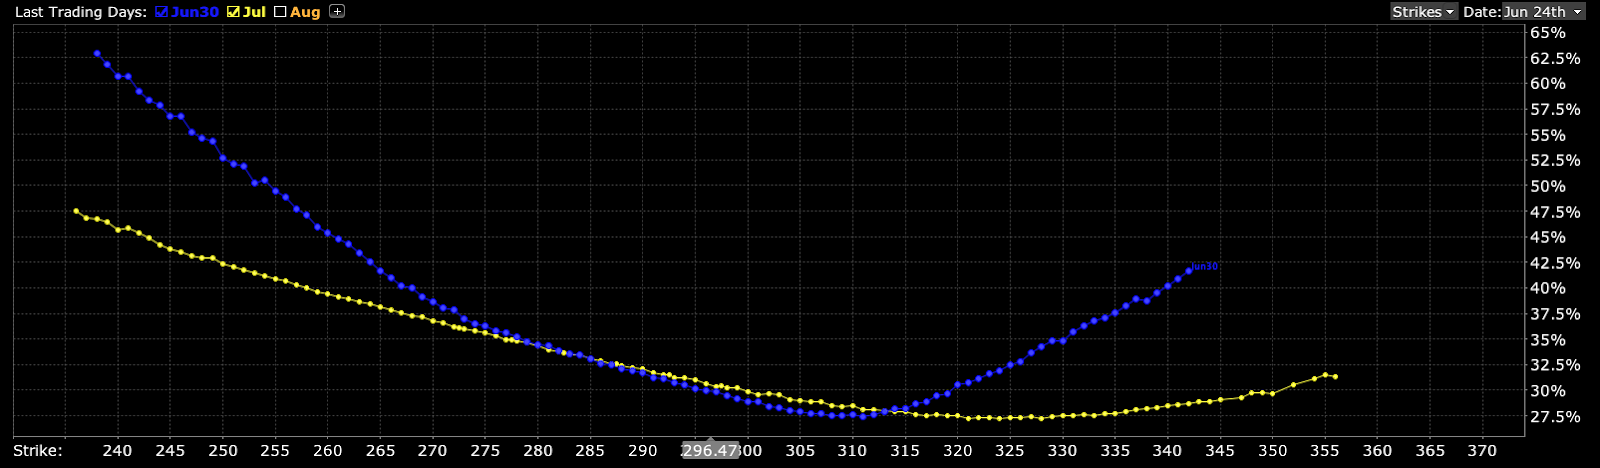
Graphic: Taken by Physik Invest from Interactive Brokers Group Inc (NASDAQ: IBKR) on 6/24/2022. Multi-expiry skew in the Invesco QQQ Trust Series 1 (NASDAQ: QQQ). Notice the v-shape in the shorter maturity and smirk in the longer maturity. Here’s what that means.
Technical: As of 6:30 AM ET, Tuesday’s regular session (9:30 AM – 4:00 PM ET), in the S&P 500, will likely open in the mid-to-upper part of a balanced overnight inventory, inside of prior-range and -value, suggesting a limited potential for immediate directional opportunity.
In the best case, the S&P 500 trades higher; activity above the $3,909.25 MCPOC puts in play the $3,943.25 HVNode. Initiative trade beyond the HVNode could reach as high as the $3,982.75 LVNode and $4,016.25 HVNode, or higher.
In the worst case, the S&P 500 trades lower; activity below the $3,909.25 MCPOC puts in play the $3,885.75 ONL. Initiative trade beyond the ONL could reach as low as the $3,821.50 LVNode and $3,793.25 Ledge, or lower.
Click here to load today’s key levels into the web-based TradingView charting platform. Note that all levels are derived using the 65-minute timeframe. New links are produced, daily.
Graphic: 65-minute profile chart of the Micro E-mini S&P 500 Futures.
Balanced (Two-Timeframe Or Bracket) Trade The Status Quo: Rotational trade that denotes current prices offer favorable entry and exit.
Balance areas make it easy to spot a change in the market (i.e., the transition from two-time frame trade, or balance, to one-time frame trade, or trend).
Modus operandi is responsive trade (i.e., fade the edges), rather than initiative trade (i.e., play the break).
Definitions
Overnight Rally Highs (Lows): Typically, there is a low historical probability associated with overnight rally-highs (lows) ending the upside (downside) discovery process.
Volume Areas: A structurally sound market will build on areas of high volume (HVNodes). Should the market trend for long periods of time, it will lack sound structure, identified as low volume areas (LVNodes). LVNodes denote directional conviction and ought to offer support on any test.
If participants were to auction and find acceptance into areas of prior low volume (LVNodes), then future discovery ought to be volatile and quick as participants look to HVNodes for favorable entry or exit.
MCPOCs: POCs are valuable as they denote areas where two-sided trade was most prevalent over numerous day sessions. Participants will respond to future tests of value as they offer favorable entry and exit.
About
After years of self-education, strategy development, mentorship, and trial-and-error, Renato Leonard Capelj began trading full-time and founded Physik Invest to detail his methods, research, and performance in the markets.
Capelj also develops insights around impactful options market dynamics at SpotGamma and is a Benzinga reporter.
In no way should the materials herein be construed as advice. Derivatives carry a substantial risk of loss. All content is for informational purposes only.
The daily brief is a free glimpse into the prevailing fundamental and technical drivers of U.S. equity market products. Join the 300+ that read this report daily, below!
Overnight, equity index futures auctioned sideways-to-higher, along with bonds, snapping the pricing in of tighter monetary policies and economic slowing.
Creeping up are expectations regarding the amount of tightening policymakers are to add. Treasury yields had their biggest jump in decades. U.S. 3-year Treasury yields, in particular, were up 25 basis points, to 3.49%, the highest since 2007, per Bloomberg.
Now, traders see nearly 200 basis points of tightening by the Federal Reserve’s (Fed) by September, as well as the possibility of a one-off 75 basis point hike. The overnight rate is expected to peak near 4% by mid-2023.
Accordingly, the U.S. and European real estate values have taken a hit amid rising rates and inflated prices, falling 5-10%. Rental demand has thinned, also.
In other news, the U.S. sought to boost supplies of Russian fertilizer as “sanctions fears have led to a sharp drop in supplies, fueling spiraling global food costs.”
Graphic updated 6:30 AM ET. Sentiment Neutral if expected /ES open is inside of the prior day’s range. /ES levels are derived from the profile graphic at the bottom of the following section. Levels may have changed since initially quoted; click here for the latest levels. SqueezeMetrics Dark Pool Index (DIX) and Gamma (GEX) calculations are based on where the prior day’s reading falls with respect to the MAX and MIN of all occurrences available. A higher DIX is bullish. At the same time, the lower the GEX, the more (expected) volatility. Learn the implications of volatility, direction, and moneyness. SHIFT data used for S&P 500 (INDEX: SPX) options activity. Note that options flow is sorted by the call premium spent; if more positive, then more was spent on call options. Breadth reflects a reading of the prior day’s NYSE Advance/Decline indicator. VIX reflects a current reading of the CBOE Volatility Index (INDEX: VIX) from 0-100.
What To Expect
Fundamental: In what seems to be “a coordinated attempt to guide the market through trusted journalists,” recent updates on the path of inflation may push policymakers to surprise markets.
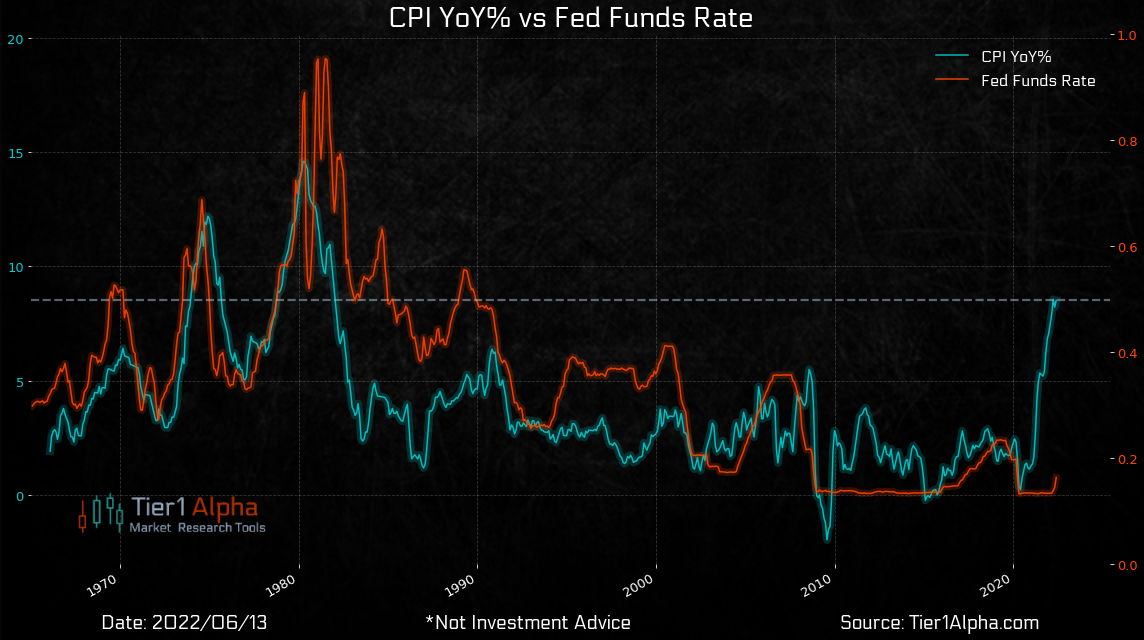
Graphic: Via Tier1Alpha. “A disappointing CPI suggested that calls for inflation peaks were premature and now markets are trying to interpret Powell’s (and Lagarde’s) true intentions.”
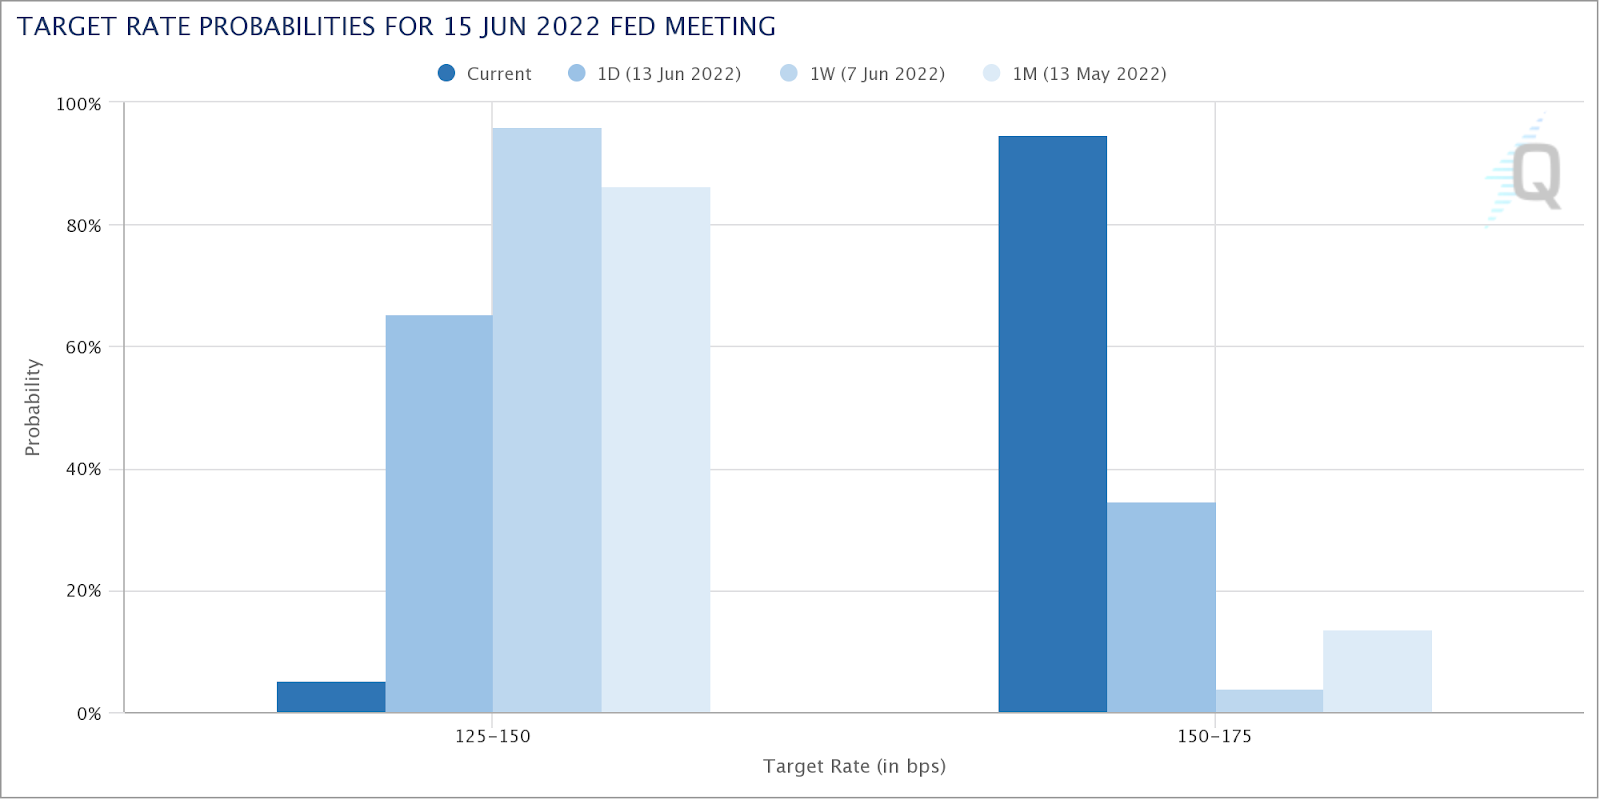
Markets reacted, accordingly, pricing in a near-certainty of a 75 basis point hike, later this week.
Graphic: Graphic: Via CME Group Inc’s (NASDAQ: CME) FedWatch Tool. In one session, participants priced in a near-certainty of a 75 basis point hike.
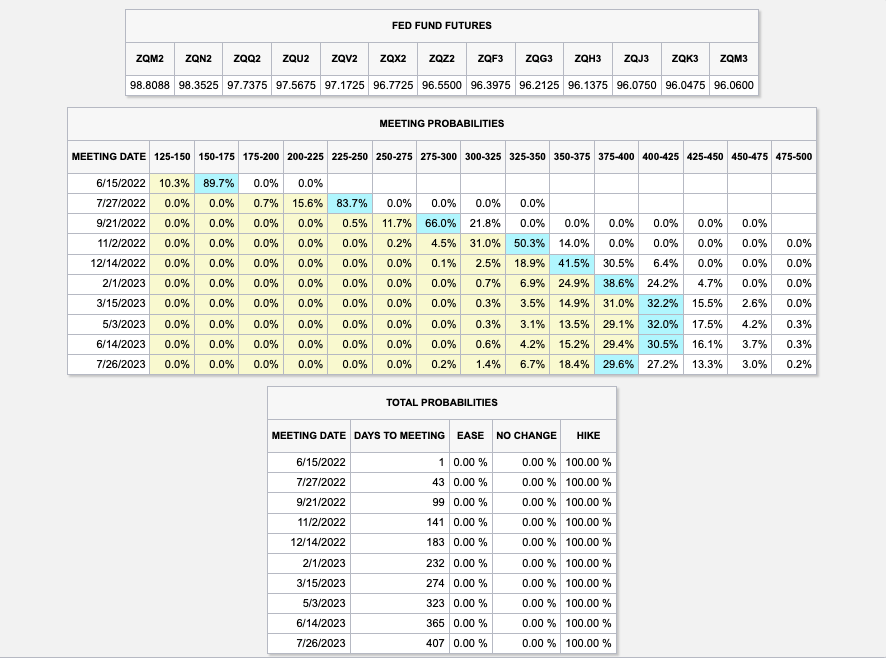
Looking into the future, Fed Funds target rates, based on the Fed Fund futures contract prices, are projected to peak into the mid-next year (Spring/Summer 2023).
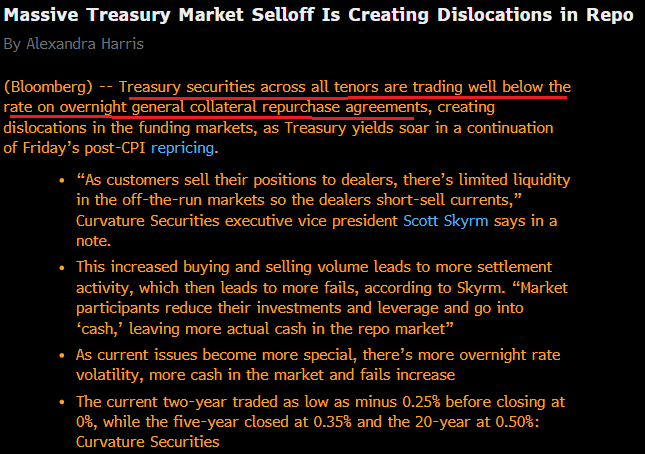
Accordingly, Treasury market turmoil continued with liquidity “worse than it was leading up to Lehman,” says Christian Hoffman, a portfolio manager for Thornburg Investment Management.
“That creates even more risk because if the market doesn’t have liquidity, it can gap down very quickly.”
Graphic: Via Bloomberg. Taken from @DonutShorts. This could “be a sign of another shortage of collateral and that another systemic risk event might come up in the future,” as Fabian Wintersberger well explained in his newsletter.
As talked about in past newsletters, pressures in the financial system, all the while the economy is slowing, are rising. This is amidst a dash for cash as fixed income and equity markets are not perceived to be as safe.
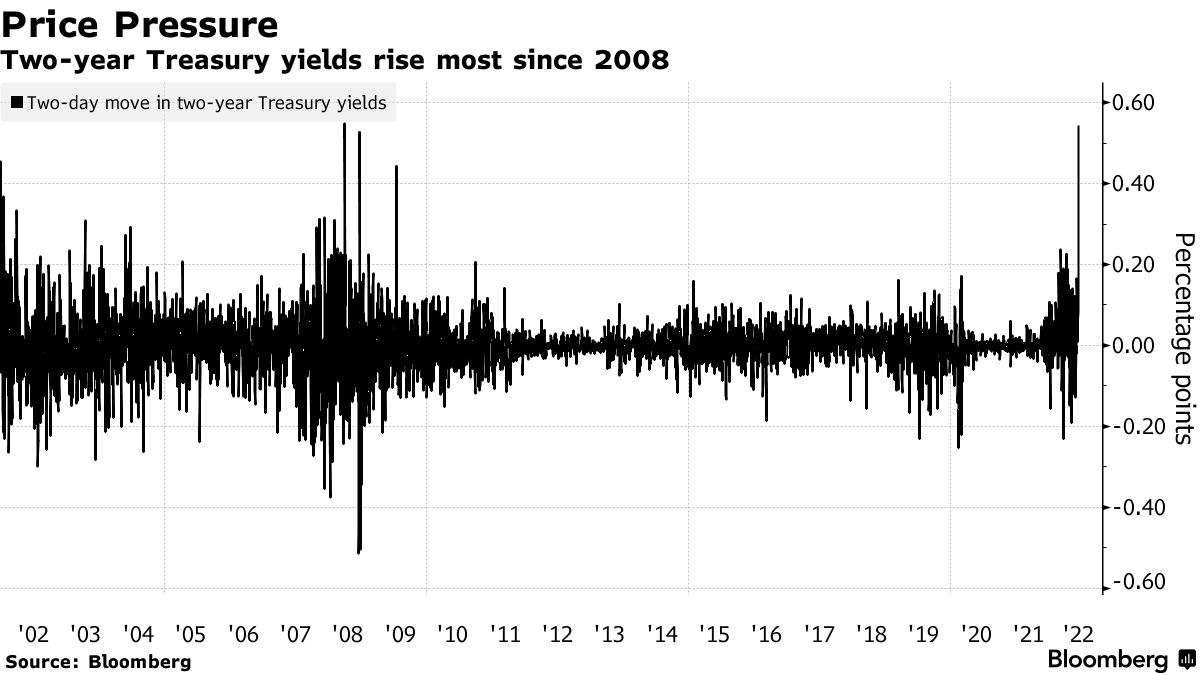
Graphic: Via Bloomberg. “Two-year US Treasury yields surged 29 basis points as bond prices tanked, … the biggest two-day increase since 2008, a sign of just how rapidly traders are adjusting where they think the Federal Reserve will take interest rates.”
“People are trying to process what’s behind these large moves,” Subadra Rajappa, head of U.S. rates strategy at Societe Generale SA (OTC: SCGLY), said. She attributes some of the volatility to poor liquidity, panic selling, and margin calls.
Ultimately, according to Bloomberg’s John Authers, this is a tantrum the Fed is likely to let “rip for a while” before, potentially, suffocating “with more easy money.”
“The relationship between central banks and bond markets is, as I’ve said before, a lot like that between a parent and an angry toddler. Indulging the bond market early last year might prove a critical mistake in losing parental authority for the Fed.”
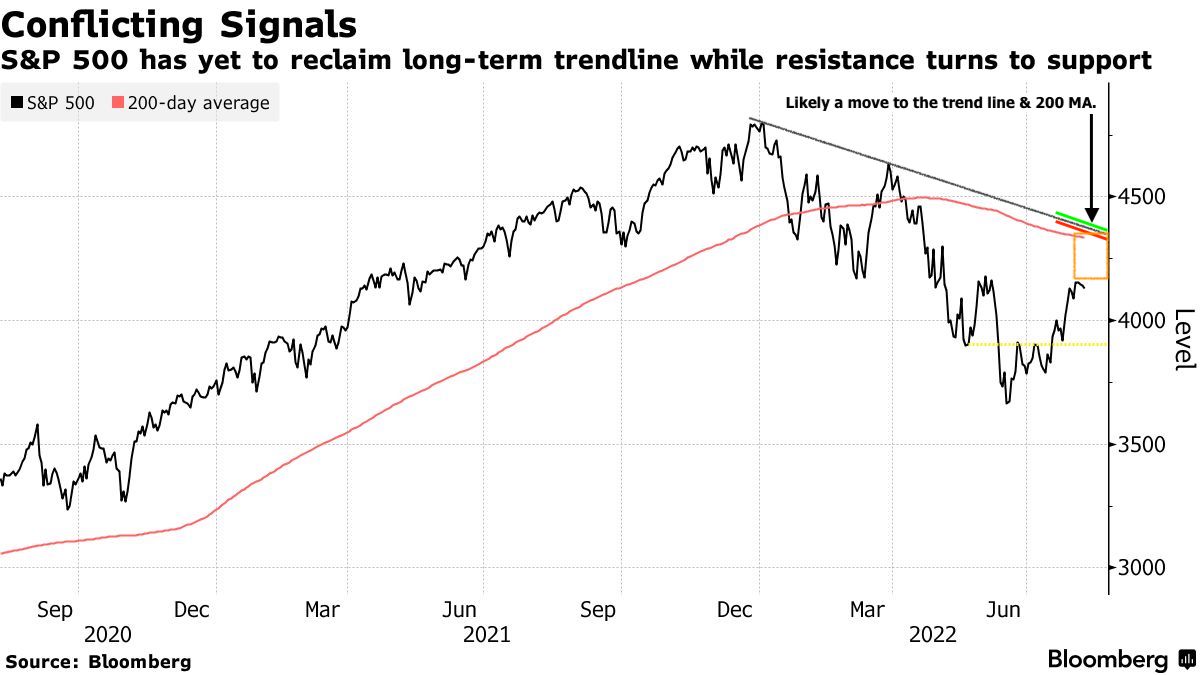
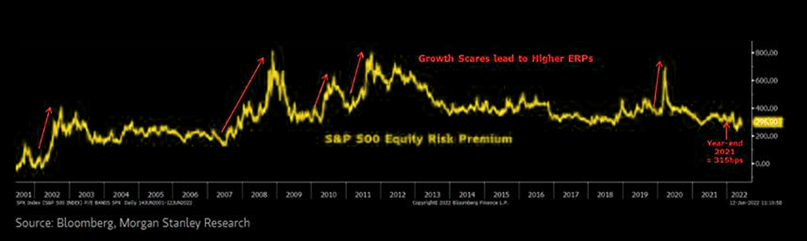
Graphic: Via Morgan Stanley (NYSE: MS). Taken from The Market Ear. MS’s Mike Wilson says: “From our vantage point, both rates and ERP appeared to be mis-priced [and] we think the S&P 500 is headed toward 3,400 before a more tradable low is in.”
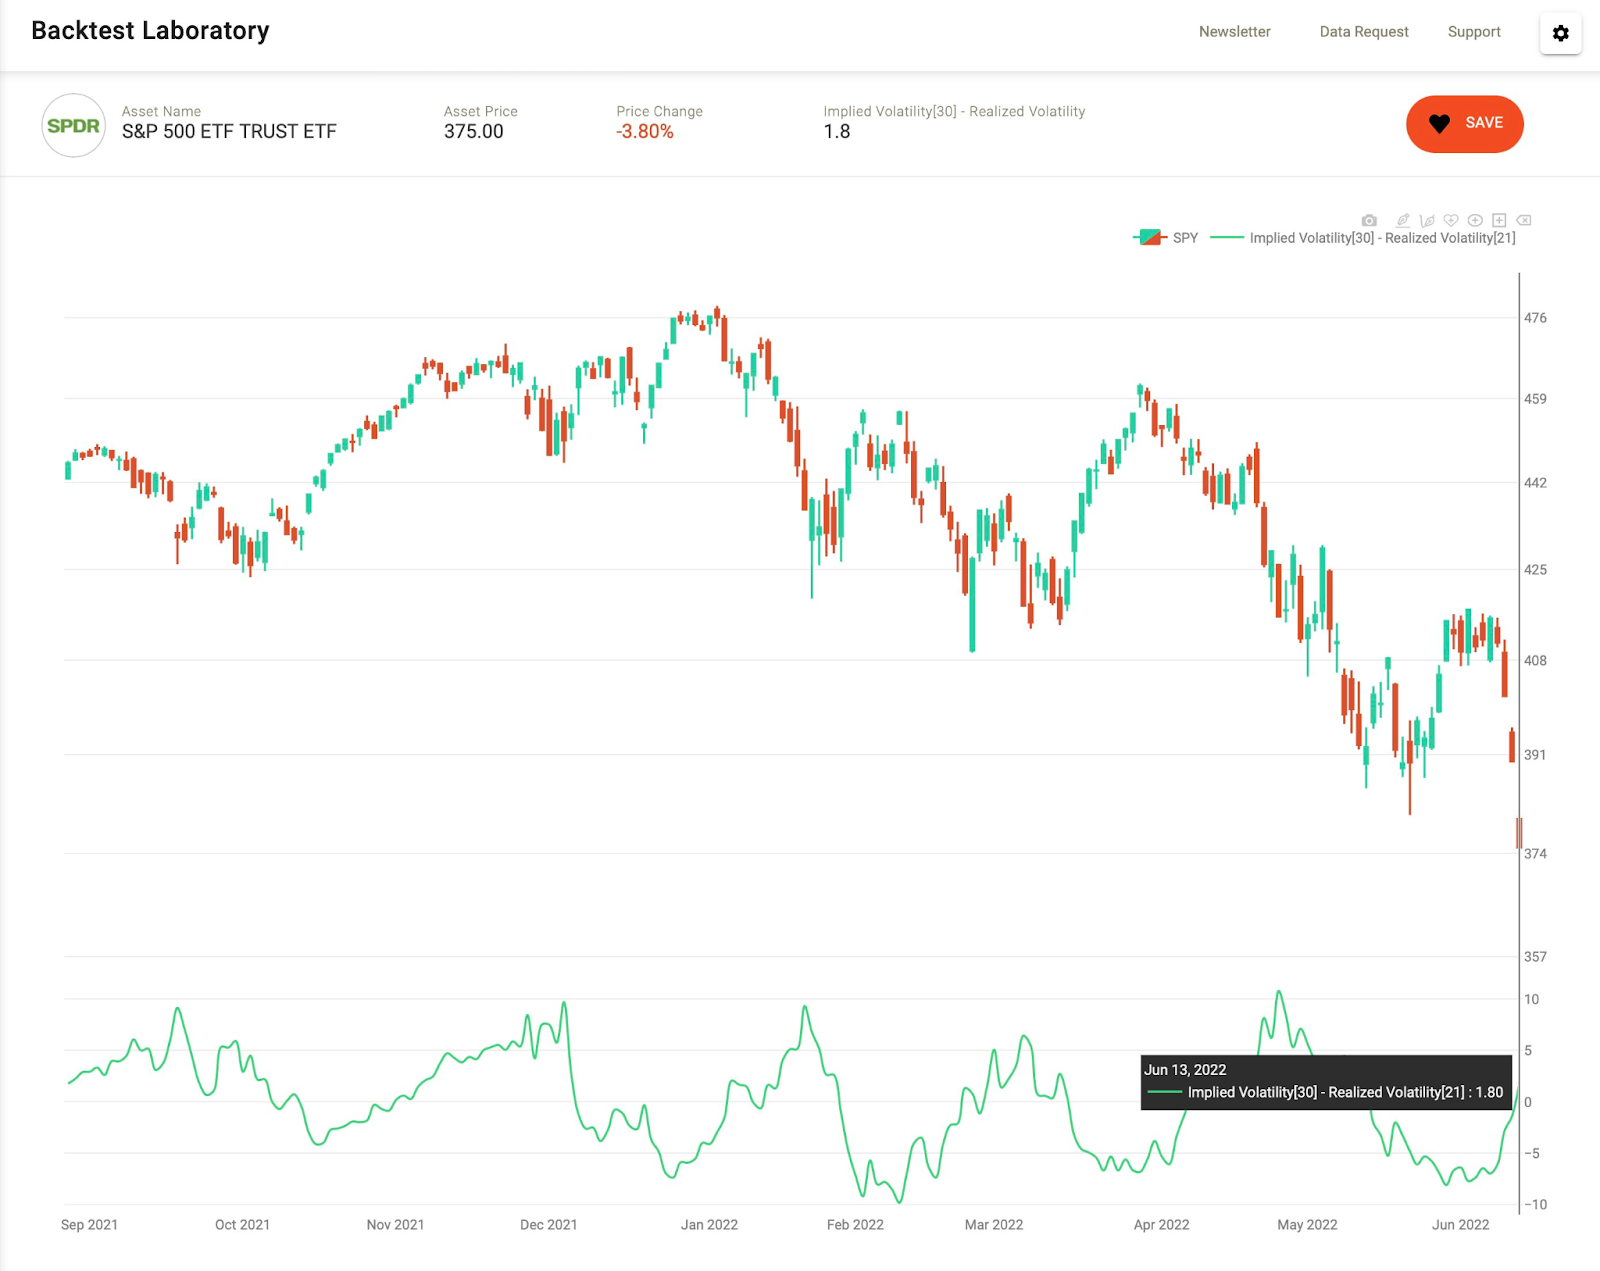
Positioning: Last night, as I wrote a report for SpotGamma’s subscribers, noteworthy is how “subdued” volatility was with, recently, “realized outpacing that which is implied by participants’ options activity.”
That dynamic resolved, Monday, as implied (IVOL) finally retook that which is realized (RVOL).
Read, also, the Daily Brief for Monday, June 13, 2022.
Moreover, for much of the session, the equity markets were range-bound as most of the movement in both equity and volatility markets happened overnight.
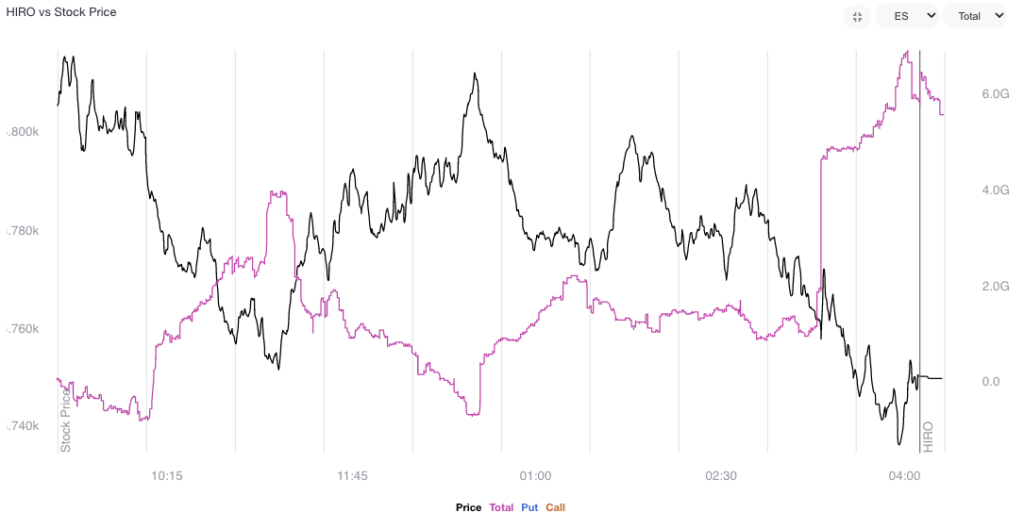
Graphic: SpotGamma’s Hedging Impact of Real-Time Options (HIRO) indicator for ES (SPX + SPY). Via SpotGamma, “Into weakness, participants mainly sold puts (a bullish trade). Into strength, they bought puts (a bearish trade). Throughout the session, too, there was light call buying (a bullish trade). This helps with understanding why the VIX moved much less during the day session.”
Noteworthy, was the absence of demand for protection that performs non-linearly with respect to changes in direction (delta) and volatility (vega).
“Fixed strike vols actually caught a bid, VIX futures are in backwardation,” The Ambrus Group’s Kris Sidial explains.
“However, that spot-vol relationship in the S&P still underperformed and skew was also lackluster.”
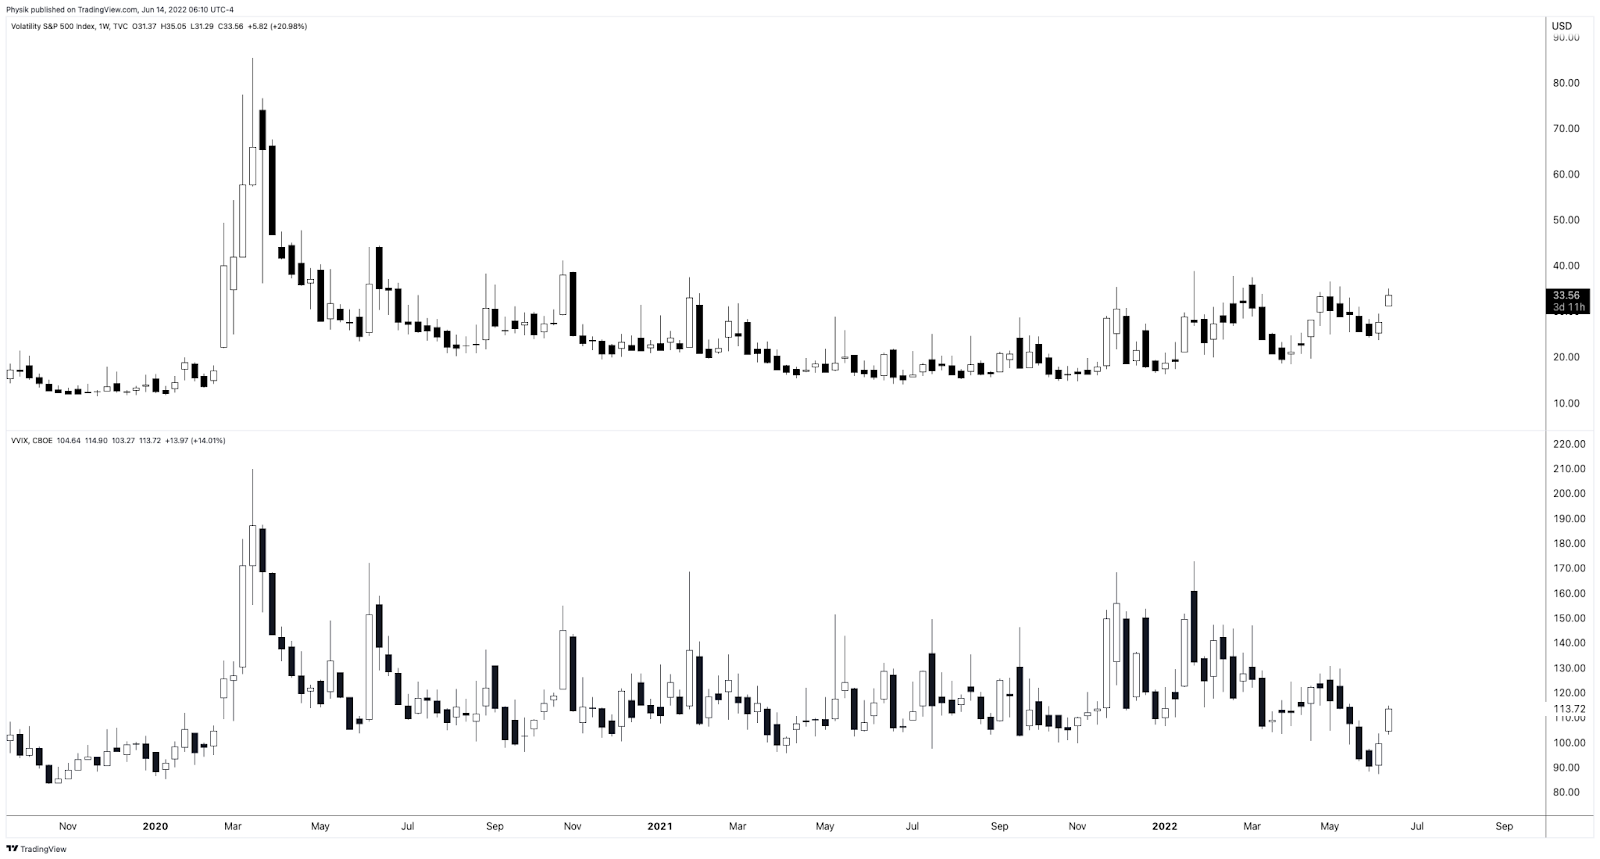
Graphic: Via TradingView. Taken by Physik Invest. The Cboe VVIX Index (INDEX: VVIX), the expected volatility of the 30-day forward price of the VIX, or the volatility of volatility (a naive but useful measure of skew), remains depressed, too, in comparison to the VIX, itself.
As said before, it is supply and demand dynamics that played into divergences between the volatility that the market realizes (RVOL) and that which is implied (IVOL). Participants are hedged and volatility remains well-supplied.
Was there to be forced selling and demand for protection en masse, we’d likely see that repricing in volatility we have been looking for.
To quote Benn Eifert of QVR Advisors: “Skew goes up if vol outperforms the skew curve a lot on a selloff.”
Graphic: Via Banco Santander SA (NYSE: SAN) research.
And so, to position for that, (although it is not as opportune as it was a week ago), it continues to make sense to own volatility structures (that, one, either sold very short-dated pre-FOMC and OPEX volatility to fund that which is farther-dated or, two, buy into implied skew convexity, non-linear with respect to delta [gamma] and vega [volga] changes).
Notwithstanding, per SpotGamma, a lower bound in the market is near $3,700.00. It is at this level options flows may shift from “inducing” to “reducing” volatility as, “beneath this level, all else equal, liquidity providers would have less and less pressure to add on further weakness.”
Ultimately, it is at higher levels of volatility that the marginal impact of further volatility compression is likely to do more to bolster equity market upside as liquidity providers buy back their negative delta hedges to positive delta (short put) exposures.
SpotGamma’s founder, Brent Kochuba, adds: “Ultimately this expiration is clearing out a lot of equity put protection, which clears the way for lower lows in the weeks and months ahead.”
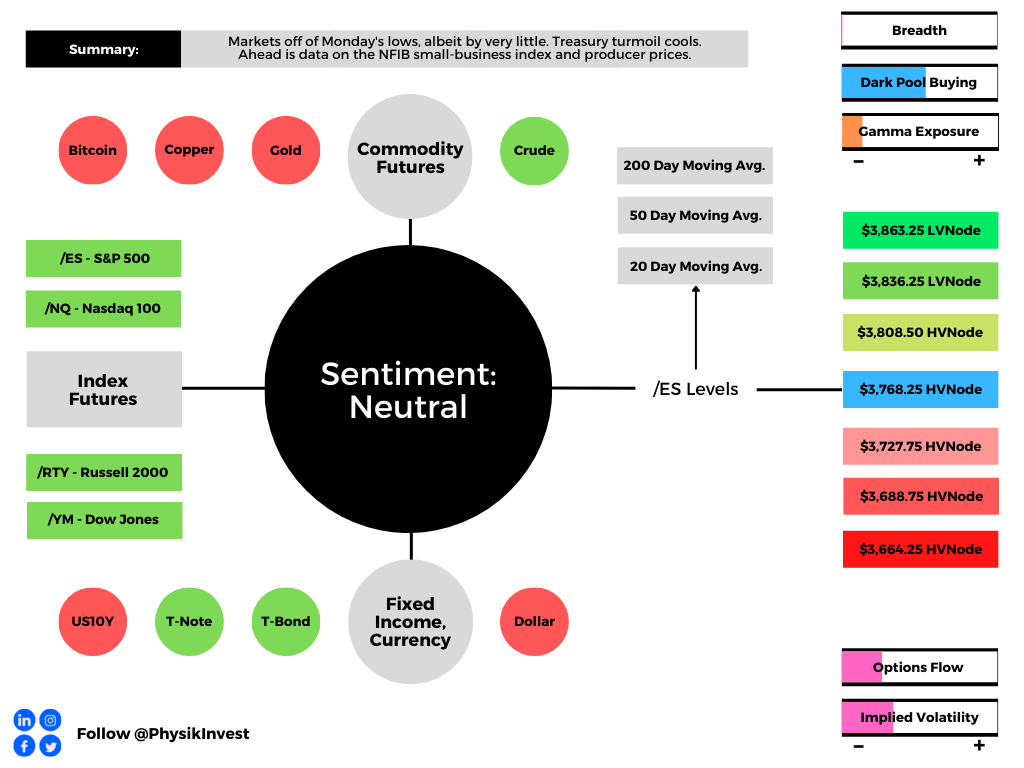
Technical: As of 6:30 AM ET, Tuesday’s regular session (9:30 AM – 4:00 PM ET), in the S&P 500, will likely open in the lower part of a positively skewed overnight inventory, inside of prior-range and -value, suggesting a limited potential for immediate directional opportunity.
In the best case, the S&P 500 trades higher; activity above the $3,768.25 HVNode puts in play the $3,808.50 HVNode. Initiative trade beyond the $3,808.50 HVNode could reach as high as the $3,836.25 LVNode and $3,863.25 LVNode, or higher.
In the worst case, the S&P 500 trades lower; activity below the $3,768.25 HVnode puts in play the $3,727.75 HVNode. Initiative trade beyond the $3,727.75 HVNode could reach as low as the $3,688.75 and $3,664.25 HVNode, or lower.
Click here to load today’s key levels into the web-based TradingView charting platform. Note that all levels are derived using the 65-minute timeframe. New links are produced, daily.
Graphic: 65-minute profile chart of the Micro E-mini S&P 500 Futures.
Definitions
Volume Areas: A structurally sound market will build on areas of high volume (HVNodes). Should the market trend for long periods of time, it will lack sound structure, identified as low volume areas (LVNodes). LVNodes denote directional conviction and ought to offer support on any test.
If participants were to auction and find acceptance into areas of prior low volume (LVNodes), then future discovery ought to be volatile and quick as participants look to HVNodes for favorable entry or exit.
Point Of Control: POCs are valuable as they denote areas where two-sided trade was most prevalent in a prior day session. Participants will respond to future tests of value as they offer favorable entry and exit.
Micro Composite Point Of Control: POCs are valuable as they denote areas where two-sided trade was most prevalent over numerous day sessions. Participants will respond to future tests of value as they offer favorable entry and exit.
Volume-Weighted Average Prices (VWAPs): A metric highly regarded by chief investment officers, among other participants, for quality of trade. Additionally, liquidity algorithms are benchmarked and programmed to buy and sell around VWAPs.
About
After years of self-education, strategy development, mentorship, and trial-and-error, Renato Leonard Capelj began trading full-time and founded Physik Invest to detail his methods, research, and performance in the markets.
Capelj also develops insights around impactful options market dynamics at SpotGamma and is a Benzinga reporter.
In no way should the materials herein be construed as advice. Derivatives carry a substantial risk of loss. All content is for informational purposes only.
The daily brief is a free glimpse into the prevailing fundamental and technical drivers of U.S. equity market products. Join the 300+ that read this report daily, below!
Overnight, equity index futures continued lower after breaking a multi-day consolidation late yesterday afternoon.
This is amid growth concerns and the European Central Bank (ECB) decision to end asset purchases this month and commit to a 25-basis-point interest rate hike at its next meeting, setting the stage for further rate hikes, potentially 50-basis-points or higher.
Ahead are updates to consumer prices (8:30 AM ET), which may shed further clarity on the path of the Federal Reserve’s policies. Later are updates to consumer sentiment and inflation expectations (10:00 AM ET), as well as the budget balance (2:00 PM ET).
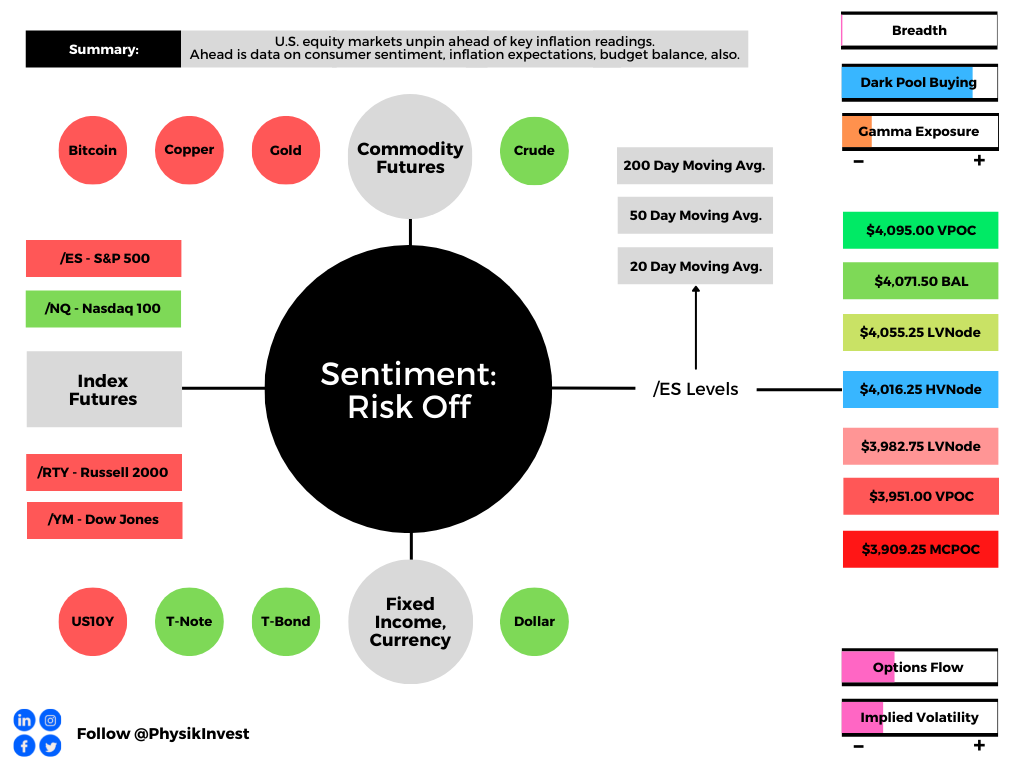
Graphic updated 6:30 AM ET. Sentiment Risk-Off if expected /ES open is below the prior day’s range. /ES levels are derived from the profile graphic at the bottom of the following section. Levels may have changed since initially quoted; click here for the latest levels. SqueezeMetrics DarkPool Index (DIX) and Gamma (GEX) calculations are based on where the prior day’s reading falls with respect to the MAX and MIN of all occurrences available. A higher DIX is bullish. At the same time, the lower the GEX, the more (expected) volatility. Learn the implications of volatility, direction, and moneyness. SHIFT data used for S&P 500 (INDEX: SPX) options activity. Note that options flow is sorted by the call premium spent; if more positive, then more was spent on call options. Breadth reflects a reading of the prior day’s NYSE Advance/Decline indicator. VIX reflects a current reading of the CBOE Volatility Index (INDEX: VIX) from 0-100.
What To Expect
Fundamental: The CPI report is a driver of perceptions regarding future Fed activity.
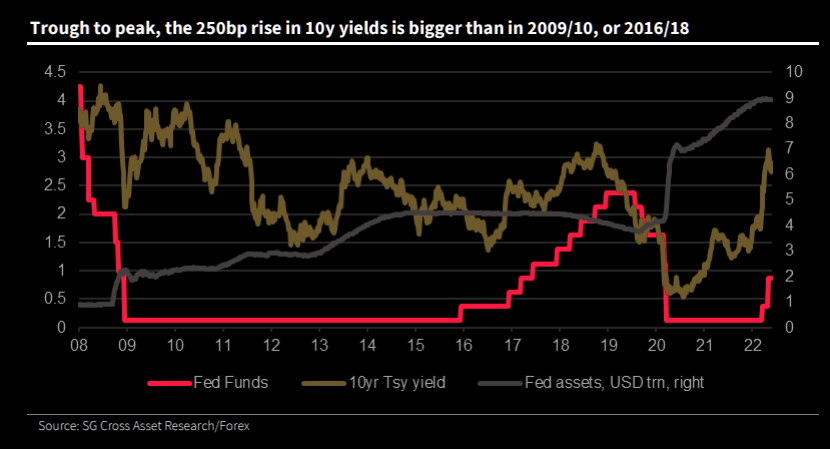
Graphic: Via Societe Generale SA (OTC: SCGLY). Taken from The Market Ear. SocGen’s Kit Juckes explains that “the Fed put its foot down on the accelerator in 2020, harder than ever before, to keep the global economy going. Now it’s put its foot on the brake, equally hard but perhaps, a little bit late. How this plays out will become clearer in the coming weeks.”
Expected is an 8.2% rise year-over-year (YoY) and 0.7% month-over-month (MoM). In April, these numbers were 8.3% and 0.3%, respectively.
Core CPI (which excludes food and energy) is expected to rise by a rate lower than in April, 5.9% YoY and 0.5% MoM, respectively.
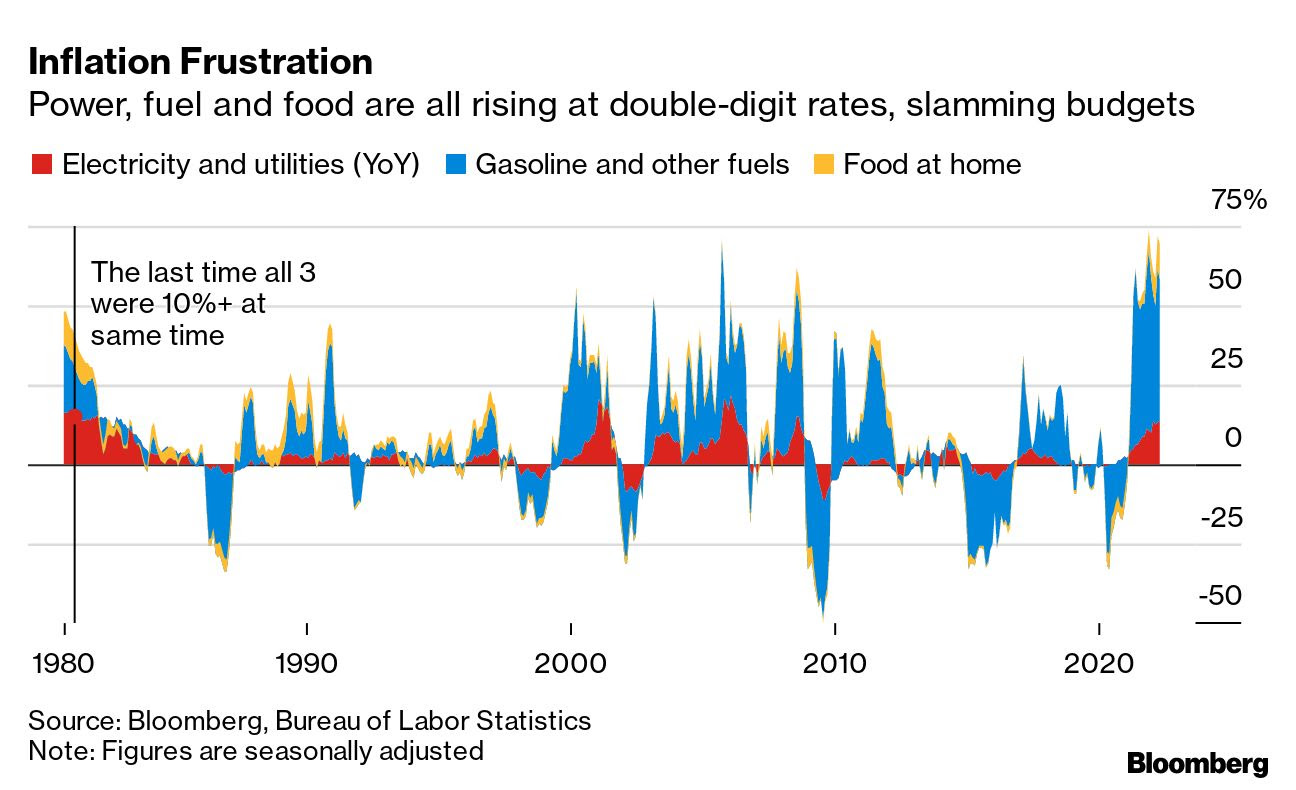
Graphic: Via Bloomberg. “For two straight months, fuel, power and grocery-store food have all been rising at double-digit annual rates—and tomorrow’s data is likely to show a further surge. Meantime, stocks fell with growth concerns in focus after the ECB moved to combat inflation.”
What matters most is the latter – core inflation – which the Fed has more control over. If lower than expected, that may warrant more appetite for risk.
“While inflation in some parts of the world [is] yet to peak, there are at least some signs emerging that we may not be too far off in terms of a turning point,” adds Khoon Goh of Australia & New Zealand Banking Group ADR (OTC: ANZBY).
Bloomberg reports semiconductor prices are now down 14% from the middle of last year. Also, the spot rate for shipping containers fell 26% while fertilizer prices are 24% below their record.
Still, the commitment to aggressive contractionary monetary policies is likely to remain. This reduction of liquidity and credit has consequences on the real economy and asset prices which rose and kept the deflationary pressures of monetary intervention at bay.
Positioning: It remains profitable to own options structures as implied (IVOL) underprices the volatility which is realized (RVOL).
This is the result of what options analytics service SqueezeMetrics suggests is an “absolute slamming” (i.e., sale of options) that’s compressing IVOL in shorter-dated tenors.
It is “[o]nly rational to consider a bulk of them as put underwrites, because completely irrational otherwise.”
Important to note that this is in the context of next week’s large options expirations.
Into those events, typically, the frontrunning of delta hedging flows with respect to changes in time (charm), mainly, and volatility (vanna) provide an added boost.
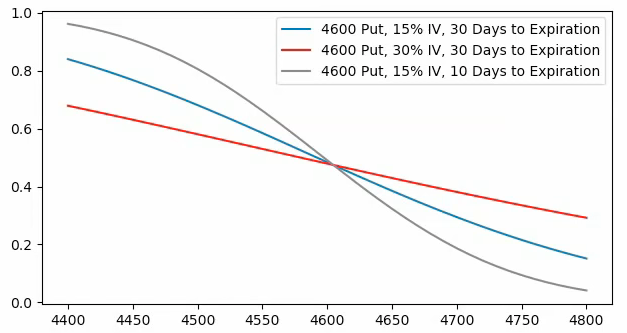
Graphic: Via SpotGamma. “SPX prices X-axis. Option delta Y-axis. When the factors of implied volatility and time change, hedging ratios change. For instance, if SPX is at $4,700.00 and IV jumps 15% (all else equal), the dealer may sell an additional 0.2 deltas to hedge their exposure to the addition of a positive 0.2 delta. The graphic is for illustrational purposes, only.”
As stated Monday, however, the marginal impact of further volatility compression, since IVOL was falling from already low levels, was likely to do less to bolster equity upside.
A lot of the supportive action happened in the days and weeks prior, hence the comments on owning options.
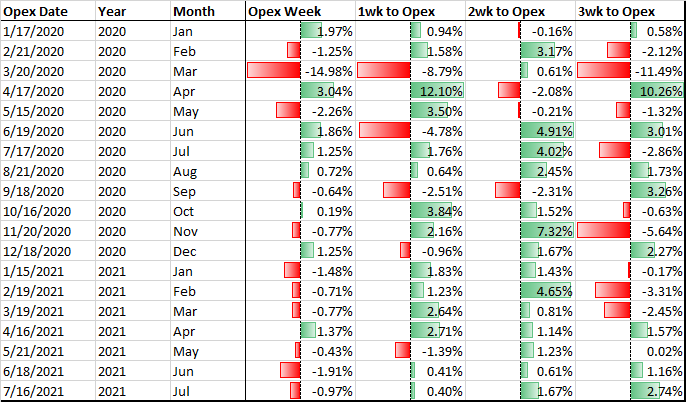
Graphic: @pat_hennessy breaks down returns for the S&P 500, categorized by the week relative to OPEX.
Technical: As of 6:30 AM ET, Friday’s regular session (9:30 AM – 4:00 PM ET), in the S&P 500, will likely open in the lower part of a negatively skewed overnight inventory, outside of prior-range and -value, suggesting a potential for immediate directional opportunity.
In the best case, the S&P 500 trades higher; activity above the $4,016.25 HVNode puts in play the $4,055.25 LVNode. Initiative trade beyond the LVNode could reach as high as the $4,071.50 BAL and $4,095.00 VPOC, or higher.
In the worst case, the S&P 500 trades lower; activity below the $4,016.25 HVNode puts in play the $3,982.75 LVNode. Initiative trade beyond the LVNode could reach as low as the $3,951.00 VPOC and $3,909.25 MCPOC, or lower.
Click here to load today’s key levels into the web-based TradingView charting platform. Note that all levels are derived using the 65-minute timeframe. New links are produced, daily.
Graphic: 65-minute profile chart of the Micro E-mini S&P 500 Futures.
Standard Balance-Break + Gap Scenarios: A change in the market (i.e., the transition from two-time frame trade, or balance, to one-time frame trade, or trend) is occurring.
Monitor for acceptance (i.e., more than 1-hour of trade) outside of the balance area.
Leaving value behind on a gap-fill or failing to fill a gap (i.e., remaining outside of the prior session’s range) is a go-with indicator.
Rejection (i.e., return inside of balance) portends a move to the opposite end of the balance.
Definitions
Volume Areas: A structurally sound market will build on areas of high volume (HVNodes). Should the market trend for long periods of time, it will lack sound structure, identified as low volume areas (LVNodes). LVNodes denote directional conviction and ought to offer support on any test.
If participants were to auction and find acceptance into areas of prior low volume (LVNodes), then future discovery ought to be volatile and quick as participants look to HVNodes for favorable entry or exit.
Point Of Control: POCs are valuable as they denote areas where two-sided trade was most prevalent in a prior day session. Participants will respond to future tests of value as they offer favorable entry and exit.
Micro Composite Point Of Control: POCs are valuable as they denote areas where two-sided trade was most prevalent over numerous day sessions. Participants will respond to future tests of value as they offer favorable entry and exit.
Volume-Weighted Average Prices (VWAPs): A metric highly regarded by chief investment officers, among other participants, for quality of trade. Additionally, liquidity algorithms are benchmarked and programmed to buy and sell around VWAPs.
About
After years of self-education, strategy development, mentorship, and trial-and-error, Renato Leonard Capelj began trading full-time and founded Physik Invest to detail his methods, research, and performance in the markets.
Capelj also develops insights around impactful options market dynamics at SpotGamma and is a Benzinga reporter.
In no way should the materials herein be construed as advice. Derivatives carry a substantial risk of loss. All content is for informational purposes only.
The daily brief is a free glimpse into the prevailing fundamental and technical drivers of U.S. equity market products. Join the 300+ that read this report daily, below!
Overnight, equity index futures auctioned lower after a failed attempt to solicit strong buying on a break of Friday’s regular trade high.
Coincidentally, after a test of an anchored volume-weighted average price level, some measures from China had traders concerned about global growth, and that fed into a risk-off sentiment and probe further into Friday’s range.
Moreover, ahead is data on Empire State Manufacturing (8:30 AM ET).
Today, we add light context to our narratives with an aim to elaborate further in letters later this week. Take care!
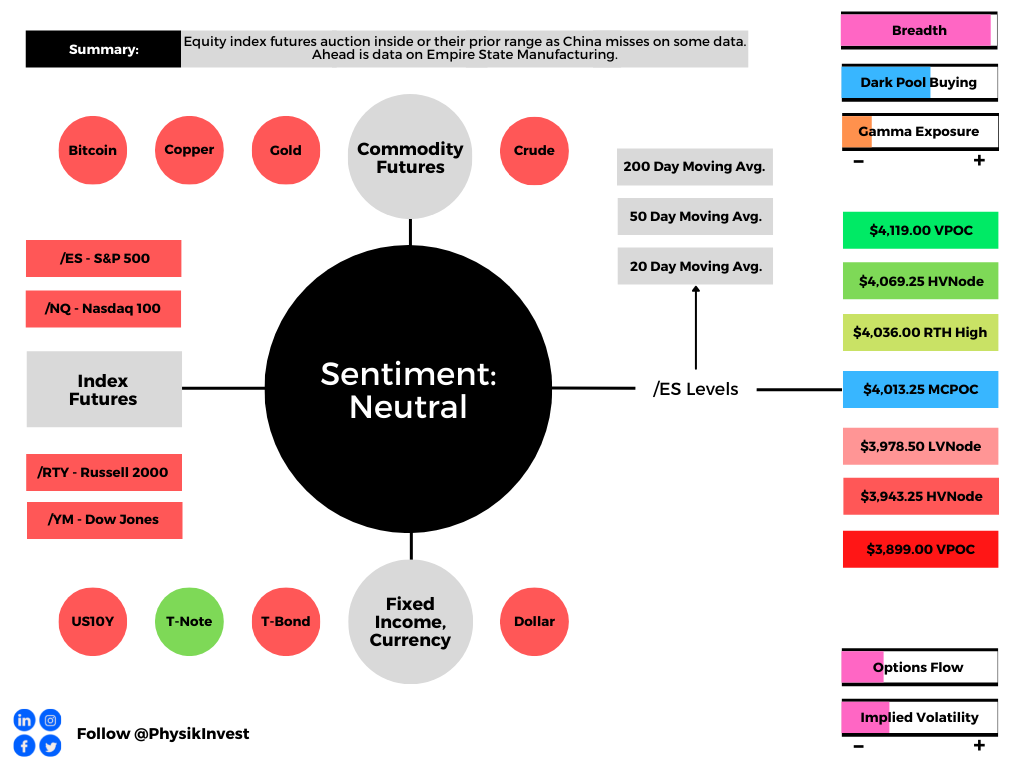
Graphic updated 6:45 AM ET. Sentiment Neutral if expected /ES open is inside of the prior day’s range. /ES levels are derived from the profile graphic at the bottom of the following section. Levels may have changed since initially quoted; click here for the latest levels. SqueezeMetrics Dark Pool Index (DIX) and Gamma (GEX) calculations are based on where the prior day’s reading falls with respect to the MAX and MIN of all occurrences available. A higher DIX is bullish. At the same time, the lower the GEX, the more (expected) volatility. Learn the implications of volatility, direction, and moneyness. SHIFT data used for S&P 500 (INDEX: SPX) options activity. Note that options flow is sorted by the call premium spent; if more positive, then more was spent on call options. Breadth reflects a reading of the prior day’s NYSE Advance/Decline indicator. VIX reflects a current reading of the CBOE Volatility Index (INDEX: VIX) from 0-100.
What To Expect
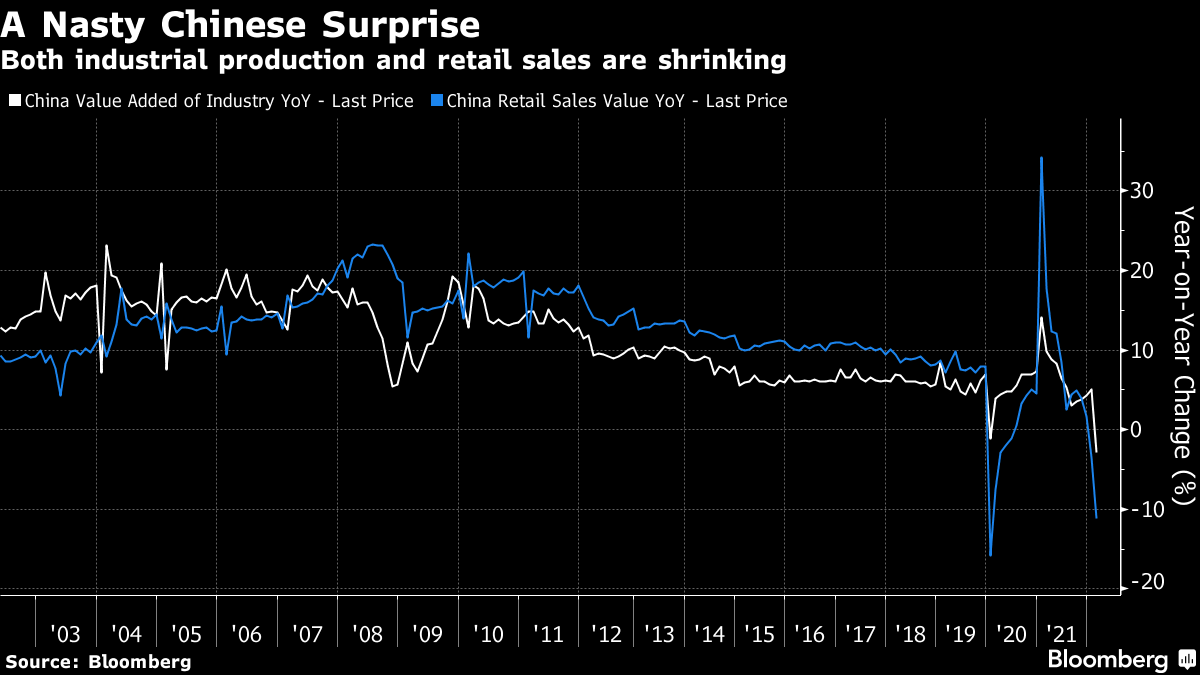
Fundamental: Data from China shows contraction in light of COVID-19 troubles.
Bloomberg’s John Authers explains that a contracting China “would be a deflationary force for the rest of the world.”
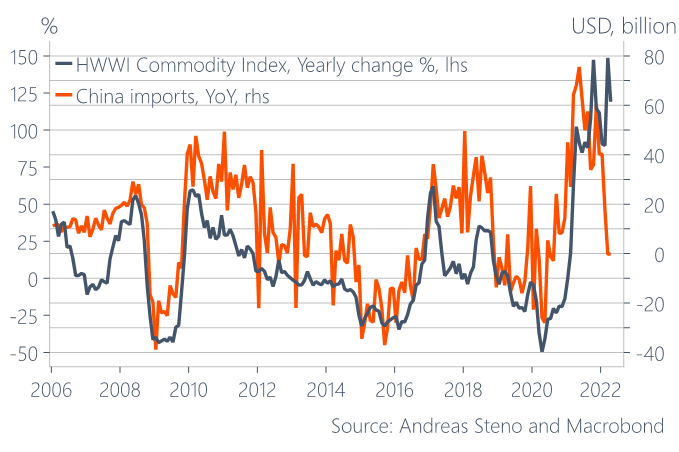
Graphic: Via Stenos Signals. “China imports vs. Commodities – the most important macro chart in the world right now.”
Andreas Steno Larsen, of the Stenos Signals letter, recently talked about this “lack of economic activity in China,” as well as “slowing demand in the West,” both of which are to “lead inflation expectations lower.”
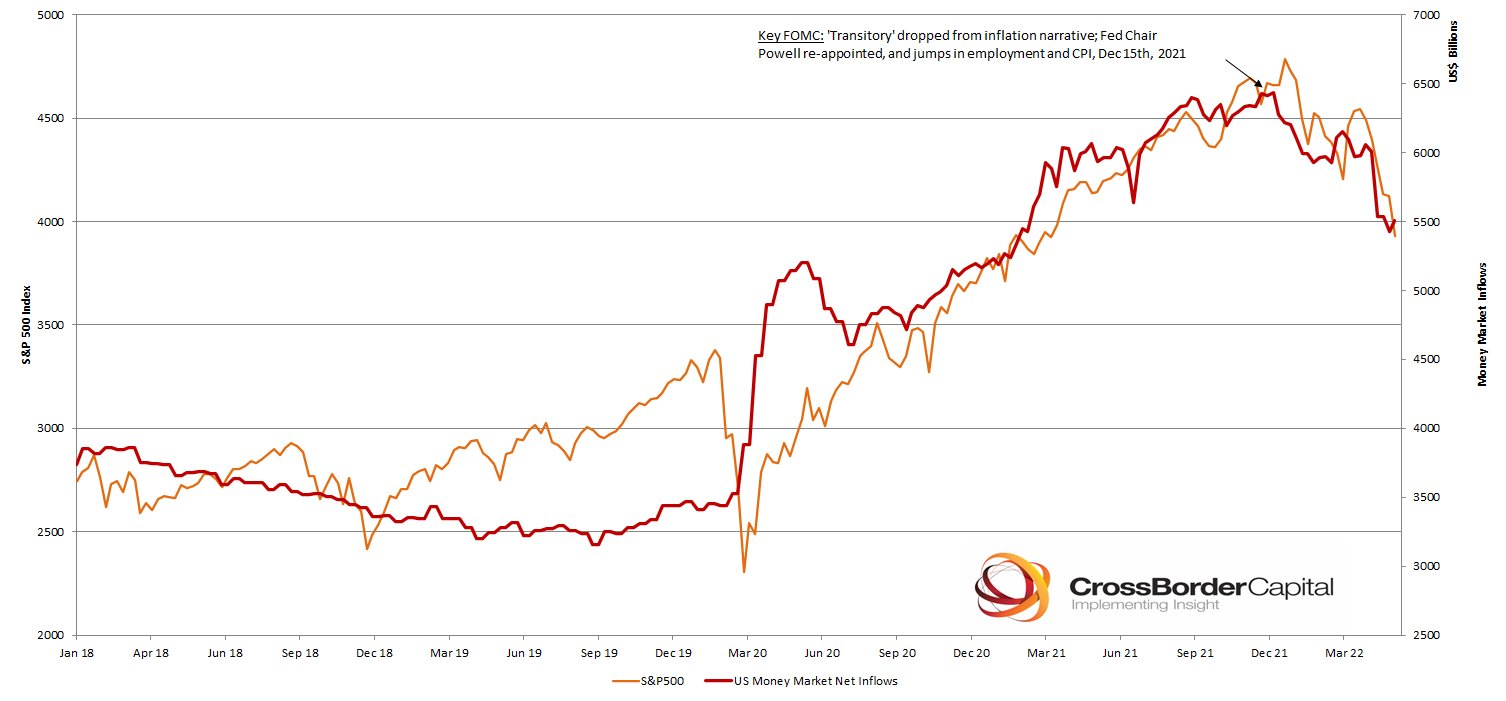
Graphic: Via CrossBorder Capital. “Latest weekly Fed liquidity injections and the S&P 500. Bigger the bull, the harder they fall? Fed trying to crash [the] economy to kill inflation [and] Wall Street is the victim.”
Notwithstanding, the Federal Reserve (Fed) remains on track “to deliver substantial QT and rate hiking,” all the while investors “hold a relatively risk-friendly position in equities and credits.”
Graphic: Via Societe Generale SA (OTC: SCGLY). Taken from The Market Ear.
Steno Larsen explains: “That disconnect [between sentiment and exposure to risk] will have to wane before I truly dare to re-add risk asset exposure to my list of recommendations.”
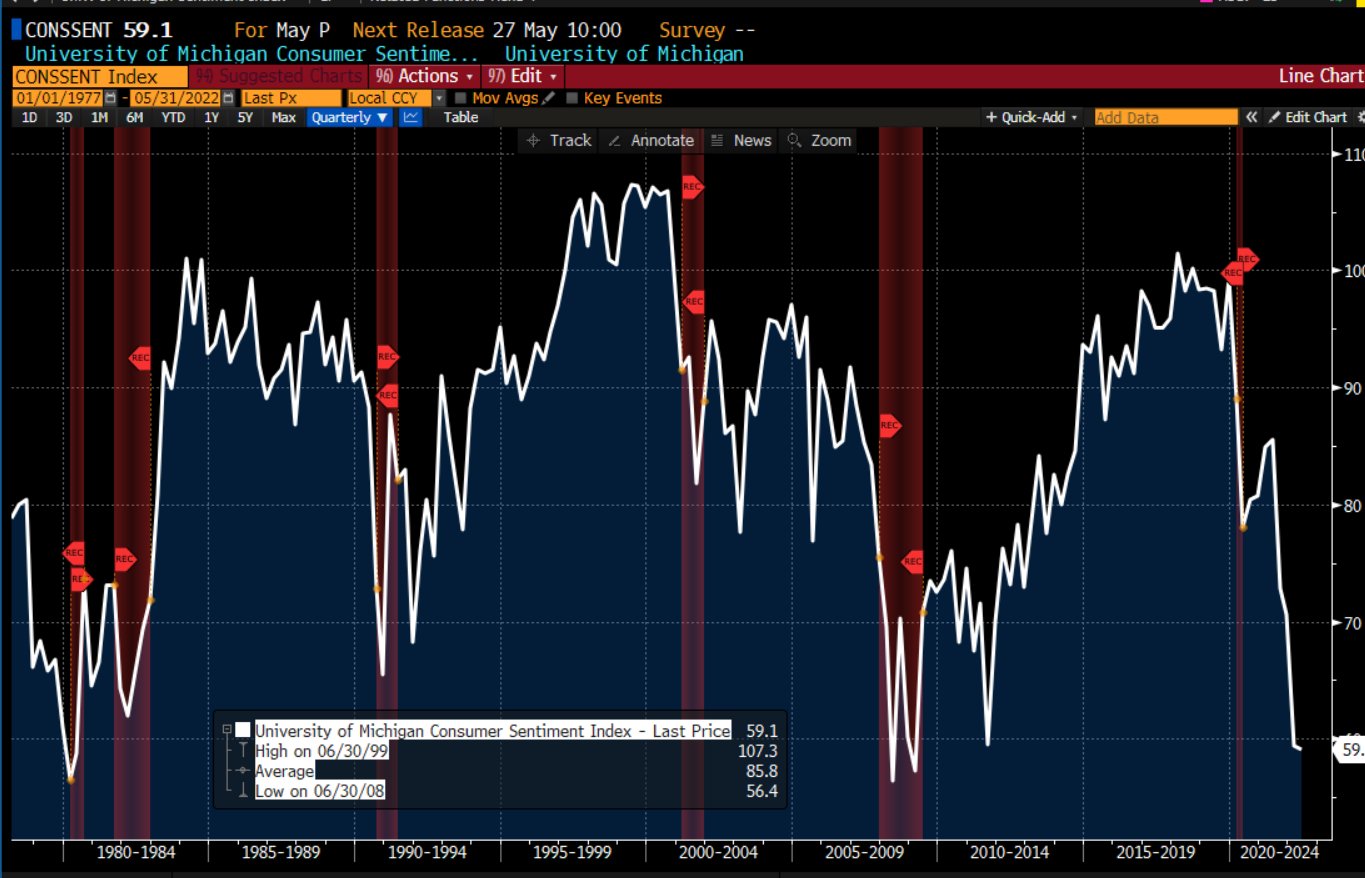
Graphic: Via @TheBondFreak. University of Michigan Sentiment.
Pursuant to that remark, Authers notes that the latest Chinese data emboldens the risks of a recession which Credit Suisse Group AG’s (NYSE: CS) Zoltan Pozsar explains is not enough.
“[T]he risk of recession, whether it is real or merely implied by an inversion of the yield curve, won’t deter the Fed from hiking rates higher faster or from injecting more volatility to build up negative wealth effects, and signs of a recession might not mean immediate rate cuts to ramp demand back up.”
“Rallies could beget more forceful pushback from the Fed – the new game.”
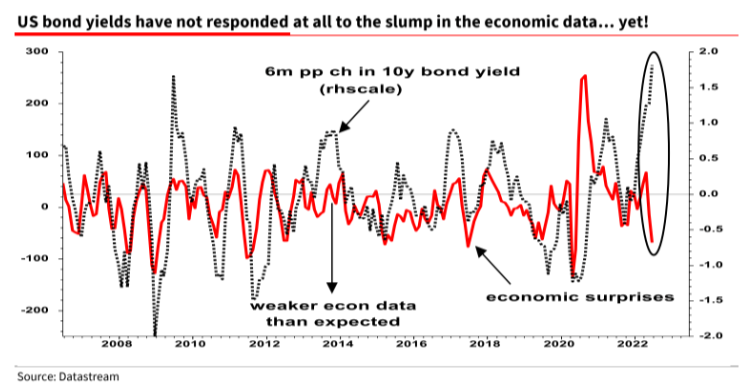
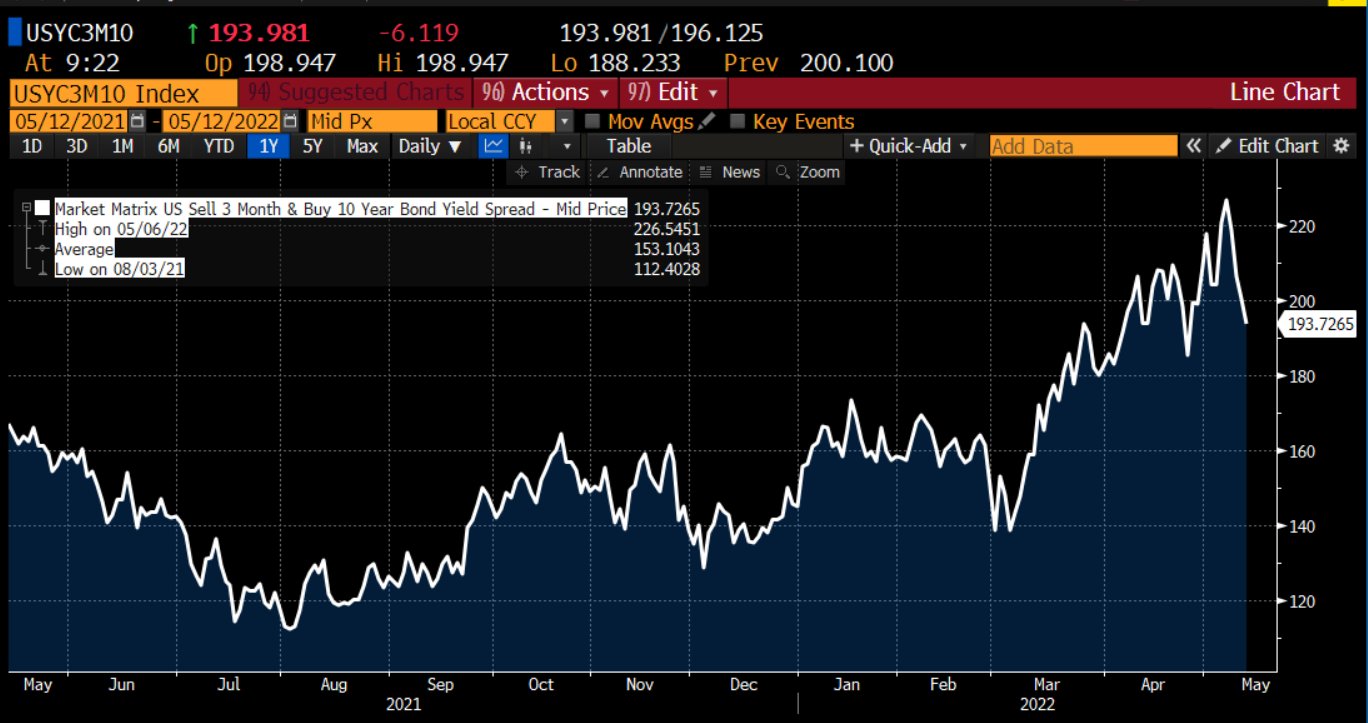
Graphic: Via @TheBondFreak. “2/10s spread has delivered its message. The long end is beginning to trend lower. NOW…it’s time to start watching the 3m/10yr spread, which will likely invert as the Fed continues with its rate hikes to kill demand, cause a recession, but “us” from inflation.”
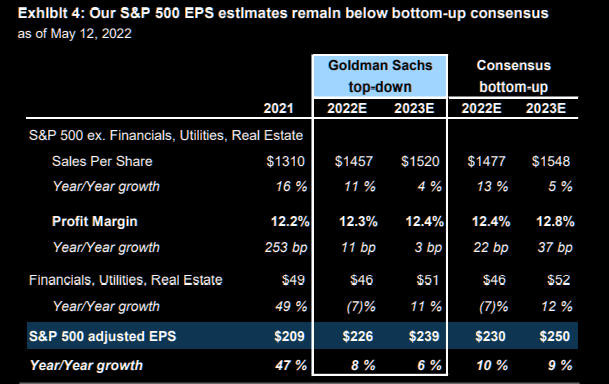
Per Goldman Sachs Group Inc (NYSE: GS), baseline forecasts assume “no recession” and imply the S&P 500’s P/E ends unchanged at 17x.
“A recession would see the index fall by 11% to $3,600.00 as the P/E drops to 15x.”
Graphic: Via Goldman Sachs Group Inc. Taken from The Market Ear. A recession brings S&P 500 to $3,600.00.
Positioning: Early on Friday morning, we approached trade too optimistically but, to our credit, we focused on participating with as little risk as possible, via the use of complex strategies, as validated by quoted research.
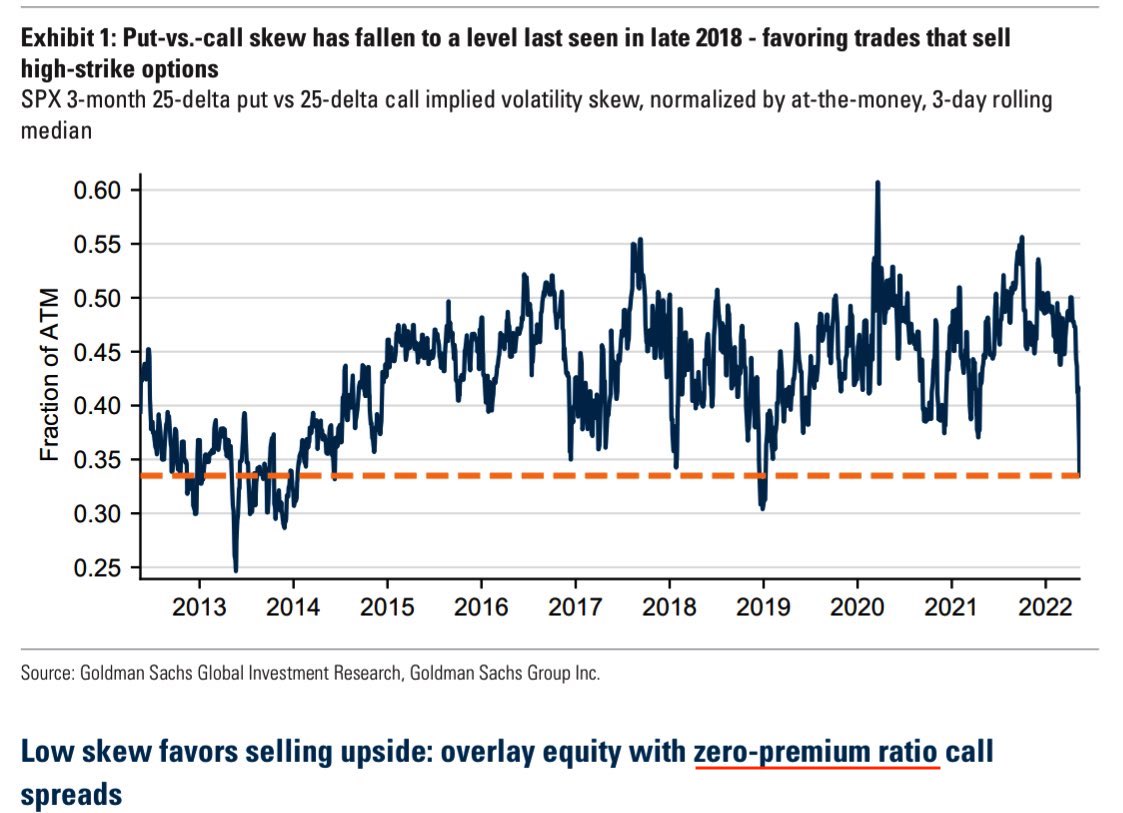
Graphic: Via Goldman Sachs Group Inc. The VIX’s “high starting point leaves vol high overall, and we like strategies with a short volatility bias, including put selling and 1×2 call spread overlays.”
Heading into Monday’s regular trade, little has changed and indexes are holding well, relative to some constituents.
This is as participants are hedged and volatility markets remain well-supplied, due in part to suppressive volatility selling, as well as passive flows supporting the largest index constituents.
Kai Volatility’s Cem Karsan hypothesizes: “If a meaningful [volatility] event has happened within the last year, participants are more likely to be prepared for the move. So the ‘2nd event’ dramatically underperforms [implied volatility] skew expectations.”
“Take Jan/Feb 2016, Oct-Dec 2018, &…Sep 2020? All these ‘2nd Events’ ended up being as meaningful as their 1st events, if not more, for markets, but were much more orderly [and] accompanied by poor [volatility] performance.”
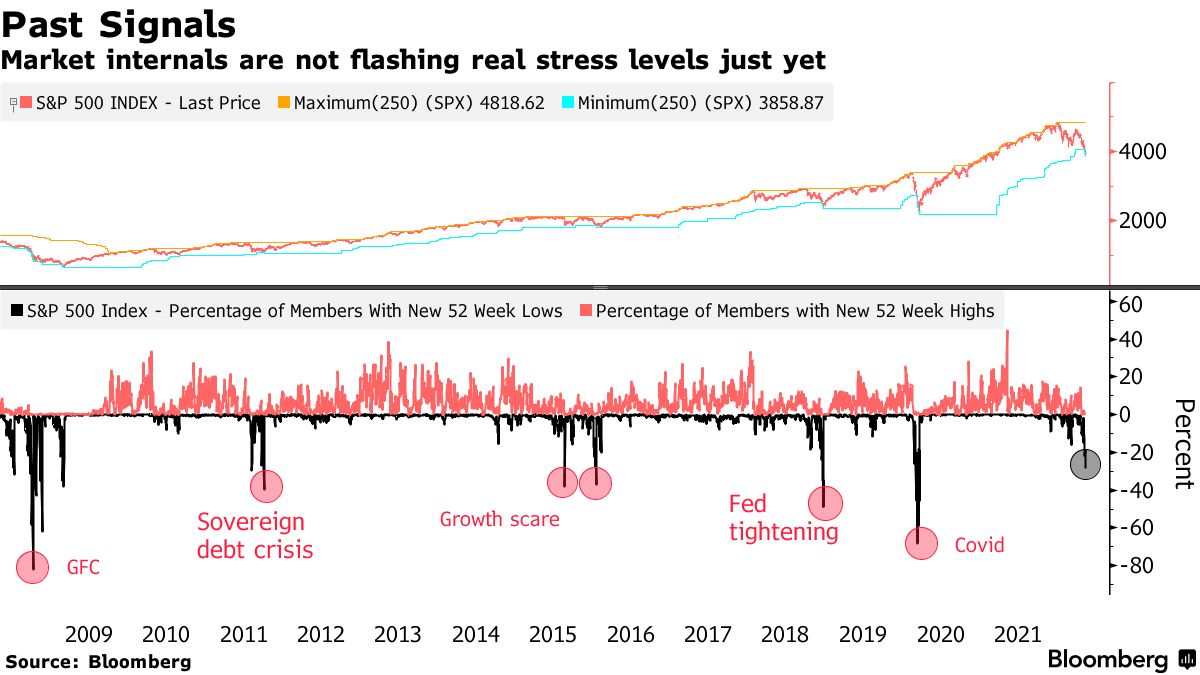
Graphic: Via Bloomberg. “For all the recent declines — the S&P 500 is down more than 13% from its high on March 29 — stress indicators also aren’t at levels seen during comparable slumps. Fewer than 30% of the benchmark’s members have hit a one-year low, compared with nearly 50% during the growth scare in 2018 and 82% during the global financial crisis in 2008.”
Given the aforementioned supply and demand dynamic, we continue to observe “divergence in the volatility (movement of underlying equity market up and down) realized, versus that which is implied by options activity,” SpotGamma says.
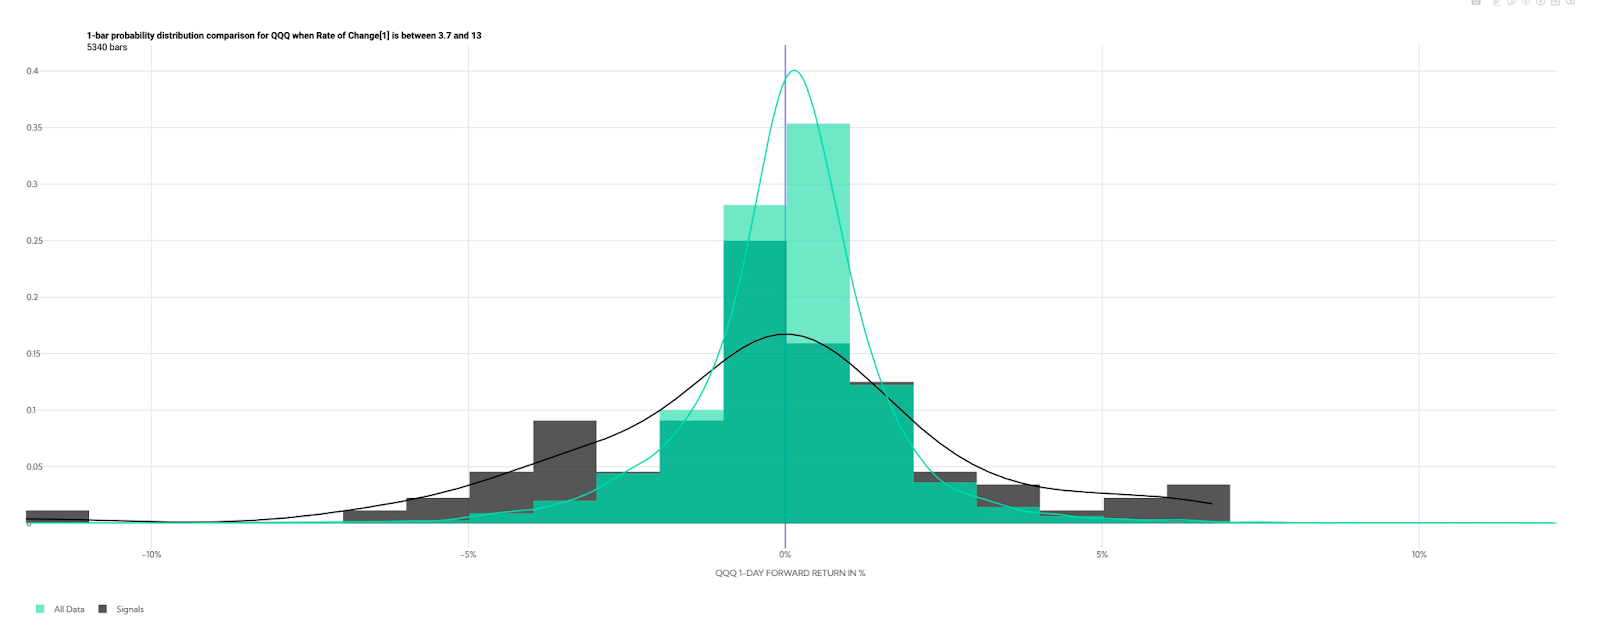
Graphic: Via @HalfersPower. “1 day return distribution when QQQ ROC[1] > 3.7%. Historically you can expect the weakest relative mean forward returns, and second-highest mean realized volatility amongst deciles.”
For “divergences in volatility realized and implied to resolve, it would likely take forced selling. Liquidity providers’ response to demand for protection would, then, likely exacerbate the move and aid in the repricing of volatility to levels where there would be more stored energy to catalyze a rally.”
All else equal, SpotGamma adds, there is no catalyst to rally until the May 20, 2022 options expiration (OPEX). Till then, rallies are subject to failure.
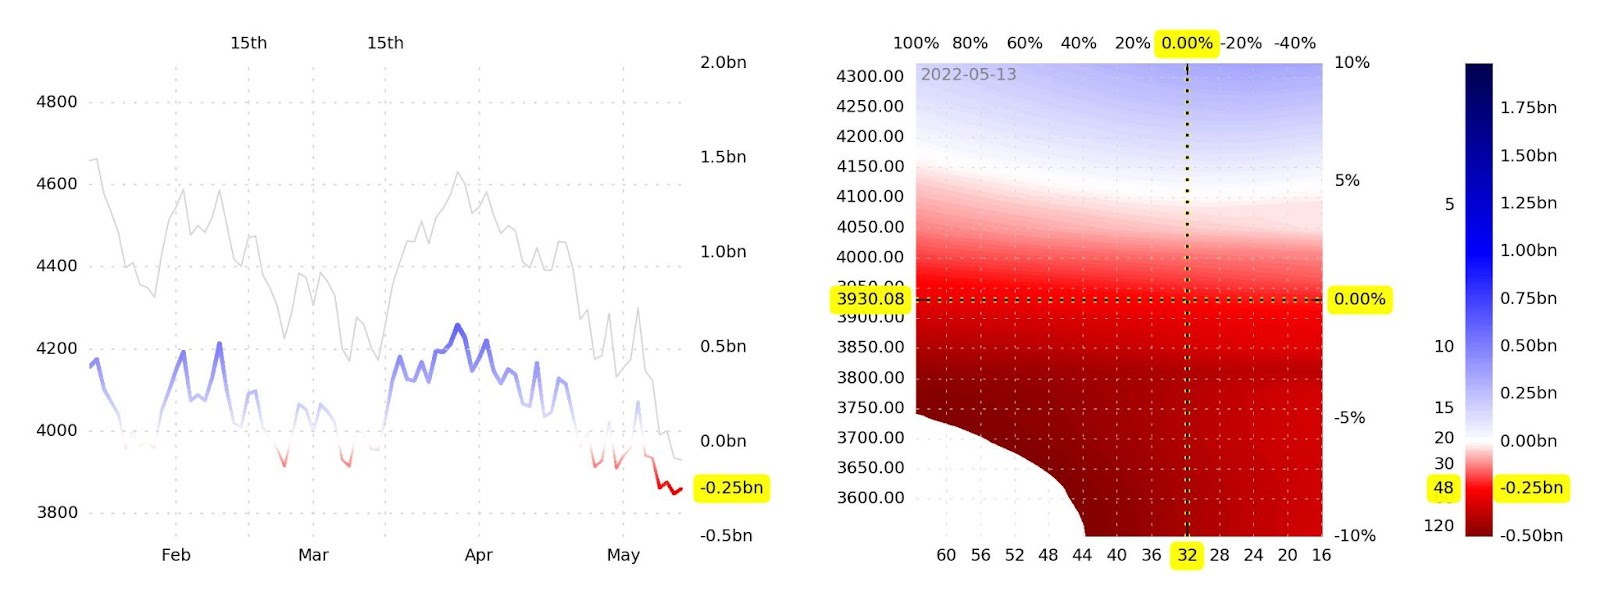
Graphic: Via SqueezeMetrics. Updated May 13, 2022. “VIX compressing to 30 on a modest pre-market rally with dealer gamma exposure more negative than it’s been in years is not how you get sustained rallies—it’s how you get energy for bigger downside moves.”
Technical: As of 6:30 AM ET, Monday’s regular session (9:30 AM – 4:00 PM ET), in the S&P 500, will likely open in the middle part of a negatively skewed overnight inventory, inside of prior-range and -value, suggesting a limited potential for immediate directional opportunity.
In the best case, the S&P 500 trades higher; activity above the $4,013.25 micro composite point of control (MCPOC) puts in play the $4,036.00 regular trade high (RTH High). Initiative trade beyond the $4,069.25 high volume area (HVNode) could reach as high as the HVNode and $4,119.00 untested point of control (VPOC), or higher.
In the worst case, the S&P 500 trades lower; activity below the $4,013.25 MCPOC puts in play the $4,3978.50 low volume area (LVNode). Initiative trade beyond the LVNode could reach as low as the $3,943.25 HVNode and $3,899.00 VPOC, or lower.
Click here to load today’s key levels into the web-based TradingView charting platform. Note that all levels are derived using the 65-minute timeframe. New links are produced, daily.
Graphic: 65-minute profile chart of the Micro E-mini S&P 500 Futures.
Definitions
Volume Areas: A structurally sound market will build on areas of high volume (HVNodes). Should the market trend for long periods of time, it will lack sound structure, identified as low volume areas (LVNodes). LVNodes denote directional conviction and ought to offer support on any test.
If participants were to auction and find acceptance into areas of prior low volume (LVNodes), then future discovery ought to be volatile and quick as participants look to HVNodes for favorable entry or exit.
POCs: POCs are valuable as they denote areas where two-sided trade was most prevalent in a prior day session. Participants will respond to future tests of value as they offer favorable entry and exit.
MCPOCs: POCs are valuable as they denote areas where two-sided trade was most prevalent over numerous day sessions. Participants will respond to future tests of value as they offer favorable entry and exit.
Volume-Weighted Average Prices (VWAPs): A metric highly regarded by chief investment officers, among other participants, for quality of trade. Additionally, liquidity algorithms are benchmarked and programmed to buy and sell around VWAPs.
About
After years of self-education, strategy development, mentorship, and trial-and-error, Renato Leonard Capelj began trading full-time and founded Physik Invest to detail his methods, research, and performance in the markets.
Capelj also develops insights around impactful options market dynamics at SpotGamma and is a Benzinga reporter.
In no way should the materials herein be construed as advice. Derivatives carry a substantial risk of loss. All content is for informational purposes only.
What Happened: Coming into the large May monthly options expiration (OPEX) and extended holiday weekend, U.S. stock index futures pinned, trading sideways-to-higher.
Happy 420 (4200).
Per our metrics pre-market today, significant gravity helping things stay 1) muted and 2) around the open of 4200.
Options: If an option buyer was short (long) stock, he or she would buy a call (put) to hedge upside (downside) exposure. Option buyers can also use options as an efficient way to gain directional exposure.

Options Expiration (OPEX): Option expiries mark an end to pinning (i.e, the theory that market makers and institutions short options move stocks to the point where the greatest dollar value of contracts will expire worthless) and the reduction dealer gamma exposure.

Gamma is the sensitivity of an option to changes in the underlying price. Dealers that take the other side of options trades hedge their exposure to risk by buying and selling the underlying. When dealers are short-gamma, they hedge by buying into strength and selling into weakness. When dealers are long-gamma, they hedge by selling into strength and buying into weakness. The former exacerbates volatility. The latter calms volatility.
Furthermore, looking back, the movement in price was both volatile and mechanical.
After a short covering-like rally toward $4,200.00, the S&P 500 was responsively bought and sold at key visual references, suggesting a dominance by short-term participants.
Responsive Buying (Selling): Buying (selling) in response to prices below (above) areas of recent price acceptance.
The technically-driven trade denotes a lack of interest by institutional participants, at record highs; supply chain uncertainties and rising inflation, fiscal and monetary tightening, COVID-19 concerns, political risks, and the like, are some of the emerging concerns larger participants are looking to price in.
Of all the above risks, inflation remains the hottest topic.
Generally speaking, inflation and rates move inversely to each other. Low rates stimulate demand for loans (i.e., borrowing money is more attractive). With the rapid recovery, though, market participants fear that rates will rise to protect the economy from overheating.
Higher rates have the potential to reduce the present value of future earnings, making stocks, especially those that are high growth, less attractive.
To note, however, rates remain range-bound; rates on the 10 Year T-Note sit below their March high and are likely to continue higher, which the market may absorb.
How may the market absorb a rise in rates? During the so-called Taper Tantrum, in the early 2010s, rates settled in a wide range, and equities rallied big. Adding, some strategists, like Kit Juckes of Societe Generale SA (OTC: SCGLY) suggest it may be best to assume a tantrum has already happened.
“U.S. 10-year yields rose from a low of 1.4% in 2012 to 3% during their tantrum. In this cycle, the rise has been from 0.5% to a high just below 1.8%. That’s comparable in relative terms. The eventual peak in U.S. yields in 2018 was 3.25%. Can’t we accept that the taper tantrum has already happened? The important difference is that in the tantrum cycle, core CPI never got above 2 ½%. A bet on further bond weakness is a bet on inflation proving to be stickier than the Fed can cope with.”
Adding, research by JPMorgan Chase & Co (NYSE: JPM), as well as Goldman Sachs Group Inc (NYSE: GS), suggests equities may be getting cheap with reflationary themes being the go-to play. This sentiment would help explain the increased interest in S&P 500 and Nasdaq 100 call options.
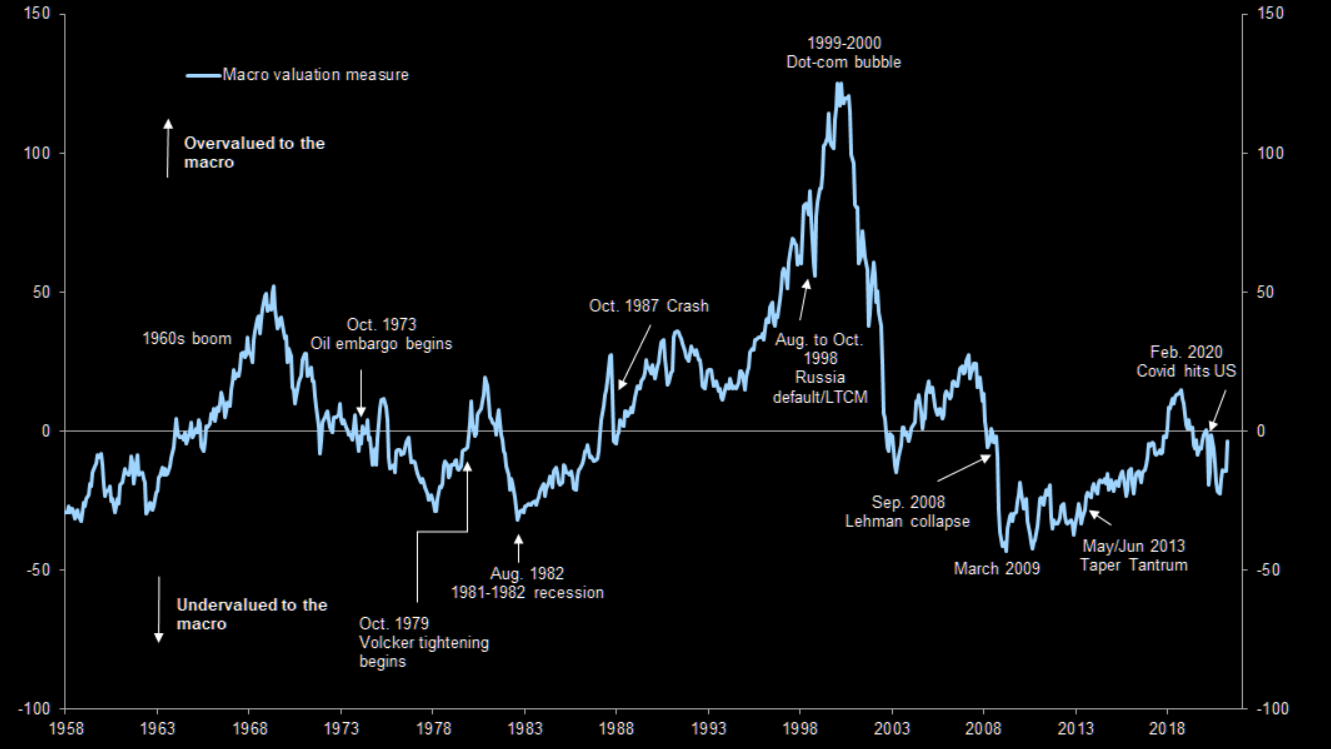
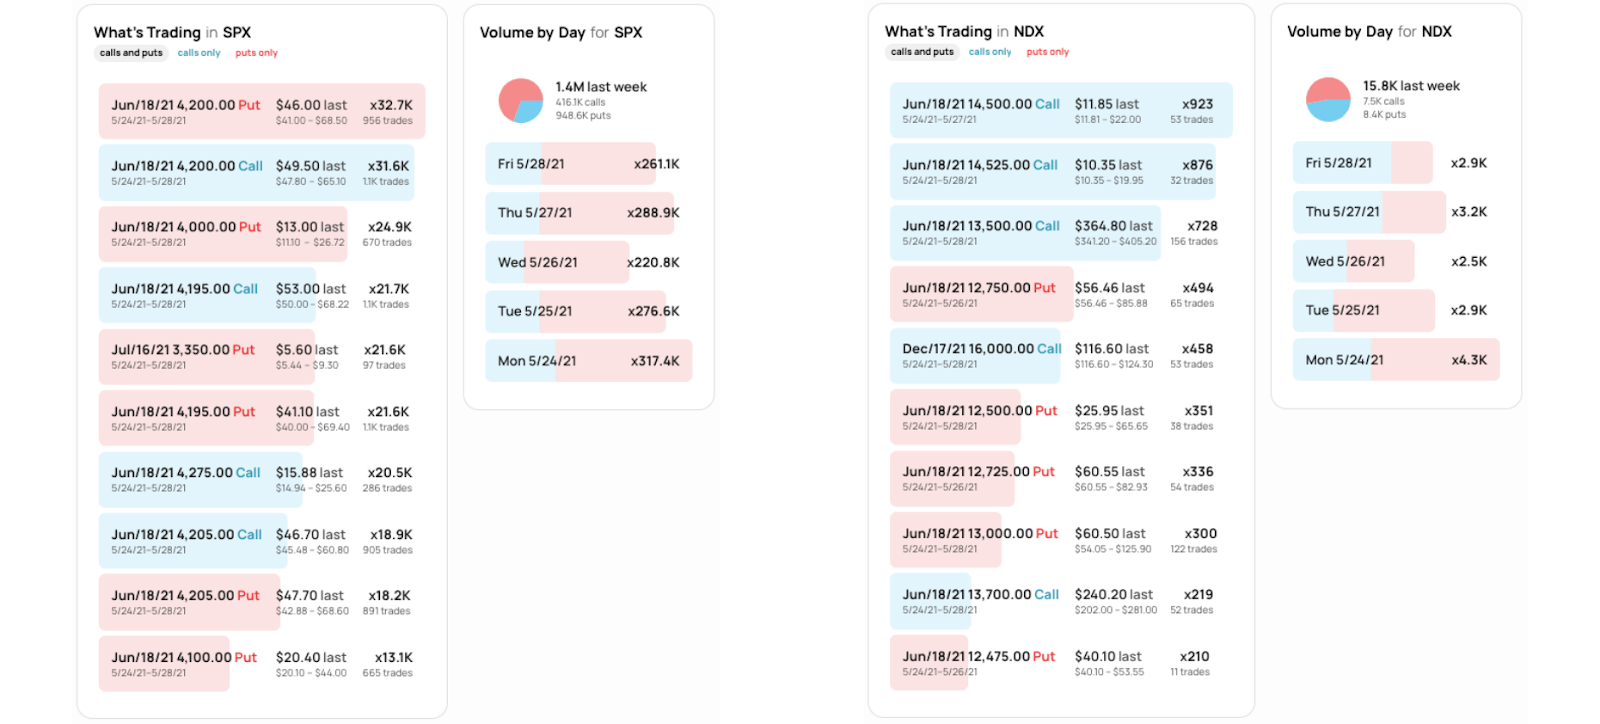
Graphic: Equity valuations at their cheapest, relative to the macro in March 2009 and in the depth of the 1982 recession, according to Goldman Sachs Group Inc (NYSE: GS), via The Market Ear.Graphic: SHIFT search suggests participants were becoming more interested in call strikes at and above current prices in the cash-settled S&P 500 Index (INDEX: SPX) and Nasdaq 100 Index (INDEX: NDX), last week.Graphic: Physik Invest maps out the purchase of call and put options in the SPDR S&P 500 ETF Trust (NYSE: SPY), for the week prior. Activity in the options market was primarily concentrated in short-dated tenors, in strikes at and above $425.
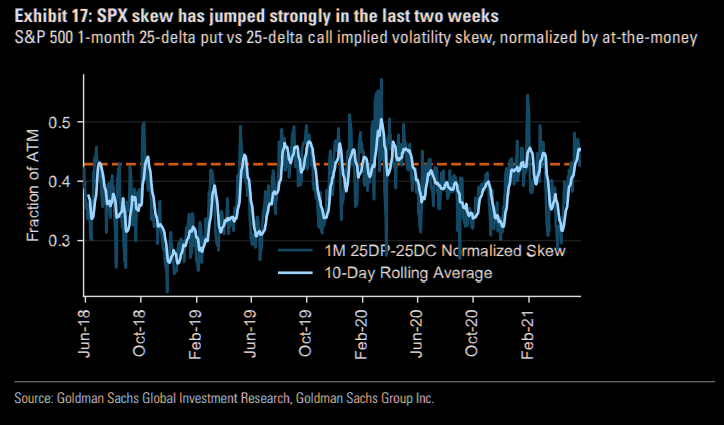
Outlier risks remain, though; aside from the seasonally weak period, S&P 500 skew – a measure of perceived tail risk and the chances of a black swan event – rose dramatically over the past few weeks. At the same time, sentiment cooled considerably, while individual stock volatility increased the potential for a repeat of the GameStop Corporation (NYSE: GME) de-risking event.
Graphic: Goldman Sachs Group Inc (NYSE: GS) unpacks outlier risks based on the implied volatility of S&P 500 out-of-the-money options, via The Market Ear.
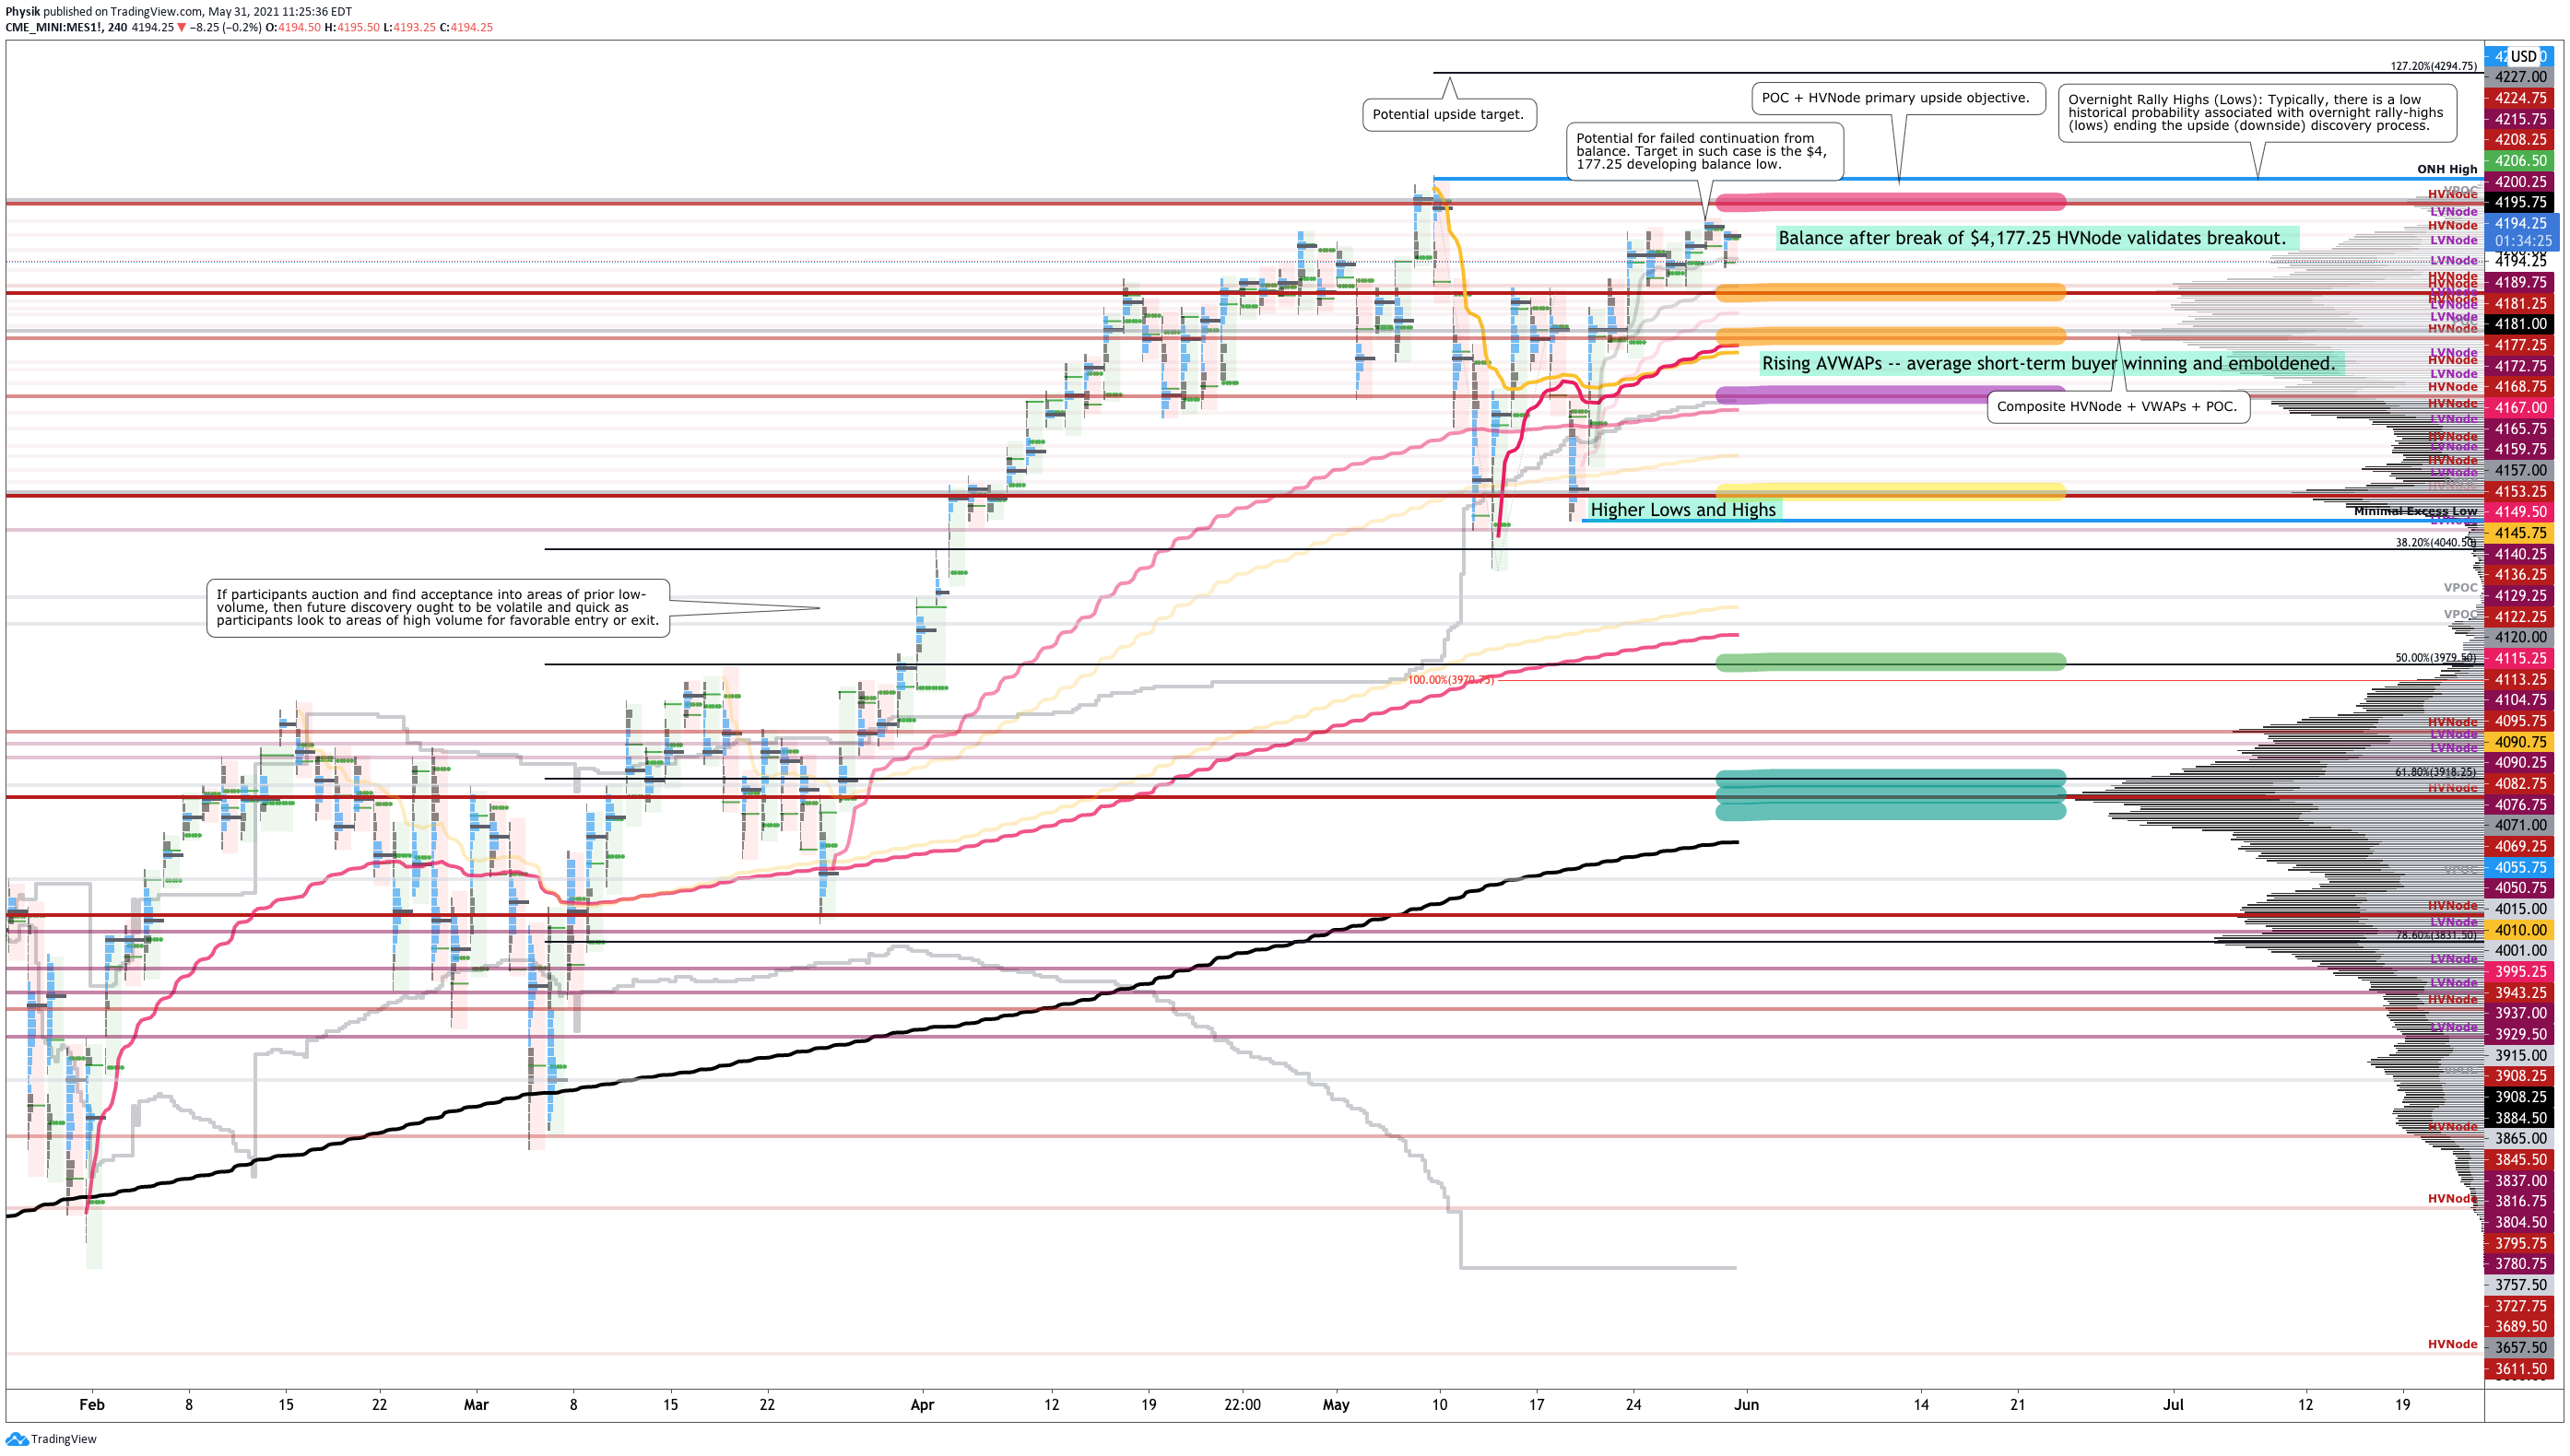
What To Expect: In the coming sessions, participants will want to focus their attention on where the S&P 500 trades in relation to the $4,197.25 high volume area (HVNode).
Volume Areas: A structurally sound market will build on past areas of high volume. Should the market trend for long periods of time, it will lack sound structure (identified as a low volume area which denotes directional conviction and ought to offer support on any test).

If participants were to auction and find acceptance into areas of prior low volume, then future discovery ought to be volatile and quick as participants look to areas of high volume for favorable entry or exit.
That said, participants can trade from the following frameworks.
In the best case, the index trades sideways or higher; activity above $4,197.25 has the potential to reach the $4,227.00 point of control (POC). Initiative trade beyond the POC could reach as high as first the $4,238.00 overnight all-time high (ONH) and then, the $4,294.75 Fibonacci-derived price extension, a typical recovery target.
POCs: POCs (like HVNodes described above) are valuable as they denote areas where two-sided trade was most prevalent. Participants will respond to future tests of value as they offer favorable entry and exit.

Overnight Rally Highs (Lows): Typically, there is a low historical probability associated with overnight rally-highs (lows) ending the upside (downside) discovery process.
In the worst case, the index trades lower; activity below the $4,177.25 HVNode puts in play the $4,153.25 HVNode, first. Thereafter, if lower, the $4,122.25 HVNode and $4,071.00 POC come into play.
On a cross through the $4,050.75 low volume area (LVNode), long-biased traders should beware of a rapid liquidation, as low as first the $4,015.00 and $4,001.00 POCs. In such a liquidation, odds favor a test of ~$3,970.00 50.00% retracement, as well as the $3,918.00 61.80% retracement and HVNode.
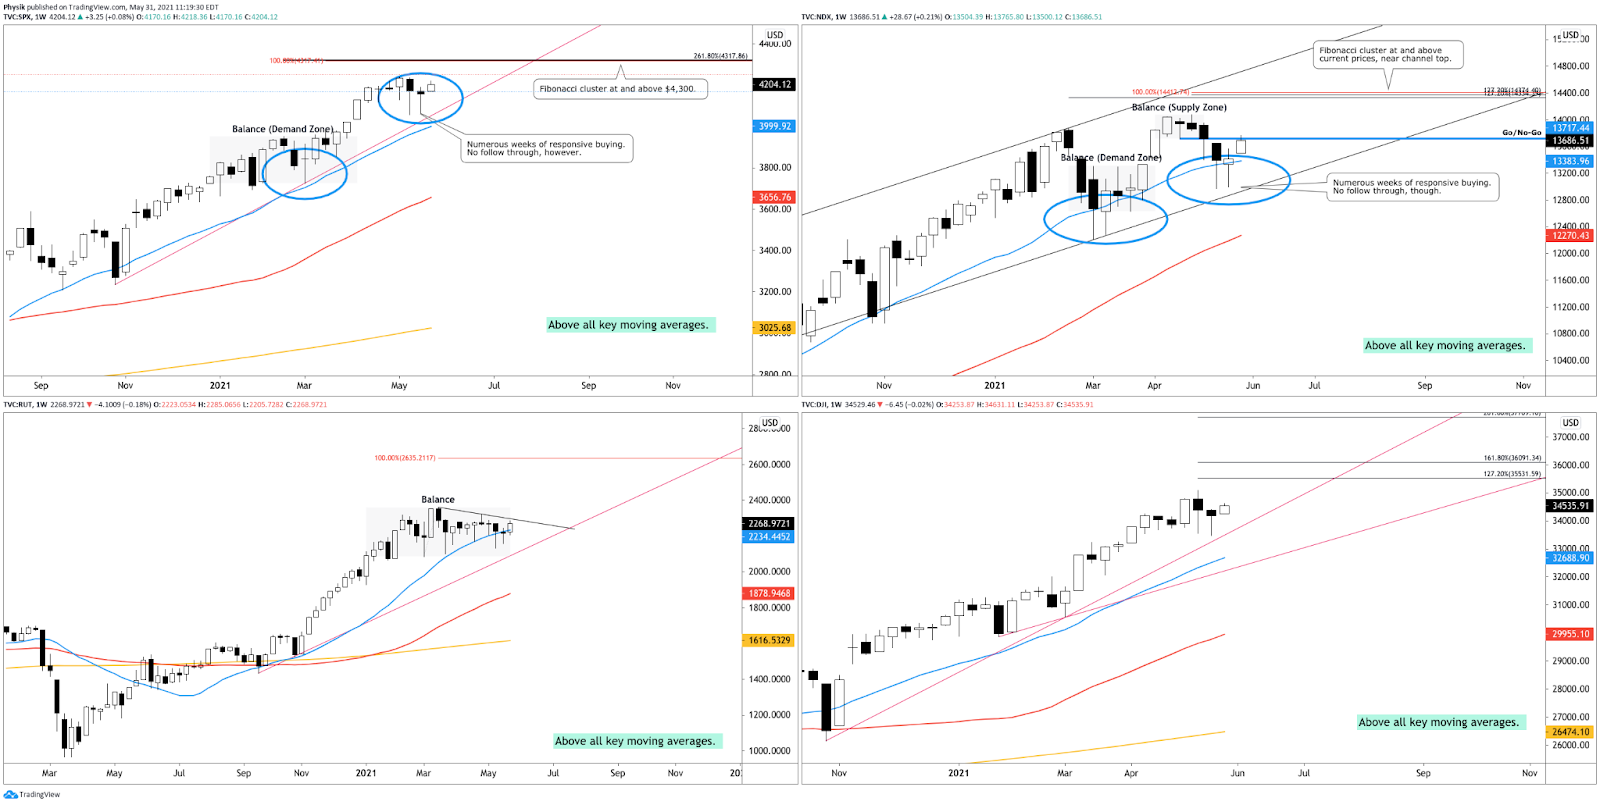
Graphic: 4-hour profile chart of the Micro E-mini S&P 500 Futures.Graphic: Weekly candlestick charts of the S&P 500 (top left), Nasdaq 100 (top right), Russell 2000 (bottom left), and Dow Jones Industrial Average (bottom right). Nasdaq is primed for upside and has the potential to pull the S&P with it.
News And Analysis
Trade | One of the world’s top ports expects delays on an outbreak. (BBG)
Markets | PBOC raises reserve ratio for foreign exchange holdings. (BBG)
Economy | Recovery solidifies in U.S., Europe, while EM faces risks. (Moody’s)
Markets | China bars banks from selling commodity-linked products. (REU)
Economy | Fed security purchases draw fire in hot U.S. housing market. (S&P)
Energy | Global oil demand is seen eclipsing India, Iran’s uncertainty. (S&P)
Economy | U.S. won’t experience stagflation over next few years. (Moody’s)
Economy | Non-government loans seeing a jump in forbearances. (MND)
Economy | U.S. speculative-grade corporate default rate to fall to 4%. (S&P)
Markets | Inflation, higher oil, stronger yuan point in same direction. (BBG)
Economy | U.S. retailers face headwinds from slowing sales, inflation. (S&P)
Markets | Everyone with bonds to liquidate had ample time to do so. (BBG)
What People Are Saying
Take the risk. If you win, you will be happy. If you lose, you will be wise. Not sure who said this, but if you find yourself hesitating, I've found the best thing to do is take the plunge and see what happens.
The lack of vol sellers leads to faster spikeability in the front of the term structure….yet it also leads to faster deflation in vol as the trade is completely one sided with no follow through.
$SPY Algo only Liquidity showing early buying, then flattened. DP's very heavy sellers in comparison if you compare both Algo/DP Accumulators to the FULL FEED (all). Low program activity, only 12 so far, 3 buys and 9 sells…sells have been dominating on all up days this week. pic.twitter.com/X0VTwwmdgm
Markets | How recent growth in leveraged finance affects investors. (BZ)
Politics | Tech growth overshadowed by regulatory risks, challenges. (S&P)
Markets | Chamath: SPACs need more oversight and regulation. (BBG)
Politics | China moves to a three-child policy to boost its birthrate. (BBG)
Markets | Shakeout stirs debate over ether’s long-term potential. (BBG)
FinTech | Which banks are positioned for low rates, digital adoption. (S&P)
About
Renato founded Physik Invest after going through years of self-education, strategy development, and trial-and-error. His work reporting in the finance and technology space, interviewing leaders such as John Chambers, founder, and CEO, JC2 Ventures, Kevin O’Leary, businessman and Shark Tank host, Catherine Wood, CEO and CIO, ARK Invest, among others, afforded him the perspective and know-how very few come by.
Having worked in engineering and majored in economics, Renato is very detailed and analytical. His approach to the markets isn’t built on hope or guessing. Instead, he leverages the unique dynamics of time and volatility to efficiently act on opportunity.
Disclaimer
At this time, Physik Invest does not manage outside capital and is not licensed. In no way should the materials herein be construed as advice. Derivatives carry a substantial risk of loss. All content is for informational purposes only.