Bloomberg reports that if the US defaults on its debt, which could happen as soon as June 1 if President Biden and House Speaker McCarthy fail to reach a deal on raising the ceiling, homebuyer borrowing costs may surge to 8.40%. As a consequence, the typical home’s monthly payment would increase by 22.00% and cool property sales; the monthly payment on a $500,000.00 mortgage may rise to $3,800.00, compared to about $3,095.00 at the current rate of 6.30%.
In prior letters, we concluded that past monetary action made stocks less sensitive to interest rates, quoting JPMorgan Chase & Co (NYSE: JPM) strategists that the market would likely continue to “artificially suppress perceptions of fundamental macro risks,” barring surprises like a debt limit breach.
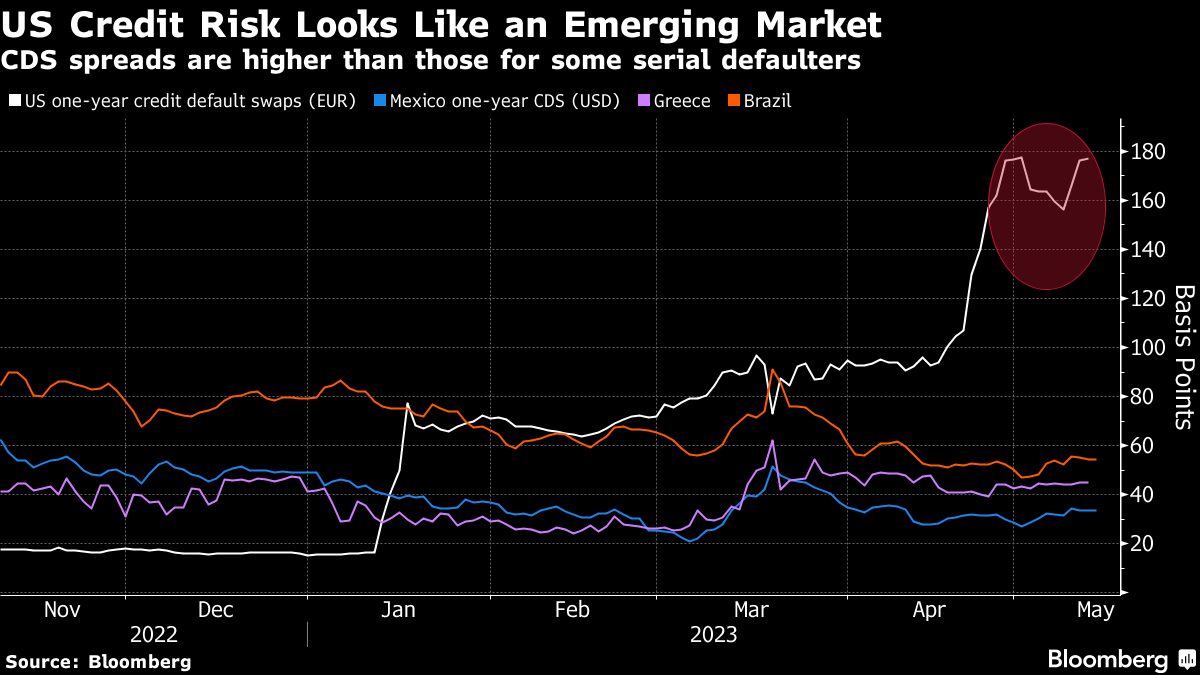
With a debt limit breach a potential reality, Moody’s Corporation (NYSE: MCO) says a breach may compound recessionary pressures; expect a drop in equities, a volatility spike, and a disruption of funding markets.
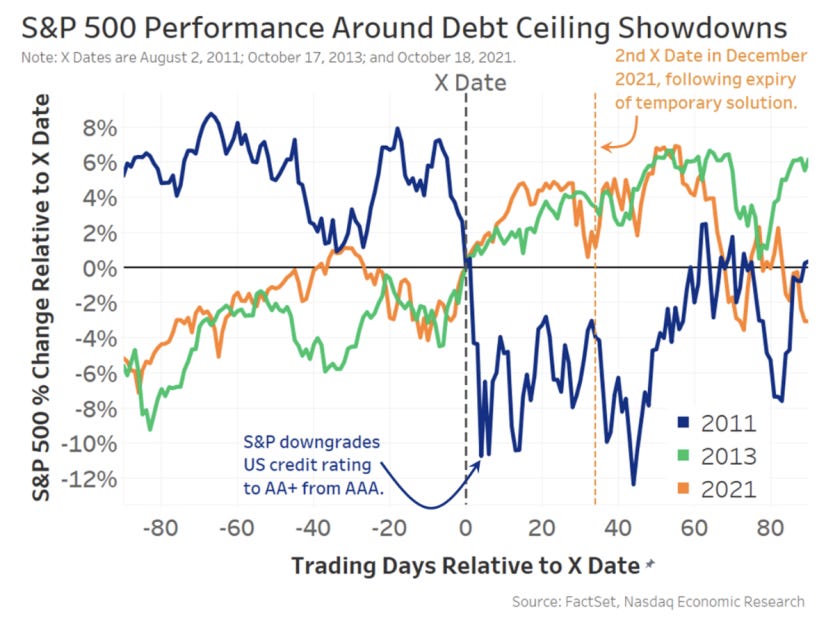
Graphic: Retrieved from Nasdaq Inc (NASDAQ: NDAQ).
“Data show that short-term bonds have the most predictable reaction – with interest rates and default insurance costs rising significantly – before quickly returning to normal after the uncertainty has passed,” Nasdaq’s Phil Mackintosh writes. “In reality, a crisis was averted in all [prior] cases, with the government able to increase or suspend the debt limit before the X Date.”
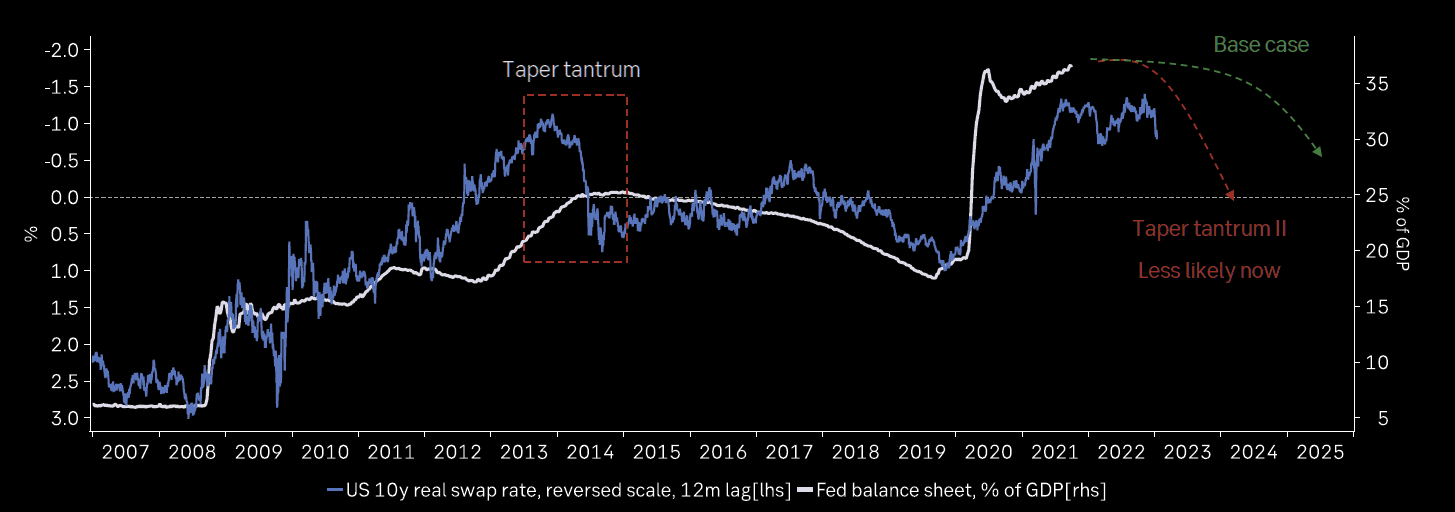
Notwithstanding the short-term uncertainty regarding the debt limit, Bank of America Corporation (NYSE: BAC) is adamant there will be a recession that manifests cracks in “credit and tech,” similar to the situation in 2008. BAC sees the bubble in technology, media, and telecommunication stocks soon deflating as they face higher-for-longer interest rates and a tempered earnings outlook.
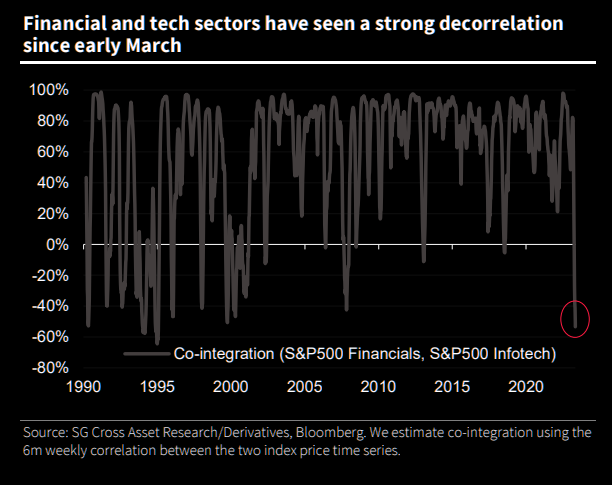
Graphic: Retrieved from Societe Generale SA (OTC: SCGLY) via The Market Ear.While investors poured $3.8 billion into technology stocks in the week through May 10, $2.1 billion was pulled from financial equities, the most significant redemption since May 2022.
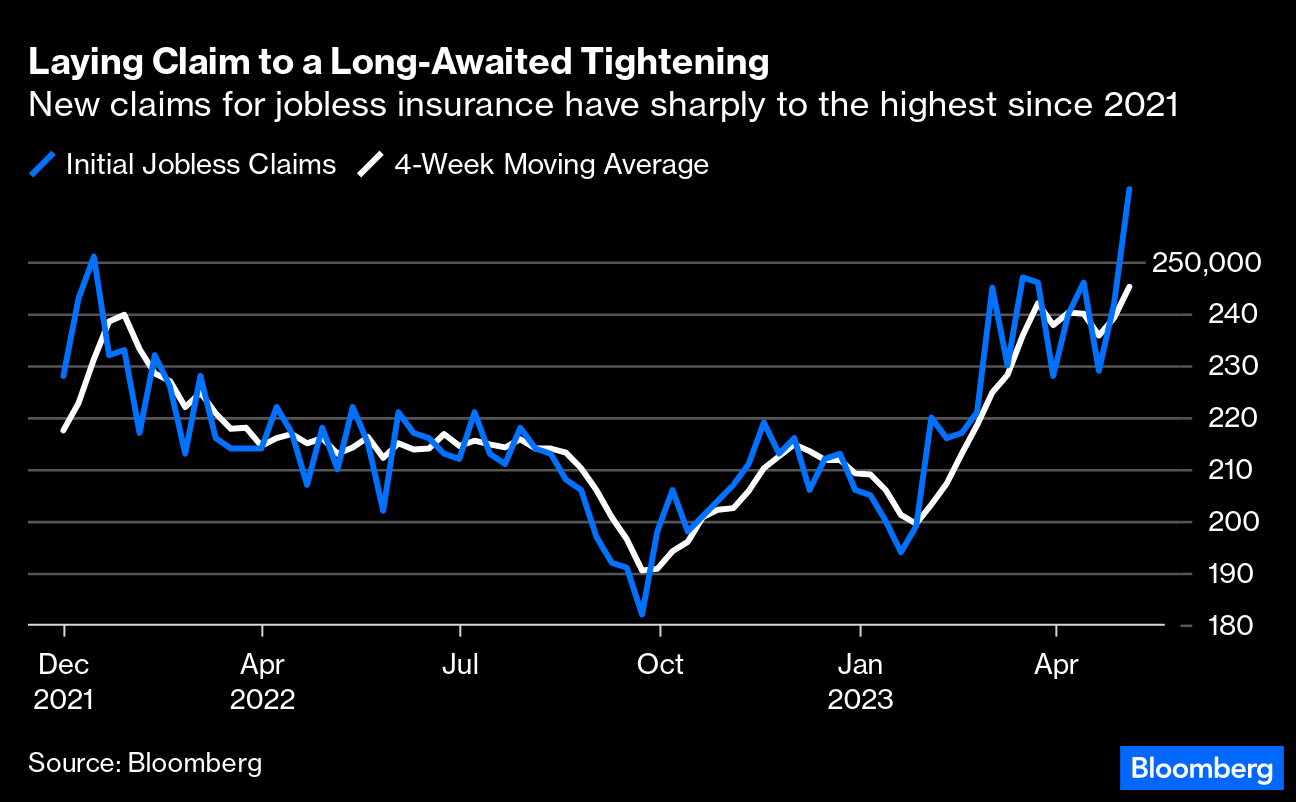
Compounding the recessionary pressures BAC sees, EPB Research adds, are banks’ funding costs, which have increased too much relative to prevailing asset yields. If the spread drops too low, bank lending tightens, and a recession occurs. Also, other data suggests tightening is finally starting to have an impact. Bloomberg reports that initial claims for unemployment insurance are on the rise. There has been a drop in overall wage growth to 5.1% last month, too, the biggest fall in the rate of increase since the series began.
Separately, breadth divergences are becoming more frequent, with the Daily Advance-Decline (A-D) Line for the NYSE showing lower highs while DJIA and S&P 500 show slightly higher highs, McClellan Financial Publications writes. The bond CEF A-D Line is also showing a bearish divergence, indicating a shift in liquidity that could weigh on other stocks, including the big-cap stocks holding up the SP500 and the Nasdaq 100.
Graphic: Retrieved from McClellan Financial Publications.
McClellan adds that the A-D Line originated from data collected by Leonard Ayres and James Hughes in the 1920s. It was made famous in 1962.
Graphic: Retrieved from McClellan Financial Publications.
That’s when Joe Granville and Richard Russell commented on it in their newsletters, noting how it had shown a big bearish divergence ahead of the 1962 bear market.
Graphic: Retrieved from McClellan Financial Publications.
To end, the economic calendar next week is focused on manufacturing and housing. The housing market is showing some downside risk for existing-home sales for April due to a weak reading on pending sales, MCO says, adding that housing permits and starts are expected to move sideways as builders remain cautious amid high-interest rates and economic uncertainty. Regional Fed surveys in New York and Philadelphia will provide the first read on factory activity for May, with little hope for a significant rebound in manufacturing. Jobless claims will be critical, as continuing the recent trend would likely signal a rapid deceleration in monthly job gains. Other critical data to be released include retail sales, industrial production, and business inventories.
Should readers wish to hedge the debt ceiling debacle, June call options on the Cboe Volatility Index appear attractive, some suggest. But, with RVOL as low as it is, owning optionality is not generally warranted. The risk is lower lows in volatility.
Welcome to the Daily Brief by Physik Invest, a soon-to-launch research, consulting, trading, and asset management solutions provider. Learn about our origin story here, and consider subscribing for daily updates on the critical contexts that could lend to future market movement.
Separately, please don’t use this free letter as advice; all content is for informational purposes, and derivatives carry a substantial risk of loss. At this time, Capelj and Physik Invest, non-professional advisors, will never solicit others for capital or collect fees and disbursements. Separately, you may view this letter’s content calendar at this link.
The Daily Brief is a free glimpse into the prevailing fundamental and technical drivers of U.S. equity market products. Join the 200+ that read this report daily, below!
Overnight, equity index futures auctioned lower alongside a surge in bond yields. Rate-sensitive sectors were weakest in pre-market trade, in comparison to the value and cyclical names.
Earnings are now in focus. Participants shall use earnings updates to gauge how companies are performing in spite of omicron, among other challenges.
Ahead is data on the Empire Manufacturing Index (8:30 AM ET) and NAHB Home Builders Index (10:00 AM ET).
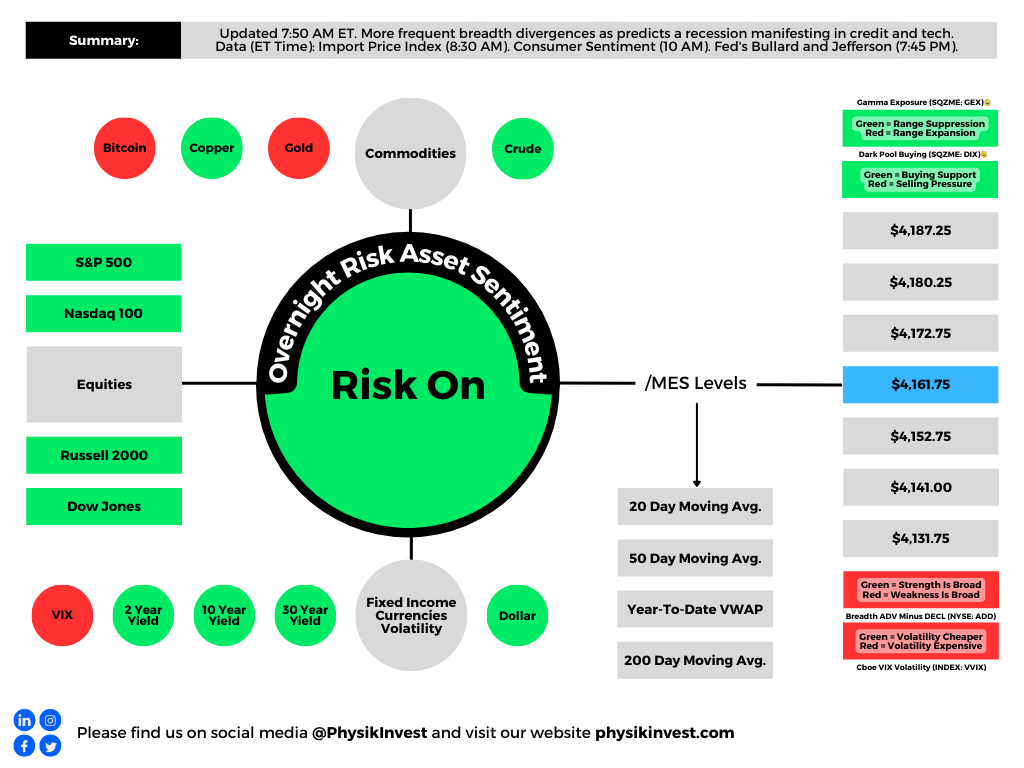
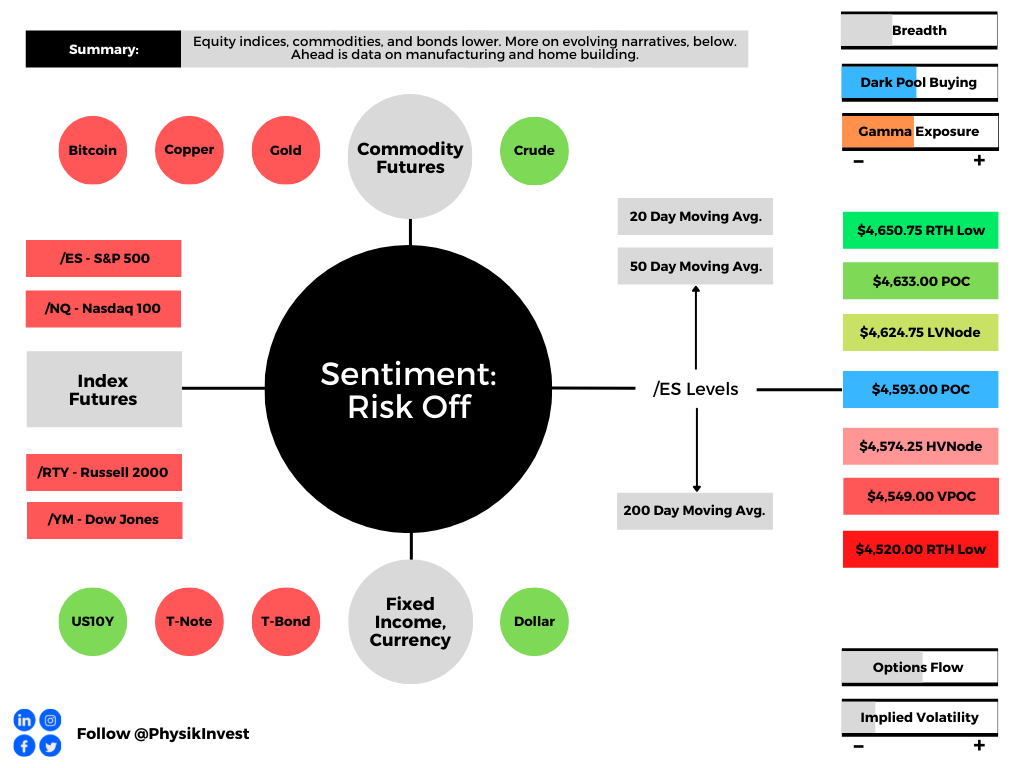
Graphic updated 6:30 AM ET. Sentiment Risk-Off if expected /ES open is below the prior day’s range. /ES levels are derived from the profile graphic at the bottom of the following section. Levels may have changed since initially quoted; click here for the latest levels. SqueezeMetrics Dark Pool Index (DIX) and Gamma (GEX) calculations are based on where the prior day’s reading falls with respect to the MAX and MIN of all occurrences available. A higher DIX is bullish. At the same time, the lower the GEX, the more (expected) volatility. Learn the implications of volatility, direction, and moneyness. SHIFT data used for S&P 500 (INDEX: SPX) options activity. Note that options flow is sorted by the call premium spent; if more positive, then more was spent on call options. Breadth reflects a reading of the prior day’s NYSE Advance/Decline indicator. VIX reflects a current reading of the CBOE Volatility Index (INDEX: VIX) from 0-100.
What To Expect
Fundamental: Ahead of earnings releases from Goldman Sachs Group (NYSE: GS), Morgan Stanley (NYSE: MS), Bank of America (NYSE: BAC), and Netflix (NASDAQ: NFLX), as well as key rate decisions, indices sold heavy.
The Nasdaq 100 led the decline after holiday-trade, Monday, as yields surged alongside concerns central banks would tighten monetary policy sooner than expected.
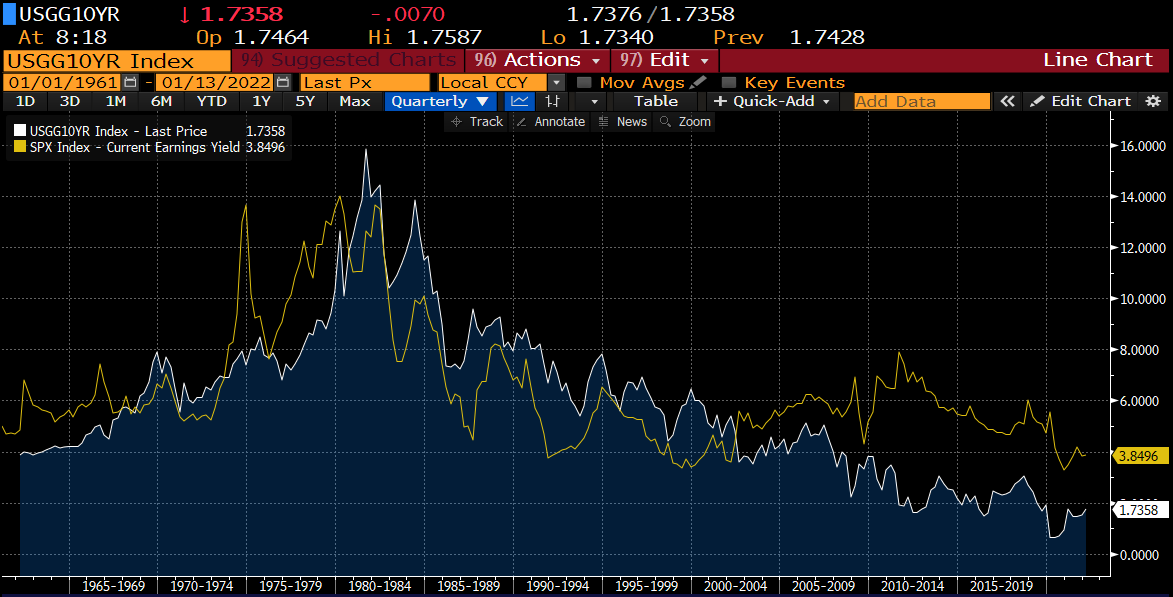
This is as higher rates have the potential to decrease the present value of future earnings, making stocks, especially those that are high growth, less attractive.
“The rationale behind this is the trade-off,” Grit Capital put well in a recent newsletter.
“Why would I park my money somewhere that is only yielding 1%, when I can invest in riskier assets that can raise my return?”
Graphic: Per Grit Capital, “A common proxy that a lot of people look at is the S&P500’s earnings yield (yellow) vs. the 10yr (white).”
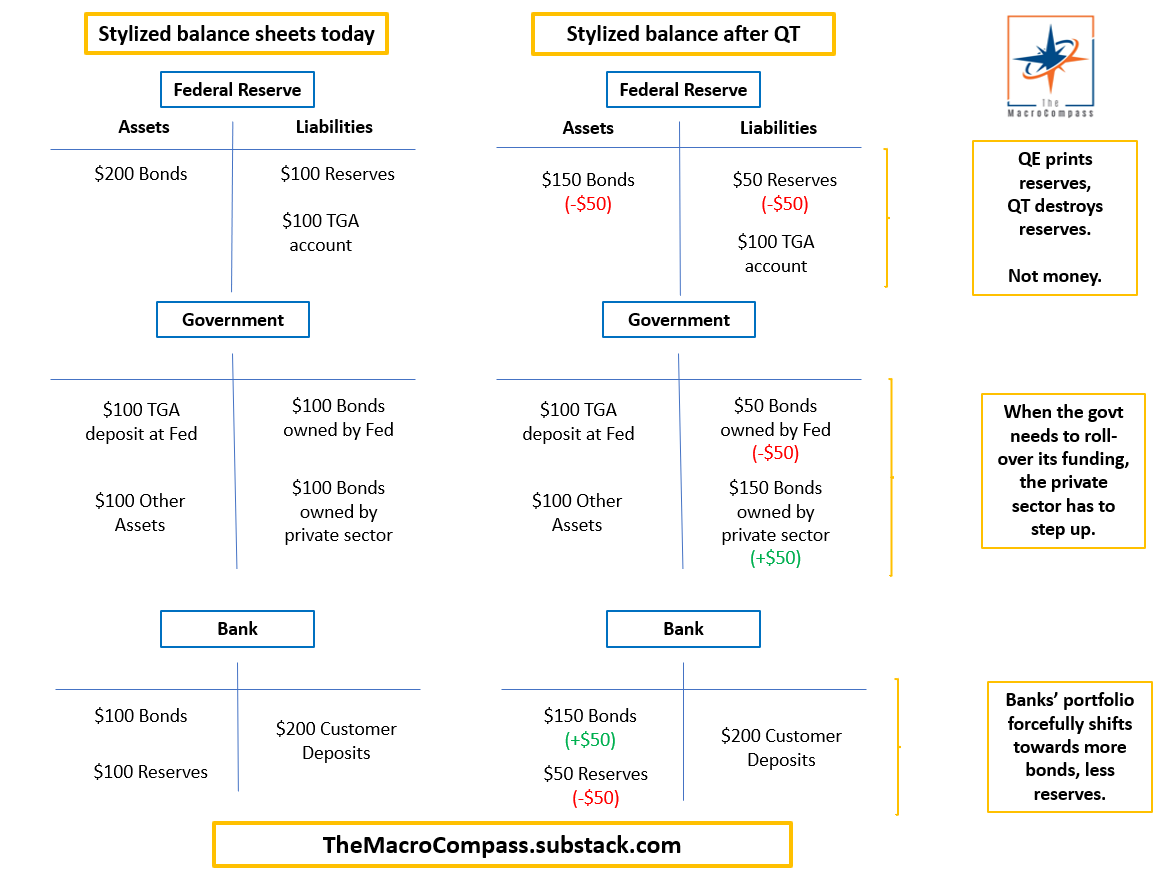
At the same time, narratives around quantitative tightening (i.e., the reduction in the size of the Federal Reserve’s balance sheet) are growing louder.
This is what Andy Constan of Damped Spring Advisors refers to as the QT drumbeat.
This drumbeat is to intensify in spite of strong economic and earnings growth, as well as a moderation in inflation, Constan says.
“The lack of additional liquidity provided by Fed purchase will also remove a damper for the market and the economy keeping asset volatility well bid, while also causing asset diversification benefit to fall, generating rising portfolio volatility and the risk demanded to hold assets.”
Note: Check out this Constan’s really interesting story, below!
Graphic: Via The Market Ear, “Temporary relief from Powell – slow reverse QE’ confirmed. Powell says Fed will stop replacing maturing bonds, but will not sell holdings: slow QT.”
“If current, priced in, inflation and growth expectations are exactly realized we predict that risk premiums on 30-year yields will increase by 15bp and equity risk premium by 30bp,” Constan adds. “These risk premium expansions will generate a 2% headwind on long bond prices and a 10% headwind for equity prices.”
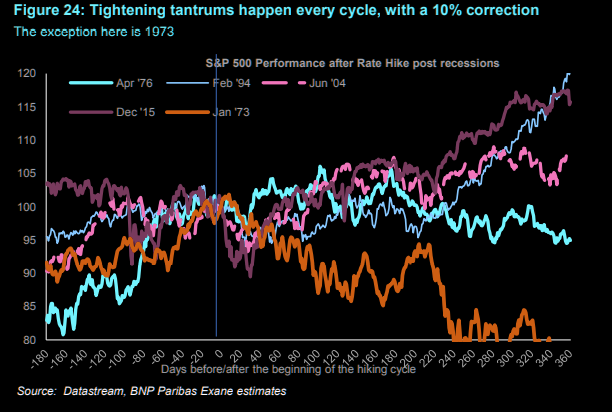
Constan’s comments line up with that of Morgan Stanley’s which sees markets selling down 10-20% during H1 2022, as expectations call for five 25 bp hikes. History is in alignment, below.
Graphic: S&P 500 performance before and after rate hikes, via The Market Ear.
So, despite recent inflows and “light positioning,” taking all of the above comments together, the window for stocks to rally is closing.
Positioning: The coming January 19 expiration of options on the Cboe Volatility Index (INDEX: VIX) and January 21 monthly equity options expiration (OPEX) has major implications.
According to Constan, the “[o]ptions expiration which includes lots of LEAP contracts will be a catalyst for a squeeze rally and a post-OpEx sell-off.”
This is as, according to Kai Volatility’s Cem Karsan, there is a constant structural positioning that naturally drives markets higher.
“I use this analogy of a jet,” he explained, referencing the three factors – the change in the underlying price (gamma), implied volatility (vanna), and time (charm) – that are well known to impact an options exposure to directional risk or delta.
“[T]he hedging vanna and charm flows, and whatnot will push the markets higher.”
To note, though, with narratives around higher rates and QT strengthening, so to speak, divergences between the S&P 500 and metrics like the Bond Closed-End Fund (CEF) Advance-Decline line have already appeared.
As McClellan Financial Publications explains, “liquidity has suddenly become a problem, and it is affecting the more liquidity-sensitive issues first. That can be a prelude to that same illiquidity coming around and biting the big cap stocks that drive the major averages.”
As an aside, some believe that the Fed’s removal of liquidity has the potential to prick the bubble, prompting a cascading reaction that exacerbates underlying price movements.
“It’s not a coincidence that the mid-February to mid-March 2020 downturn literally started the day after February expiration and ended the day of March quarterly expiration,” Karsan adds.
“These derivatives are incredibly embedded in how the tail reacts and there’s not enough liquidity, given the leverage, if the Fed were to taper.”
Technical: As of 6:30 AM ET, Tuesday’s regular session (9:30 AM – 4:00 PM ET), in the S&P 500, will likely open in the lower part of a negatively skewed overnight inventory, outside of prior-range and -value, suggesting a potential for immediate directional opportunity.
Gap Scenarios: Gaps ought to fill quickly. Should they not, that’s a signal of strength; do not fade. Leaving value behind on a gap-fill or failing to fill a gap (i.e., remaining outside of the prior session’s range) is a go-with indicator.

Auctioning and spending at least 1-hour of trade back in the prior range suggests a lack of conviction; in such a case, do not follow the direction of the most recent initiative activity.
In the best case, the S&P 500 trades higher; activity above the $4,593.00 point of control (POC) puts in play the $4,624.75 low volume area (LVNode). Initiative trade beyond the LVNode could reach as high as the $4,633.00 POC and $4,650.75 regular trade low (RTH Low), or higher.
In the worst case, the S&P 500 trades lower; activity below the $4,593.00 POC puts in play the $4,574.25 high volume area (HVNode). Initiative trade beyond the HVNode could reach as low as the $4,549.00 VPOC and $4,520.00 RTH Low, or lower.
Considerations: The S&P 500 remains above its 200-day simple moving average. The long-term trend remains up.
Click here to load today’s key levels into the web-based TradingView charting platform. Note that all levels are derived using the 65-minute timeframe. New links are produced, daily.
Graphic: 65-minute profile chart of the Micro E-mini S&P 500 Futures.
Definitions
Volume Areas: A structurally sound market will build on areas of high volume (HVNodes). Should the market trend for long periods of time, it will lack sound structure, identified as low volume areas (LVNodes). LVNodes denote directional conviction and ought to offer support on any test.
If participants were to auction and find acceptance into areas of prior low volume (LVNodes), then future discovery ought to be volatile and quick as participants look to HVNodes for favorable entry or exit.
POCs: POCs are valuable as they denote areas where two-sided trade was most prevalent in a prior day session. Participants will respond to future tests of value as they offer favorable entry and exit.
MCPOCs: POCs are valuable as they denote areas where two-sided trade was most prevalent over numerous day sessions. Participants will respond to future tests of value as they offer favorable entry and exit.
Options Expiration (OPEX): Traditionally, option expiries mark an end to pinning (i.e, the theory that market makers and institutions short options move stocks to the point where the greatest dollar value of contracts will expire) and the reduction dealer gamma exposure.
About
After years of self-education, strategy development, mentorship, and trial-and-error, Renato Leonard Capelj began trading full-time and founded Physik Invest to detail his methods, research, and performance in the markets.
Capelj is also a Benzinga finance and technology reporter interviewing the likes of Shark Tank’s Kevin O’Leary, JC2 Ventures’ John Chambers, FTX’s Sam Bankman-Fried, and ARK Invest’s Catherine Wood, as well as a SpotGamma contributor developing insights around impactful options market dynamics.
Disclaimer
Physik Invest does not carry the right to provide advice.
In no way should the materials herein be construed as advice. Derivatives carry a substantial risk of loss. All content is for informational purposes only.