Categories
Commentary

Daily Brief For May 12, 2023

LOAD LEVELS ON TRADINGVIEW BY CLICKING HERE.

Bloomberg reports that if the US defaults on its debt, which could happen as soon as June 1 if President Biden and House Speaker McCarthy fail to reach a deal on raising the ceiling, homebuyer borrowing costs may surge to 8.40%. As a consequence, the typical home’s monthly payment would increase by 22.00% and cool property sales; the monthly payment on a $500,000.00 mortgage may rise to $3,800.00, compared to about $3,095.00 at the current rate of 6.30%.

Image
Graphic: Retrieved from WSJ.

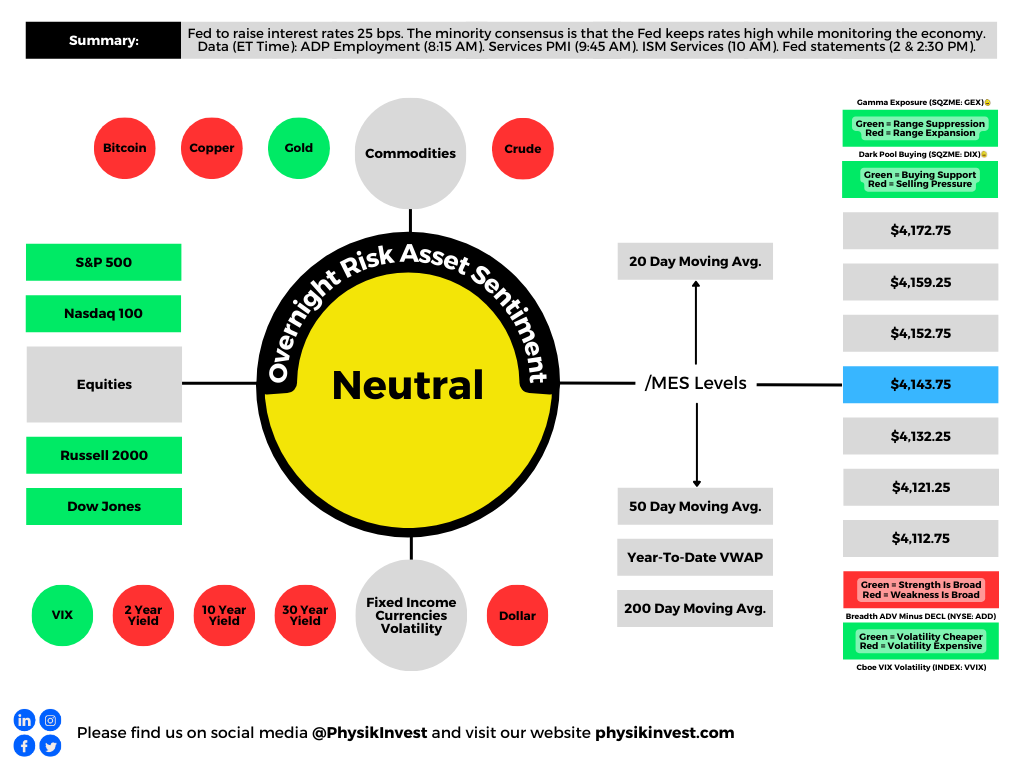
In prior letters, we concluded that past monetary action made stocks less sensitive to interest rates, quoting JPMorgan Chase & Co (NYSE: JPM) strategists that the market would likely continue to “artificially suppress perceptions of fundamental macro risks,” barring surprises like a debt limit breach.

US Tech Stocks Outperform | The Nasdaq 100 has soared amid expectations of easier Fed policy
Graphic: Retrieved from Bloomberg.

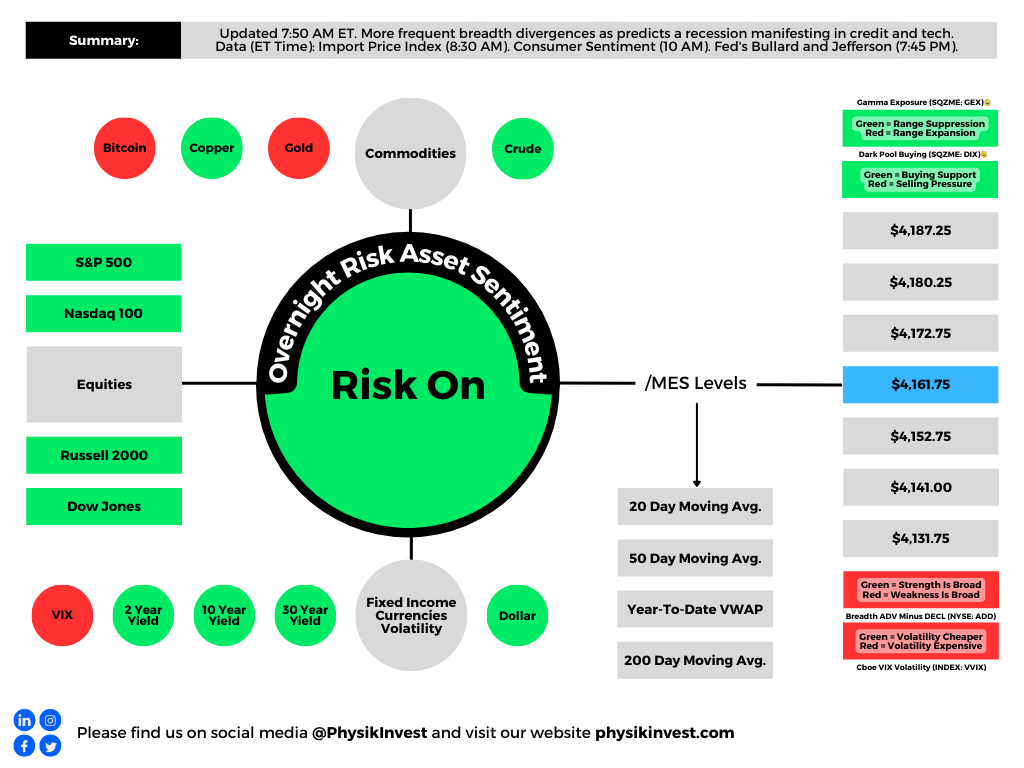
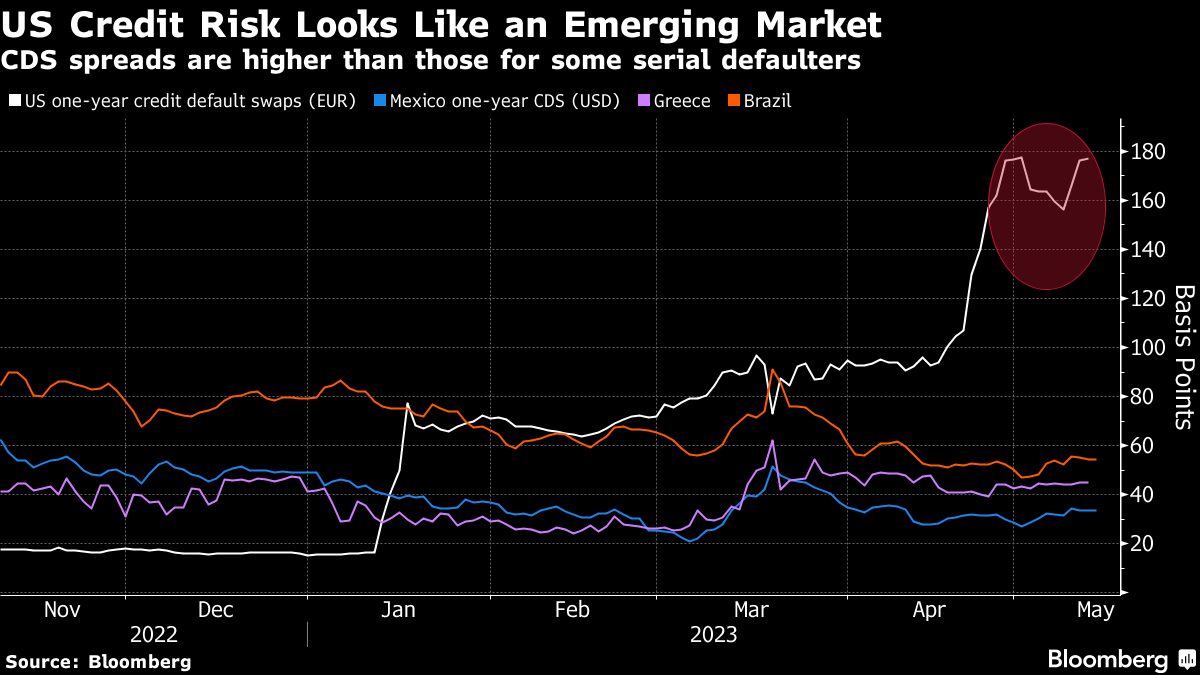
With a debt limit breach a potential reality, Moody’s Corporation (NYSE: MCO) says a breach may compound recessionary pressures; expect a drop in equities, a volatility spike, and a disruption of funding markets.

Graphic: Retrieved from Nasdaq Inc (NASDAQ: NDAQ).

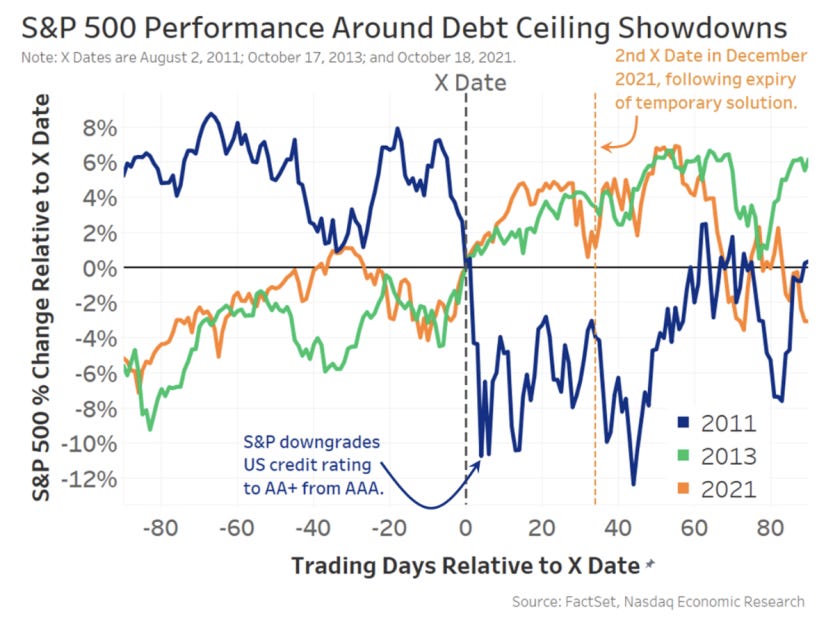
“Data show that short-term bonds have the most predictable reaction – with interest rates and default insurance costs rising significantly – before quickly returning to normal after the uncertainty has passed,” Nasdaq’s Phil Mackintosh writes. “In reality, a crisis was averted in all [prior] cases, with the government able to increase or suspend the debt limit before the X Date.”

Graphic: Retrieved from Bloomberg.

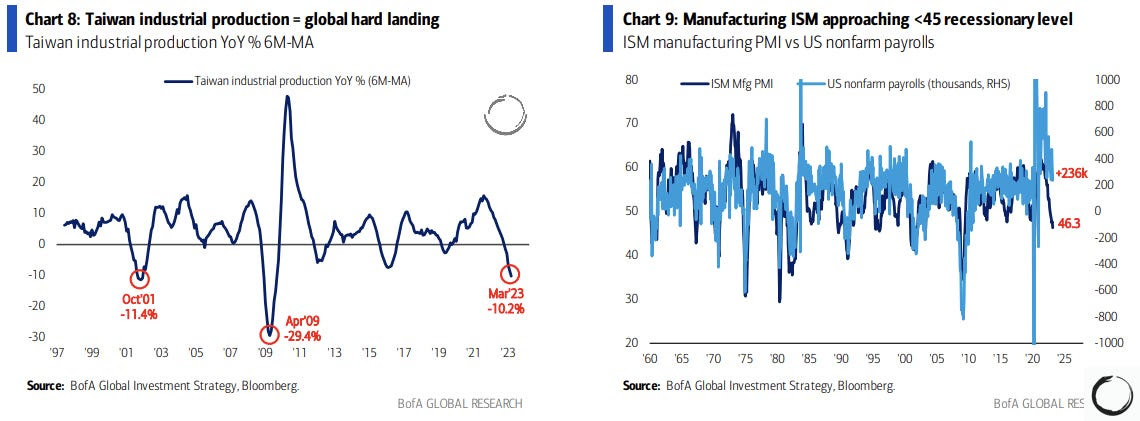
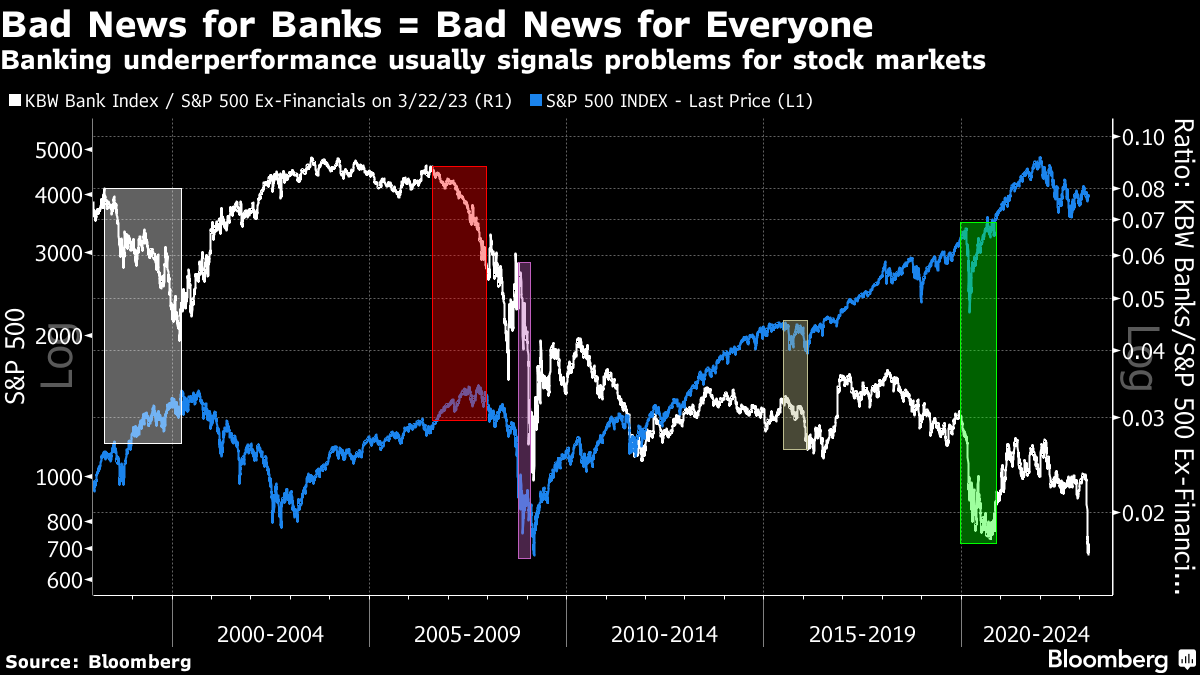
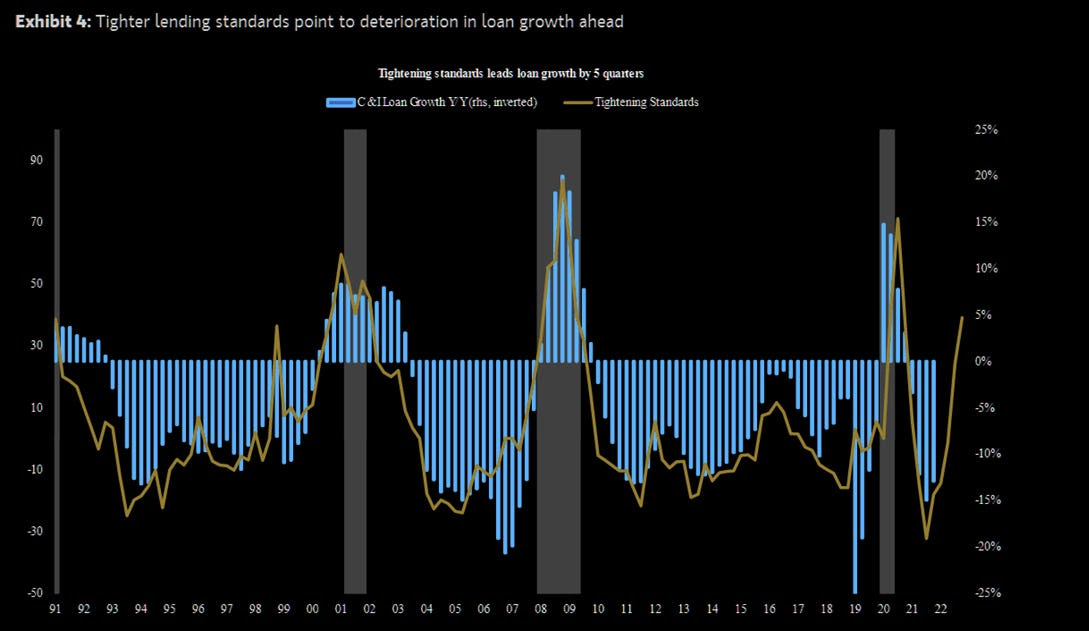
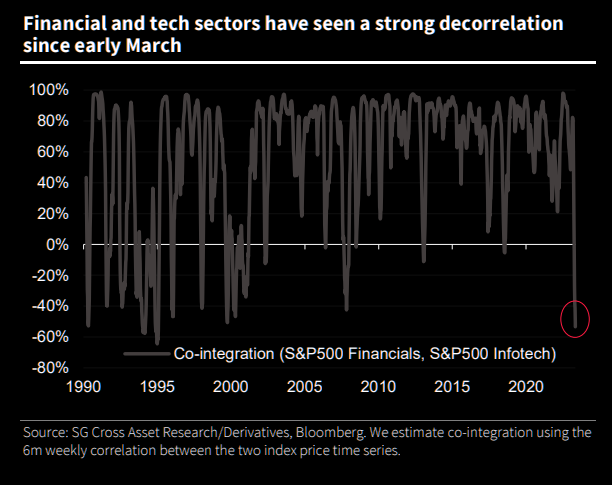
Notwithstanding the short-term uncertainty regarding the debt limit, Bank of America Corporation (NYSE: BAC) is adamant there will be a recession that manifests cracks in “credit and tech,” similar to the situation in 2008. BAC sees the bubble in technology, media, and telecommunication stocks soon deflating as they face higher-for-longer interest rates and a tempered earnings outlook.

Graphic: Retrieved from Societe Generale SA (OTC: SCGLY) via The Market Ear. While investors poured $3.8 billion into technology stocks in the week through May 10, $2.1 billion was pulled from financial equities, the most significant redemption since May 2022.

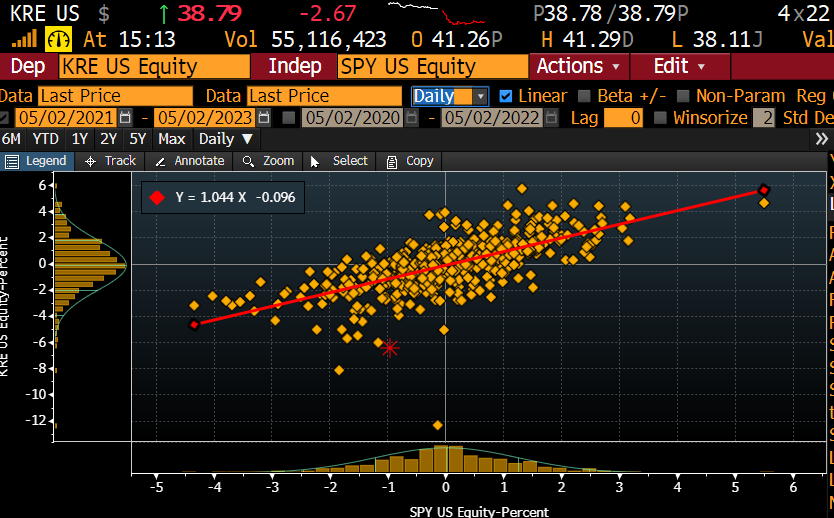
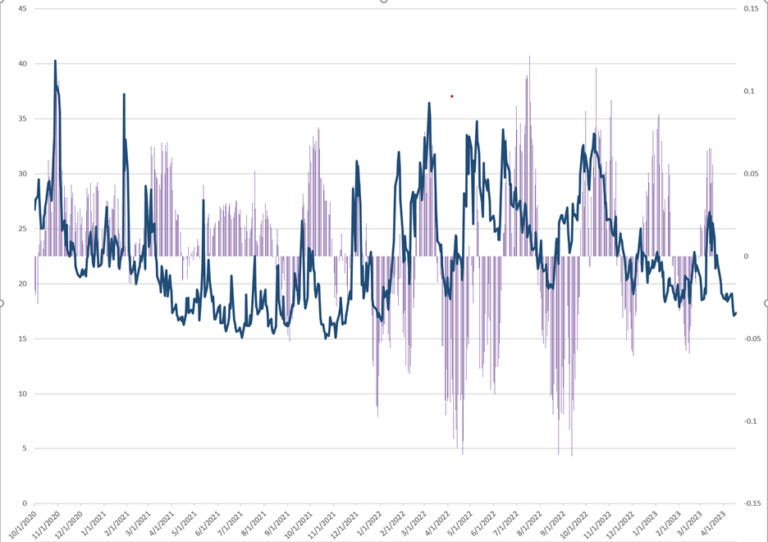
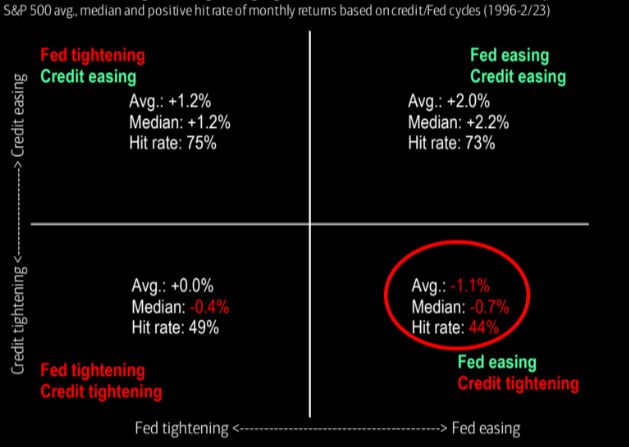
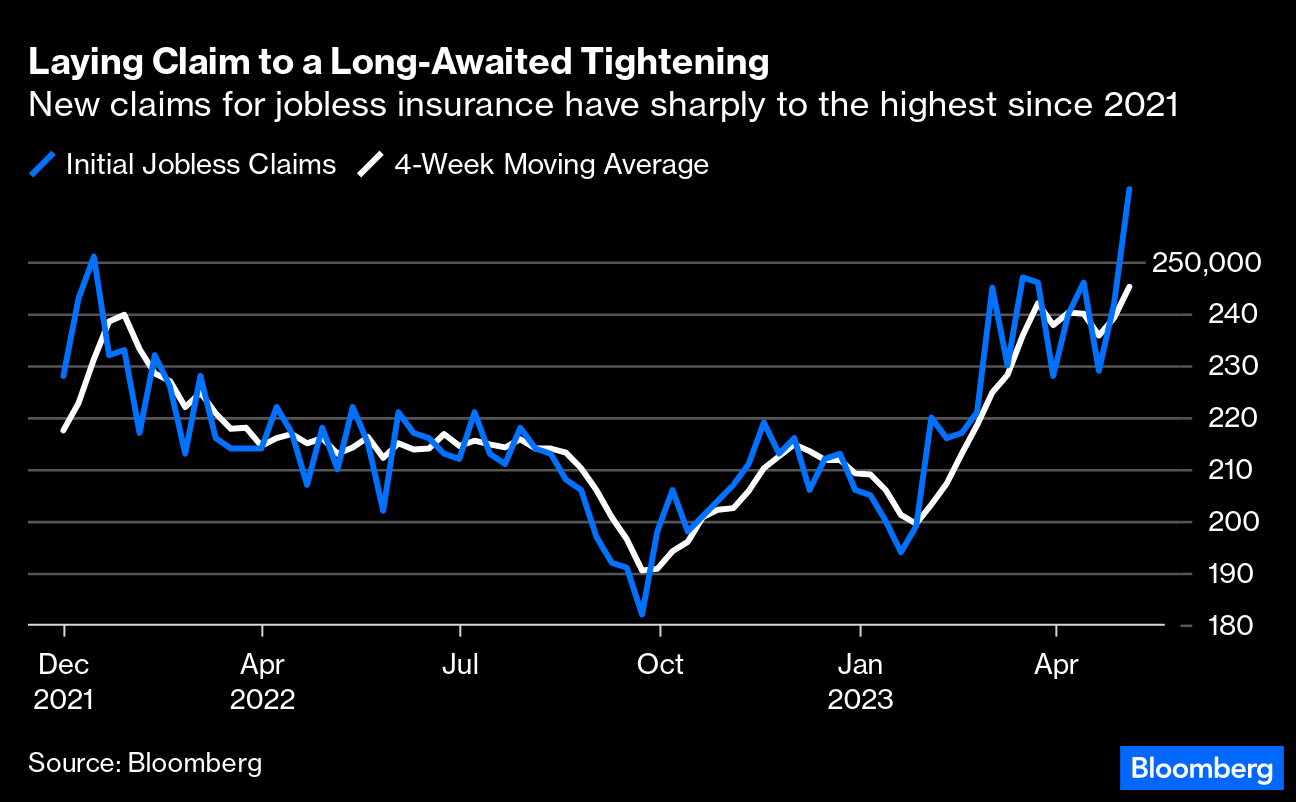
Compounding the recessionary pressures BAC sees, EPB Research adds, are banks’ funding costs, which have increased too much relative to prevailing asset yields. If the spread drops too low, bank lending tightens, and a recession occurs. Also, other data suggests tightening is finally starting to have an impact. Bloomberg reports that initial claims for unemployment insurance are on the rise. There has been a drop in overall wage growth to 5.1% last month, too, the biggest fall in the rate of increase since the series began.

Graphic: Retrieved from Bloomberg.

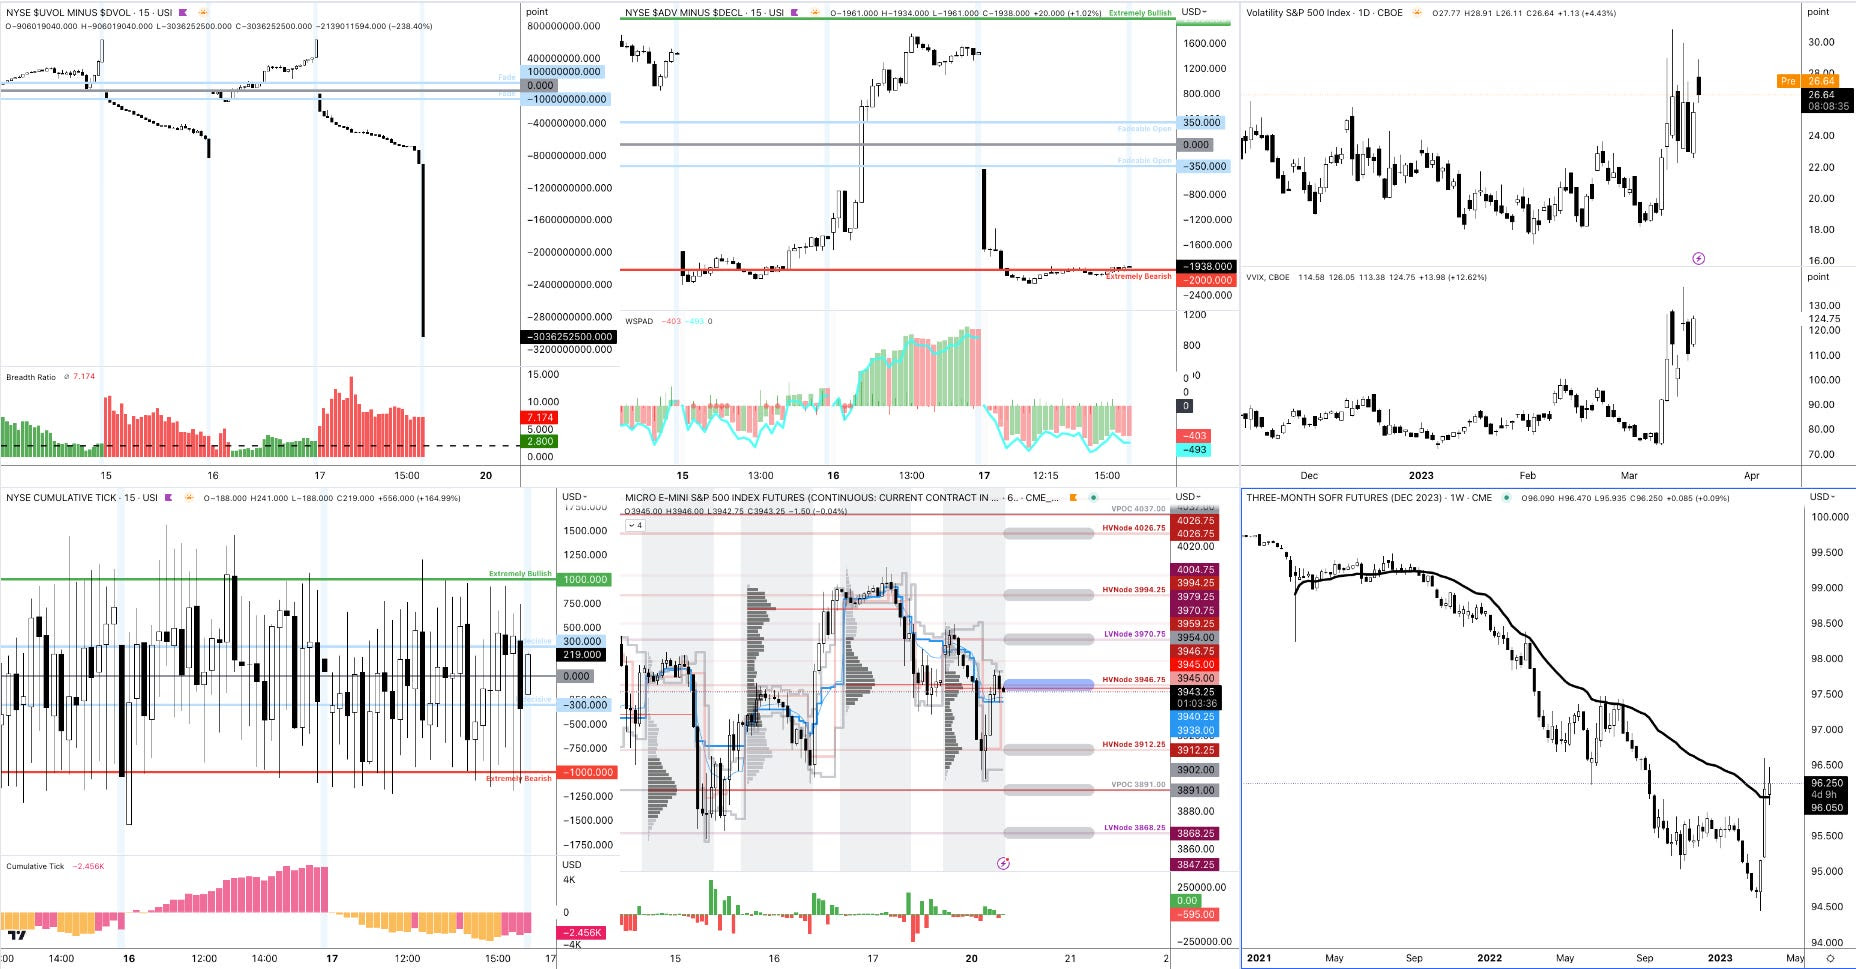
Separately, breadth divergences are becoming more frequent, with the Daily Advance-Decline (A-D) Line for the NYSE showing lower highs while DJIA and S&P 500 show slightly higher highs, McClellan Financial Publications writes. The bond CEF A-D Line is also showing a bearish divergence, indicating a shift in liquidity that could weigh on other stocks, including the big-cap stocks holding up the SP500 and the Nasdaq 100.

bond cef a-d line
Graphic: Retrieved from McClellan Financial Publications.

McClellan adds that the A-D Line originated from data collected by Leonard Ayres and James Hughes in the 1920s. It was made famous in 1962.

nyse a-d line 1929
Graphic: Retrieved from McClellan Financial Publications.

That’s when Joe Granville and Richard Russell commented on it in their newsletters, noting how it had shown a big bearish divergence ahead of the 1962 bear market.

a-d line 1962
Graphic: Retrieved from McClellan Financial Publications.

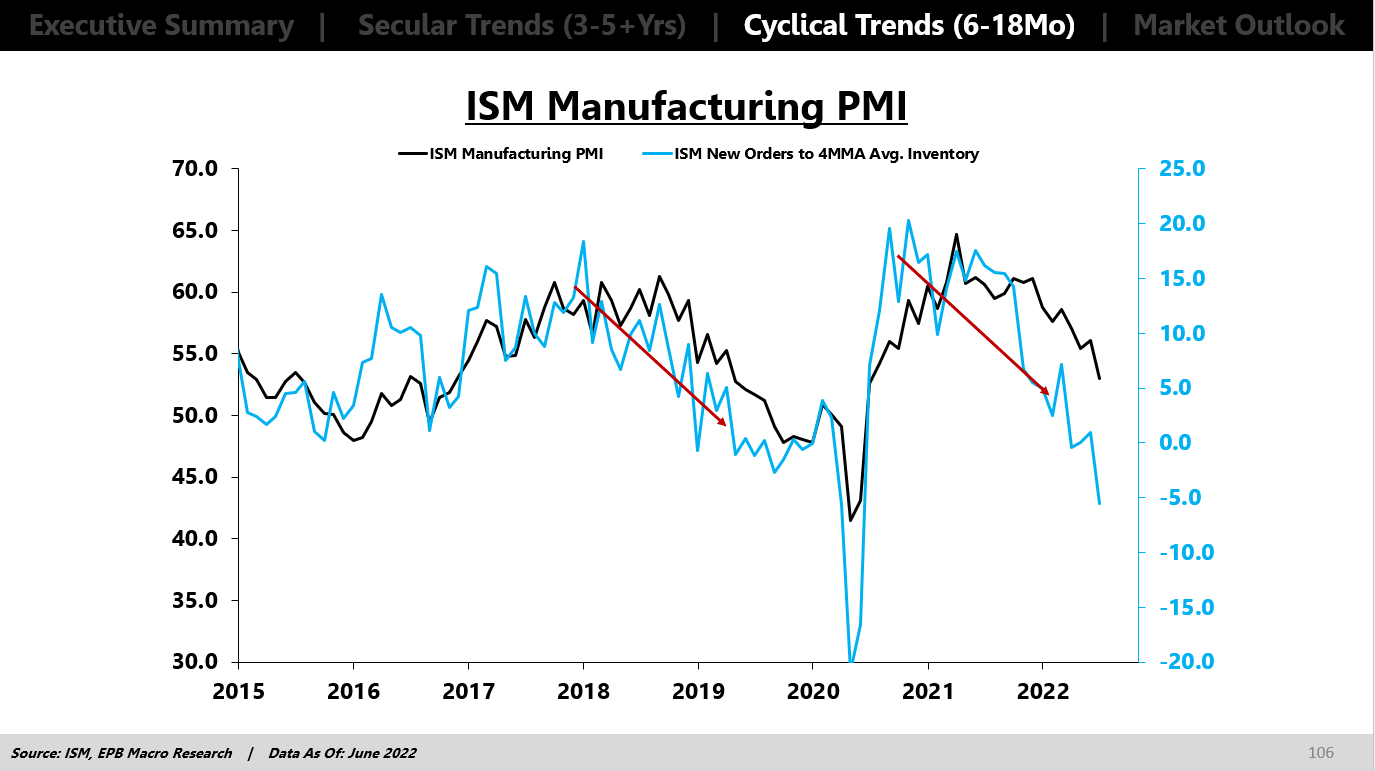
To end, the economic calendar next week is focused on manufacturing and housing. The housing market is showing some downside risk for existing-home sales for April due to a weak reading on pending sales, MCO says, adding that housing permits and starts are expected to move sideways as builders remain cautious amid high-interest rates and economic uncertainty. Regional Fed surveys in New York and Philadelphia will provide the first read on factory activity for May, with little hope for a significant rebound in manufacturing. Jobless claims will be critical, as continuing the recent trend would likely signal a rapid deceleration in monthly job gains. Other critical data to be released include retail sales, industrial production, and business inventories.

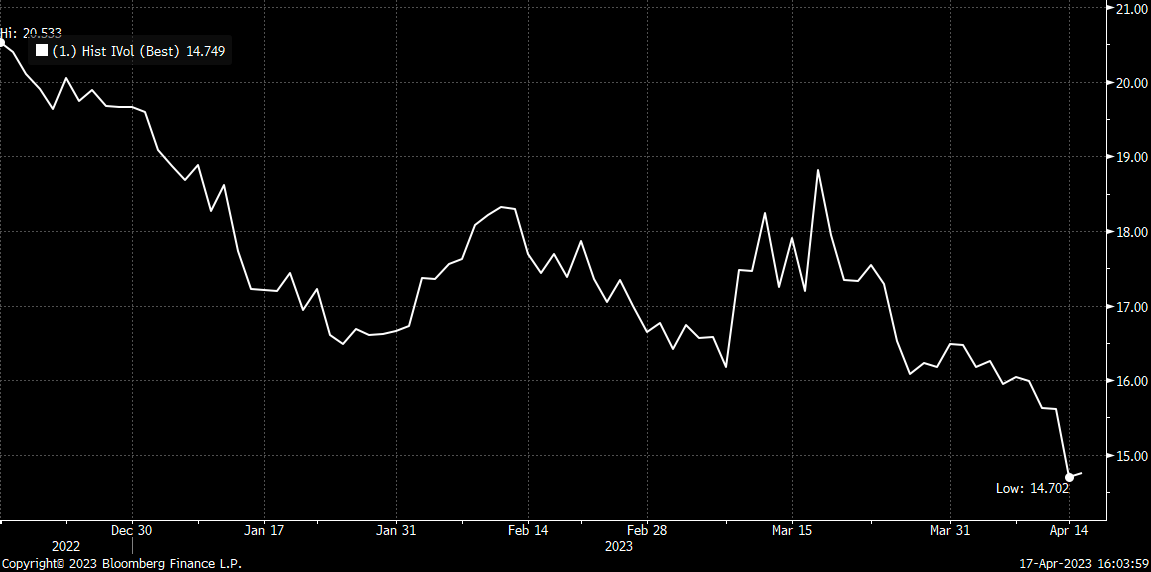
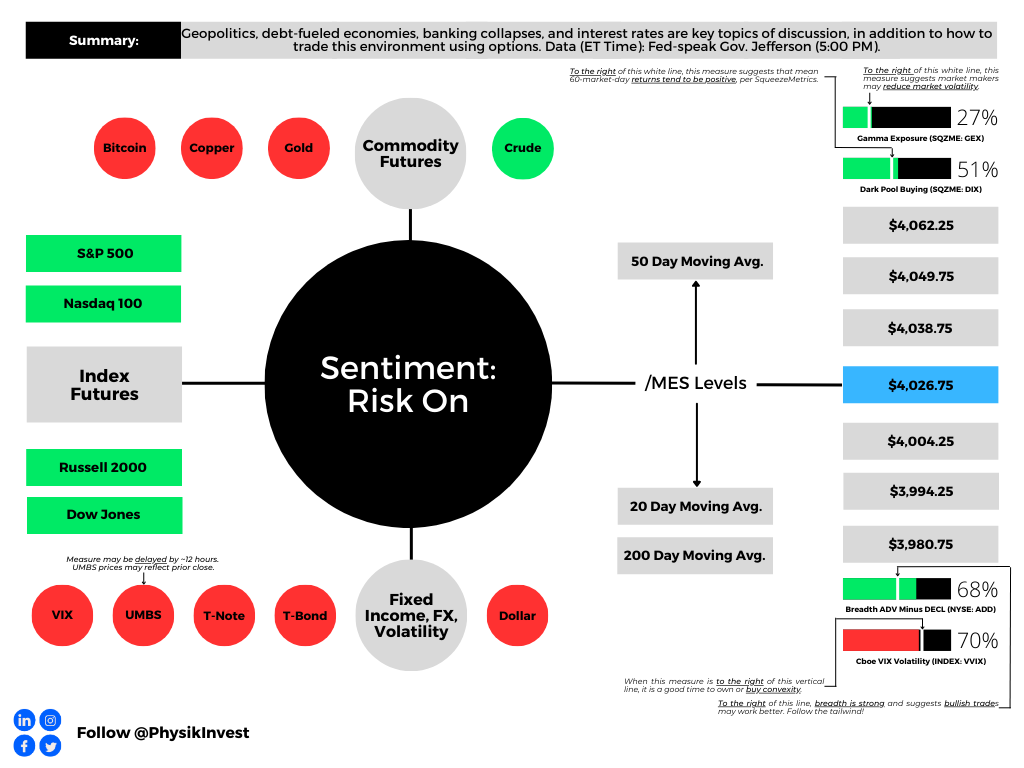
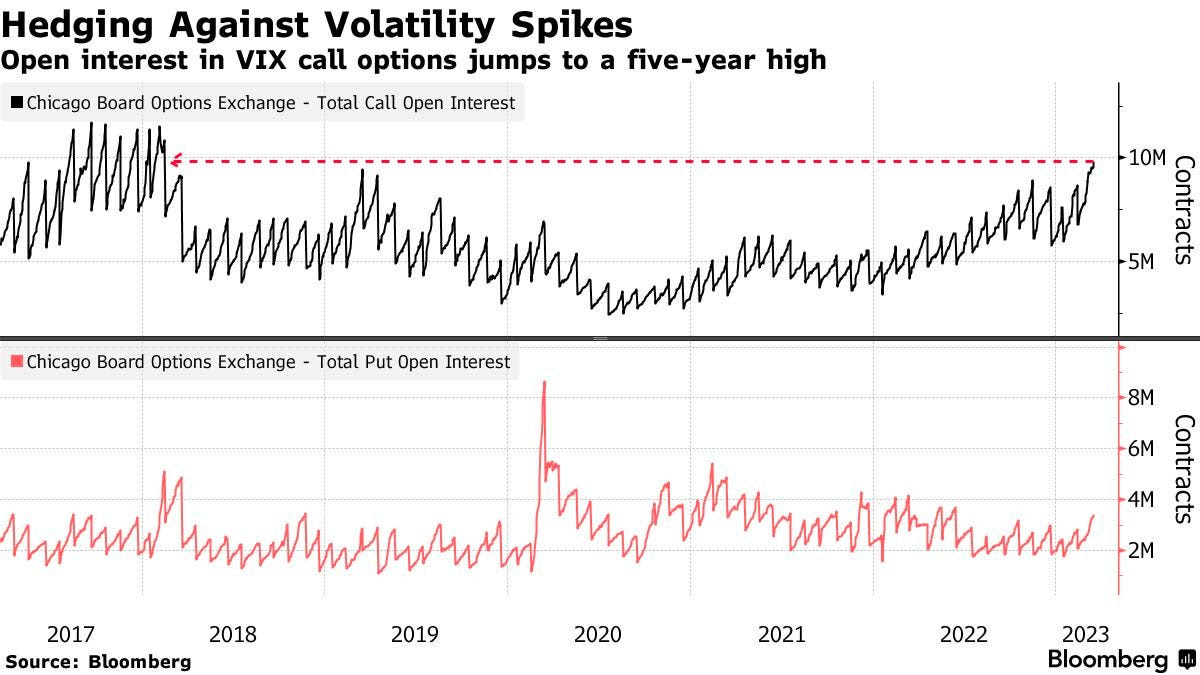
Should readers wish to hedge the debt ceiling debacle, June call options on the Cboe Volatility Index appear attractive, some suggest. But, with RVOL as low as it is, owning optionality is not generally warranted. The risk is lower lows in volatility.

Image
Graphic: Retrieved from SpotGamma.

About

Welcome to the Daily Brief by Physik Invest, a soon-to-launch research, consulting, trading, and asset management solutions provider. Learn about our origin story here, and consider subscribing for daily updates on the critical contexts that could lend to future market movement.

Separately, please don’t use this free letter as advice; all content is for informational purposes, and derivatives carry a substantial risk of loss. At this time, Capelj and Physik Invest, non-professional advisors, will never solicit others for capital or collect fees and disbursements. Separately, you may view this letter’s content calendar at this link.

Categories
Commentary

Daily Brief For May 3, 2023

LOAD ALL LEVELS ON TRADINGVIEW BY CLICKING HERE.

The S&P 500 (INDEX: SPX) recovered after a violent sell-off led by products like the SPDR S&P Regional Banking ETF (NYSE: KRE). This is before updates on the Federal Reserve’s (Fed) monetary policy today.

Graphic: Retrieved from Danny Kirsch of Piper Sandler Companies (NYSE: PIPR).

The consensus is the Fed ratchets up the target rate to 5.00-5.25%. Following this, it is likely to keep rates at this higher level for longer than markets expect, letting the effects of the tightening work through the economy and tame the still-sticky inflation (e.g., lenders eating the cost of interest to sell more goods, job vacancies dropping, and payrolls surprising higher).

Graphic: Retrieved from Citigroup Inc (NYSE: C) via Bloomberg. “The Fed’s own projections from March suggest rates will be only just above 5% by year’s end — implying a protracted pause with no cuts, after the most aggressive hiking campaign in decades. It’s marked in red in the chart [above].”

Strategists at JPMorgan Chase & Co (NYSE: JPM) think a “hike and pause” scenario prompts a push higher in stocks.

“Here, the Fed would be relying on a tightening of lending standards stemming from the banking crisis to act as de facto rate hikes. Any language that the market interprets as the Fed being on pause should benefit stocks,” JPM wrote. “This outcome is not fully priced into equities.”

This idea was alluded to in yesterday’s letter; stocks likely do “ok” in a higher rates for longer environment. Beyond economic surprises and the debt ceiling issue, the Fed’s balance sheet (not likely to be addressed in this next announcement) strategists like Andy Constan of Damped Spring Advisors are most concerned about, since the size of quantitative easing or QE made stocks less sensitive to interest rates. Ratcheting quantitative tightening or QT, the flow of capital out of markets, would prompt some increased bearishness among those strategists.

Graphic: Retrieved from Bank of America Corporation (NYSE: BAC) via Macro Ops.

JPM strategists add the market may continue “artificially suppress[ing] perceptions of fundamental macro risks,” prompting upside momentum.

“We expect these inflows to persist over the next two weeks, with several more large returns expected to drop from the trailing sample window,” Tier1Alpha explains. “Even if market volatility increases during this time, it would take exceptionally significant moves to trigger substantial selling. While these inflows are advantageous during market upswings, it’s essential to remember that they can be particularly brutal on the way back down once volatility inevitably returns.”

Eventually, “as recessionary conditions proliferate,” EPB’s Eric Basmajian says, asset prices will turn. Downside accelerants include the debt limit breach, which Nasdaq Inc (NASDAQ: NDAQ) and Moody’s Corporation (NYCE: MCO) think portends recession and volatility spike.

Trade ideas and more in our recently published report.

Graphic: Retrieved from Bloomberg.

About

Welcome to the Daily Brief by Physik Invest, a soon-to-launch research, consulting, trading, and asset management solutions provider. Learn about our origin story here, and consider subscribing for daily updates on the critical contexts that could lend to future market movement.

Separately, please don’t use this free letter as advice; all content is for informational purposes, and derivatives carry a substantial risk of loss. At this time, Capelj and Physik Invest, non-professional advisors, will never solicit others for capital or collect fees and disbursements. Separately, you may view this letter’s content calendar at this link.

Categories
Commentary

Daily Brief For April 18, 2023

LOAD LEVELS ON TRADINGVIEW BY CLICKING HERE.

Bank of America Corporation (NYSE: BAC) sees allocations to equities versus bonds falling. That’s amid recession fears. Per EPB, “the cyclical economy has just started to shed jobs today, and leading indicators signal the recession is likely underway.”

“To get advanced warning of recessions, you must look at the construction and manufacturing sectors, even though these two sectors are only 13% of the labor market,” EPB adds, noting traditional indicators’ weakening predictability is not so great to ignore the insight. “It’s clear that the composition of traditional leading indicators remains appropriate, and thus, the current resounding recessionary signal should not be ignored.”

BAC strategist Michael Hartnett said, though, that this “consensus lust for recession” must soon be satisfied. Otherwise, the “pain trade” would be even higher yields and stocks; the S&P 500 (INDEX: SPX) is enjoying an accelerated rally which Jefferies Financial Group (NYSE: JEF) strategists think portends a period of flatness, now, over the coming weeks …

Graphic: Retrieved from Jefferies Financial Group (NYSE: JEF) via The Market Ear.

… and through options expiration (OpEx), typically a poor performance period for the SPX.

Displaying
Graphic: Retrieved from Tier1Alpha. 

Beyond the uninspiring fundamentals, the positioning contexts are supportive. Recall our letters published earlier this year. If the market consolidated and failed to break substantially, then falling implied volatility (IVOL) and time passing would bolster markets and, potentially, help build a platform for a rally into mid-year. A check of fixed-strike and top-line measures of IVOL like the Cboe Volatility Index or VIX confirms options activities are keeping markets intact.

Graphic: Retrieved from Danny Kirsch of Piper Sandler (NYSE: PIPR). “SPX May $4,150.00 call volatility, the lack of realized volatility weighing on the market. Volatility low, not cheap.”

Beyond the rotation into shorter-dated options, just one of the factors exacerbating the decimation of longer-dated volatility, traders’ consensus is that markets won’t move a lot and/or they don’t need to hedge over longer time horizons; traders want punchier exposure to realized volatility (RVOL), and that they can get through shorter-dated options that have more gamma (i.e., exposure to changes in movement), not vega (i.e., exposure to changes in implied volatility).

Graphic: Retrieved from Goldman Sachs Group Inc (NYSE: GS) via Bloomberg.

Consequently, counterparties may be less dangerous to accelerating movement in either direction; hence, the growing likelihood of a period of flatness.

Graphic: Retrieved from SpotGamma.

“Despite the collapse in the 1-month realized volatility, we suspect most vol control funds have scaled into using their longer-term realized vols, which by design, lead to less aggressive rebalancing flows,” Tier1Alpha says. “For example, the 3-month rVol, which is currently driving our model, was essentially unchanged yesterday, which means volatility targets were maintained, and very little additional rebalancing had to occur. So even with the decline in the 1-month vol, overall risk exposure remained the same.”

With IVOL at a lower bound, the bullish impacts yielded by its compressing have largely played out. There may be more to be gained by movements higher in IVOL, in addition to the expiry of many call options this OpEx. By owning protection, particularly far from current prices, you are positioned to monetize on the market downside and non-linear repricings of volatility, as this letter has discussed in recent history. The caveat is that volatility can cluster and revert for longer; hence, your structure matters.

“I am concerned that VIX is underpricing the series of events that we know to expect over the coming weeks,” says Interactive Brokers Group Inc’s (NASDAQ: IBKR) Steve Sosnick. “While there is now an 88% implied likelihood of a 25 basis point hike, the likely path of any potential future hikes and assumed cuts should be more clarified at the meeting and in its aftermath.  And oh, has anyone ever heard the expression “sell in May and go away?”

Graphic: Retrieved from Interactive Brokers Group Inc (NASDAQ: IBKR).

With call skews far up meaningfully steep in some products, still-present low- and zero-cost call structures this letter has talked about in the past remain attractive. If the market falls apart, your costs are low, and losses are minimal. If markets move higher into a “more combustible” position, wherein “volatility is sticky into a rally,” you may monetize your call structures and roll some of those profits into bear put spreads (i.e., buy put and sell another at a lower strike). An alternative option is neutral. Own something such as a T-bill or box spread (i.e., buy call and sell put at one strike and sell call and buy put at another higher strike). Some boxes are yielding upwards of 5.4% as of yesterday’s close.

To end, though the short-dated options activity may prompt cascading events in market downturns, the main issue is the reduced use of longer-dated options; a supply and demand imbalance likely resolves itself with an implied volatility repricing of a great size where longer-dated options outperform those that are shorter-dated.

Our locking in of rates or using the profits of call structures to position for a potential IVOL repricing, particularly in the back half of the year when dealer positioning is less clear, buybacks are to fall off of a cliff, rates may fall, and the boost from short-covering has played its course, is an attractive proposition given the context.

Graphic: Retrieved from Bloomberg. “The S&P 500 (white line) is well above its levels from early March, while the yield on the 3m-2y spread remains in a deep inversion, signifying meaningful expectations of cuts in the months ahead.”

About

Welcome to the Daily Brief by Physik Invest, a soon-to-launch research, consulting, trading, and asset management solutions provider. Learn about our origin story here, and consider subscribing for daily updates on the critical contexts that could lend to future market movement.

Separately, please don’t use this free letter as advice; all content is for informational purposes, and derivatives carry a substantial risk of loss. At this time, Capelj and Physik Invest, non-professional advisors, will never solicit others for capital or collect fees and disbursements. Separately, you may view this letter’s content calendar at this link.

Categories
Commentary

Daily Brief For March 27, 2023

Physik Invest’s Daily Brief is read free by thousands of subscribers. Join this community to learn about the fundamental and technical drivers of markets.

Graphic updated 9:10 AM ET. Sentiment Risk-On if expected /MES open is above the prior day’s range. /MES levels are derived from the profile graphic at the bottom of this letter. Click here for the latest levels. SqueezeMetrics Dark Pool Index (DIX) and Gamma (GEX) with the latter calculated based on where the prior day’s reading falls with respect to the MAX and MIN of all occurrences available. A higher DIX is bullish. The lower the GEX, the more (expected) volatility. Click to learn the implications of volatility, direction, and moneyness. Breadth reflects a reading of the prior day’s NYSE Advance/Decline indicator. The CBOE VIX Volatility Index (INDEX: VVIX) reflects the attractiveness of owning volatility. UMBS prices via MNDClick here for the economic calendar.

Administrative

Sorry for the delay. Please read through the positioning section. Have a great Monday!

As always, if there are holes or unclear language. We will fix this in the next letters.

Fundamental

On 3/22, we mentioned news of Russia wanting to adopt the yuan for settlements.

And, with that, publications covering these East alliances use some tough language. One Bloomberg article notes China and Russia “roll[ing] back US power and alliances … [to] create a multipolar world … [and] diminish the reach of democratic values, so autocratic forms of government are secure and even supreme.”

Let’s rewind a bit to understand why all the toughness and fear.

Recall Chinese President Xi Jinping speaking with Saudi and GCC leaders. Here is our 1/4 summary takeaway:

Graphic: Retrieved from Physik Invest’s Daily Brief for January 4, 2023.

Essentially, those remarks confirm the East is hedging sanctions risk. Reliance on the West is falling, and this inevitably will present “non-linear shocks” (i.e., “inflation mess caused by geopolitics, resource nationalism, and BRICS”) monetary policymakers are not equipped to handle. So, are the markets at risk?

This most recent meeting between China and Russia increases the risks of unwinding the “debt-fueled economy in the US,” FT’s Rana Foroohar confirms, as we wrote in the Daily Brief for 1/4. Further, this is a threat to “hidden leverage and opaqueness.” That means the markets are at risk. Let’s explain more.

Read: Saudi National Bank Chair Resigns After Credit Suisse Remarks Helped Trigger A Slump In The Stock And Bonds That Prompted The Swiss Government To Step In And Arrange Its Takeover – Bloomberg

Graphic: Retrieved from Bloomberg.

With the encumbrance of commodities, among other initiatives, these nations’ weight in currency baskets may rise and keep “inflation from slowing.” If that happens, future rate expectations are off. Additionally, “the US dollar and Treasury securities will likely be dealing with issues they never had to deal with before: less demand, not more; more competition, not less,” we quoted Zoltan Pozsar (ex-Credit Suisse) saying on 1/5.

The markets most responsive to this are public, as we saw with 2022’s de-rate. In 2023 and beyond, added liquidation-type risks lie in the private markets. This will have knock-on effects.

Graphic: Retrieved from VoxEU.

The likes of The Ambrus Group’s Kris Sidial mentioned to your newsletter writer in a Benzinga interview that private market investors’ raising of cash to meet capital calls could prompt sales of their more liquid public market holdings. This is a major risk Sidial noted he was watching, in addition to some risks in the derivatives markets.

At the same time, Eric Basmajian believes the “banking crisis will cause a tightening of money and credit.” This will further solidify the “broader business cycle and corporate profit recession.”

Graphic: Retrieved from Bloomberg. Per John Authers, “the combination of deeply troubled banks and strong performance for the rest of the stock market cannot persist much longer.”

Positioning

Sidial’s well positioned to take advantage of the realization of these risks. In January, he explained that measures like the Cboe VIX Volatility Index (INDEX: VVIX) were low. This suggested, “we can get cheap exposure to convexity while a lot of people are worried.” In an update to Bloomberg, Sidial said The Ambrus Group’s tail-risk strategy (which Sidial has explained to us before) has performed well as the VIX index has risen, a sign of traders hedging concerns about “some contagion hitting and their portfolios being destroyed on that.”

Graphic: Retrieved from Bloomberg.

“We have seen an increase in tail hedging,” added Chris Murphy of Susquehanna International Group. “We have continued to see call buying in the VIX since the bank turmoil began.” The caveat, though, is that realized volatility or RVOL, not just implied volatility or IVOL (i.e., that which is implied by traders’ supply and demand of options), must shift and stay higher for those options to maintain their values, which may be difficult according to Kai Volatility’s Cem Karsan.

Though Karsan thinks markets will likely see RVOL come back in a big way, he thinks policymakers’ intervention will be stimulative short-term as it reverses a lot of the quantitative tightening or QT (i.e., flow of capital out of capital markets). Stimulation will be compounded by the continued unwinding of hedging strategies in previously depressed products like the Nasdaq 100 (INDEX: NDX). What do we mean by this?

Recall that traders’ closure and/or monetization of put protection results in options counterparties buying back their short stock and/or futures hedges. Therefore, before any downside is realized, the market may trade into a far “more combustible” position.

Consequently, look for low- and zero-cost call structures (e.g., ratio spreads) to play the upside while opportunistically using higher prices and elevated volatility skew to put on bear put spreads (i.e., buy put and sell another put at a lower strike price) for cheaper prices.

Consider following and supporting us on social media:

Technical

As of 9:10 AM ET, Monday’s regular session (9:30 AM – 4:00 PM ET), in the S&P 500, is likely to open in the upper part of a positively skewed overnight inventory, outside of the prior day’s range, suggesting a potential for immediate directional opportunity.

The S&P 500 pivot for today is $4,026.75. 

Key levels to the upside include $4,038.75, $4,049.75, and $4,062.25.

Key levels to the downside include $4,004.25, $3,994.25, and $3,980.75.

Disclaimer: Click here to load the updated key levels via the web-based TradingView platform. New links are produced daily. Quoted levels likely hold barring an exogenous development.

Graphic: 65-minute profile chart of the Micro E-mini S&P 500 Futures.

Definitions

Volume Areas: Markets will build on areas of high-volume (HVNodes). Should the market trend for some time, this will be identified by a low-volume area (LVNodes). The LVNodes denote directional conviction and ought to offer support on any test.

If participants auction and find acceptance in an area of a prior LVNode, then future discovery ought to be volatile and quick as participants look to the nearest HVNodes for more favorable entry or exit.


About

The author, Renato Leonard Capelj, spends the bulk of his time at Physik Invest, an entity through which he invests and publishes free daily analyses to thousands of subscribers. The analyses offer him and his subscribers a way to stay on the right side of the market. 

Separately, Capelj is an accredited journalist with past works including interviews with investor Kevin O’Leary, ARK Invest’s Catherine Wood, FTX’s Sam Bankman-Fried, North Dakota Governor Doug Burgum, Lithuania’s Minister of Economy and Innovation Aušrinė Armonaitė, former Cisco chairman and CEO John Chambers, and persons at the Clinton Global Initiative.

Connect

Direct queries to renato@physikinvest.com. Find Physik Invest on TwitterLinkedInFacebook, and Instagram. Find Capelj on TwitterLinkedIn, and Instagram. Only follow the verified profiles.

Calendar

You may view this letter’s content calendar at this link.

Disclaimer

Do not construe this newsletter as advice. All content is for informational purposes. Capelj and Physik Invest manage their own capital and will not solicit others for it.

Categories
Commentary

Daily Brief For March 20, 2023

Physik Invest’s Daily Brief is read free by thousands of subscribers. Join this community to learn about the fundamental and technical drivers of markets.

Graphic updated 8:10 AM ET. Sentiment Neutral if expected /MES open is inside of the prior day’s range. /MES levels are derived from the profile graphic at the bottom of this letter. Click here for the latest levels. SqueezeMetrics Dark Pool Index (DIX) and Gamma (GEX) with the latter calculated based on where the prior day’s reading falls with respect to the MAX and MIN of all occurrences available. A higher DIX is bullish. The lower the GEX, the more (expected) volatility. Click to learn the implications of volatility, direction, and moneyness. Breadth reflects a reading of the prior day’s NYSE Advance/Decline indicator. The CBOE VIX Volatility Index (INDEX: VVIX) reflects the attractiveness of owning volatility. UMBS prices via MNDClick here for the economic calendar.

Fundamental

As well summarized by Eric Basmajian, inflation, and growth are on a downward trajectory. Most leading indicators “suggest recessionary pressure will be ongoing.” The banking crisis and response, which will ultimately “cause a tightening of lending to the private economy,” likely exacerbates the ongoing recessionary pressures.

Breaking: UBS To Buy Credit Suisse In $3.3 Billion Deal

Most strategists including the Damped Spring’s Andy Constan agree. In a recent video, Constan detailed the implications of policymakers’ intervention. In short, an asset fire sale was turned into a managed sale, and a reduction in credit creation will tighten financial conditions, slowing the economy and inflation.

“Small banks that are facing deposit outflows will see earnings and margins collapse as their cost of funds surges from 1% or 2% on deposits to 4% or 5% at the Fed funding facility,” Basmajian summarizes, noting that the increase in the Federal Reserve (Fed) balance sheet came from the discount window, new bank funding facilities, and spillover from the FDIC insurance backstop, all of which are not to be confused with quantitative easing or QE (i.e., monetary stimulus and a flow of capital into capital markets). 

Graphic: Retrieved from Bank of American Corporation (NYSE: BAC) via The Market Ear.

“As deposits leave regional and smaller banks for more yield and safety, they will flow into bigger banks that do less lending or into money market funds that don’t drive credit creation.” Consequently, there will be “a significant tightening of lending standards, and a credit crunch on the private economy as regional and smaller banks face massive funding pressure.”

Graphic: Retrieved from Morgan Stanley (NYSE: MS) via The Market Ear. “MS models show that a permanent +10pt tightening in lending standards for C&I loans leads to a 35bps rise in the unemployment rate over the next two years. Historically, recessions have arrived more than half a year after jobless claims begin a sustained rise.”

Traders are conflicted about the Fed’s coming interest rate decision. Many were expecting a couple more hikes of at least 25 basis points in size. However, following the recent bank turmoil in the US and abroad, it appears that traders think it will be one additional 25 basis point hike before rate cuts ensue in mid-2023.

Graphic: Retrieved from CME Group Inc’s (NASDAQ: CME) FedWatch Tool.

Historically, selling markets on the last Fed rate hike is a good strategy, Bank of America found.

Graphic: Retrieved from Bank of American Corporation (NYSE: BAC) via The Market Ear.

Positioning

Top-line measures of implied volatility or IVOL including the Cboe Volatility Index or VIX are higher heading into Monday’s trade.

Macro uncertainties have some frightened, hence “equity volatility present[ing] itself in a much stronger way,” said The Ambrus Group’s Kris Sidial. For this equity volatility (i.e., implied volatility or IVOL) to continue performing well, realized volatility or RVOL (i.e., the movement that actually happens and is not implied by traders’ supply and demand of options) must shift and stay higher as well (note: in many ways RVOL and IVOL reinforce the other during extreme greed or fear events.

Though big options expiries (OpEx) “may help unpin the market” and manifest market downside and follow-through in RVOL needed to keep IVOL performing, the window for this to happen may be closing.

The monetization of profitable options structures, as well as volatility compression and options decay, may result in counterparties buying back their short stock and/or futures hedges (to the short put positions they have on), thus boosting the market (particularly the depressed and rate-sensitive Nasdaq 100).

If the market rallies, that has the potential to “make things hotter” in the economy, explained Kai Volatility’s Cem Karsan, which emboldens policymakers to make and keep policy tighter. So, barring follow-through to the downside, any equity market upside that arises is likely limited, as a disclaimer, some think.

Apologies for rushing this section, today. More on positioning in the coming letters.

Technical

As of 8:10 AM ET, Monday’s regular session (9:30 AM – 4:00 PM ET), in the S&P 500, is likely to open in the middle part of a negatively skewed overnight inventory, inside of the prior day’s range, suggesting a limited potential for immediate directional opportunity.

The S&P 500 pivot for today is $3,946.75. 

Key levels to the upside include $3,970.75, $3,994.25, and $4,026.75.

Key levels to the downside include $3,912.25, $3,891.00, and $3,868.25.

Disclaimer: Click here to load the updated key levels via the web-based TradingView platform. New links are produced daily. Quoted levels likely hold barring an exogenous development.

Graphic: 65-minute profile chart of the Micro E-mini S&P 500 (FUTURE: /MES) bottom-middle.

Definitions

Volume Areas: Markets will build on areas of high-volume (HVNodes). Should the market trend for a period of time, this will be identified by a low-volume area (LVNodes). The LVNodes denote directional conviction and ought to offer support on any test.

If participants auction and find acceptance in an area of a prior LVNode, then future discovery ought to be volatile and quick as participants look to the nearest HVNodes for more favorable entry or exit.

POCs: Areas where two-sided trade was most prevalent in a prior day session. Participants will respond to future tests of value as they offer favorable entry and exit.


About

The author, Renato Leonard Capelj, spends the bulk of his time at Physik Invest, an entity through which he invests and publishes free daily analyses to thousands of subscribers. The analyses offer him and his subscribers a way to stay on the right side of the market. 

Separately, Capelj is an accredited journalist with past works including interviews with investor Kevin O’Leary, ARK Invest’s Catherine Wood, FTX’s Sam Bankman-Fried, North Dakota Governor Doug Burgum, Lithuania’s Minister of Economy and Innovation Aušrinė Armonaitė, former Cisco chairman and CEO John Chambers, and persons at the Clinton Global Initiative.

Connect

Direct queries to renato@physikinvest.com. Find Physik Invest on TwitterLinkedInFacebook, and Instagram. Find Capelj on TwitterLinkedIn, and Instagram. Only follow the verified profiles.

Calendar

You may view this letter’s content calendar at this link.

Disclaimer

Do not construe this newsletter as advice. All content is for informational purposes. Capelj and Physik Invest manage their own capital and will not solicit others for it.

Categories
Commentary

Daily Brief For July 5, 2022

The daily brief is a free glimpse into the prevailing fundamental and technical drivers of U.S. equity market products. Join the 300+ that read this report daily, below!

Graphic updated 6:30 AM ET. Sentiment Neutral if expected /ES open is inside of the prior day’s range. /ES levels are derived from the profile graphic at the bottom of the following section. Levels may have changed since initially quoted; click here for the latest levels. SqueezeMetrics Dark Pool Index (DIX) and Gamma (GEX) calculations are based on where the prior day’s reading falls with respect to the MAX and MIN of all occurrences available. A higher DIX is bullish. At the same time, the lower the GEX, the more (expected) volatility. Learn the implications of volatility, direction, and moneyness. SHIFT data used for S&P 500 (INDEX: SPX) options activity. Note that options flow is sorted by the call premium spent; if more positive, then more was spent on call options. Breadth reflects a reading of the prior day’s NYSE Advance/Decline indicator. VIX reflects a current reading of the CBOE Volatility Index (INDEX: VIX) from 0-100.

What To Expect

Fundamental: In the headlines were the chip boom’s loss of steam, the Bank of England’s consideration of 50-year mortgages, the potential collapse or rise in oil by year-end, NATO’s resumption of expansion processes, slowing car sales, China tariffs reduction, Germany’s first monthly trade deficit since 1991 on inflation, and more.

Graphic: Via Bloomberg.

Key in last week’s narratives was U.S. manufacturing’s decline as new orders were below that of inventories.

Bloomberg’s John Authers explains that “[t]he signal grows even more discomforting if the new orders number is below the recessionary cutoff at 50.”

Graphic: Via Eric Basmajian. “Given that the ISM Manufacturing PMI holds a very strong correlation to earnings estimates, credit spreads, and more, the probability that we see further declines should be a warning sign that more turbulence is ahead in cyclical risk assets.”

“​​If the new story of imminent slowdown and a limited monetary tightening campaign turns out to be true, then the narrative on earnings will have to change. That positivity about earnings is what is keeping stocks from selling off far more,” Authers adds.

“The next couple of weeks will bring critical macro data on inflation and employment; but immediately after that, the earnings numbers will start to flow. It might not be pretty.”

Graphic: Via Charles Schwab Corporation-owned (NYSE: SCHW) TD Ameritrade’s Thinkorswim. The Eurodollar (FUTURE: /GE) futures curve is a reflection of participants’ outlook on interest rates. The peak of the Fed-rate-hike cycle – terminal rate – is around DEC 2022.

Positioning: Data on net gamma exposures points to more volatile ranges. 

Given the relationship between realized (RVOL) and implied (IVOL) volatility, as well as naive metrics for skew, it makes sense to not be a seller of volatility, especially in options that are short-dated and farther out.

Graphic: Via Pat Hennessy. “Tomorrow’s SPX expo (Jul1) is wildin… 26 vol for any strike with a 37 or 38 handle with a ridiculous curvature in the tails. God speed to all the 1dte theta gang. Selling OTM puts/calls for the same vol as ATM seems… umm… not good.”

Moreover, participants’ combined view is that markets are likely to head lower, via Deutsche Bank AG (NYSE: DB).

Graphic: Via Deutsche Bank AG (NYSE: DB). Taken from The Market Ear.

However, as we discussed in sessions prior, their demand for exposure to the upside resulted in “a flattening in the downside strike skew, while the upside wings have become more smiley.”

Graphic: Via JPMorgan Chase & Co (NYSE: JPM). Taken from The Market Ear.

A “higher starting point” in implied volatility (IVOL), and a still-present right-tail (from the positioning for a bear market rally), make it so we may position, for less cost, in short-dated structures with asymmetric payouts, on both sides of the market.

Read: For more on how to play, read the Daily Brief for June 30, 2022.

Technical: As of 6:30 AM ET, Tuesday’s regular session (9:30 AM – 4:00 PM ET), in the S&P 500, is likely to open in the middle part of a balanced overnight inventory, inside of prior-range and -value, suggesting a limited potential for immediate directional opportunity.

In the best case, the S&P 500 trades higher.

Any activity above the $3,821.50 LVNode puts into play the $3,857.25 ONH. Initiative trade beyond the ONH could reach as high as the $3,883.25 LVNode and $3,909.25 MCPOC, or higher.

In the worst case, the S&P 500 trades lower.

Any activity below the $3,821.50 LVNode puts into play the $3,793.75 HVNode. Initiative trade beyond the HVNode could reach as low as the $3,777.00 VPOC and $3,727.75 HVNode, or lower.

Click here to load today’s key levels into the web-based TradingView charting platform. Note that all levels are derived using the 65-minute timeframe. New links are produced, daily.
Graphic: 65-minute profile chart of the Micro E-mini S&P 500 Futures.

Definitions

Overnight Rally Highs (Lows): Typically, there is a low historical probability associated with overnight rally-highs (lows) ending the upside (downside) discovery process.

Volume Areas: A structurally sound market will build on areas of high volume (HVNodes). Should the market trend for long periods of time, it will lack sound structure, identified as low volume areas (LVNodes). LVNodes denote directional conviction and ought to offer support on any test. 

If participants were to auction and find acceptance into areas of prior low volume (LVNodes), then future discovery ought to be volatile and quick as participants look to HVNodes for favorable entry or exit.

POCs: POCs are valuable as they denote areas where two-sided trade was most prevalent in a prior day session. Participants will respond to future tests of value as they offer favorable entry and exit.

About

After years of self-education, strategy development, mentorship, and trial-and-error, Renato Leonard Capelj began trading full-time and founded Physik Invest to detail his methods, research, and performance in the markets.

Capelj also develops insights around impactful options market dynamics at SpotGamma and is a Benzinga reporter.

Some of his works include conversations with ARK Invest’s Catherine Wood, investors Kevin O’Leary and John Chambers, FTX’s Sam Bankman-Fried, former Bridgewater Associate Andy Constan, Kai Volatility’s Cem Karsan, The Ambrus Group’s Kris Sidial, among many others.

Disclaimer

In no way should the materials herein be construed as advice. Derivatives carry a substantial risk of loss. All content is for informational purposes only.