Bloomberg reports that if the US defaults on its debt, which could happen as soon as June 1 if President Biden and House Speaker McCarthy fail to reach a deal on raising the ceiling, homebuyer borrowing costs may surge to 8.40%. As a consequence, the typical home’s monthly payment would increase by 22.00% and cool property sales; the monthly payment on a $500,000.00 mortgage may rise to $3,800.00, compared to about $3,095.00 at the current rate of 6.30%.
In prior letters, we concluded that past monetary action made stocks less sensitive to interest rates, quoting JPMorgan Chase & Co (NYSE: JPM) strategists that the market would likely continue to “artificially suppress perceptions of fundamental macro risks,” barring surprises like a debt limit breach.
With a debt limit breach a potential reality, Moody’s Corporation (NYSE: MCO) says a breach may compound recessionary pressures; expect a drop in equities, a volatility spike, and a disruption of funding markets.
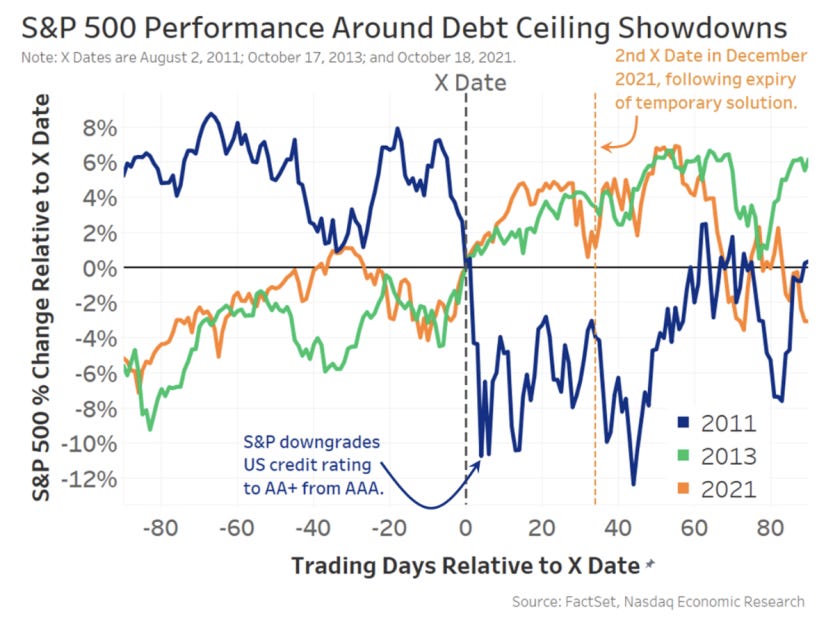
Graphic: Retrieved from Nasdaq Inc (NASDAQ: NDAQ).
“Data show that short-term bonds have the most predictable reaction – with interest rates and default insurance costs rising significantly – before quickly returning to normal after the uncertainty has passed,” Nasdaq’s Phil Mackintosh writes. “In reality, a crisis was averted in all [prior] cases, with the government able to increase or suspend the debt limit before the X Date.”
Notwithstanding the short-term uncertainty regarding the debt limit, Bank of America Corporation (NYSE: BAC) is adamant there will be a recession that manifests cracks in “credit and tech,” similar to the situation in 2008. BAC sees the bubble in technology, media, and telecommunication stocks soon deflating as they face higher-for-longer interest rates and a tempered earnings outlook.
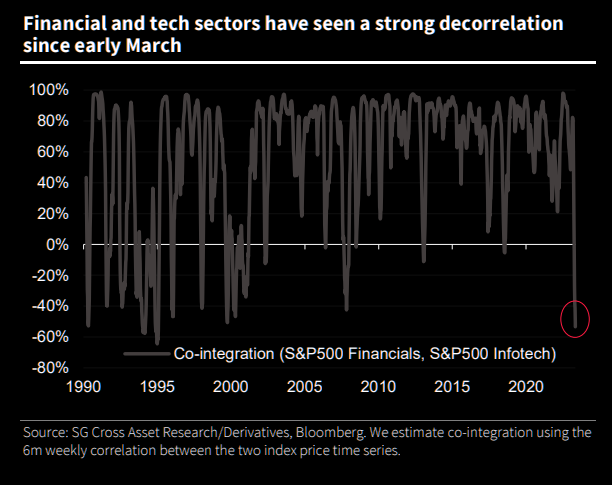
Graphic: Retrieved from Societe Generale SA (OTC: SCGLY) via The Market Ear.While investors poured $3.8 billion into technology stocks in the week through May 10, $2.1 billion was pulled from financial equities, the most significant redemption since May 2022.
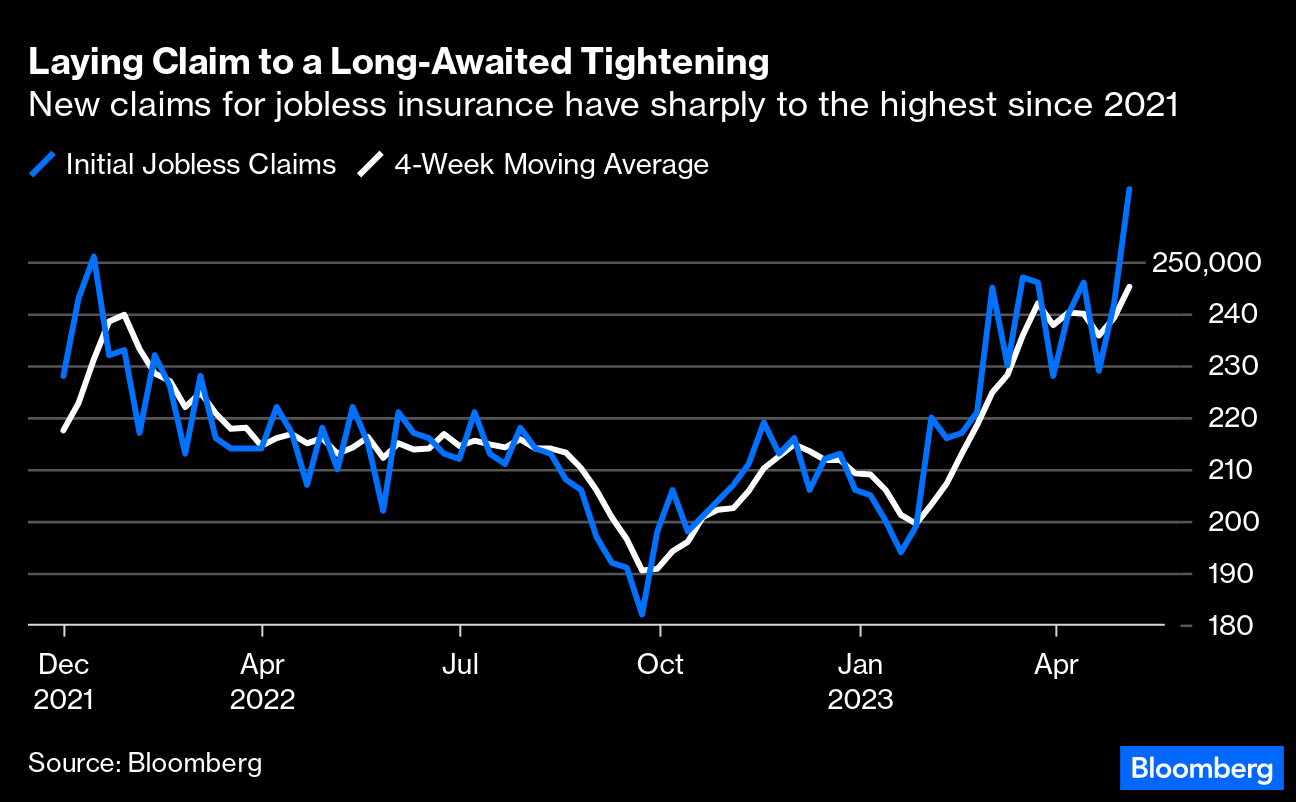
Compounding the recessionary pressures BAC sees, EPB Research adds, are banks’ funding costs, which have increased too much relative to prevailing asset yields. If the spread drops too low, bank lending tightens, and a recession occurs. Also, other data suggests tightening is finally starting to have an impact. Bloomberg reports that initial claims for unemployment insurance are on the rise. There has been a drop in overall wage growth to 5.1% last month, too, the biggest fall in the rate of increase since the series began.
Separately, breadth divergences are becoming more frequent, with the Daily Advance-Decline (A-D) Line for the NYSE showing lower highs while DJIA and S&P 500 show slightly higher highs, McClellan Financial Publications writes. The bond CEF A-D Line is also showing a bearish divergence, indicating a shift in liquidity that could weigh on other stocks, including the big-cap stocks holding up the SP500 and the Nasdaq 100.
Graphic: Retrieved from McClellan Financial Publications.
McClellan adds that the A-D Line originated from data collected by Leonard Ayres and James Hughes in the 1920s. It was made famous in 1962.
Graphic: Retrieved from McClellan Financial Publications.
That’s when Joe Granville and Richard Russell commented on it in their newsletters, noting how it had shown a big bearish divergence ahead of the 1962 bear market.
Graphic: Retrieved from McClellan Financial Publications.
To end, the economic calendar next week is focused on manufacturing and housing. The housing market is showing some downside risk for existing-home sales for April due to a weak reading on pending sales, MCO says, adding that housing permits and starts are expected to move sideways as builders remain cautious amid high-interest rates and economic uncertainty. Regional Fed surveys in New York and Philadelphia will provide the first read on factory activity for May, with little hope for a significant rebound in manufacturing. Jobless claims will be critical, as continuing the recent trend would likely signal a rapid deceleration in monthly job gains. Other critical data to be released include retail sales, industrial production, and business inventories.
Should readers wish to hedge the debt ceiling debacle, June call options on the Cboe Volatility Index appear attractive, some suggest. But, with RVOL as low as it is, owning optionality is not generally warranted. The risk is lower lows in volatility.
Welcome to the Daily Brief by Physik Invest, a soon-to-launch research, consulting, trading, and asset management solutions provider. Learn about our origin story here, and consider subscribing for daily updates on the critical contexts that could lend to future market movement.
Separately, please don’t use this free letter as advice; all content is for informational purposes, and derivatives carry a substantial risk of loss. At this time, Capelj and Physik Invest, non-professional advisors, will never solicit others for capital or collect fees and disbursements. Separately, you may view this letter’s content calendar at this link.
Editor’s Note: The Daily Brief is a free glimpse into the prevailing fundamental and technical drivers of U.S. equity market products. Join the 200+ that read this report daily, below!
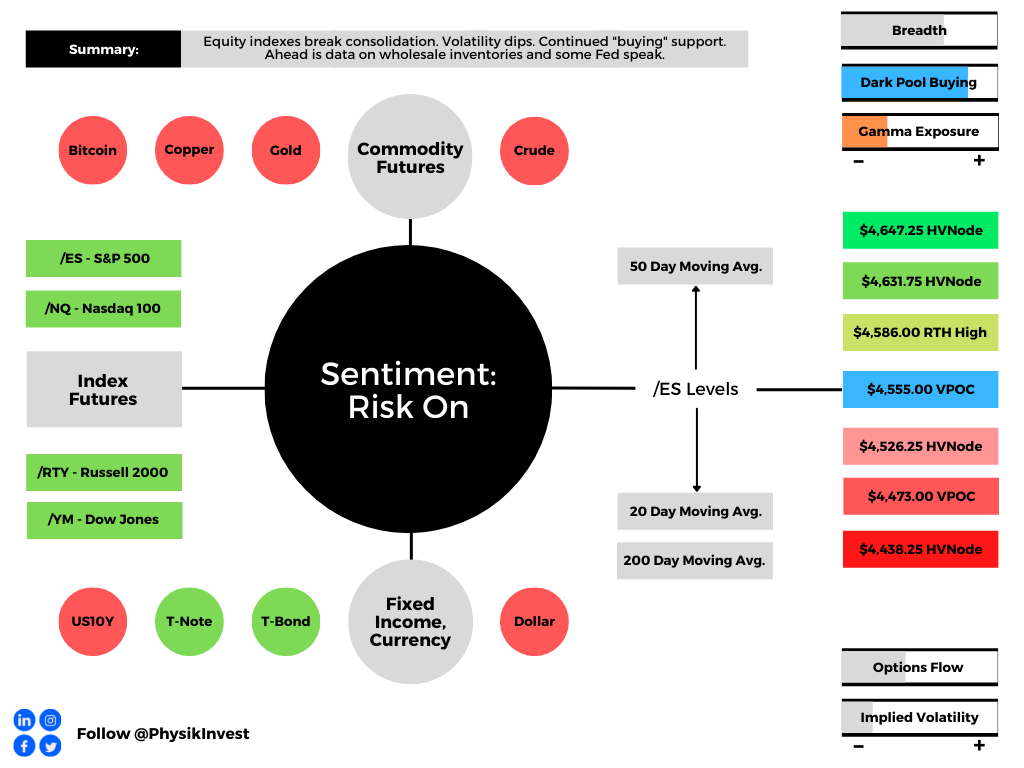
Overnight, equity index futures broke the confines of tight consolidation.
As stated some commentaries ago, the odds pointed to a continued counter-trend rally; volatility compression, coupled with metrics that point to buying support, was to bolster follow-through.
Ahead is data on Wholesale Inventories (10:00 AM ET), as well as Fed-speak by Governor Michelle Bowman (10:30 AM ET) and President Loretta Mester (12:00 PM ET).
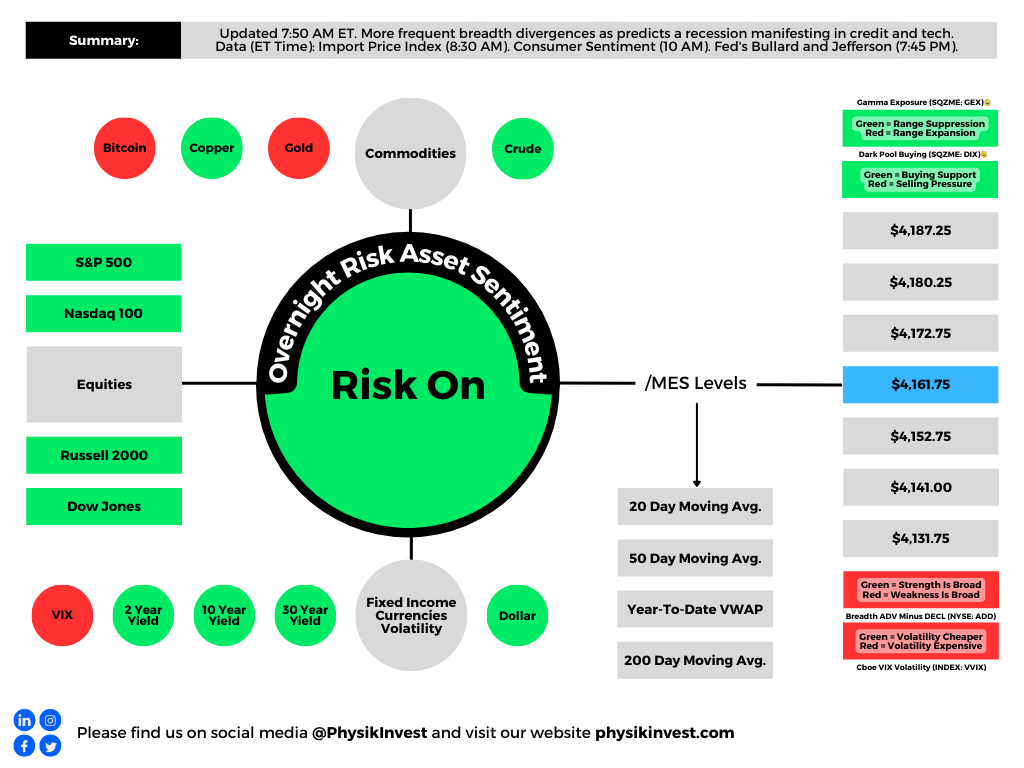
Graphic updated 6:30 AM ET. Sentiment Risk-On if expected /ES open is above the prior day’s range. /ES levels are derived from the profile graphic at the bottom of the following section. Levels may have changed since initially quoted; click here for the latest levels. SqueezeMetrics Dark Pool Index (DIX) and Gamma (GEX) calculations are based on where the prior day’s reading falls with respect to the MAX and MIN of all occurrences available. A higher DIX is bullish. At the same time, the lower the GEX, the more (expected) volatility. Learn the implications of volatility, direction, and moneyness. SHIFT data used for S&P 500 (INDEX: SPX) options activity. Note that options flow is sorted by the call premium spent; if more positive, then more was spent on call options. Breadth reflects a reading of the prior day’s NYSE Advance/Decline indicator. VIX reflects a current reading of the CBOE Volatility Index (INDEX: VIX) from 0-100.
What To Expect
Fundamental: Equity indices resolve higher in the face of hawkishness from the Federal Reserve (Fed) and data showing slowing growth at home and abroad.
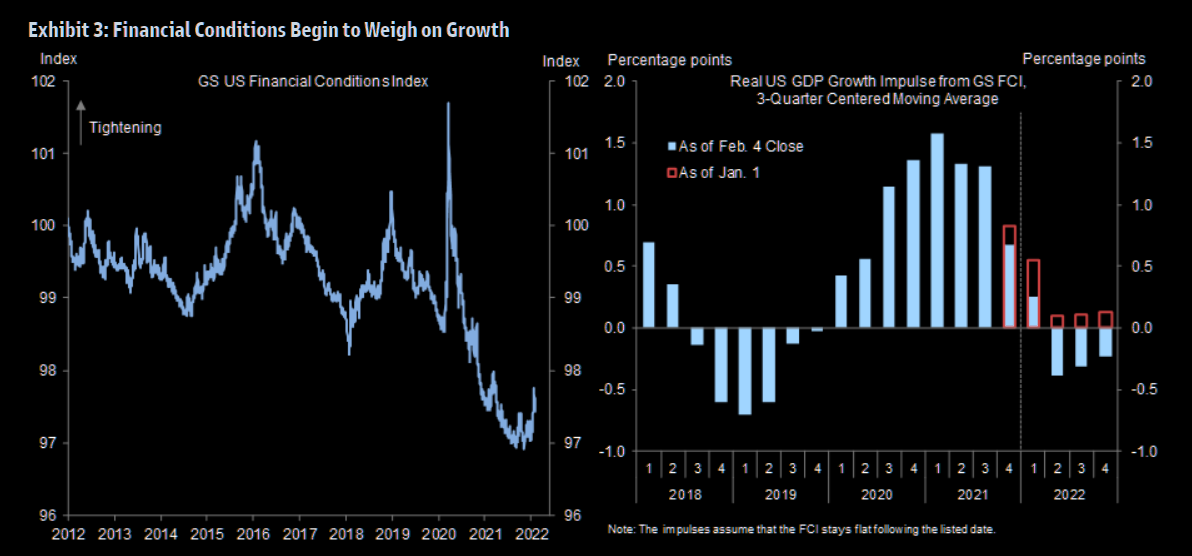
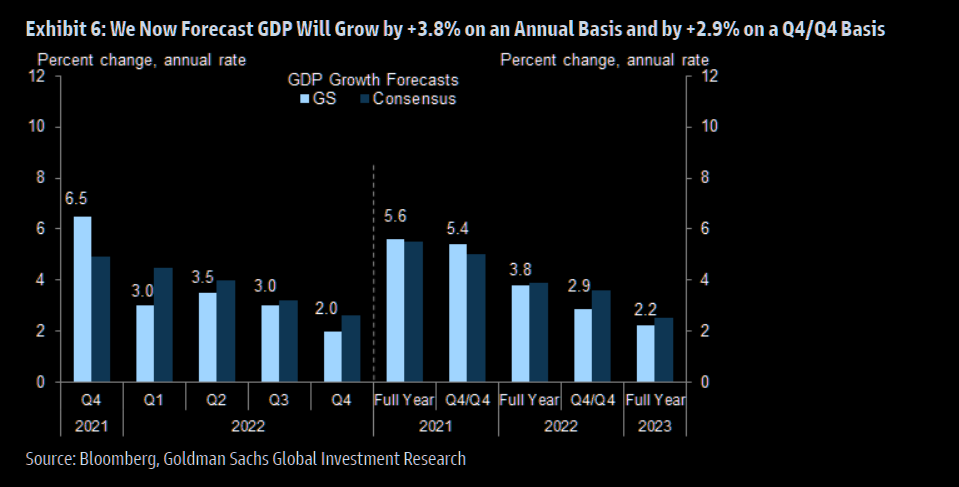
“Fiscal policy is turning more restrictive, the Q4 inventory boost is now behind us, and the financial conditions impulse will go from sharply positive in 2021 to (at least) modestly negative in 2022,” Goldman Sachs Group Inc (NYSE: GS) strategists explain.
“For these reasons, our 2022 GDP forecast of 2¼% on a Q4/Q4 basis is 0.8pp below the latest Bloomberg consensus and 1.8pp below the FOMC’s last published forecast (as of the December meeting).”
Graphic: Via Goldman Sachs. Retrieved through The Market Ear.
At the same time, according to Moody’s Corporation (NYSE: MCO), the Fed has not pushed “against market expectations for three to four rate hikes this year.”
Instead, Chair Jerome Powell “signaled the central bank will have zero tolerance for any upside surprises in inflation.”
To note, though, the consensus expectation – five rate hikes or more – is ahead of itself, according to Andreas Steno Larsen of Heimstaden.
“Direct transfers and fiscal deficits are behind the current inflation spikes,” he explains. “If they were the root causes of inflation, they will also turn into the root causes of disinflation again during H2-2022.”
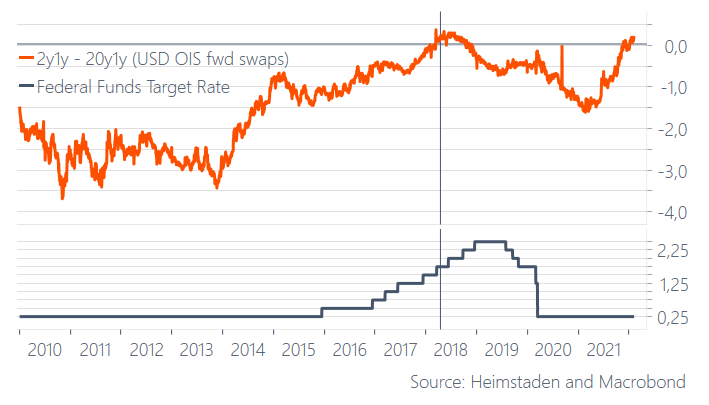
Steno Larsen adds that the 20y1y and 2y1y curve is inverted, “as it was when the 2015-2018 hiking cycle was very mature,” and only three hikes occurred after inversion.
Graphic: “Good luck hiking 6-7 times this year, … 3-4 max,” via Steno Larsen.
The net effect, according to Steno Larsen, is that long bond yields will likely not rise over the next quarters; rate-sensitive technology and innovation products may rebound while cyclical assets may suffer.
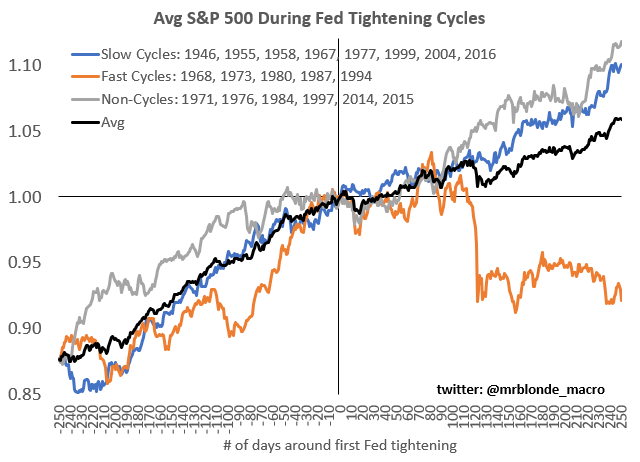
In line with the above comments is the average S&P 500 trend into Fed tightening cycles.
Graphic: Retrieved from Callum Thomas’ Weekly S&P 500 ChartStorm newsletter.
Positioning: Ranges compressed as participants committed capital to bets on lower volatility.
Such bets (expressed via the selling of protection on both sides of the market) left counterparties warehousing the other side (long puts and calls).
In hedging this exposure on a move higher, the counterparties increased +delta exposure is offset via the addition in -delta (sell futures).
In hedging this exposure on a move lower, the counterparties increased -delta exposure is offset via the addition of +delta (buy futures).
Huge record "retail" put buying? Sort of.
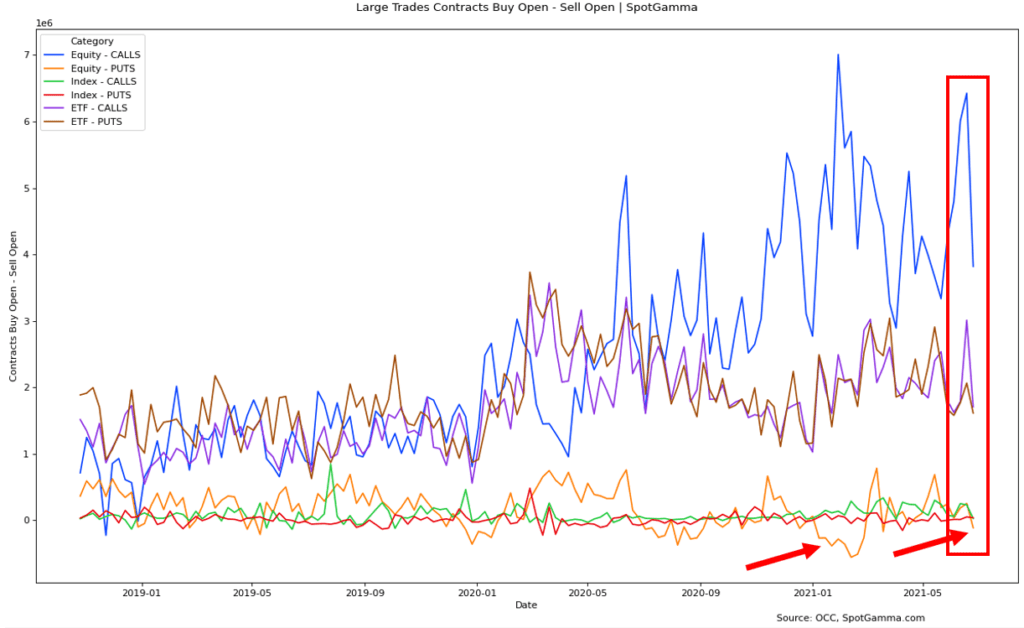
Net put buying vs selling you get a different picture (orange)
Last week was the most net put buying since Mar '20 – but as you can see retail tends to be put sellers
Moreover, as (1) participants continue to bet on lower ranges and (2) time and volatility trend to zero for the expiries most open interest is concentrated in, gamma, the sensitivity of options to changes in underlying price (delta) increases.
What that means is that counterparties’ near-the-money exposure to options delta rises and portends increased liquidity (e.g., the counterparty will buy futures into weakness and sell futures into strength).
Given a lower liquidity environment, these hedging flows therefore have a bigger impact.
Graphic: Via SpotGamma, “gamma flows increasingly important in a lower liquidity environment. If the counterparty is taking on more exposure to positive gamma, then their addition of liquidity to hedge may suppress ranges.”
The resolve of this consolidation, coupled with decaying out-of-the-money protection and supportive hedging flows with respect to time (charm) and volatility (vanna), and buying proxies, point to “[m]odest bullishness on the 1-month timeframe.”
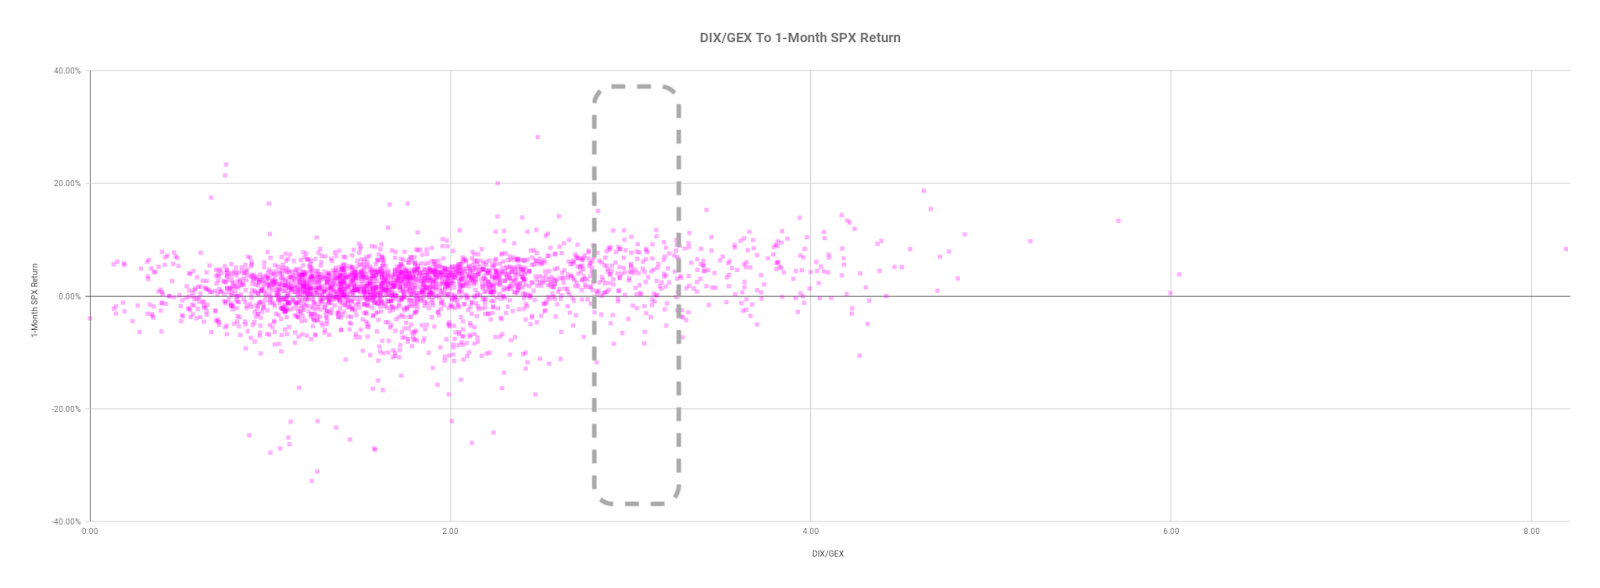
Graphic: Data via SqueezeMetrics. Graph via Physik Invest.
Technical: As of 6:30 AM ET, Wednesday’s regular session (9:30 AM – 4:00 PM ET), in the S&P 500, will likely open in the upper part of a positively skewed overnight inventory, outside of prior-range and -value, suggesting a potential for immediate directional opportunity.
Balance-Break + Gap Scenarios: A change in the market (i.e., the transition from two-time frame trade, or balance, to one-time frame trade, or trend) is occurring.

Monitor for acceptance (i.e., more than 1-hour of trade) outside of the balance area.

Leaving value behind on a gap-fill or failing to fill a gap (i.e., remaining outside of the prior session’s range) is a go-with indicator.

Rejection (i.e., return inside of balance) portends a move to the opposite end of the balance.
In the best case, the S&P 500 trades higher; activity above the $4,555.00 untested point of control (VPOC) puts in play the $4,586.00 regular trade high (RTH High). Initiative trade beyond the RTH High could reach as high as the $4,631.75 and $4,647.25 HVNode, or higher.
In the worst case, the S&P 500 trades lower; activity below the $4,555.00 VPOC puts in play the $4,526.25 HVNode. Initiative trade beyond the $4,526.25 HVNode could reach as low as the $4,473.00 VPOC and $4,438.25 HVNode, or lower.
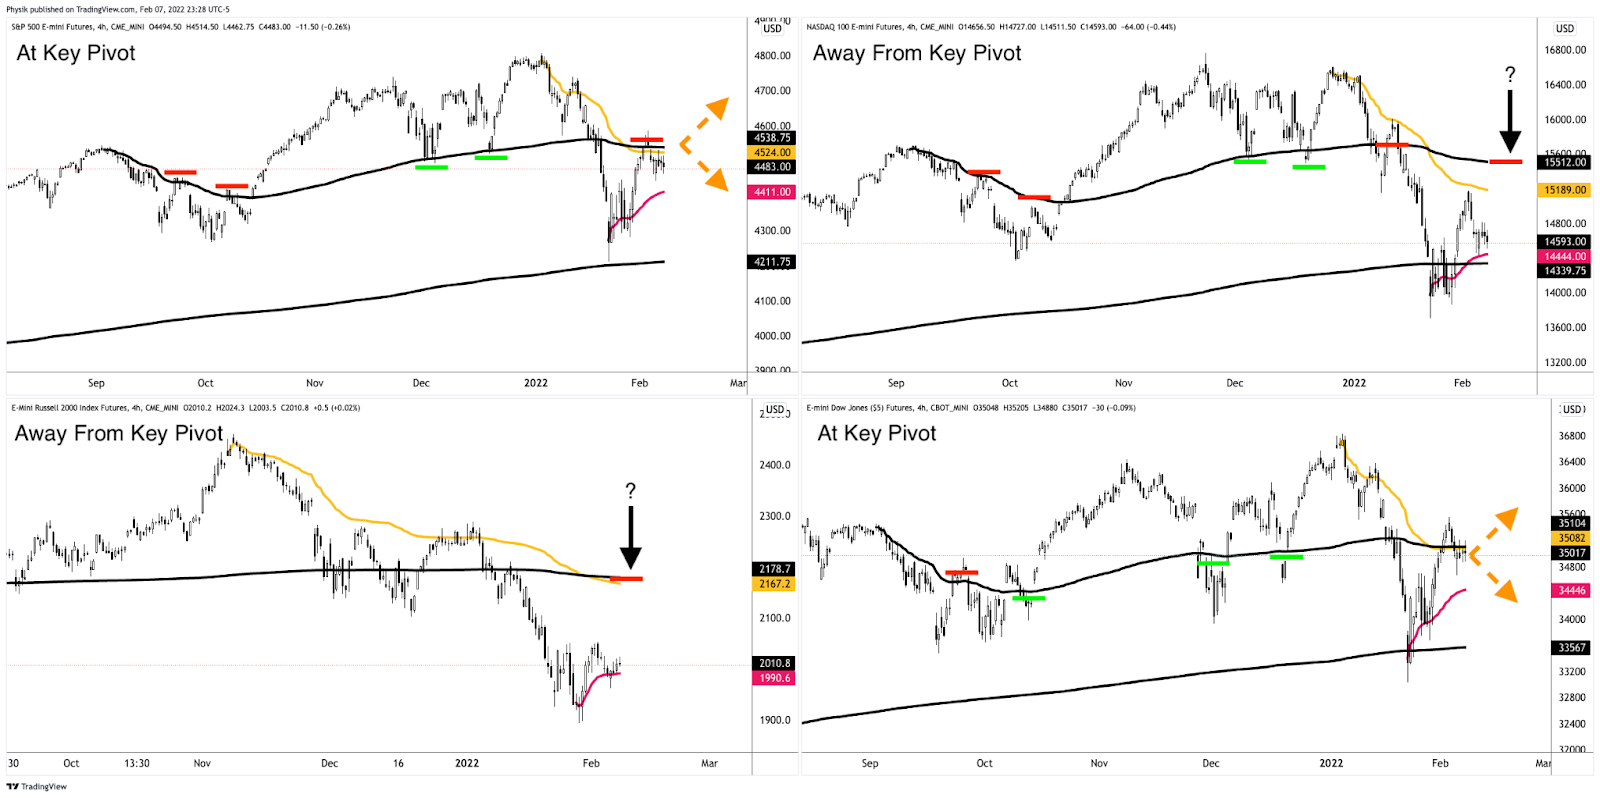
Consideration: All equity index products have resolved tight consolidation’s higher. The Nasdaq 100 and Russell 2000 are the furthest away from clear areas of resistance.
On the other hand, the S&P 500 and Dow Jones Industrial Average have little in the way of higher prices.
Graphic: Updated 2/8/2022. Anchored Volume Weighted Average Price (VWAP) analysis via Physik Invest. Notice Dow Jones Industrial Average (bottom right) and S&P 500 (top left) strength, as well as Nasdaq 100 (top right) and Russell 2000 (bottom left) weakness. Key pivots marked off.
Click here to load today’s key levels into the web-based TradingView charting platform. Note that all levels are derived using the 65-minute timeframe. New links are produced, daily.
Graphic: 65-minute profile chart of the Micro E-mini S&P 500 Futures.
What People Are Saying
(Not investment advice)
Over the course of the last few weeks you guys have probably noticed my bullish tone. (As I have said before, beware of the vol guys that are always crying that the sky is falling….they are just trying to pitch their own product)
Volume Areas: A structurally sound market will build on areas of high volume (HVNodes). Should the market trend for long periods of time, it will lack sound structure, identified as low volume areas (LVNodes). LVNodes denote directional conviction and ought to offer support on any test.
If participants were to auction and find acceptance into areas of prior low volume (LVNodes), then future discovery ought to be volatile and quick as participants look to HVNodes for favorable entry or exit.
POCs: POCs are valuable as they denote areas where two-sided trade was most prevalent in a prior day session. Participants will respond to future tests of value as they offer favorable entry and exit.
About
After years of self-education, strategy development, mentorship, and trial-and-error, Renato Leonard Capelj began trading full-time and founded Physik Invest to detail his methods, research, and performance in the markets.
Capelj is also a Benzinga finance and technology reporter interviewing the likes of Shark Tank’s Kevin O’Leary, JC2 Ventures’ John Chambers, FTX’s Sam Bankman-Fried, and ARK Invest’s Catherine Wood, as well as a SpotGamma contributor developing insights around impactful options market dynamics.
Disclaimer
Physik Invest does not carry the right to provide advice.
In no way should the materials herein be construed as advice. Derivatives carry a substantial risk of loss. All content is for informational purposes only.
Editor’s Note: The Daily Brief is a free glimpse into the prevailing fundamental and technical drivers of U.S. equity market products. Join the 200+ that read this report daily, below!
Overnight, equity index futures were divergent and weighed by the tech- and growth-heavy Nasdaq 100. Most commodity and bond products were much weaker, also.
This stocks down, bonds down dynamic points to a continued deleveraging.
Notwithstanding, sideways after a fast move lower, is not a bad thing. It’s one of the better cases to have given certain mechanics with respect to the options market, for instance.
Ahead is data on international trade (8:30 AM ET) and real household debt (11:00 AM ET).
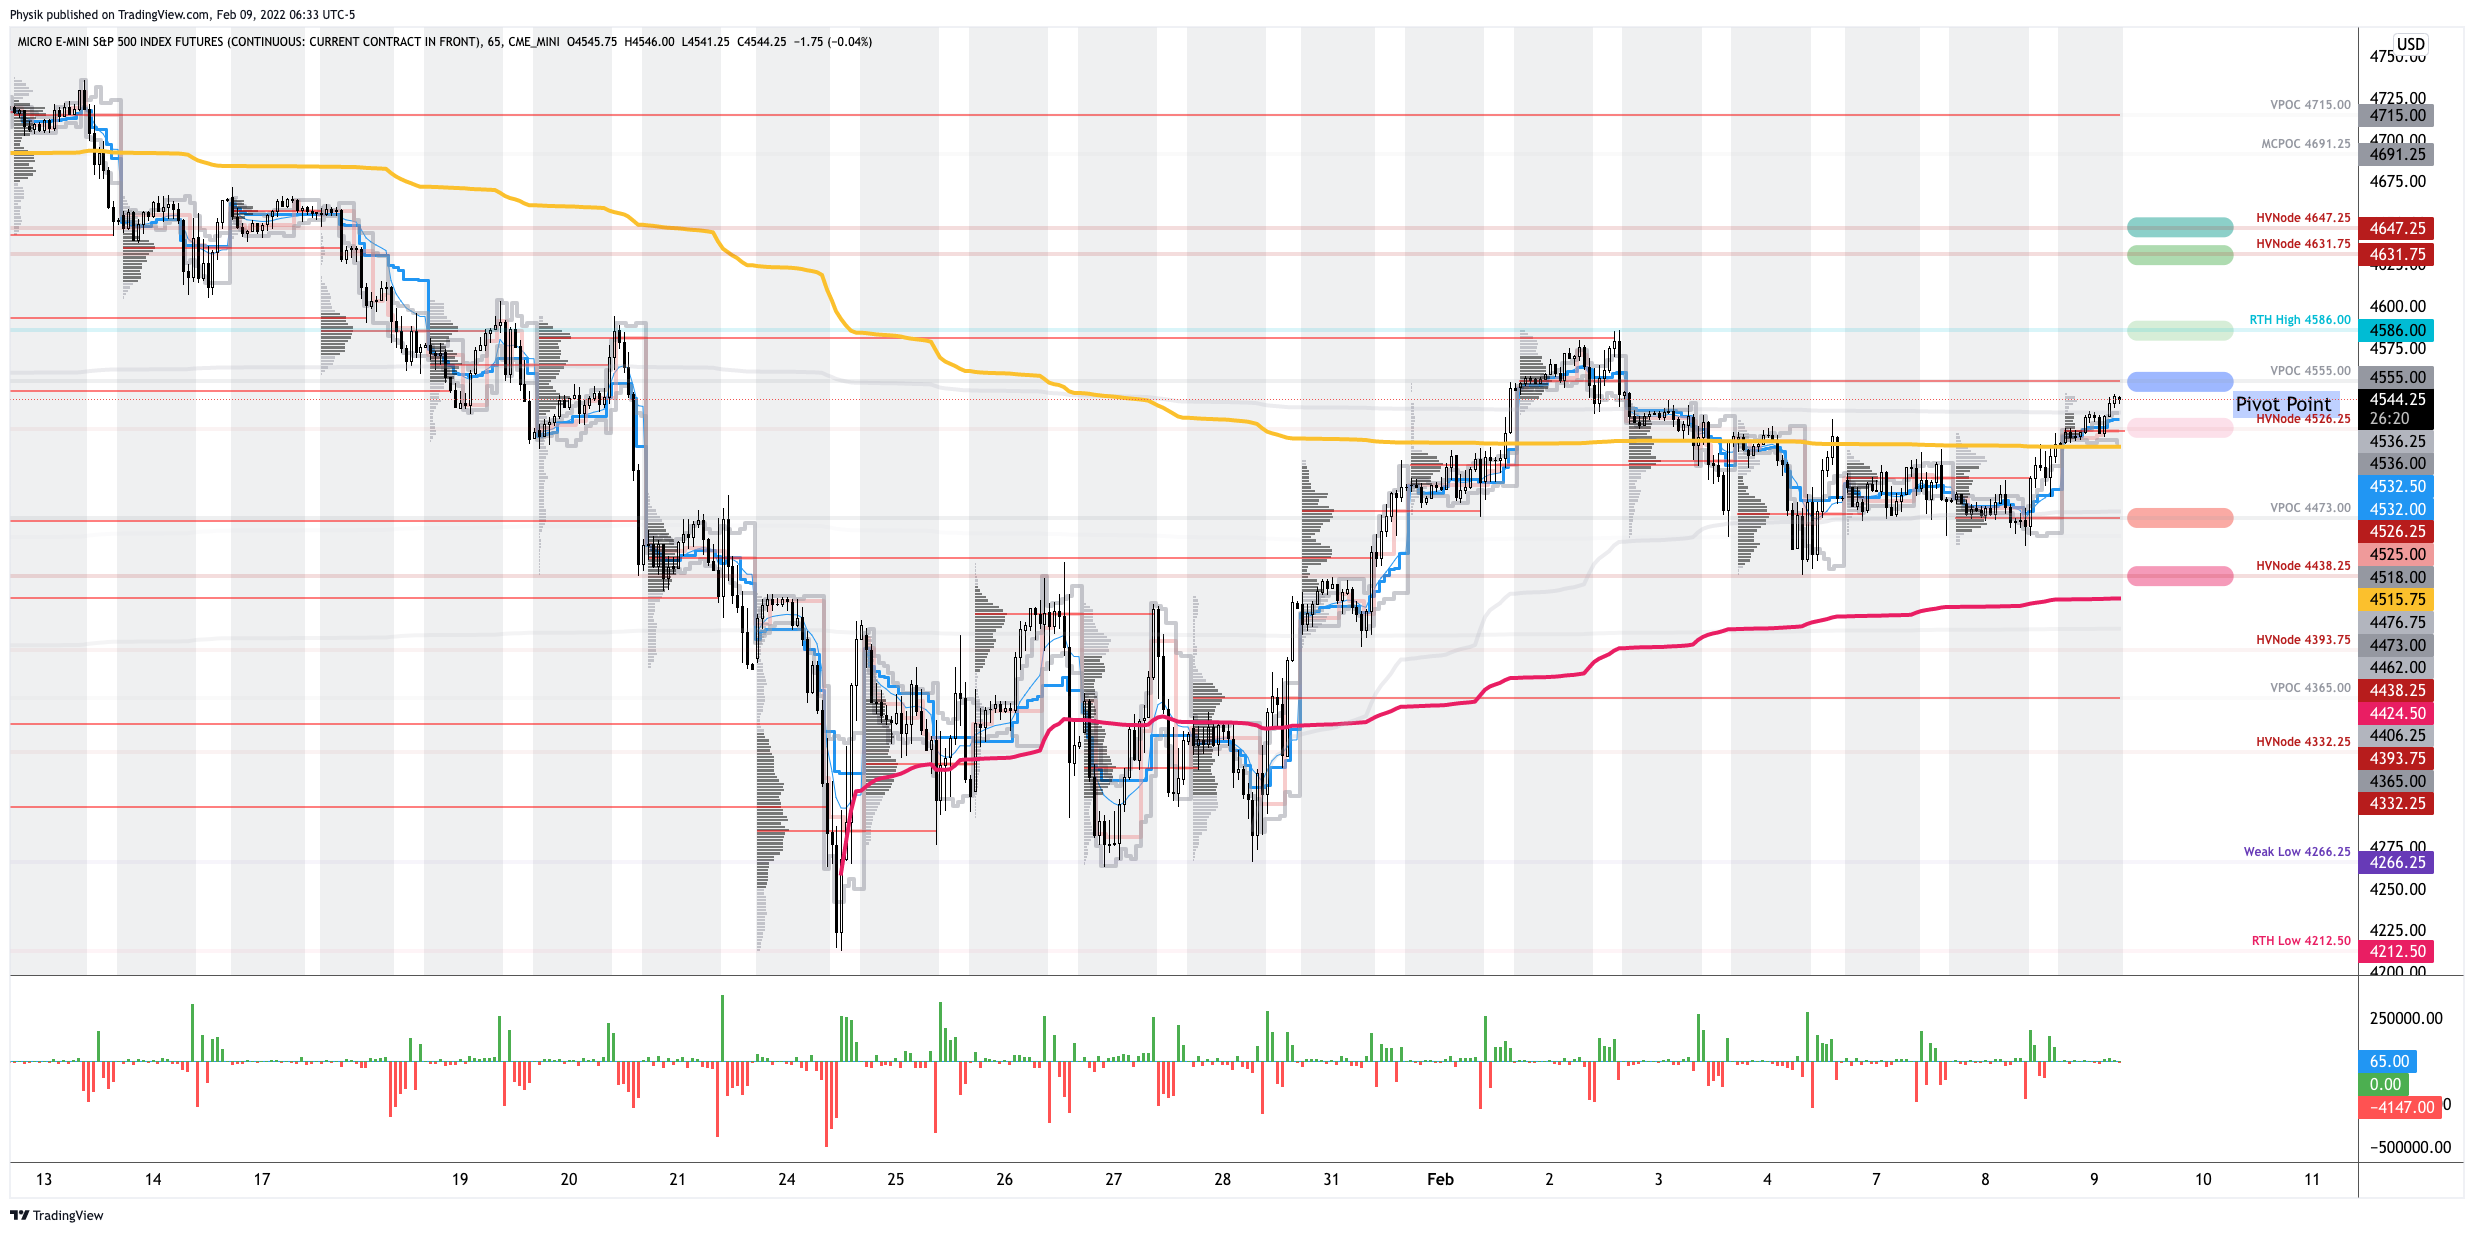
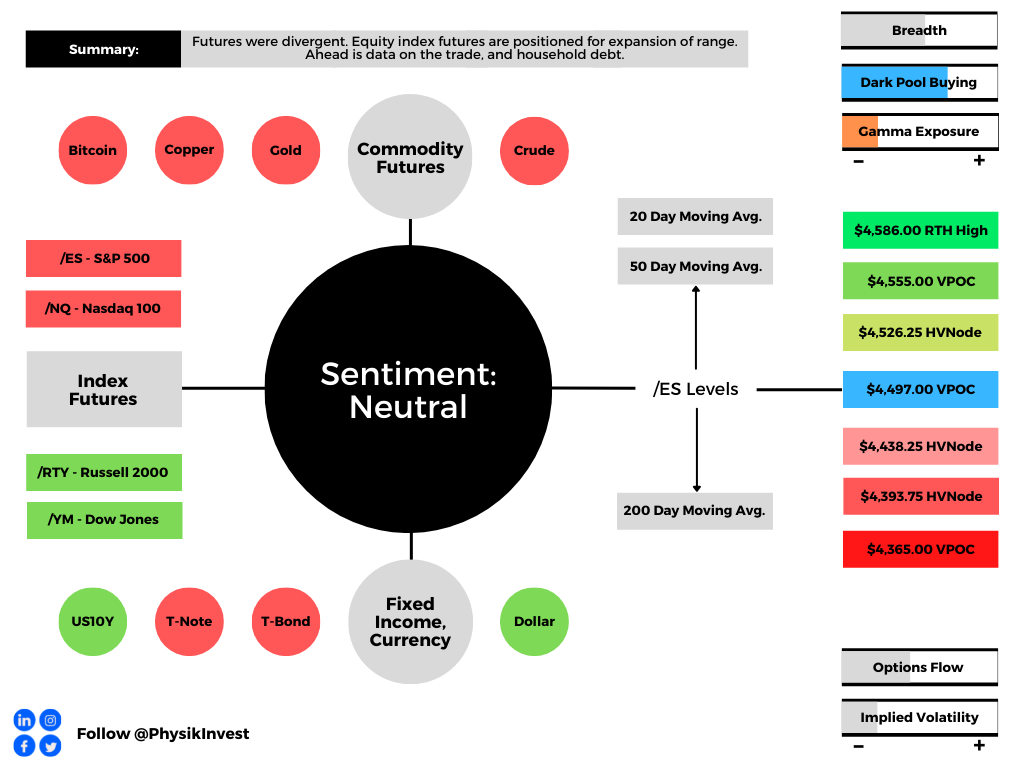
Graphic updated 6:20 AM ET. Sentiment Neutral if expected /ES open is inside of the prior day’s range. /ES levels are derived from the profile graphic at the bottom of the following section. Levels may have changed since initially quoted; click here for the latest levels. SqueezeMetrics Dark Pool Index (DIX) and Gamma (GEX) calculations are based on where the prior day’s reading falls with respect to the MAX and MIN of all occurrences available. A higher DIX is bullish. At the same time, the lower the GEX, the more (expected) volatility. Learn the implications of volatility, direction, and moneyness. SHIFT data used for S&P 500 (INDEX: SPX) options activity. Note that options flow is sorted by the call premium spent; if more positive, then more was spent on call options. Breadth reflects a reading of the prior day’s NYSE Advance/Decline indicator. VIX reflects a current reading of the CBOE Volatility Index (INDEX: VIX) from 0-100.
What To Expect
Fundamental: Ranges, at the index level, have tightened markedly since the January sell-off culminating in a cross-market deleveraging cascade.
The situation is different at the single-stock level. There are a couple of factors behind this.
For one, ARK Invest’s Catherine Wood recently made an interesting point suggesting events of today are the exact opposite of the events leading into the tech-and-telecom bust.
“During the tech-and-telecom bubble, … investors were falling all over each other, trying to one-up each other, to get a bigger tech position, because tech in the indexes had moved to 35%. We saw many portfolios with 40%, 50% tech.”
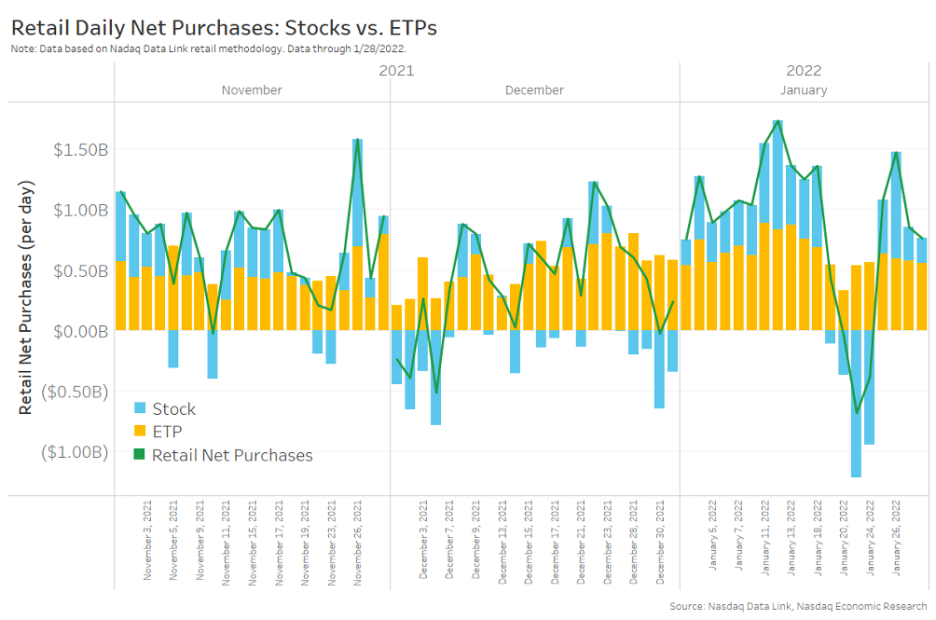
Basically, Wood thinks that investors are dumping single-stocks for index exposure. The below data supports this.
“We think that decision is going to prove to be just as incorrect as the decision to move en masse in the late 90s.”
Graphic: Per Nasdaq, “we’ve seen patches of retail selling of stocks that have mostly lasted for less than a week (blue bars in Chart 2). Interestingly, ETFs (yellow bars) remained net buy every single day, albeit at lower levels than usual in the last week of January.”
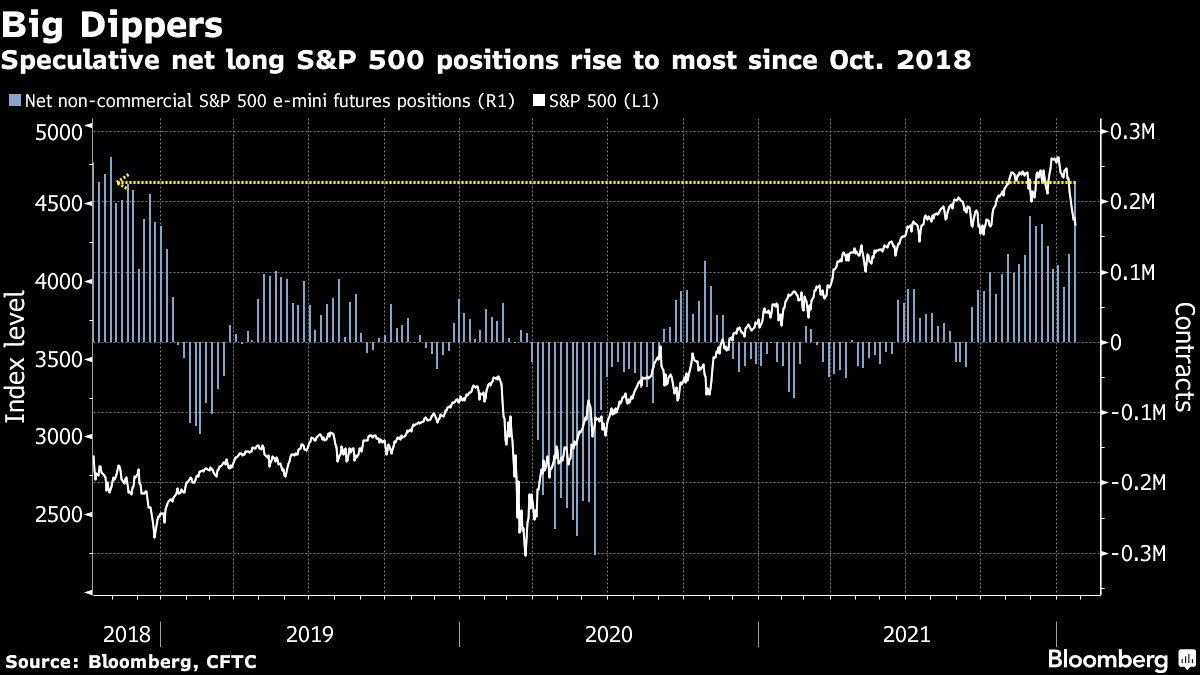
There is also the increasing demand for positive delta (long) exposure in the indexes as participants hedge their negative delta (short) exposure in the single stocks.
Graphic: Via Bloomberg.
Then, there is also the supply and demand for options protection, at the index level.
Mainly, the indexes are where the world will hedge and so the effects of dealers re-hedging their risks to decaying options protection provide markets a sort of passive buying support.
The S&P 500, which carries a more liquid derivatives complex and less exposure to tech- and growth-heavy constituents (when compared to the Nasdaq 100 and Russell 2000), appears stronger, but not as strong as the Dow Jones Industrial Average, a clear beneficiary of the rotation out of growth- and innovation-names to value- and cyclical-type stocks.
Graphic: Anchored Volume Weighted Average Price (VWAP) analysis via Physik Invest. Notice Dow Jones Industrial Average (bottom right) and S&P 500 (top left) strength, as well as Nasdaq 100 (top right) and Russell 2000 (bottom left) weakness. Key pivots marked off.
All the last-mentioned point is trying to make is the following: try hard enough and you’ll find an explanation for anything.
Sometimes, though, a focus on the simplest of explanations (e.g., demand for assets that perform better in higher rate environments) may suffice in navigating volatility.
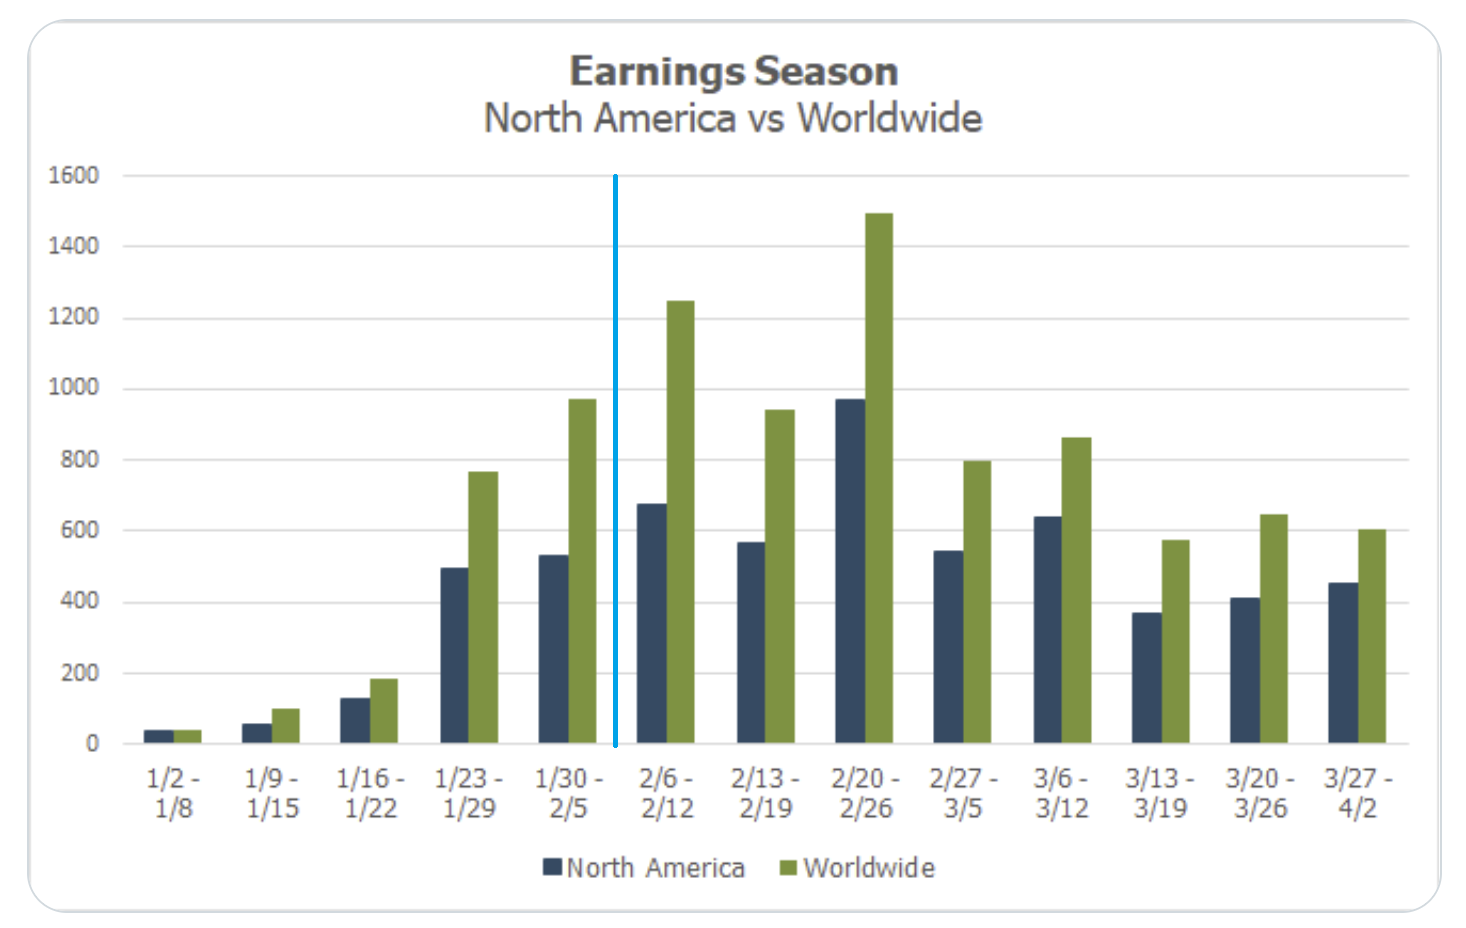
Going forward, despite many index heavy-weights reporting, the earnings season is set to accelerate over the coming weeks, and equity index futures traders have positioned themselves (as evidenced by tight, sideways trade) to react to new information accordingly.
Graphic: Via @MikeZaccardi. Retrieved from Callum Thomas.
Per JPMorgan Chase & Co (NYSE: JPM) strategists, the bull thesis remains intact.
The pace of economic growth is to stabilize in 2022 and the Federal Reserve is unlikely to move further into the hawkish territory.
We’re “Continuously seeing gains for earnings. Consensus projections for 2022 will most likely prove too low again,” JPM explains. “P/E multiples are elevated, but not equity yields vs credit & bond yields. We expect further, mild and benign, P/E compression in 2022. Overall, the picture is favorable, post the recent de-risking.”
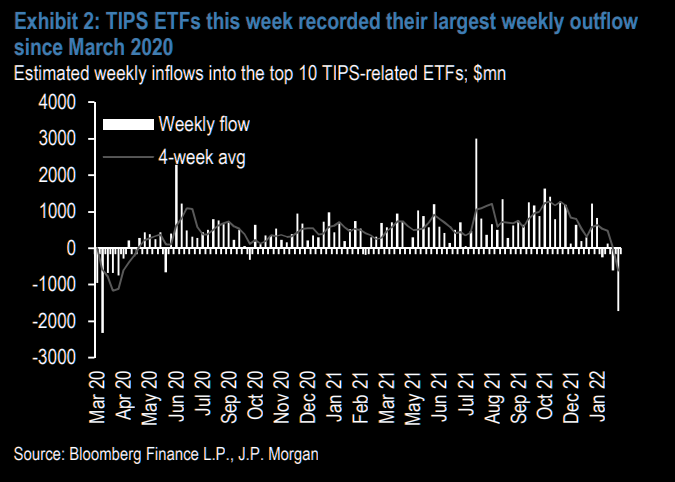
Graphic: Via The Market Ear. As money supply (which played a part in increased CPI figures) is slated to fall, there have been large outflows from Treasury Inflation-Protected Securities. @MacroAlf notes that these are some of the largest outflows “since the pandemic crash in March 2020. CPI might be 7% today, but markets are forward-looking.”
Positioning: Though markets will tend toward instability so long as volatility is heightened and products (especially the index constituents) remain in negative gamma, the dip lower and demand for protection may serve to prime the market for upside (when volatility starts to compress again and counterparties unwind hedges thus supporting any attempt higher).
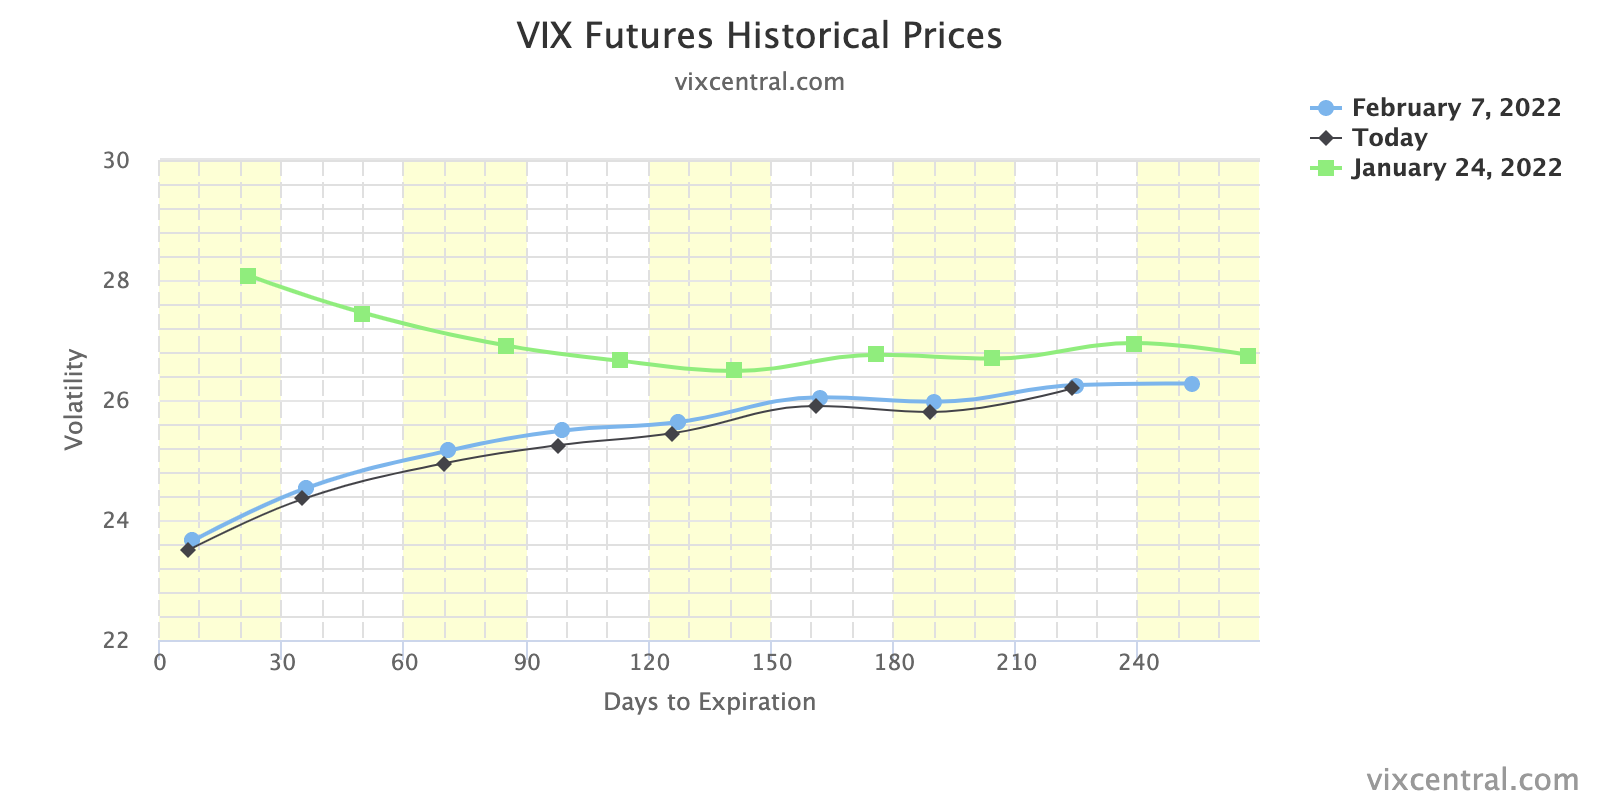
Graphic: VIX term structure compresses markedly at the front end affecting most shorter-dated options more sensitive to the effects of direction and volatility.
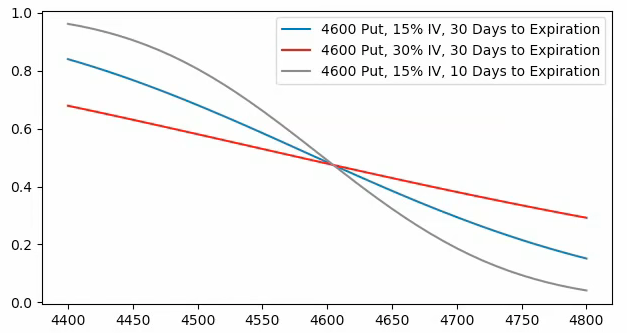
“Failure to expand the range, lower, on the index level, at least, likely invokes supportive dealer hedging flows with respect to time (‘charm’) and volatility (‘vanna’),” SpotGamma adds.
Graphic: Via SpotGamma. “SPX prices X-axis. Option delta Y-axis. When the factors of implied volatility and time change, hedging ratios change. For instance, if SPX is at $4,700.00 and IV jumps 15% (all else equal), the dealer may sell an additional 0.2 deltas to hedge their exposure to the addition of a positive 0.2 delta. The graphic is for illustrational purposes, only.”
Taking into account options positioning, versus buying pressure (measured via short sales or liquidity provision on the market-making side), metrics point to “[m]odest bullishness on the 1-month timeframe.”
Technical: As of 6:20 AM ET, Tuesday’s regular session (9:30 AM – 4:00 PM ET), in the S&P 500, will likely open in the lower part of a negatively skewed overnight inventory, inside of prior-range and -value, suggesting a limited potential for immediate directional opportunity.
Balance-Break Scenarios: A change in the market (i.e., the transition from two-time frame trade, or balance, to one-time frame trade, or trend) may soon occur.

Monitor for acceptance (i.e., more than 1-hour of trade) outside of the balance area. Rejection (i.e., return inside of balance) portends a move to the opposite end of the balance.
In the best case, the S&P 500 trades higher; activity above the $4,497.00 untested point of control (VPOC) puts in play the $4,526.25 high volume area (HVNode). Initiative trade beyond the HVNode could reach as high as the $4,555.00 VPOC and $4,586.00 RTH High (regular trade high), or higher.
In the worst case, the S&P 500 trades lower; activity below the $4,497.00 VPOC puts in play the $4,438.25 HVNode. Initiative trade beyond the $4,438.25 HVNode could reach as low as the $4,393.75 HVNode and $4,365.00 VPOC, or lower.
Click here to load today’s key levels into the web-based TradingView charting platform. Note that all levels are derived using the 65-minute timeframe. New links are produced, daily.
Graphic: 65-minute profile chart of the Micro E-mini S&P 500 Futures.
Definitions
Volume Areas: A structurally sound market will build on areas of high volume (HVNodes). Should the market trend for long periods of time, it will lack sound structure, identified as low volume areas (LVNodes). LVNodes denote directional conviction and ought to offer support on any test.
If participants were to auction and find acceptance into areas of prior low volume (LVNodes), then future discovery ought to be volatile and quick as participants look to HVNodes for favorable entry or exit.
POCs: POCs are valuable as they denote areas where two-sided trade was most prevalent in a prior day session. Participants will respond to future tests of value as they offer favorable entry and exit.
Volume-Weighted Average Prices (VWAPs): A metric highly regarded by chief investment officers, among other participants, for quality of trade. Additionally, liquidity algorithms are benchmarked and programmed to buy and sell around VWAPs.
About
After years of self-education, strategy development, mentorship, and trial-and-error, Renato Leonard Capelj began trading full-time and founded Physik Invest to detail his methods, research, and performance in the markets.
Capelj is also a Benzinga finance and technology reporter interviewing the likes of Shark Tank’s Kevin O’Leary, JC2 Ventures’ John Chambers, FTX’s Sam Bankman-Fried, and ARK Invest’s Catherine Wood, as well as a SpotGamma contributor developing insights around impactful options market dynamics.
Disclaimer
Physik Invest does not carry the right to provide advice.
In no way should the materials herein be construed as advice. Derivatives carry a substantial risk of loss. All content is for informational purposes only.
Overnight, equity index futures auctioned sideways to higher after Friday’s liquidation had the S&P 500 undercutting its 50-day simple moving average (SMA), a visual go/no-go level.
Strength shifted, again, to the Russell 2000 while the tech-heavy Nasdaq 100 was underwater. This comes as policymakers look to temper inflation with the tightening of monetary policy.
In regards to news, China’s central bank looked to boost liquidity for its slowing economy. It was also found that a new virus variant was not fueling a surge in hospitalizations; the U.S.’s adviser on the issue, Anthony Fauci, said there wasn’t “a great degree of severity to omicron.”
That didn’t stop the economists at Goldman Sachs Group Inc (NYSE: GS) from cutting their forecasts for U.S. GDP next year; the estimates were revised down on an expectation the omicron strain would drag growth.
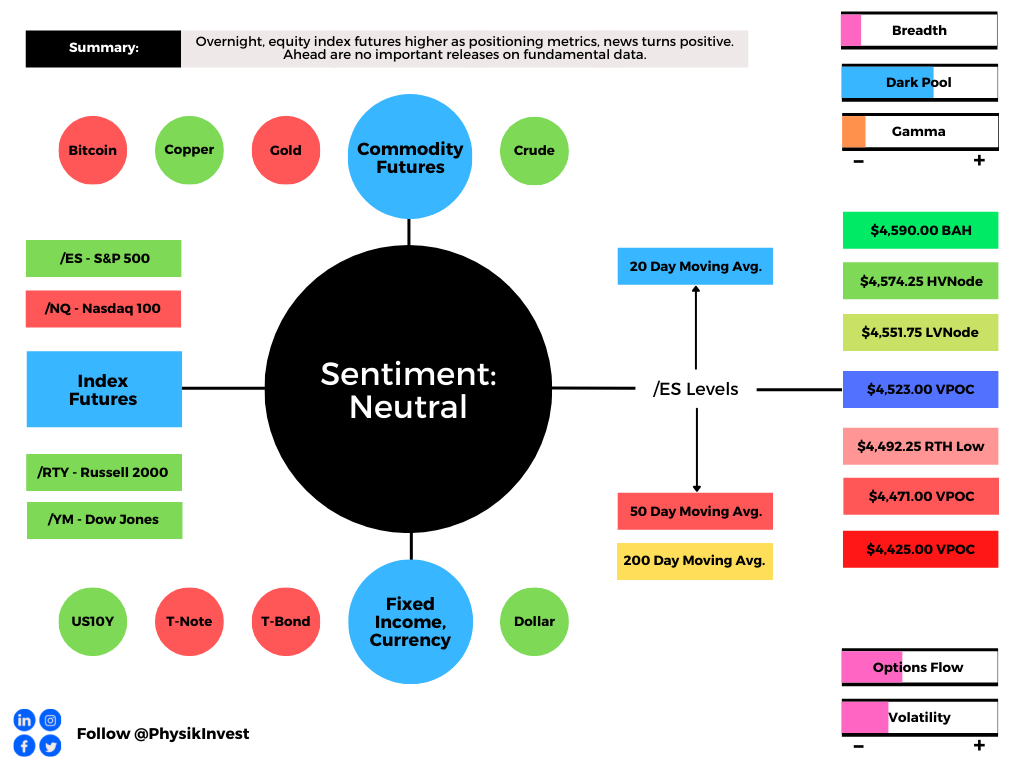
Ahead are no important releases on fundamental data.
Graphic updated 6:30 AM ET. Sentiment Neutral if expected /ES open is inside of the prior day’s range. /ES levels are derived from the profile graphic at the bottom of the following section. Levels may have changed since initially quoted; click here for the latest levels. SqueezeMetrics Dark Pool Index (DIX) and Gamma (GEX) calculations are based on where the prior day’s reading falls with respect to the MAX and MIN of all occurrences available. A higher DIX is bullish. At the same time, the lower the GEX, the more (expected) volatility. Learn the implications of volatility, direction, and moneyness. SHIFT data used for S&P 500 (INDEX: SPX) options activity. Note that options flow is sorted by the call premium spent; if more positive then more was spent on call options. Breadth reflects a reading of the prior day’s NYSE Advance/Decline indicator. VIX reflects a current reading of the CBOE Volatility Index (INDEX: VIX) from 0-100.
What To Expect
On weak intraday breadth and divergent market liquidity metrics, the worst outcome occurred; there was an expansion of range, to the downside, and participants spent the majority of the session building value at lower prices (i.e., levels at which 70% of that day’s volume occurred).
The lower bound of Friday’s range was $4,500.00 or so, at which the 50-day SMA corresponded with a large base of resting liquidity.
To note, the 50-day is visual level at which short-term, technically-driven participants were likely buying in response to probes below developing balance.
Successfully auctioning beneath the 50-day is a concern. Those short-term participants lack the wherewithal (both emotional and financial) to defend retests.
Continuation lower, in such a case, is likely.
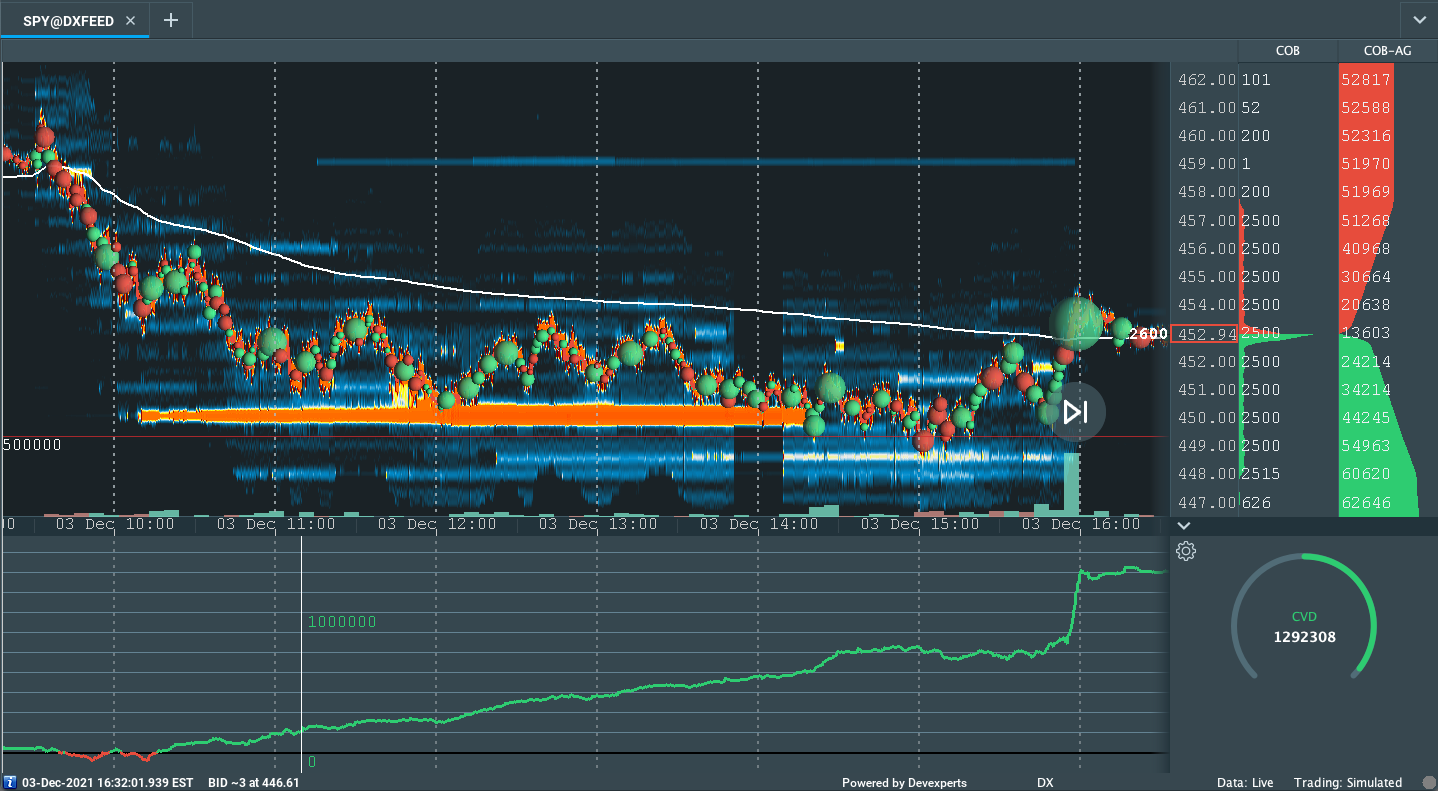
Graphic: Divergent delta (i.e., non-committed selling as measured by volume delta or buying and selling power as calculated by the difference in volume traded at the bid and offer) in SPDR S&P 500 ETF Trust (NYSE: SPY), one of the largest ETFs that track the S&P 500 index, via Bookmap. The readings are supportive of responsive trade (i.e., rotational trade that suggests current prices offer favorable entry and exit; the market is in balance).
Context: The Fed’s intent to moderate stimulus and uncertainty with regards to how a new COVID-19 variant will impact the global recovery.
According to Bloomberg, “the Fed is seen responding to the inflation fears stalking businesses by leaning toward an older playbook of prioritizing the fight against price pressures — even if that risks weaker growth over the longer term.”
In line with the aforementioned, traders already started pricing in potential rate overshoots with the “December 2024 eurodollar yields [rising] above December 2025 contracts, a curve inversion that signals expectations the central bank may consider cutting rates in 2025.”
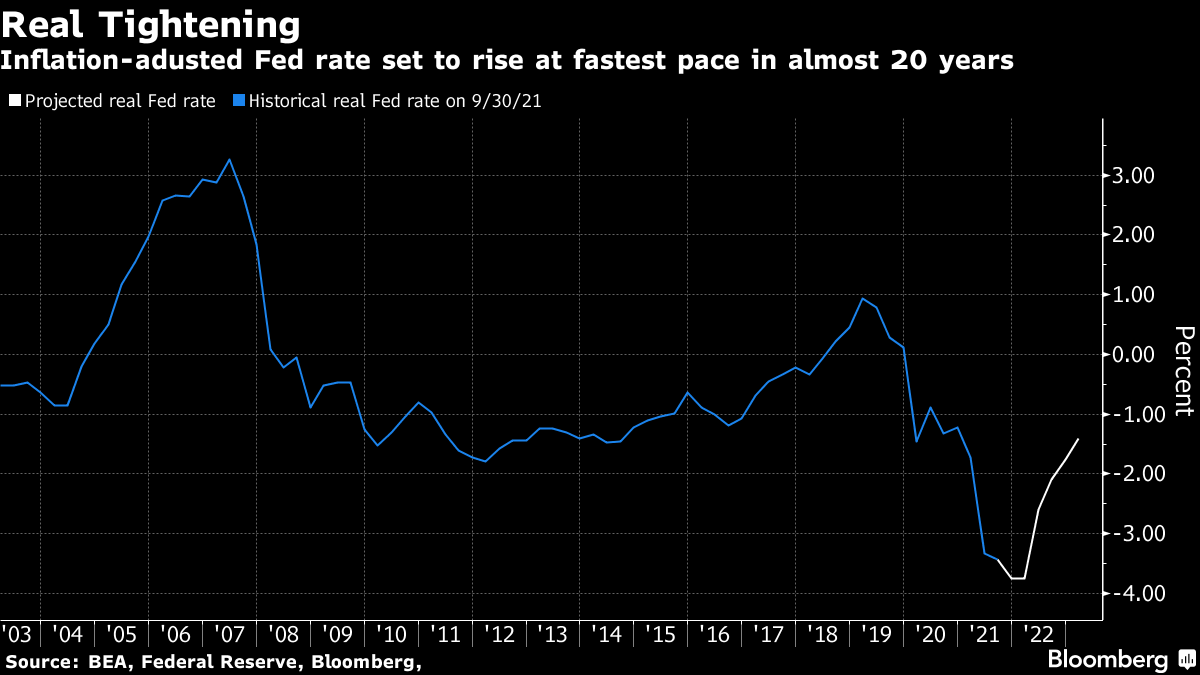
The result is that the U.S. may realize the swiftest tightening in financial conditions since 2005 if the Fed was to hike rates three times next year.
Graphic: Via Bloomberg, trades price in a rapid increase in the real Fed rate.
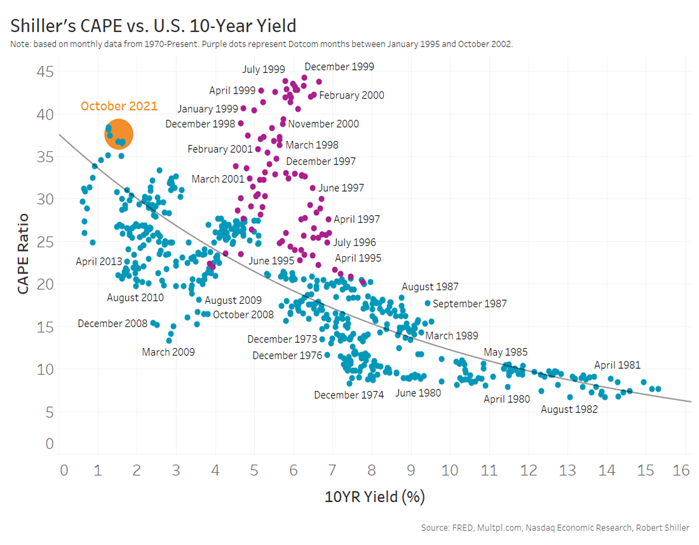
This development carries weight; now, more than during the tech-and-telecom bubble, low rates support current valuations.
Graphic: Low rates support current valuations better than the ‘90s, according to Nasdaq.
The reason being?
“Lower interest rates lead to future cashflow discounting less – leading to higher valuations. From another perspective, a company with a 5% profit margin is a much more attractive investment when long-term borrow costs are less than 2%, as they are now than when it costs 5%-7% to borrow money back in the ‘90s.”
The Fed’s intent to taper faster, and eventually hike rates, just as liquidity conditions have deteriorated, pushed “the orange dot [in the above graphic] toward the right during the year.”
Notwithstanding, “growth in earnings is so far stronger than the multiple compression caused by rising rates (blue line),” and that is helping support this year’s rally.
The intent to moderate stimulus is likely to serve as a headwind; there’s always a possibility of unanticipated policy adjustments, in the face of a resurgent COVID-19 digging further into the economy’s growth.
That’s partially why we saw Goldman Sachs cut their forecasts for GDP.
Graphic: Via The Market Ear. Goldman Sachs cut its forecast for GDP.
But, for every negative view, there is a positive (either by the same institution or a competitor).
We see JPMorgan Chase & Co (NYSE: JPM), among others, doubling down on their bullishness.
“We are calling for another year of positive earnings surprises, relative to current consensus estimates.”
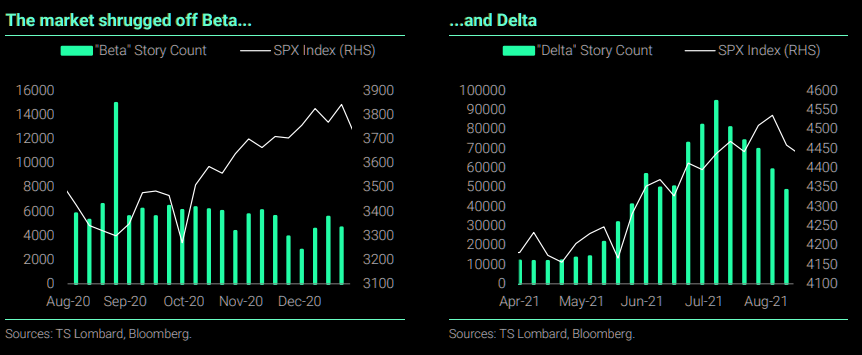
Similarly, the market may shrug off omicron just as it did beta and delta.
Graphic: Via The Market Ear, the market shrugs off COVID-19 variants with ease.
And, despite the market’s trade in short-gamma (a “negative [gamma] implies the opposite [selling into lows, buying into highs], thus magnifying market volatility”) destabilizing demand for downside protection is concentrated in shorter-dated options.
Graphic: A roll lower in the VIX term structure brings in supportive flows. Via The Market Ear.
Once that short-dated protection rolls off the table (and/or is monetized), counterparties will quickly reverse and support the market, buying to close their existing stock/futures hedges.
This flow is stabilizing and may play into a seasonally-aligned rally into Christmas as participants see defenses rolled out against the new COVID-19 variant, and the positive effects of pro-cyclical inflation, economic growth, and improvements in global trade.
Such development plays into a thesis held by Moody’s Corporation (NYSE: MCO).
“The forecast is that the Dow Jones Industrial Average increases this quarter and peaks in early 2022. However, the rest of the contours of the forecast didn’t change. We expect the DJIA to steadily decline throughout 2022, but because it will now peak later than previously thought, the level of the DJIA will be higher at the end of next year and over the near-term forecast.”
Similarly, here are some views by Morgan Stanley (NYSE: MS), compiled by The Market Ear.
“The Morgan Stanley’s Global Risk Demand Index (GRDI) [fell] to a 10Y low reading of -4.2SD, last Friday (currently -3.SD). Historically, such a level has proved to be a solid buy signal over the next 3m. Other signs that investor sentiment has overshot to the downside include the VIX > 30, a steep put-call skew, and the AAII survey where 42% of respondents are bearish (90th percentile reading). Over the last decade, MSCI ACWI has risen 98% of the time over the next 3m post this signal and by an average of 10%.”
Expectations: As of 6:30 AM ET, Monday’s regular session (9:30 AM – 4:00 PM ET), in the S&P 500, will likely open in the middle part of a positively skewed overnight inventory, inside of prior-range and -value, suggesting a limited potential for immediate directional opportunity.
Balance-Break Scenarios: A change in the market (i.e., the transition from two-time frame trade, or balance, to one-time frame trade, or trend) may occur.

Monitor for acceptance (i.e., more than 1-hour of trade) outside of the developing balance area. Rejection (i.e., return inside of balance) portends a move to the opposite end of the balance.
In the best case, the S&P 500 trades sideways or higher; activity above the $4,523.00 untested point of control (VPOC) puts in play the $4,551.75 low volume area (LVNode). Initiative trade beyond the LVNode could reach as high as the $4,574.25 high volume area (HVNode) and $4,590.00 balance area high (BAH), or higher.
In the worst case, the S&P 500 trades lower; activity below the $4,523.00 VPOC puts in play the $4,492.25 regular trade low (RTH Low). Initiative trade beyond the RTH Low could reach as low as the $4,471.00 and $4,425.00 VPOC, or lower.
Click here to load today’s updated key levels into the web-based TradingView charting platform. Note that all levels are derived using the 65-minute timeframe. New links are produced, daily.
Graphic: 65-minute profile chart of the Micro E-mini S&P 500 Futures. Learn about the profile.
What People Are Saying
The "Gamma Trap"
Dec SPX has 3.3mm puts which is the largest of any expiration. The chunkiest of these puts are likely held by funds which will hold to 12/17 expiration. The 4000 strike has the most put interest.
If the market goes under 4500, the gamma trap could set: (1/n)
The 10 day moving average of the combined put-call ratio has been a long time solid guide to human behavior in the markets. When everyone is bullish (.50 ish) markets top and pull back. When everyone is bearish (.70 ish) markets bottom and rally. Ending the week at .75 pic.twitter.com/MDUhUncrMW
Volume Areas: A structurally sound market will build on areas of high volume (HVNodes). Should the market trend for long periods of time, it will lack sound structure, identified as low volume areas (LVNodes). LVNodes denote directional conviction and ought to offer support on any test.
If participants were to auction and find acceptance into areas of prior low volume (LVNodes), then future discovery ought to be volatile and quick as participants look to HVNodes for favorable entry or exit.
Liquidation Breaks: The profile shape suggests participants were “too” long and had poor location.
POCs: POCs are valuable as they denote areas where two-sided trade was most prevalent in a prior day session. Participants will respond to future tests of value as they offer favorable entry and exit.
About
After years of self-education, strategy development, and trial-and-error, Renato Leonard Capelj began trading full-time and founded Physik Invest to detail his methods, research, and performance in the markets.
Additionally, Capelj is a Benzinga finance and technology reporter interviewing the likes of Shark Tank’s Kevin O’Leary, JC2 Ventures’ John Chambers, and ARK Invest’s Catherine Wood, as well as a SpotGamma contributor, developing insights around impactful options market dynamics.
Disclaimer
At this time, Physik Invest does not manage outside capital and is not licensed. In no way should the materials herein be construed as advice. Derivatives carry a substantial risk of loss. All content is for informational purposes only.
Equity index futures mixed. Commodities mixed. Bonds sideways to lower. Volatility expanded.
Ahead is a light day of economic releases, in the face of fundamental narratives and positioning metrics that support intraday price stability.
What Happened
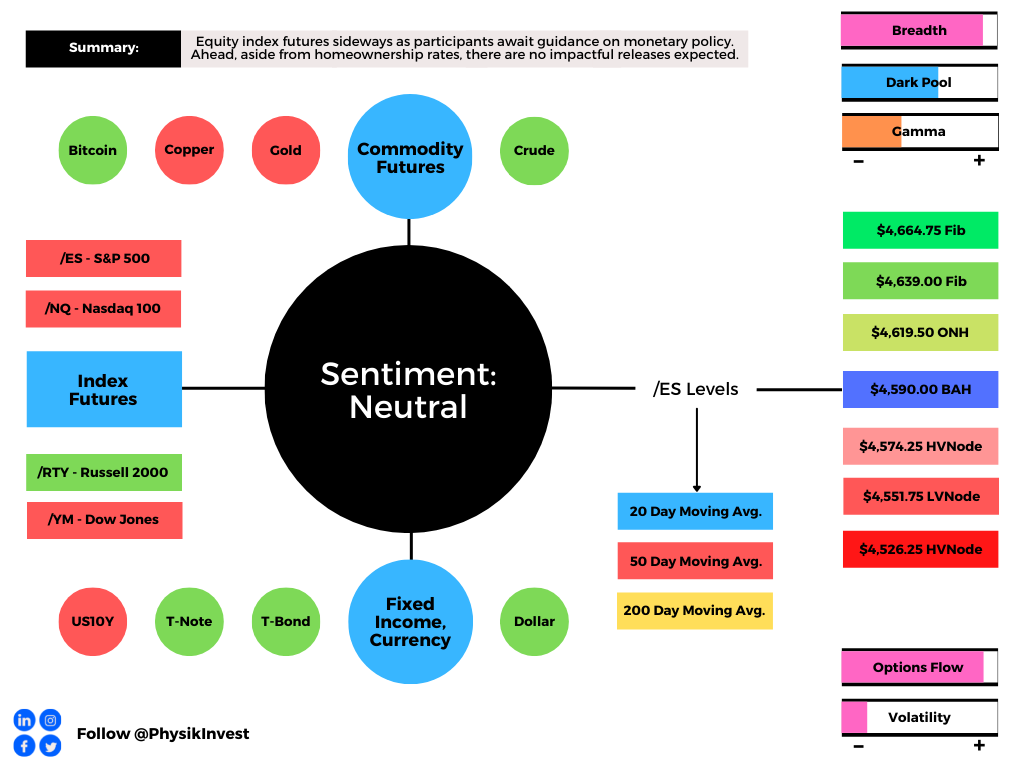
Overnight, equity index futures auctioned sideways as participants sought to position themselves for guidance on monetary policy, later this week.
Ahead is data on homeownership rates (10:00 AM ET).
Graphic updated 6:30 AM ET. Sentiment Neutral if expected /ES open is inside of the prior day’s range. /ES levels are derived from the profile graphic at the bottom of the following section. Levels may have changed since initially quoted; click here for the latest levels. SqueezeMetrics Dark Pool Index (DIX) and Gamma (GEX) calculations are based on where the prior day’s reading falls with respect to the MAX and MIN of all occurrences available. A higher DIX is bullish. At the same time, the lower the GEX, the more (expected) volatility. Learn the implications of volatility, direction, and moneyness. SHIFT data used for S&P 500 (INDEX: SPX) options activity. Note that options flow is sorted by the call premium spent; if more positive then more was spent on call options. Breadth reflects a reading of the prior day’s NYSE Advance/Decline indicator. VIX reflects a current reading of the CBOE Volatility Index (INDEX: VIX) from 0-100.
What To Expect
Action: On divergent intraday breadth and supportivemarket liquidity metrics, the worst-case outcome occurred, evidenced by the S&P 500’s acceptance of prices within Friday’s late-day spike, out of balance.
Intent: As also evidenced by the overlap of value areas, the acceptance of prices, within Friday’s late-day spike, out of balance, marks a potential willingness to continue sideways.
Validation: Sideways trade, above the $4,590.00 balance area high (BAH), validates the market’s prevailing intent to base ahead of the Federal Open Market Committee (FOMC) decision, later this week.
Consideration: Weak structure left behind prior initiative trade adds to technical instability.
To elaborate, for instance, Monday’s trade found responsive buyers at the $4,587.00 untested point of control (VPOC). This level likely was only known by participants who act on visual cues.
These technically-driven participants are generally thought to not be able to defend retests. Therefore, these participants ought to quickly liquidate, if proven wrong, on a break of the BAH.
Graphic: Supportive delta (i.e., committed buying as measured by volume delta or buying and selling power as calculated by the difference in volume traded at the bid and offer) in SPDR S&P 500 ETF Trust (NYSE: SPY), one of the largest ETFs that track the S&P 500 index, via Bookmap. The readings are supportive of responsive trade (i.e., rotational trade that suggests current prices offer favorable entry and exit; the market is in balance).
Context: Ample liquidity, peak growth, inflation, strong seasonality and buybacks, as well as monetary and fiscal policy uncertainties, and single-stock volatility.
Based on this context, Moody’s Corporation (NYSE: MCO) forecasts a peak; “The Dow Jones Industrial Average has peaked and will gradually decline during the next year. Risks are heavily weighted to the upside, but peak growth, inflation uncertainty around fiscal policy, and the Fed tapering could weigh on equity markets.”
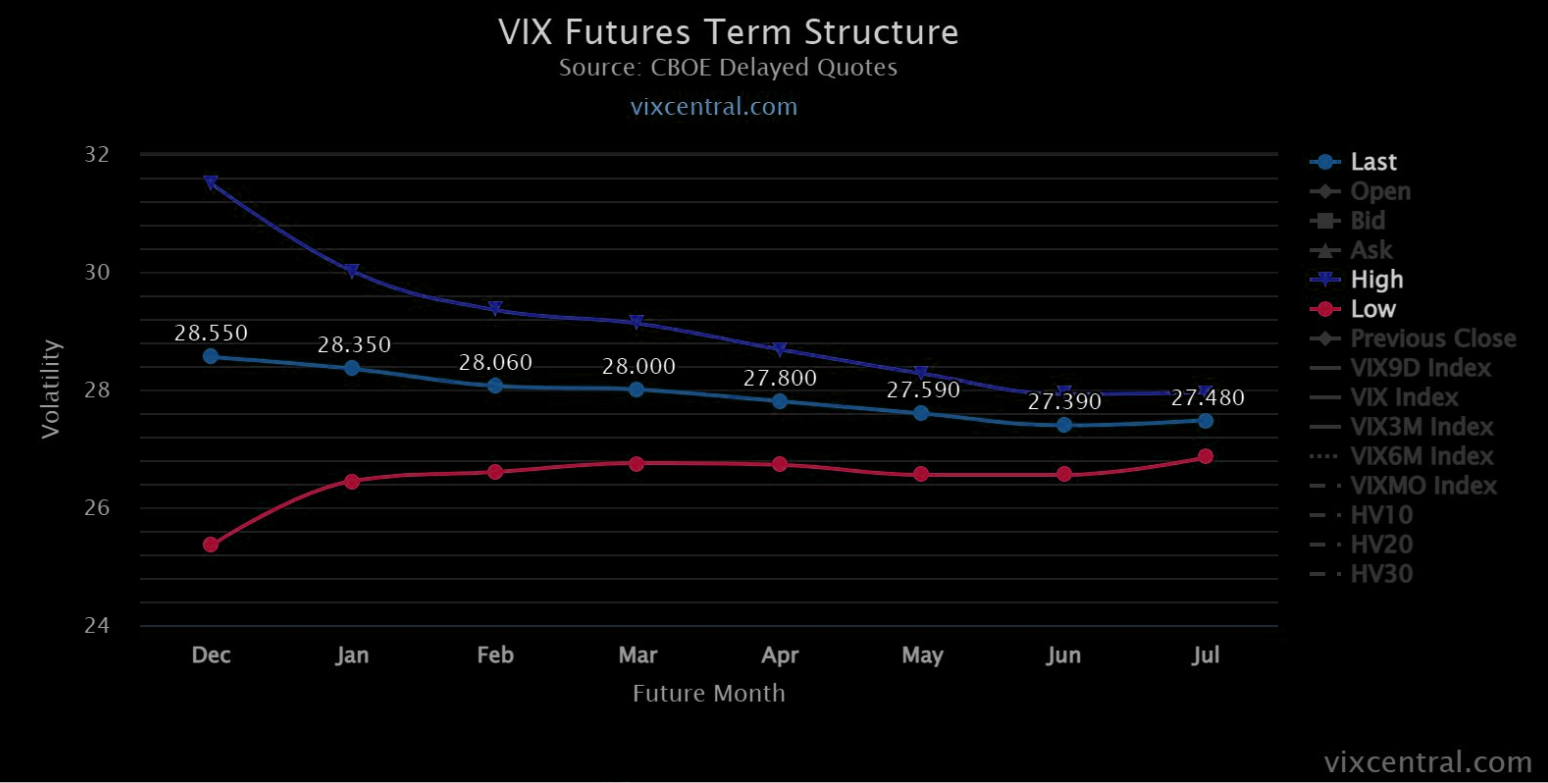
In terms of positioning, the CBOE Volatility Index (INDEX: VIX) was higher, while demand came in across the VIX futures term structure, suggesting participants are inclined to hedge against near-term equity market instability.
Such a situation, in addition to the long-gamma environment (in which counterparties hedge their warehoused options risk by buying underlying into weakness and selling into strength), has the effect of making it difficult to resolve directionally.
The reason is, there are two knowns; as volatility contracts, (1) options will slide down their term structure (vanna) and (2) skew decays (charm).
When this happens, we expect to see supportive flows when the dealers cover their short equity/futures hedges. With volatility bid, the effect of vanna and charm is dulled. It is likely that participants see more robust movement after the FOMC announcement, later this week.
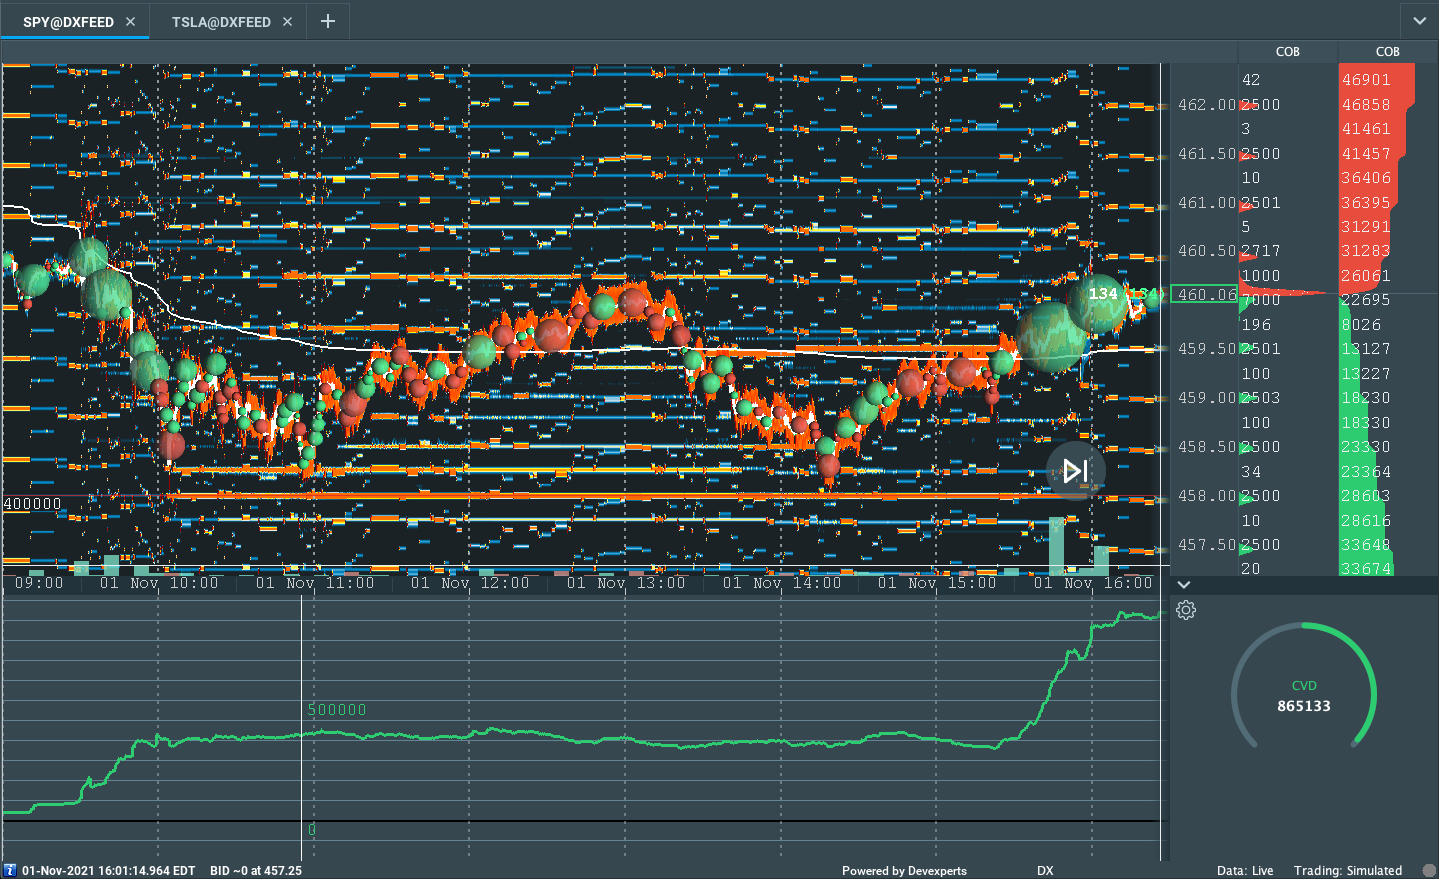
In a separate note on volatility in stocks like Tesla Inc (NASDAQ: TSLA), SpotGamma says the following: “These rampant moves are appearing to be more widespread, and we believe this invokes instability that usually ends badly.”
Expectations: As of 6:30 AM ET, Monday’s regular session (9:30 AM – 4:00 PM ET), in the S&P 500, will likely open in the top part of a negatively skewed overnight inventory, inside of prior-range and -value, suggesting a limited potential for immediate directional opportunity.
Balance-Break Scenarios: A change in the market (i.e., the transition from two-time frame trade, or balance, to one-time frame trade, or trend) occurred.

We monitor for continued acceptance outside of the balance area. Rejection (i.e., a move below the balance area high) portends a move to the opposite end of the balance, lower.
In the best case, the S&P 500 trades sideways or higher; activity above the $4,590.00 BAH puts in play the $4,619.50 overnight high (ONH). Initiative trade beyond the ONH could reach as high as the $4,639.00 and $4,664.75 Fibonacci figures, or higher.
In the worst case, the S&P 500 trades lower; activity below the $4,590.00 BAH puts in play the $4,574.25 high volume area (HVNode). Initiative trade beyond the HVNode could reach as low as the $4,551.75 low volume area (LVNode), and $4,526.25 HVNode, or lower.
Click here to load today’s updated key levels into the web-based TradingView charting platform. Note that all levels are derived using the 65-minute timeframe. New links are produced, daily.
Graphic: 65-minute profile chart of the Micro E-mini S&P 500 Futures. Learn about the profile.
What People Are Saying
Deviation from your process results in deviation from your profits.
Spikes: Spike’s mark the beginning of a break from value. Spikes higher (lower) are validated by trade at or above (below) the spike base (i.e., the origin of the spike).
Overnight Rally Highs (Lows): Typically, there is a low historical probability associated with overnight rally-highs (lows) ending the upside (downside) discovery process.
Volume Areas: A structurally sound market will build on areas of high volume (HVNodes). Should the market trend for long periods of time, it will lack sound structure, identified as low volume areas (LVNodes). LVNodes denote directional conviction and ought to offer support on any test.
If participants were to auction and find acceptance into areas of prior low volume (LVNodes), then future discovery ought to be volatile and quick as participants look to HVNodes for favorable entry or exit.
Gamma: Gamma is the sensitivity of an option to changes in the underlying price. Dealers that take the other side of options trades hedge their exposure to risk by buying and selling the underlying. When dealers are short-gamma, they hedge by buying into strength and selling into weakness. When dealers are long-gamma, they hedge by selling into strength and buying into weakness. The former exacerbates volatility. The latter calms volatility.
Vanna: The rate at which the delta of an option changes with respect to volatility.
Charm: The rate at which the delta of an option changes with respect to time.
Options: If an option buyer was short (long) stock, he or she would buy a call (put) to hedge upside (downside) exposure. Option buyers can also use options as an efficient way to gain directional exposure.
Value-Area Placement: Perception of value unchanged if value overlapping (i.e., inside day). Perception of value has changed if value not overlapping (i.e., outside day). Delay trade in the former case.
POCs: POCs are valuable as they denote areas where two-sided trade was most prevalent in a prior day session. Participants will respond to future tests of value as they offer favorable entry and exit.
About
After years of self-education, strategy development, and trial-and-error, Renato Leonard Capelj began trading full-time and founded Physik Invest to detail his methods, research, and performance in the markets.
Additionally, Capelj is a Benzinga finance and technology reporter interviewing the likes of Shark Tank’s Kevin O’Leary, JC2 Ventures’ John Chambers, and ARK Invest’s Catherine Wood, as well as a SpotGamma contributor, developing insights around impactful options market dynamics.
Disclaimer
At this time, Physik Invest does not manage outside capital and is not licensed. In no way should the materials herein be construed as advice. Derivatives carry a substantial risk of loss. All content is for informational purposes only.
Update: This morning’s 7:55 AM ET release of the newsletter failed to include updated S&P 500 levels in the very first graphic, below. That graphic has been updated, now. Sorry!
Market Commentary
Equity index, commodity, bond futures trade sideways to higher. Volatility ebbs.
Consumer prices rose. Taper in play.
Ahead: Claims, PPI data, Fed speak.
What Happened: After news that consumer prices rose more than expected, alongside the release of Federal Open Market Committee (FOMC) minutes which revealed an intent to taper asset purchases, U.S. stock index futures auctioned higher.
Ahead is data on jobless claims and the producer price index (8:30 AM ET). After is Fed-speak by Lorie Logan (12:00 PM ET), Tom Barkin (1:00 PM ET), and Patrick Harker (6:00 PM ET).
Graphic updated 6:30 AM ET. Sentiment Risk-On if expected /ES open is above the prior day’s range. /ES levels are derived from the profile graphic at the bottom of the following section. SqueezeMetrics Dark Pool Index (DIX) and Gamma (GEX) calculations are based on where the prior day’s reading falls with respect to the MAX and MIN of all occurrences available. A higher DIX is bullish. At the same time, the lower the GEX, the more (expected) volatility. SHIFT data used for S&P 500 (INDEX: SPX) options activity. Note that options flow is sorted by the call premium spent; if more positive then more was spent on call options. Breadth reflects a reading of the prior day’s NYSE Advance/Decline indicator. VIX reflects a current reading of the CBOE Volatility Index (INDEX: VIX) from 0-100.
What To Expect: As of 6:30 AM ET, Thursday’s regular session (9:30 AM – 4:00 PM EST) in the S&P 500 will likely open outside of prior-range and -value, suggesting a potential for immediate directional opportunity.
Gap Scenarios: Gaps ought to fill quickly. Should they not, that’s a signal of strength; do not fade. Leaving value behind on a gap-fill or failing to fill a gap (i.e., remaining outside of the prior session’s range) is a go-with indicator.

Auctioning and spending at least 1-hour of trade back in the prior range suggests a lack of conviction; in such a case, do not follow the direction of the most recent initiative activity.
Adding, during the prior day’s regular trade, on positive intraday breadth and divergent market liquidity metrics, the best case outcome occurred; after numerous sessions of a minimum separation in value (i.e., the area where 70% of the day’s volume occurred) failed to support downside price discovery, participants took back Monday’s spike and weak close.
The activity now puts in play the minimal excess high just short of the $4,408.75 low volume area (LVNode), as well as the $4,415.00 untested point of control (VPOC), two areas where initiative buyers were unable to counter the fading momentum from short covering.
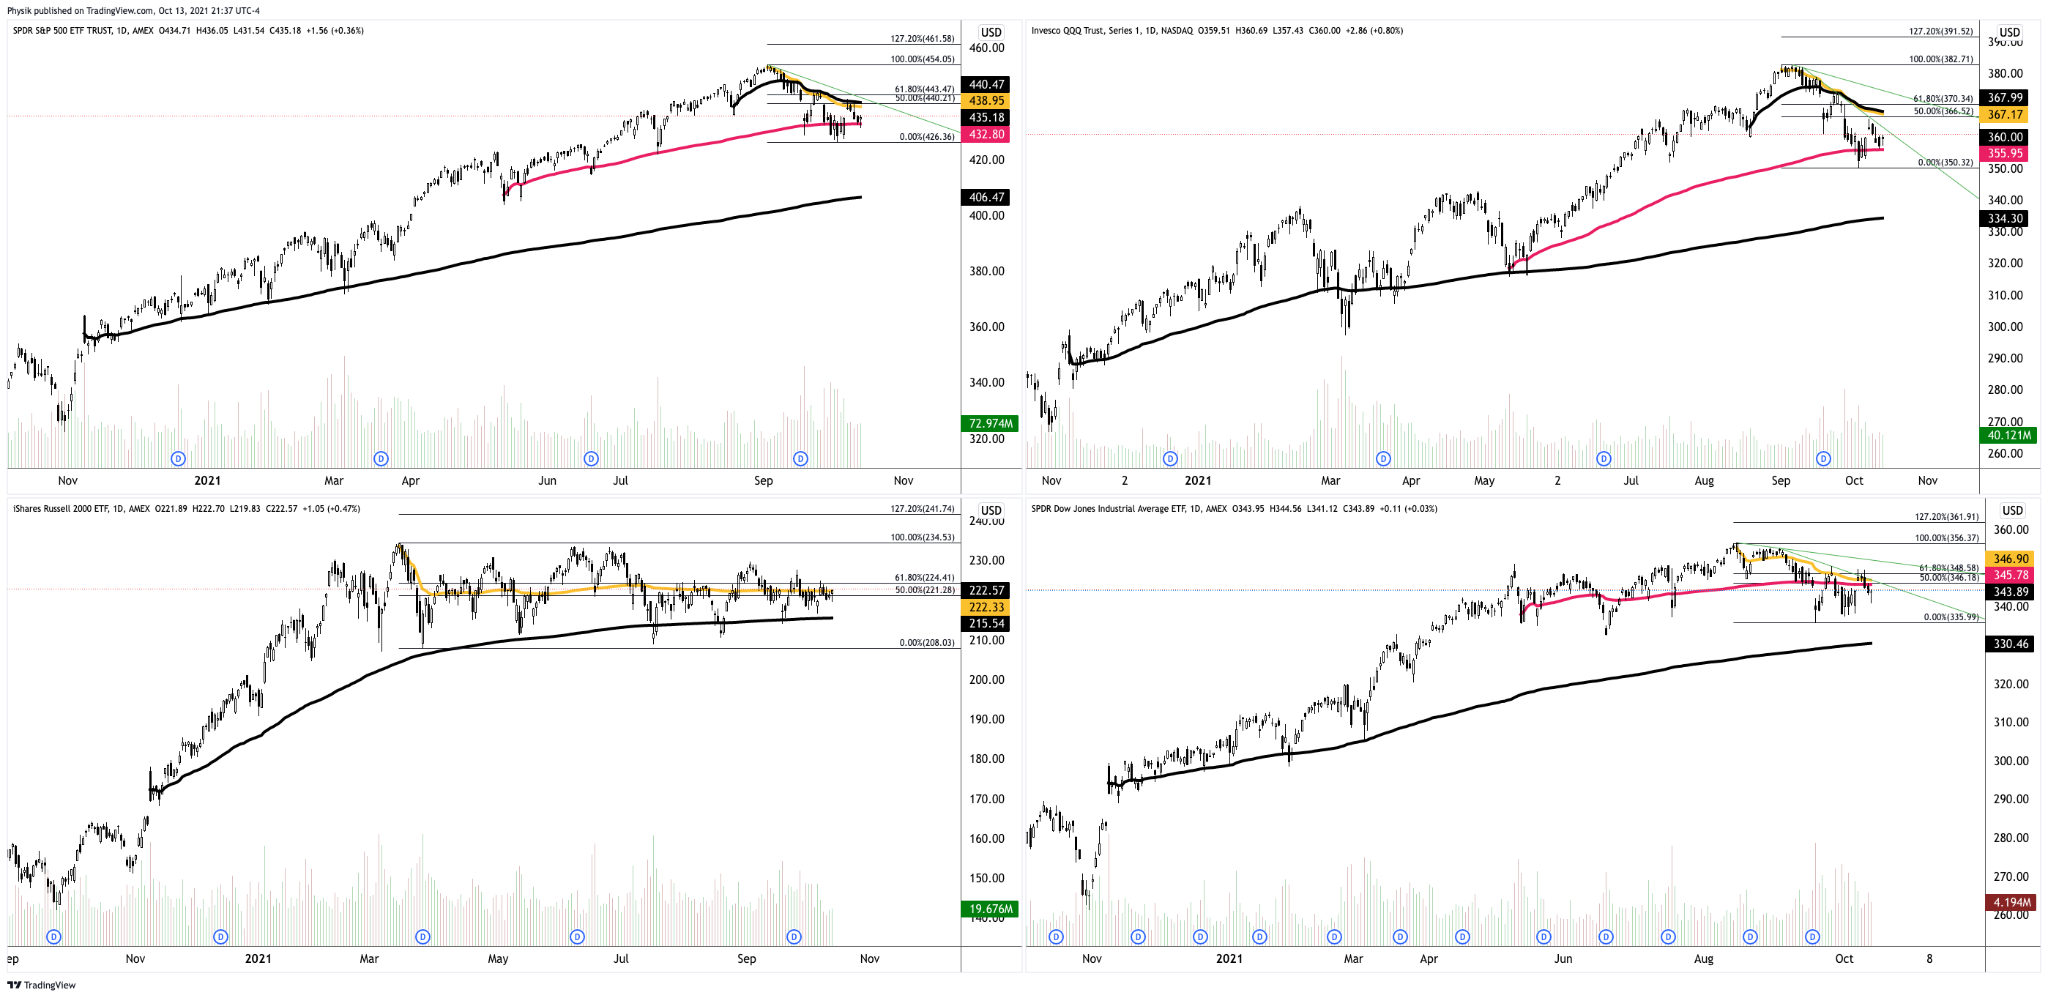
Looking across the spectrum, the Nasdaq 100 and Russell 2000 are firming, relative to the S&P 500 and Dow Jones Industrial Average, two indices that held the relative strength mantle, prior.
This rotation, if we will, may support sideways-to-higher trade in the coming sessions as participants clash head-on with the 50.00% and 61.80% Fibonacci retracements, levels that overlap key anchored volume-weighted average price (AVWAP)levels.
Note: VWAP is a metric highly regarded by chief investment officers, among other participants, for quality of trade. Additionally, liquidity algorithms are benchmarked and programmed to buy and sell around VWAPs. We look to buy above a flat/rising VWAP pinch. Sell below a flat/declining VWAP pinch.
Graphic: SPDR S&P 500 ETF (NYSE: SPY) top left, Invesco QQQ Trust Series 1 (NASDAQ: QQQ) top right, iShares Russell 2000 ETF (NYSE: IWM) bottom left, SPDR Dow Jones Industrial Average ETF Trust (NYSE: DIA) bottom right. Spending more than a few hours of trade above trend, VWAP (yellow), and the 61.80% Fibonacci retracement suggest good odds of upside continuation.
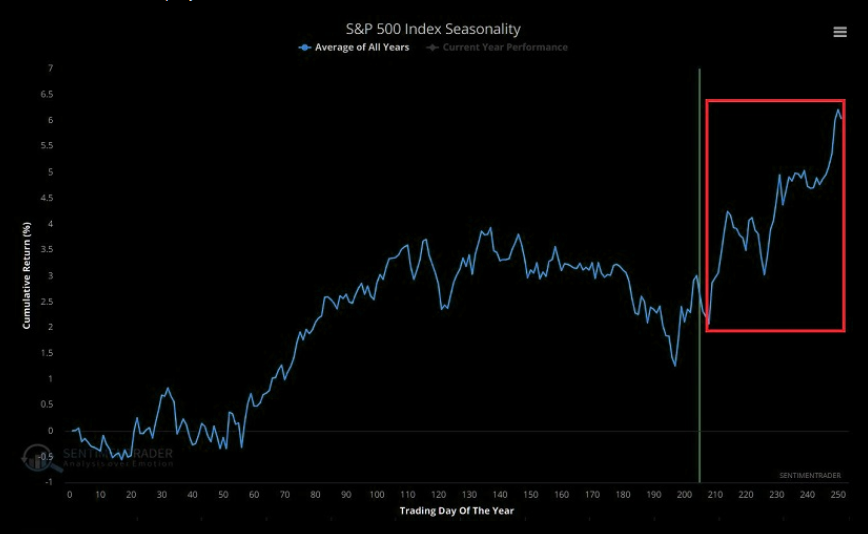
Further, the aforementioned trade is happening in the context of weakness into a seasonally bullish cycle of rebalancing and earnings.
Some risks include the prospects of tapering off asset purchases, next month, alongside dangerous inflation pressures, as indicated by minutes from the FOMC meeting last month.
“Markets took the hint. Two-year yields are their highest since March last year, when the pandemic first hit,” said Bloomberg’s John Authers. “Meanwhile, the 10-year yield retreated from an approach toward its post-pandemic high. The two-year reflects the now-strong likelihood that the Fed will raise rates within the next two years; the 10-year reflects concerns about growth.”
In terms of positioning, conditions may be supportive.
The current combination of DIX and GEX historically yields average 1-month returns of +2.00%.
Moreover, for today, participants may make use of the following frameworks.
In the best case, the S&P 500 trades sideways or higher; activity above the $4,381.25 LVNode puts in play the $4,393.75 high volume area (HVNode). Initiative trade beyond the HVNode could reach as high as the $4,415.00 VPOC and $4,437.75 micro composite point of control (MCPOC), or higher.
In the worst case, the S&P 500 trades lower; activity below the $4,381.25 LVNode puts in play the $4,360.25 LVNode. Initiative trade beyond the $4,360.25 LVNode could reach as low as the $4,349.00 VPOC and $4,330.25 LVNode, or lower.
Click here to load today’s updated real-time key levels into the web-based TradingView charting platform. Please note that all levels are derived using the 65-minute timeframe.
Graphic: 65-minute profile chart of the Micro E-mini S&P 500 Futures updated 6:30 AM ET.
Definitions
Spikes: Spike’s mark the beginning of a break from value. Spikes higher (lower) are validated by trade at or above (below) the spike base (i.e., the origin of the spike).
Volume Areas: A structurally sound market will build on areas of high volume (HVNodes). Should the market trend for long periods of time, it will lack sound structure, identified as low volume areas (LVNodes). LVNodes denote directional conviction and ought to offer support on any test.
If participants were to auction and find acceptance into areas of prior low volume (LVNodes), then future discovery ought to be volatile and quick as participants look to HVNodes for favorable entry or exit.
POCs: POCs are valuable as they denote areas where two-sided trade was most prevalent in a prior day session. Participants will respond to future tests of value as they offer favorable entry and exit.
MCPOCs: POCs are valuable as they denote areas where two-sided trade was most prevalent over numerous day sessions. Participants will respond to future tests of value as they offer favorable entry and exit.
Excess: A proper end to price discovery; the market travels too far while advertising prices. Responsive, other-timeframe (OTF) participants aggressively enter the market, leaving tails or gaps which denote unfair prices.
Value-Area Placement: Perception of value unchanged if value overlapping (i.e., inside day). Perception of value has changed if value not overlapping (i.e., outside day). Delay trade in the former case.
News And Analysis
Consumer prices rise more than expected as energy costs surge.
Global minimum tax pact ups the chance of multinational tax hike.
Global gas crisis is spilling over into the oil markets, IEA explains.
China’s power cuts stressing economic growth and supply chains.
Federal Reserve officials seeing mid-November, December taper.
What People Are Saying
This is really such a big factor that nobody else talks about. When I explain to investors there are only 4 real liquidity providers in the space, they think I’m a madman.
Having spent two decades in the coatings industry, I can tell you that zinc price inflation is a serious issue. Many coatings used for the protection of steel contain up to 90% zinc (!). The price volatility is enormous but end consumers will feel the pain in 2022-2023 onward. pic.twitter.com/XS5g3LpTaP
After years of self-education, strategy development, and trial-and-error, Renato Leonard Capelj began trading full-time and founded Physik Invest to detail his methods, research, and performance in the markets.
Additionally, Capelj is a finance and technology reporter. Some of his biggest works include interviews with leaders such as John Chambers, founder and CEO, JC2 Ventures, Kevin O’Leary, businessman and Shark Tank host, Catherine Wood, CEO and CIO, ARK Invest, among others.
Disclaimer
At this time, Physik Invest does not manage outside capital and is not licensed. In no way should the materials herein be construed as advice. Derivatives carry a substantial risk of loss. All content is for informational purposes only.
Equity index futures recover after last week’s liquidation.
Unpacking the inclination to taper.
Ahead: Busy week. Jackson Hole.
What Happened: The S&P 500, Nasdaq 100, and Dow Jones Industrial Average recovered more than 50% of last week’s liquidation. The Russell 2000 remains a laggard, trading weak below the halfway point of a multi-month consolidation.
Ahead is data on the Markit manufacturing and services PMI (Monday), existing-home sales (Monday), new home sales (Tuesday), durable goods orders (Wednesday), nondefense capital goods orders (Wednesday), jobless claims (Thursday), GDP revision (Thursday), personal income (Friday), consumer spending (Friday), core PCE price index (Friday), trade in goods (Friday), as well University of Michigan consumer sentiment (Friday).
Also, the Jackson Hole Economic Policy Symposium starts Thursday.
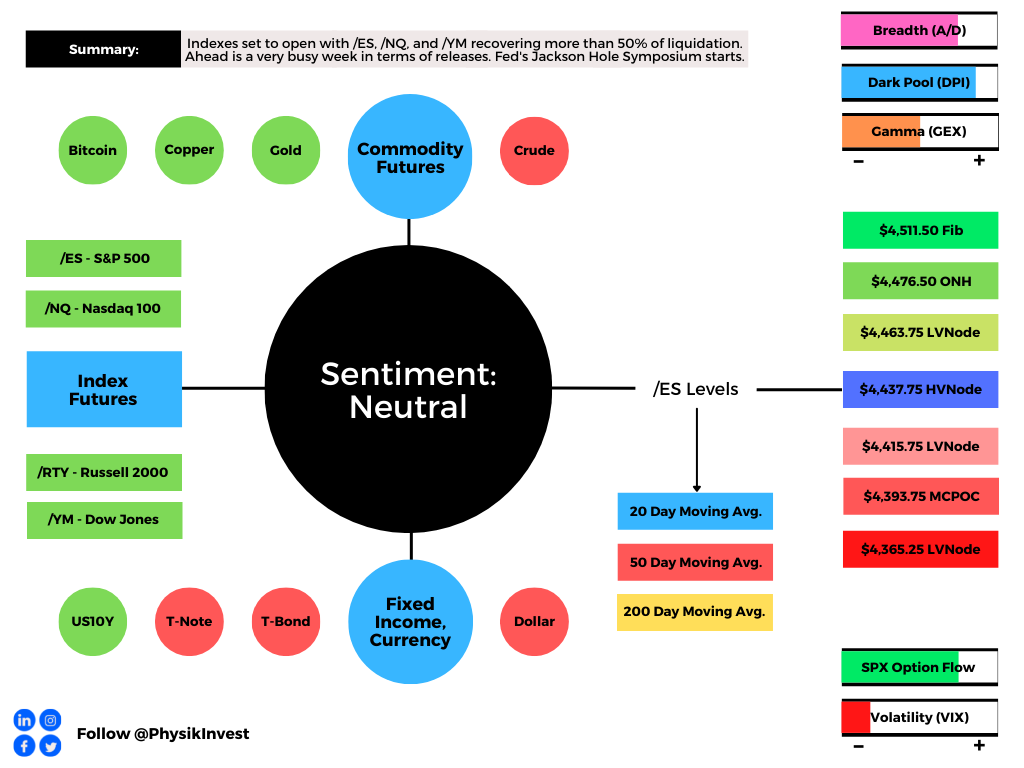
Graphic updated 12:30 PM ET Sunday. Sentiment Neutral if expected /ES open is inside of the prior day’s range. See here for more on the Dark Pool Index (DPI) and Gamma (GEX). A higher DPI approximation is bullish. At the same time, the lower the GEX approximation, the more volatility. SHIFT data used for options activity approximation. Note that options flow is sorted by the call premium spent; if green and more positive then more was spent on call options. Breadth reflects a reading of the prior day’s Advance/Decline indicator. VIX reflects a current reading of the CBOE Volatility Index from 0-100.
What To Expect: During the prior week’s trade, on weak intraday breadth and market liquidity metrics, the worst-case outcome occurred, evidenced by a liquidation that repaired poor profile structures as low as the S&P 500’s $4,353.00 point of control (POC).
POCs: POCs are valuable as they denote areas where two-sided trade was most prevalent. Participants will respond to future tests of value as they offer favorable entry and exit.
Then, during Friday’s session, a p-shaped profile structure (which denotes short covering) took back the spike base a few ticks below the $4,422.75 balance area high (BAH) – a prior break from value – negating the post-Federal Open Market Committee (FOMC) minutes liquidation.
Further, the aforementioned trade is happening in the context of moderating growth, peak long equity positioning, breadth divergences, a resurgence in COVID-19, geopolitical tensions, and an inclination to taper stimulus.
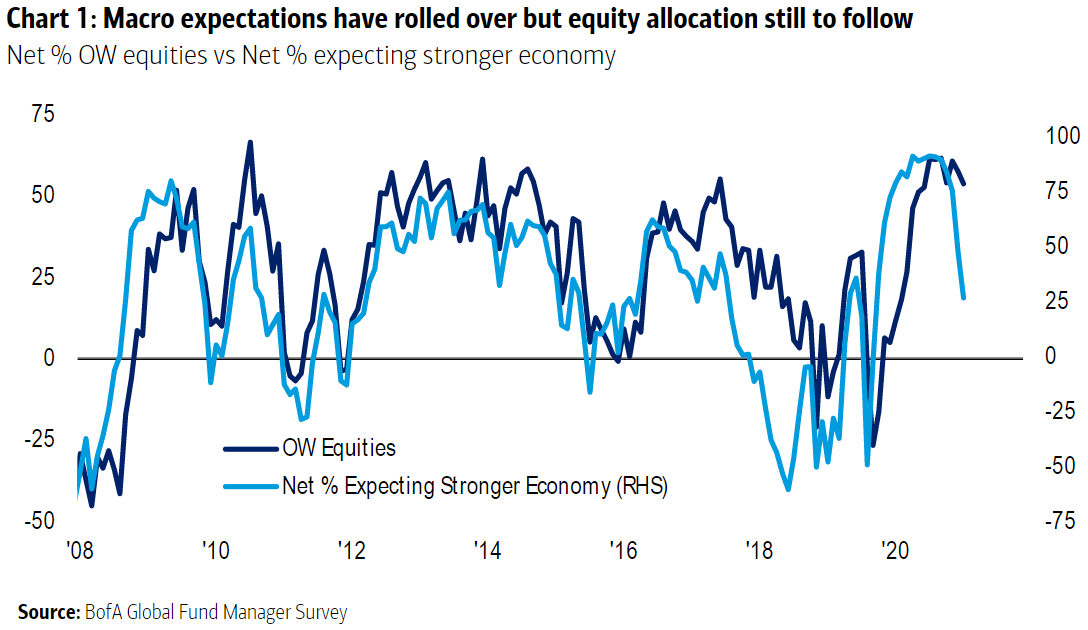
The implications of these themes on price are contradictory; to elaborate, as measures of macro expectations rolled over, in line with companies’ profit expectations, Treasury yields declined, triggering a rotation back into high growth equities.
Graphic: As created by Bank of America Corporation (NYSE: BAC) and shared by Bloomberg, the proportion of fund managers expecting a stronger economy tumbles while the number who are overweight in equities has barely moved.
This comes at the same time a strong July jobs report helped the Federal Reserve (Fed) move toward a consensus on tapering. Given the Fed’s enormous share of the Treasury market, fear of downside equity volatility is apparent; a shift higher in the VIX futures terms structure denotes demand for protection into and through the Jackson Hole Economic Policy Symposium August 26-28, 2021.
“The Fed has fostered a broad range of bubbles because their massive liquidity injections have been trapped in the financial economy,” Rich Bernstein of Richard Bernstein Associates said in a summaryquoted by Bloomberg. “As with any cornered market, there are limited buyers and prices fall as the “cornerer” sells. Accordingly, bond prices seem likely to fall (interest rates rise) [as the] Fed reduces its cornered positions. Rising interest rates could be the kryptonite to the bubble in long-duration assets (long-term bonds, technology, innovation, disruption, bitcoin, etc.).”
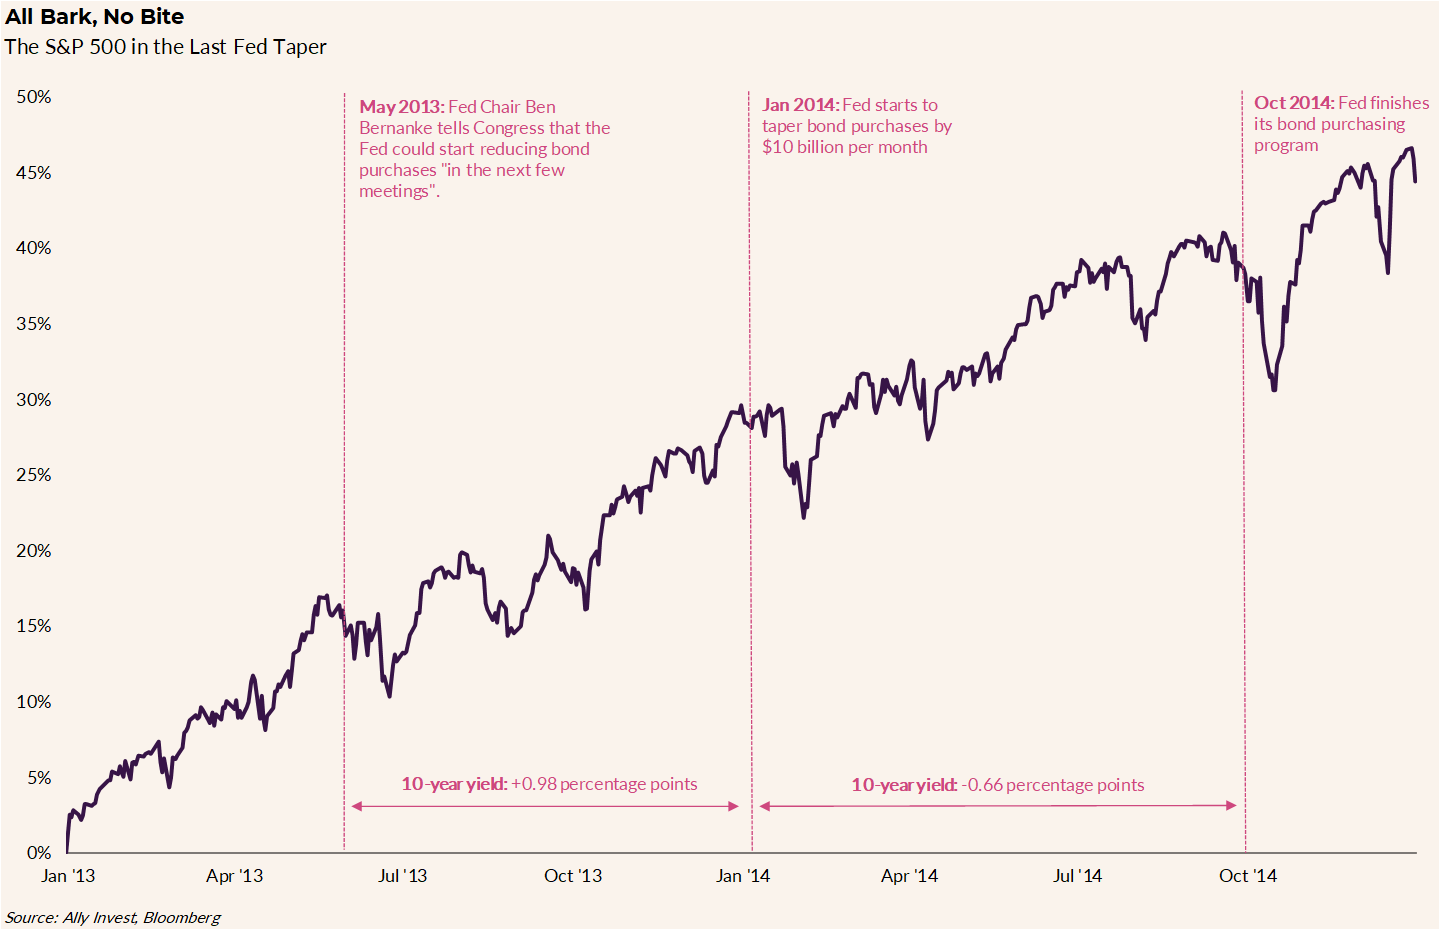
Obviously, tapering may have major repercussions. However, to balance our expectations, looking back to 2014, when the Fed was scaling back bond purchases, the S&P 500 rose over 10% and rates fell after spiking initially.
Graphic: Ally Financial Inc-owned (NYSE: ALLY) Ally Invest unpacks 2014 taper of Federal Reserve bond buying.
Ally Invest’s chief investment strategist Lindsey Bell concludes: “Conditions may not be perfect, but they could be strong enough to move from a wheelchair to some heavy-duty crutches, especially if it means keeping overheating symptoms like inflation at bay.”
Regardless, major risks remain given the growth of derivatives and the potential for offsides positioning. Even the slightest reduction in the Federal Reserve’s balance sheet – the removal of liquidity – may prompt a cascading reaction that exacerbates underlying price movements.
As Kai Volatility’s Cem Karsan once told me for a Benzinga article: “It’s not a coincidence that the mid-February to mid-March 2020 downturn literally started the day after February expiration and ended the day of March quarterly expiration. These derivatives are incredibly embedded in how the tail reacts and there’s not enough liquidity, given the leverage, if the Fed were to taper.”
Moreover, for next week, given expectations of heightenedvolatility, participants may make use of the following frameworks.
In the best case, the S&P 500 trades sideways or higher; activity above the $4,437.75 high volume area (HVNode) pivot puts in play the $4,463.75 low volume area (LVNode). Initiative trade beyond the LVNode could reach as high as the $4,476.50 overnight high (ONH) and $4,511.50 Fibonacci extension, or higher.
In the worst case, the S&P 500 trades lower; activity below the $4,437.75 HVNode puts in play the $4,415.75 LVNode. Initiative trade beyond the LVNode could reach as low as $4,393.75 micro composite point of control (MCPOC) and $4,365.25 LVNode, or lower.
Overnight Rally Highs (Lows): Typically, there is a low historical probability associated with overnight rally-highs (lows) ending the upside (downside) discovery process.

Volume Areas: A structurally sound market will build on past areas of high volume. Should the market trend for long periods of time, it will lack sound structure (identified as a low volume area which denotes directional conviction and ought to offer support on any test).

If participants were to auction and find acceptance into areas of prior low volume, then future discovery ought to be volatile and quick as participants look to areas of high volume for favorable entry or exit.
Graphic: 65-minute profile chart of the Micro E-mini S&P 500 Futures updated 12:30 PM ET Sunday.
News And Analysis
Moody’s discusses taper – maybe this year, maybe not.
Single-family home construction the highest since 2007.
Fannie Mae says COVID-19 surge won’t impact growth.
Goldman Sachs cut its U.S. growth forecast on the virus.
APAC corporate rating recovery may stall as cases rise.
Wall Street is just as baffled about markets as last year.
Canadian inflation has risen to 3.7%, troubling Trudeau.
Powell second term approval boosted by Yellen backing.
A gaping 10-year bond call reveals growth uncertainties.
Michael Burry of ‘Big Short’ bet against ARK Invest ETF.
Outcry rises after White House looks to quell gas prices.
Big risks and trends facing banks globally and regionally.
Could a Western U.S. drought threaten municipal credit.
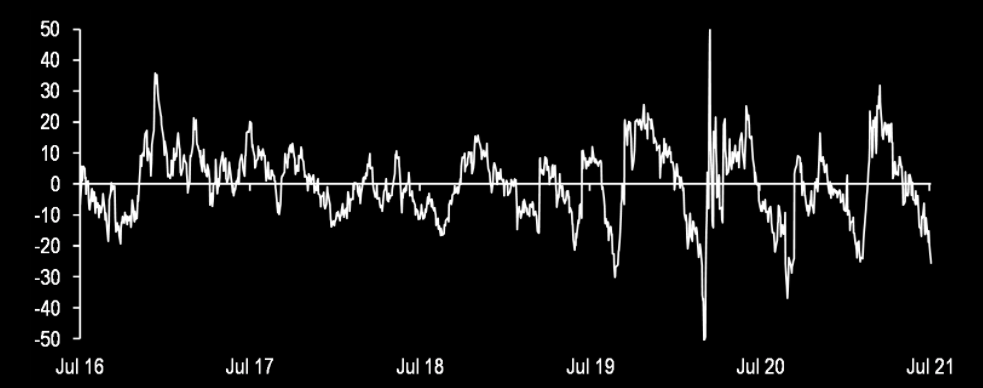
Bulls need to take the price quickly (in few trading sessions) to 225 levels. Any hesitation to rebound from support will send weak signal and "can" risk breaking down the horizontal support around 2100. $RUTpic.twitter.com/UVT3BwJibJ
Every trader has a plan, but what separates good traders from bad traders is how they execute their plan & how they deal with changing conditions when the market environment changes. I also share my thoughts on #ES_F & #ETH in this #developyouredge
After years of self-education, strategy development, and trial-and-error, Renato Leonard Capelj began trading full-time and founded Physik Invest to detail his methods, research, and performance in the markets.
Additionally, Capelj is a finance and technology reporter. Some of his biggest works include interviews with leaders such as John Chambers, founder and CEO, JC2 Ventures, Kevin O’Leary, businessman and Shark Tank host, Catherine Wood, CEO and CIO, ARK Invest, among others.
Disclaimer
At this time, Physik Invest does not manage outside capital and is not licensed. In no way should the materials herein be construed as advice. Derivatives carry a substantial risk of loss. All content is for informational purposes only.
Editor’s Note: On Thursday (8/5) and Friday (8/6) there will be no Daily Brief newsletter. Additionally, there will be no Weekly Brief Sunday (8/8), either. All commentaries to resume August 9, 2021.
Market Commentary
Equity index futures trade higher ahead of key fundamental events.
Worry dwindles and volatility ebbs.
Ahead: Data on jobs and services.
A mixed bag. Positioned for higher.
What Happened: U.S. stock index futures auctioned higher and sideways as participants discounted drivers like the COVID-19 coronavirus and China clampdown.
At the same time, earnings are robust and stimulus remains in play; “Aside from the healthy earnings outlook, we also see equities being supported by continued monetary stimulus from the Federal Reserve and the attractiveness of stocks relative to low bond yields,” said Mark Haefele of UBS Group AG (NYSE: UBS). “Cyclicals are expected to benefit from the shift in consumer spending away from pandemic winners such as mega-cap tech.”
Ahead is data on ADP employment, Markit services PMI, and the ISM services index.
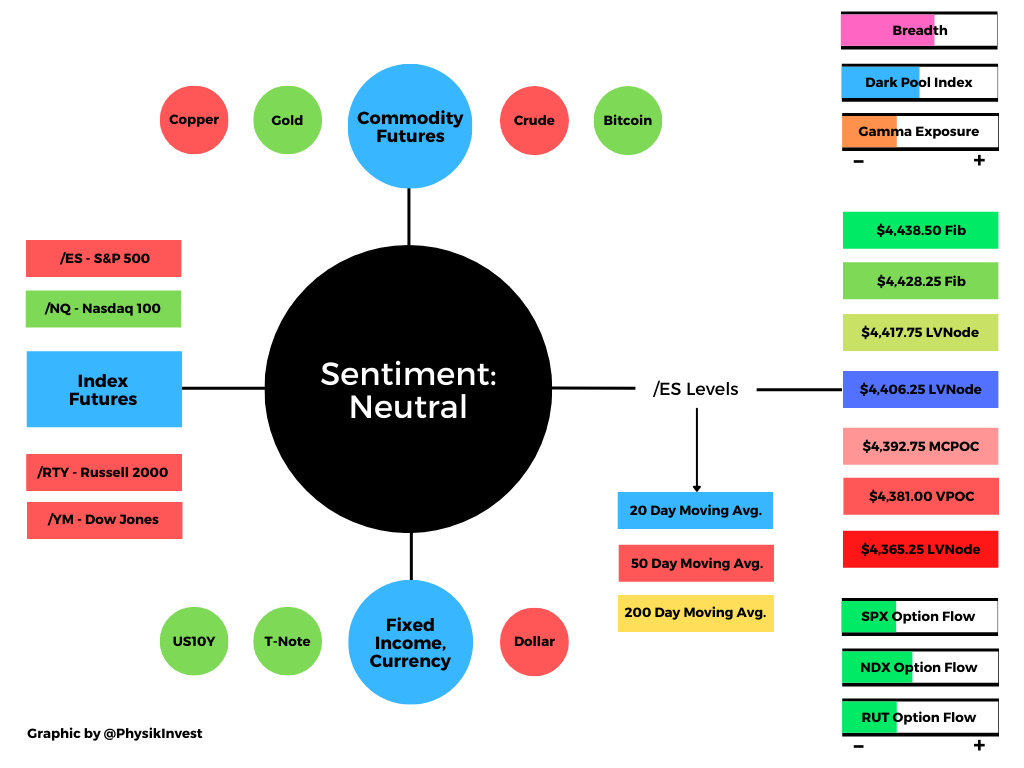
Graphic updated 6:30 AM ET. Sentiment Neutral if expected /ES open is inside of the prior day’s range. See here for more on the Dark Pool Index and Gamma. A positive Dark Pool Index reading is bullish. At the same time, the higher (lower) the gamma, the less (more) volatility. SHIFT Search data used for options activity. Note that options flow is sorted by the call premium spent; if green and more (less) positive then more (less) was spent on call options. Breadth reflects a reading of the prior day’s Advance/Decline indicator.
What To Expect: As of 6:30 AM ET, Wednesday’s regular session (9:30 AM – 4:00 PM EST) in the S&P 500 will likely open just inside of prior-range and -value, suggesting a limited potential for immediate directional opportunity.
Adding, during the prior day’s regular trade, the best case outcome occurred after a repair of the $4,370.50 minimal excess low; after testing the low (a level which corresponded with a volume-weighted average price or VWAP anchored from the July 19 swing low), responsive buyers initiated a rally that pushed prices to a higher close, away from value.
Excess: A proper end to price discovery; the market travels too far while advertising prices. Responsive, other-timeframe (OTF) participants aggressively enter the market, leaving tails or gaps which denote unfair prices.

More On Volume-Weighted Average Prices (VWAPs): A metric highly regarded by chief investment officers, among other participants, for quality of trade. Additionally, liquidity algorithms are benchmarked and programmed to buy and sell around VWAPs.
In doing so, participants negated all of Monday’s selling which, as stated Tuesday, was not supported by value or strong metrics with respect to breadth and market liquidity.
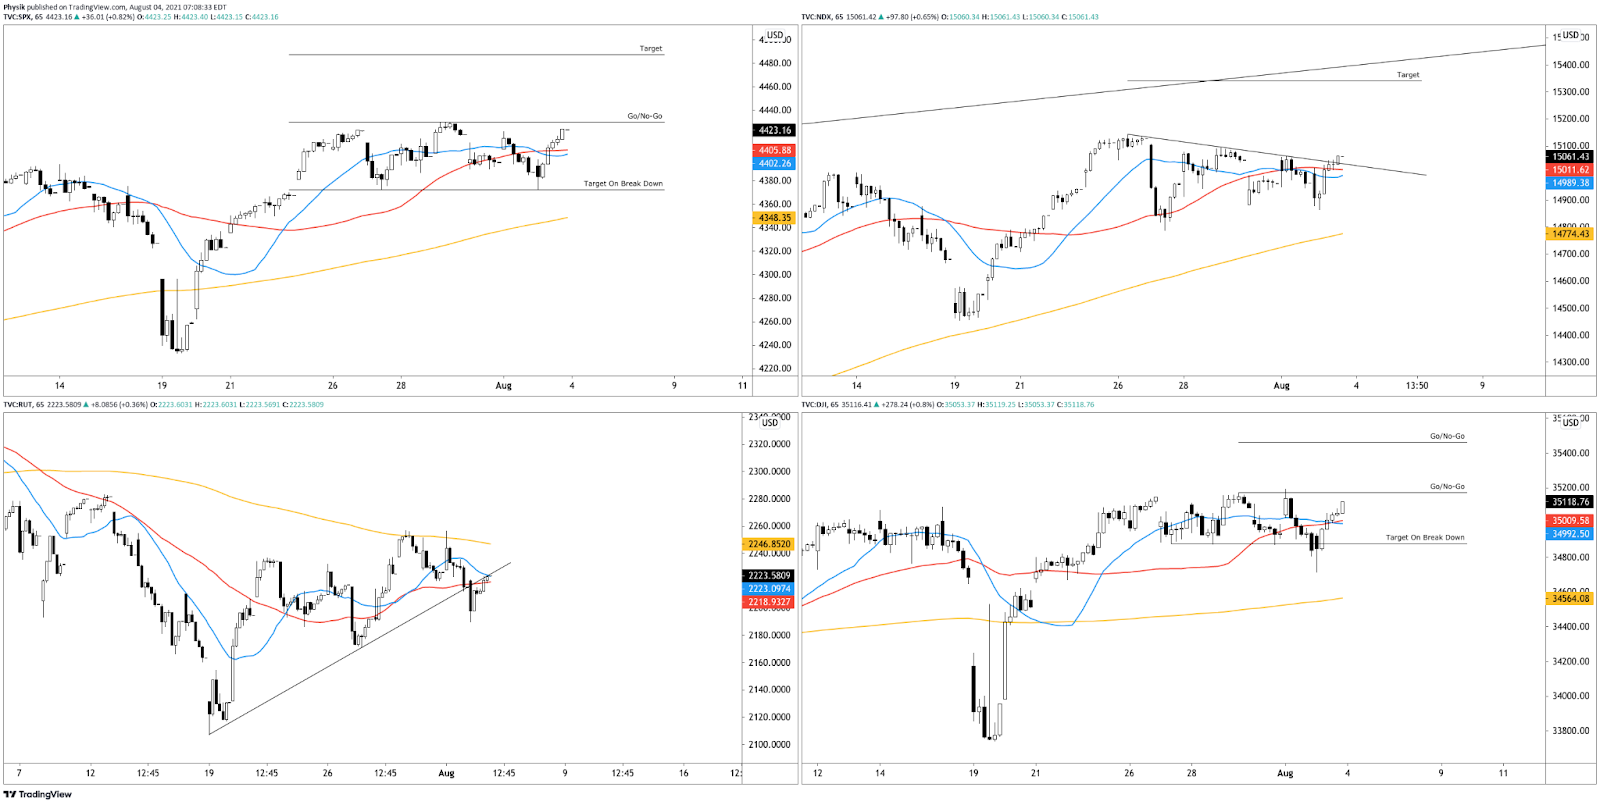
Coming into today’s session, opportunity resides in the S&P 500, Nasdaq 100, and Dow Jones Industrial Average; indices are trading at key go/no-go levels.
Further up movement puts in play balance-area breakouts. In such a case, the modus operandi shifts from responsive trade (i.e., fade the edges) to initiative trade (i.e., play the break). Failure to expand range portends a rotation back into balance.
Balance (Two-Timeframe Or Bracket): Rotational trade that denotes current prices offer favorable entry and exit. Balance-areas make it easy to spot a change in the market (i.e., the transition from two-time frame trade, or balance, to one-time frame trade, or trend).
Below are some rough levels to base expectations around. The width of the balance area, projected off the high end of the balance, is the typical target in such a breakout (e.g., $4,490 SPX cash).
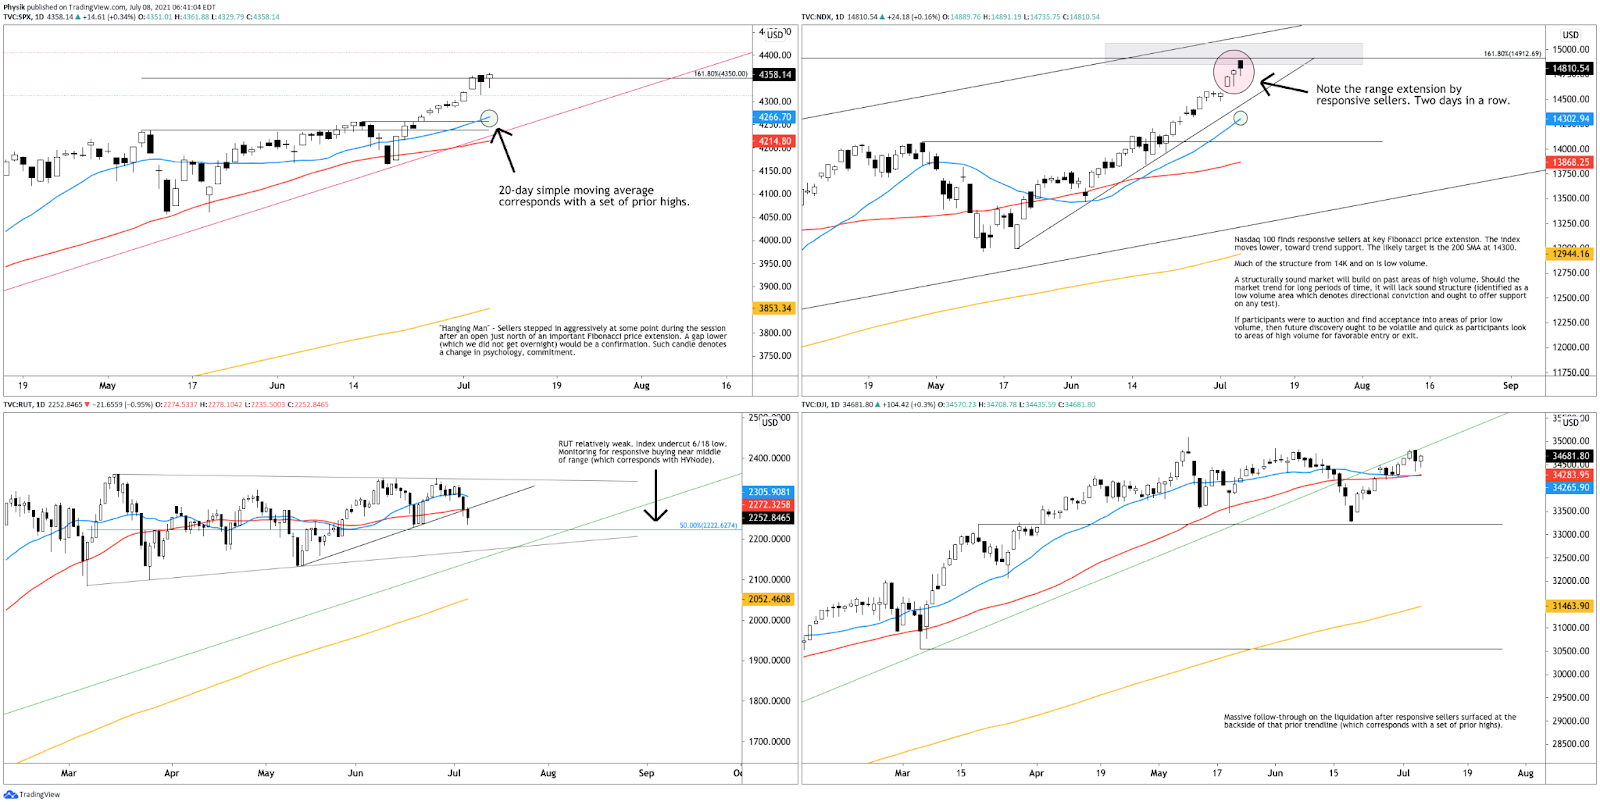
Graphic: 65-minute candlestick charts of the cash-settled S&P 500 (INDEX: SPX), Nasdaq 100 (INDEX: NDX), Russell 2000 (INDEX: RUT), and Dow Jones Industrial Average (INDEX: DJI).
Moreover, for today, participants can trade from the following frameworks.
In the best case, the S&P 500 trades sideways or higher; activity above the $4,406.25 low volume area (LVNode) pivot puts in play the $4,417.75 LVNode. Initiative trade beyond the $4,417.75 LVNode could reach as high as the $4,428.25 and $4,438.50 Fibonacci price extensions.
In the worst case, the S&P 500 trades lower; activity below the $4,406.25 LVNode puts in play the $4,392.75 micro-composite point of control (MCPOC). Initiative trade beyond the MCPOC could reach as low as the $4,381.75 untested point of control (VPOC) and $4,365.25 LVNode.
Volume Areas: A structurally sound market will build on past areas of high volume. Should the market trend for long periods of time, it will lack sound structure (identified as a low volume area which denotes directional conviction and ought to offer support on any test).

If participants were to auction and find acceptance into areas of prior low volume, then future discovery ought to be volatile and quick as participants look to areas of high volume for favorable entry or exit.

POCs: POCs are valuable as they denote areas where two-sided trade was most prevalent. Participants will respond to future tests of value as they offer favorable entry and exit.
Graphic: 65-minute profile chart of the Micro E-mini S&P 500 Futures. Graphic updated 6:30 AM ET.
News And Analysis
Markets primed for Powell second term at risk from surprise pick.
China typhoons create latest supply-chain threat as ports close.
Economic data positive for risk but business cycle risks building.
New York City to require proof of vaccination for indoor activities.
Asia-Pacific on track for a strong rebound although scars will last.
What People Are Saying
The $QQQ once again found buyers at the conjunction of the VWAPs anchored from the mid July high and low of the month. Today's low also tested the rising 20DMA pic.twitter.com/WCkU6lELwI
After years of self-education, strategy development, and trial-and-error, Renato Leonard Capelj began trading full-time and founded Physik Invest to detail his methods, research, and performance in the markets.
Additionally, Capelj is a finance and technology reporter. Some of his biggest works include interviews with leaders such as John Chambers, founder and CEO, JC2 Ventures, Kevin O’Leary, businessman and Shark Tank host, Catherine Wood, CEO and CIO, ARK Invest, among others.
Disclaimer
At this time, Physik Invest does not manage outside capital and is not licensed. In no way should the materials herein be construed as advice. Derivatives carry a substantial risk of loss. All content is for informational purposes only.
Equity index futures explore lower prices, widening a developing balance area.
Traders edgy over virus variant, Fed action.
Ahead is data on jobs and consumer credit.
Internal divergence resolved in lower prices.
What Happened: U.S. stock index futures liquidated as participants sought to price in anxieties surrounding the spread of COVID-19 variants as well as an evolution in monetary policy.
“Worries about variant strains have hurt investor confidence that the pandemic’s effects on the global economy are truly past us,” Nicholas Colas and Jessica Rabe of DataTrek Research wrote in a note cited by Bloomberg. “Our working theory is that we’re in the middle of a modest global growth scare.”
Today, also, participants get data on initial and continued jobless claims, as well as consumer credit.
Graphic updated 6:58 AM ET.
What To Expect: Thursday’s regular session (9:30 AM – 4:00 PM EST) in the S&P 500 will likely open outside of prior-range and -value, suggesting a potential for immediate directional opportunity. Balance-break and gap scenarios are in play.
Balance-Break and/or Gap Scenarios: Monitor for acceptance (i.e., more than 1-hour of trade) outside of the balance area.

Gaps ought to fill quickly. Should they not, that’s a signal of strength; do not fade. Leaving value behind on a gap-fill or failing to fill a gap (i.e., remaining outside of the prior session’s range) is a go-with indicator.

Auctioning and spending at least 1-hour of trade back in the prior range suggests a lack of conviction; in such a case, do not follow the direction of the most recent initiative activity.
Further, the overnight liquidation comes after participants had a tough time establishing value at higher prices. Despite steady exploration in days prior, internal divergences via breadth metrics, became more pronounced, while profile dynamics revealed weak commitment at higher prices and an abundance of poor structures (e.g., low-volume areas).
Graphic: Equity index leaders rose in price as internal divergences – like the ratio of advancers to decliners – grew. Noting a bigger divergence in internals tracking Nasdaq issues. Graphic: Nasdaq-100 constituents fail to participate in price rise, via The Market Ear.
Also, yesterday, Federal Reserve officials, as evidenced by meeting minutes, were not yet ready to communicate their timeline for scaling back asset purchases.
“The committee’s standard of ‘substantial further progress’ was generally seen as not having yet been met, though participants expected progress to continue,” according to minutes from the June 15-16 Federal Open Market Committee meeting published Wednesday. “Various participants mentioned that they expected the conditions for beginning to reduce the pace of asset purchases to be met somewhat earlier than they had anticipated at previous meetings.”
Following closely after, rates on the 10 Year T-Note moved into trend support. Though usually perceived as a boon for stocks – especially growth names – as low rates have to potential to increase the present value of future earnings, all major equity indexes are off their highs.
Graphic: Treasury yields nearly three standard deviations below their mode-implied fair value, via The Market Ear.
Regardless of the cause – comments by the Fed, in addition to the spread of COVID-19 variants, geopolitical tensions, among other things – for today, participants can trade from the following frameworks.
In the best case, the S&P 500 trades sideways or higher; activity above the $4,285.00 micro-composite high volume area (HVNode), a pivot, participants may look for responses at the $4,299.00 Point of Control (POC), first. Thereafter, if higher, the $4,317.00 POC, which corresponds with the half-point of the overnight range comes next. If above $4,317.00, lookout. The S&P 500 may auction as high as the $4,340.75 HVNode.
Volume Areas: A structurally sound market will build on past areas of high volume. Should the market trend for long periods of time, it will lack sound structure (identified as a low volume area which denotes directional conviction and ought to offer support on any test).

If participants were to auction and find acceptance into areas of prior low volume, then future discovery ought to be volatile and quick as participants look to areas of high volume for favorable entry or exit.

POCs: POCs are valuable as they denote areas where two-sided trade was most prevalent. Participants will respond to future tests of value as they offer favorable entry and exit.
In the worst case, the S&P 500 trades lower; activity below $4,285.00 puts in play the $4,263.25 low volume area (LVNode). Trade beyond that signpost may reach as low as the $4,247.75 LVNode and $4,229.00 VPOC.
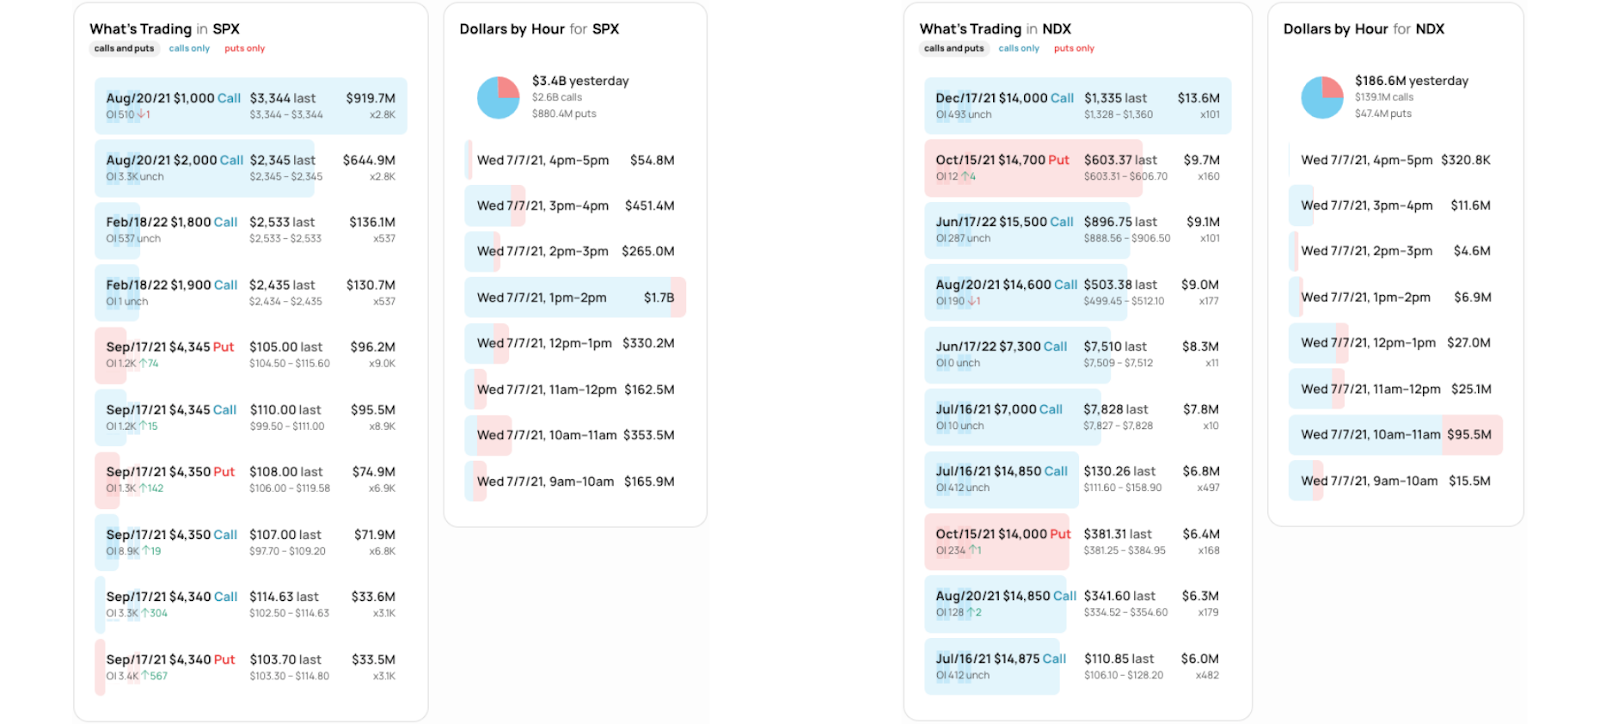
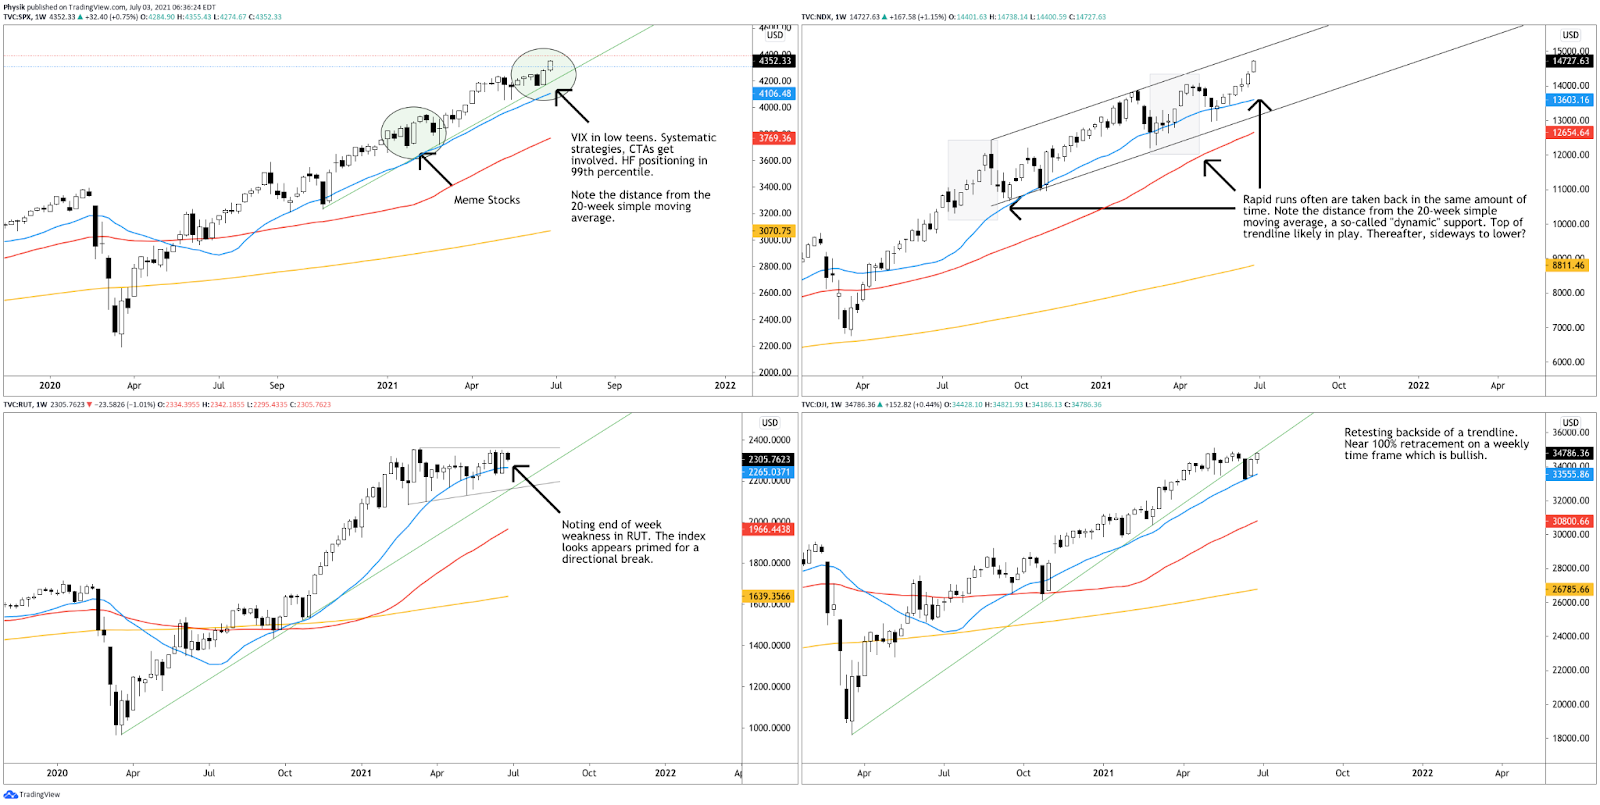
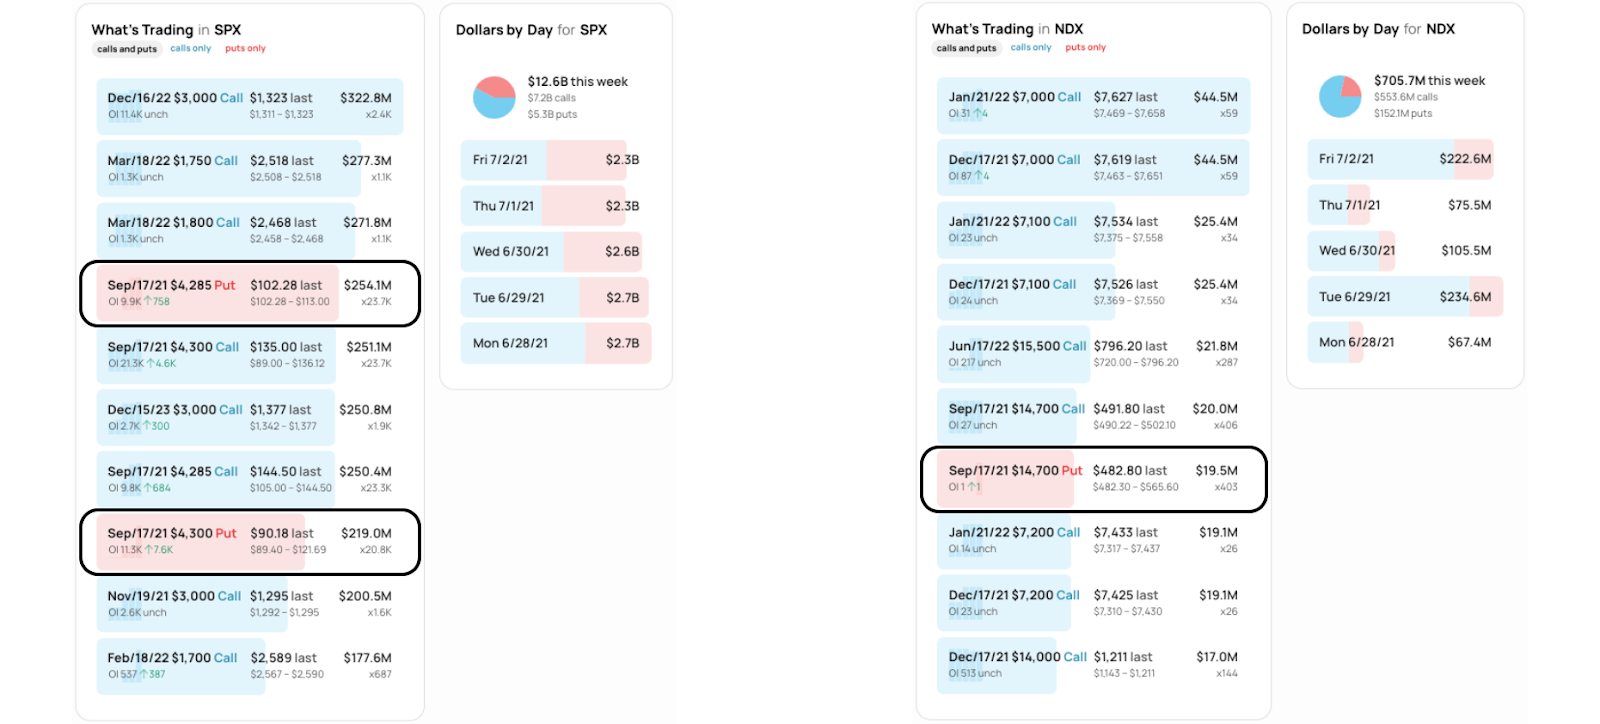
Graphic: 65-minute profile chart of the Micro E-mini S&P 500 Futures.Graphic: Daily candlestick charts of the S&P 500 (top left), Nasdaq 100 (top right), Russell 2000 (bottom left), and Dow Jones Industrial Average (bottom right).Graphic: SHIFT search suggests participants were committing the most capital to call strikes at and below current prices in the cash-settled S&P 500 Index (INDEX: SPX) and Nasdaq 100 (INDEX: NDX), yesterday. This activity may denote (1) stock replacement, (2) hedges for underlying short positions, or (3) speculation on the upside. Also, there was a meaningful bid in longer-dated puts on the S&P 500 and Nasdaq 100. This dynamic suggests participants, despite their commitment to higher prices, are hedging against near-term risks, like the Jackson Hole Economic Symposium.
News And Analysis
Economy | ECB unveils higher inflation goal that tolerates an overshoot. (BBG)
Politics | President Biden to speak on Afghanistan amid swift U.S. pullout. (REU)
Economy | Fed officials are split on easing quantitative easing program. (Axios)
Economy | Rates are down, jobs are up, but mortgage apps still decline. (MND)
Economy | External liquidity strains easing in some APAC economies. (Fitch)
Energy | OPEC gets ‘pass to lift oil prices’ as hedging losses hobble U.S. (FT)
COVID | Europe’s summer in peril as France warns on Spain, Portugal. (BBG)
Economy | Quest to define post-crisis global economic order is gaining. (BBG)
COVID | Tokyo games to go without fans as Japan declares emergency. (BBG)
What People Are Saying
Don't let them fool you guys…
there have been divergences now for 3 wks & if you went to cash 3 weeks ago, you would have missed the SPX +2.4% and QQQ +5% since then
U.S. TREASURY YIELD CURVE is flattening as traders anticipate the Federal Reserve will curb its bond buying programme and raise interest earlier than before as a result of the stronger-than-expected recovery in the economy and concerns about inflationary pressure: pic.twitter.com/ltFrN73IMU
Markets | The LSE had its first direct listing of a technology company. (MM)
About
Renato founded Physik Invest after going through years of self-education, strategy development, and trial-and-error. His work reporting in the finance and technology space, interviewing leaders such as John Chambers, founder, and CEO, JC2 Ventures, Kevin O’Leary, businessman and Shark Tank host, Catherine Wood, CEO and CIO, ARK Invest, among others, afforded him the perspective and know-how very few come by.
Having worked in engineering and majored in economics, Renato is very detailed and analytical. His approach to the markets isn’t built on hope or guessing. Instead, he leverages the unique dynamics of time and volatility to efficiently act on opportunity.
Disclaimer
At this time, Physik Invest does not manage outside capital and is not licensed. In no way should the materials herein be construed as advice. Derivatives carry a substantial risk of loss. All content is for informational purposes only.
Summary: Last week, U.S. stock index futures auctioned sideways to higher into Friday’s employment report. The release showed an addition of 850,000 jobs in June, the strongest employment gain since last summer.
The S&P 500 and Nasdaq 100 led the week-long rally, while the Dow Jones Industrial Average followed closely behind. Though the Russell 2000 did end lower, it has been building energy for a break.
Considerations: It was the beginning of April JPMorgan Chase & Co’s (NYSE: JPM) Jamie Dimon wrote strong consumer savings, an increased pace in COVID-19 coronavirus vaccinations, and unprecedented efforts to spur economic activity could mean that a boom lasts as long as 2023.
Dimon’s comments remain valid. Months after, officials are hard at work in helping the U.S. reach herd immunity with vaccines that produce antibodies for the most well-known variants of COVID-19. Additionally, the economy is making progress toward meeting the Federal Reserve’s objectives for employment and inflation; just a couple of weeks ago the institution brought forward the time frame on when it will raise interest rates.
In a statement, BlackRock strategists noted: “We believe the Fed’s new outlook will not translate into significantly higher policy rates any time soon. This, combined with the powerful restart, underpins our pro-risk stance.”
Alongside that news, the equity market sold violently, into Quadruple Witching, or the large expiry of futures and options. Thereafter, indexes staged a massive reversal, and the CBOE Volatility Index (INDEX: VIX), a measure of the stock market’s expectation of volatility, traded to its lowest level since February 2020.
According to SpotGamma models, up to 50% of the gamma in and across the S&P 500 complex was taken off the table that expiry.
This, as SpotGamma has said in the past, “creates volatility because, as large options positions expire[], are closed and/or rolled, dealers have large hedges they need to adjust.”
Put more simply, the initial action, into the expiry, may have been attributable to the sale of long stock that hedged expiring short exposure above the market (i.e., call side).
After that exposure was cleared, the prospects for a rally improved, boosted by the buying back of short put hedges as volatility imploded.
Last week, though, things became a tad frothy with the number of put options sold-to-open seeing heightened levels.
Graphic: SpotGamma’s analysis suggests equity put options were sold-to-open (red arrow).
Put sales, which can be part of sophisticated volatility-based trading strategies, often suggest increased confidence as market participants look to options for income, and not insurance.
Historically, the returns after such developments are mixed; more often the appearance of strong initiative buying surfaces (e.g., August and January 2020) before a liquidation helps correct excess inventory, and bring sense back into the market.
Kris Sidial – co-chief investment officer at The Ambrus Group, a volatility arbitrage fund – and I recently held a conversation regarding meme stock volatility, market structure, and regulation. He noted that ongoing risk-on dynamics can be traced back to factors like Federal Reserve stabilization efforts, and low rates, which incentivize risk-taking.
“The growth of structured products, passive investing, the regulatory standpoint that’s been implemented with Dodd-Frank and dealers needing to hedge off their risk more frequently, than not,” are all part of a regime change that’s affected the stability of markets, Sidial notes. “These dislocations happen quite frequently in small windows, and it offers the potential for large outlier events,” like the equity bust and boom during 2020. “Strength and fragility are two completely different components. The market could be strong, but fragile.”
That dynamic is playing out as Cem Karsan, founder at Kai Volatility, notes volatility is dramatically oversupplied. As a result, as implied volatility drops, options gamma – an option delta’s sensitivity to market price changes – rises. Associated hedging forces make it so there’s more liquidity and less movement. In other words, the market tends to pin.
As realized volatility falls from its peak around a year ago, more sold SPX options cluster at strikes nearer to spot. And as implied volatility falls with it, the gamma of those options increases.
More dealer long gamma means more liquidity. More liquidity means less movement. pic.twitter.com/712OAMq7iP
Still, in line with Sidial’s comments, Karsan believes expected distributions are fat-tailed, given “fragility.” In other words, it’s hard for the market to unpin. Should it unpin, however, there’s “not enough liquidity” to absorb leverage on the tails.
Given this, Karsan finds it interesting to sell at-the-money option structures to fund out-of-the-money structures. Alternatively, knowing what forces – e.g., charm or the rate at which the delta of an option changes with respect to time – decay poses on so-called “dealer positioning,” going into the July option expirations (OPEX), one could look into long calendar put spreads on the S&P 500.
In such a case, traders are short puts in July and long puts on forward. This way, you’re collecting decay as a result of realized pinning. Here’s Karsan’s full take, from the source.
Graphic: The risk profile of a long put calendar spread, via Fidelity.
After mid-July, though, the window for fundamental dynamics (e.g., a shift in preferences from saving and investing to spending, monetary tightening, seasonality, or a COVID-19 resurgence) to take over is opened.
In a note on COVID resurgence, to not venture too far off into the abyss, I cite strategists led by JPMorgan Chase & Co’s (NYSE: JPM) Marko Kolanovic who last year correctly suggested equities would continue rallying on the basis of low rates, improved fundamentals, buybacks, as well as systematic and hedge fund strategies.
“The delta variant should not have significant repercussions for the pandemic situation in developed markets (e.g. Europe and North America, which have [made] strong progress in vaccinations) due to the level of population immunity.”
What To Expect: In the coming sessions, participants will want to focus their attention on where the S&P 500 trades in relation to Friday’s $4,323.00 untested Point of Control (POC).
POCs: POCs are valuable as they denote areas where two-sided trade was most prevalent. Participants will respond to future tests of value as they offer favorable entry and exit.
That said, participants can trade from the following frameworks.
In the best case, the index trades sideways or higher; activity above the $4,323.00 POC puts in play the $4,347.00 excess high. Initiative trade beyond the excess high could reach as high as the $4,357.50 Fibonacci-derived price target.
Excess: A proper end to price discovery; the market travels too far while advertising prices. Responsive, other-timeframe (OTF) participants aggressively enter the market, leaving tails or gaps which denote unfair prices.
In the worst case, the index trades lower; activity below the $4,323.00 POC puts in play the untested POC at $4,299.00, as well as the POC and micro-composite HVNode at $4,285.00. Thereafter, if lower, participants may look for responses at the $4,263.25 LVNode, $4,247.75 LVNode, as well as the $4239.25 HVNode and $4,229.00 POC.
Volume Areas: A structurally sound market will build on past areas of high volume. Should the market trend for long periods of time, it will lack sound structure (identified as a low volume area which denotes directional conviction and ought to offer support on any test).

If participants were to auction and find acceptance into areas of prior low volume, then future discovery ought to be volatile and quick as participants look to areas of high volume for favorable entry or exit.
For a full list of important levels, see the 65-minute profile and candlestick chart, below.
Graphic: 65-minute profile chart of the Micro E-mini S&P 500 Futures.Graphic: Weekly candlestick charts of the S&P 500 (top left), Nasdaq 100 (top right), Russell 2000 (bottom left), and Dow Jones Industrial Average (bottom right).Graphic: SHIFT search suggests participants were committing the most capital to call strikes at and below current prices in the cash-settled S&P 500 Index (INDEX: SPX) and Nasdaq 100 (INDEX: NDX), last week. This activity denotes (1) stock replacement, (2) hedges for underlying short positions, or (3) speculation on the upside. Also, there was a meaningful bid in September puts on the S&P 500 and Nasdaq 100. This dynamic suggests participants, despite their commitment to higher prices, are hedging against near-term risks, like the Jackson Hole Economic Symposium.
News And Analysis
Markets | The premium Elon Musk adds to Tesla, other ventures. (Kyla)
Markets | Forward-looking indicators point to improving credit trends. (S&P)
Travel | TSA screenings surpassed 2019 levels in a pandemic first. (CNBC)
Energy | WH is worried about high oil prices, sees enough supply. (REU)
Energy | An overview of data from IEA’s Energy prices database. (IEA)
Energy | OPEC ends Friday’s meeting without a deal for agreement. (CNBC)
Agriculture | Dry weather damage spells trouble for U.S. spring crops. (S&P)
Economy | States ending jobless benefits early hit labor milestones. (REU)
Markets | Spotlight turning to mergers, acquisition for fintech SPACs. (S&P)
Economy | Jobs gain largest in 10 months; employers up wages. (REU)
Energy | Cal-ISO, utilities ask consumers to conserve amid heatwave. (S&P)
Markets | Record S&P 500 masks fear trade gripping stock market. (BBG)
Innovation And Emerging Trends
FinTech | BTC mining now easier, more profitable after crackdowns. (CNBC)
FinTech | ‘Flight to quality’ as private insurtechs draw big investments. (S&P)
FinTech | Bank customers cement relationships with digital channels. (S&P)
Markets | Money-losing companies sell record stock, flashing signal. (CNBC)
Markets | Wall Street rebels warning of ‘disastrous’ $11T index boom. (BBG)
Mobility | When do electric vehicles become cleaner than gas cars? (REU)
About
Renato founded Physik Invest after going through years of self-education, strategy development, and trial-and-error. His work reporting in the finance and technology space, interviewing leaders such as John Chambers, founder, and CEO, JC2 Ventures, Kevin O’Leary, businessman and Shark Tank host, Catherine Wood, CEO and CIO, ARK Invest, among others, afforded him the perspective and know-how very few come by.
Having worked in engineering and majored in economics, Renato is very detailed and analytical. His approach to the markets isn’t built on hope or guessing. Instead, he leverages the unique dynamics of time and volatility to efficiently act on opportunity.
Disclaimer
At this time, Physik Invest does not manage outside capital and is not licensed. In no way should the materials herein be construed as advice. Derivatives carry a substantial risk of loss. All content is for informational purposes only.