Categories
Commentary

Daily Brief For September 15, 2022

The daily brief is a free glimpse into the prevailing fundamental and technical drivers of U.S. equity market products. Join the 900+ that read this report daily, below!

Graphic updated 7:45 AM ET. Sentiment Neutral if expected /ES open is inside of the prior day’s range. /ES levels are derived from the profile graphic at the bottom of the following section. Levels may have changed since initially quoted; click here for the latest levels. SqueezeMetrics Dark Pool Index (DIX) and Gamma (GEX) calculations are based on where the prior day’s reading falls with respect to the MAX and MIN of all occurrences available. A higher DIX is bullish. At the same time, the lower the GEX, the more (expected) volatility. Learn the implications of volatility, direction, and moneyness. Breadth reflects a reading of the prior day’s NYSE Advance/Decline indicator. VIX reflects a current reading of the CBOE Volatility Index (INDEX: VIX) from 0-100.

Administrative

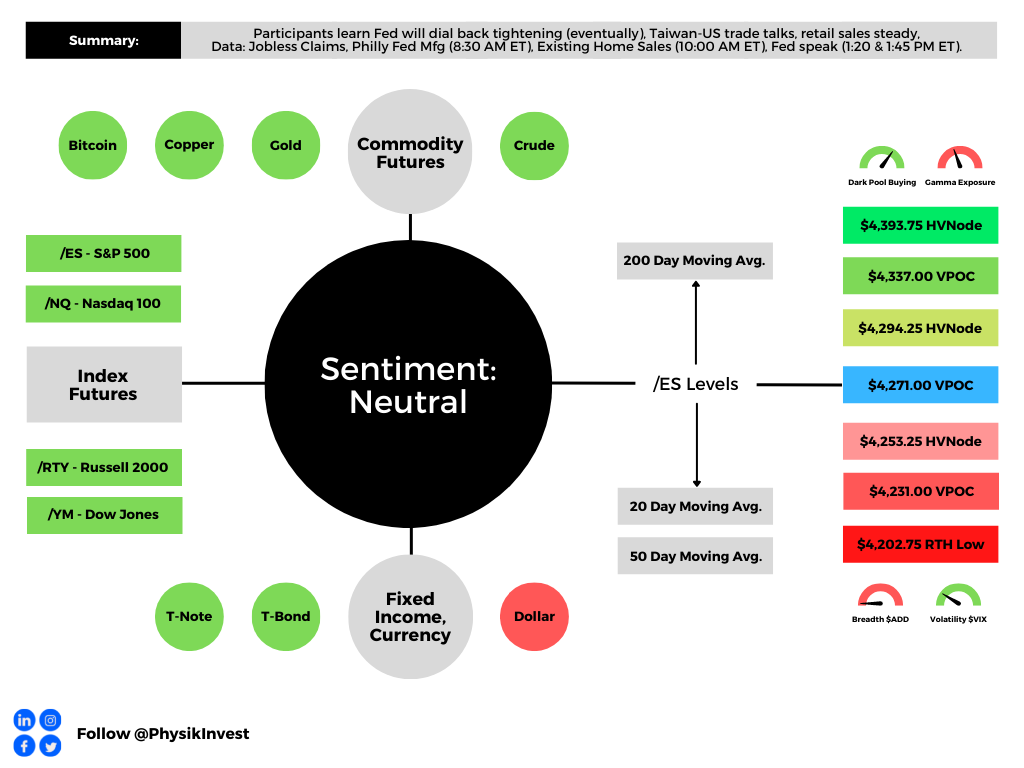
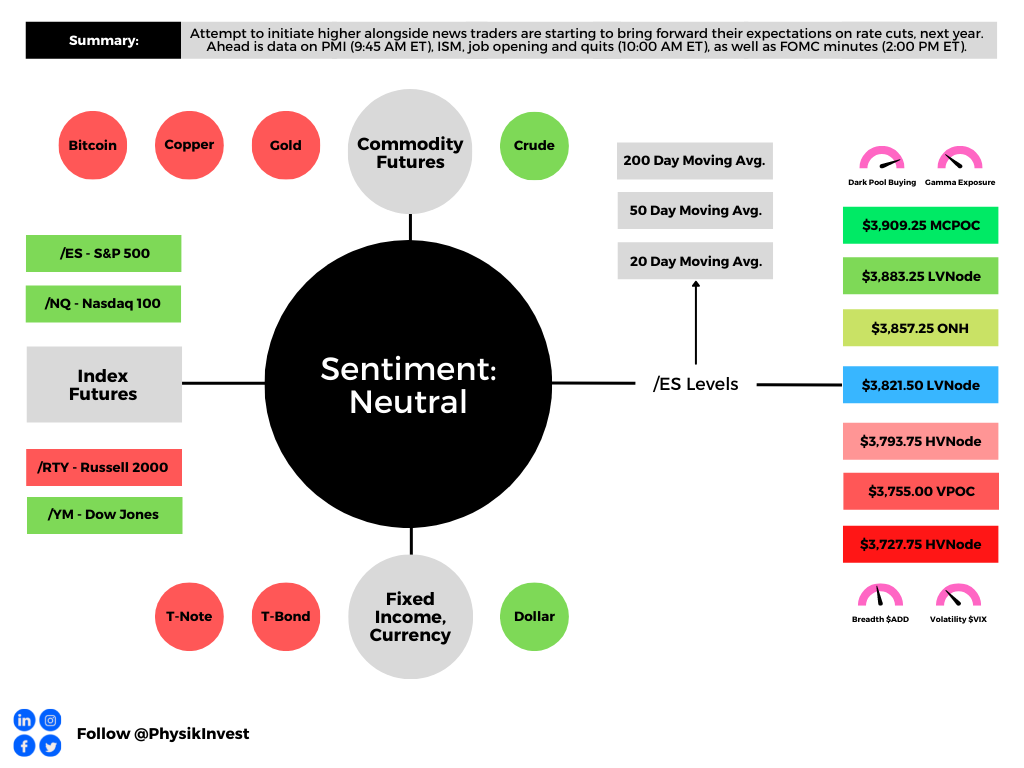
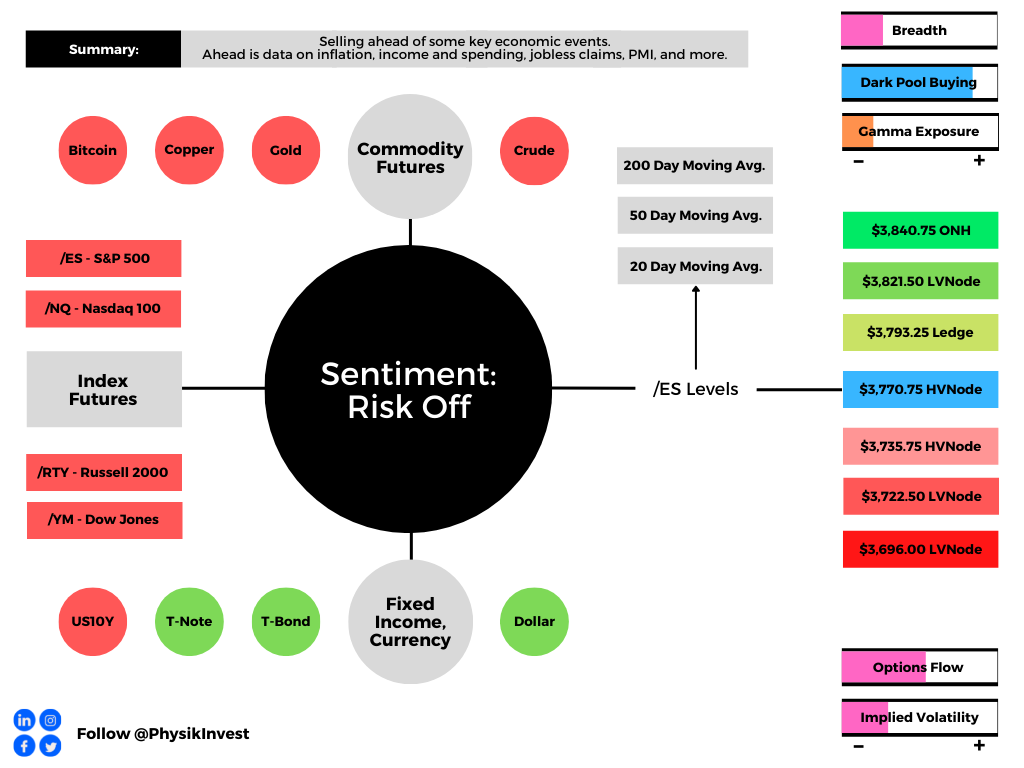
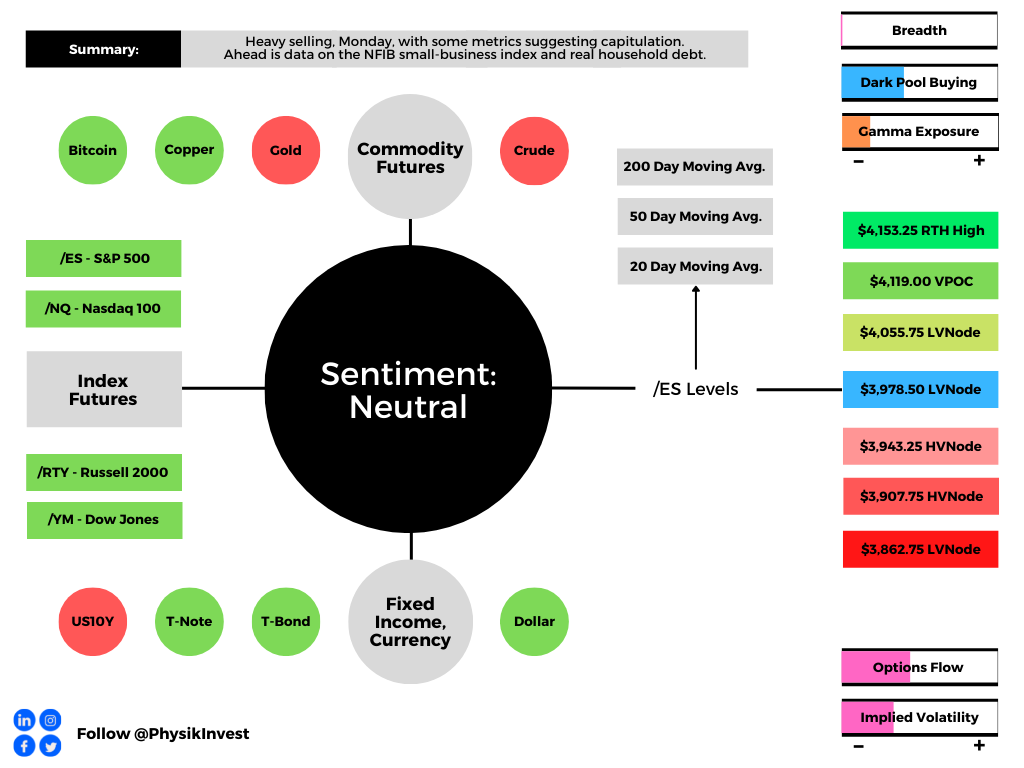
Apologies – yesterday the above graphic was not properly updated. The sentiment reading was incorrect, as were a couple of other figures. Separately, a lighter note, today, followed by more in-depth stuff currently being worked on in the coming sessions. Thanks!

Fundamental

First – going to refer everyone to yesterday’s letter, a conversation between Joseph Wang and Andy Constan, as well as some updates Cem Karsan of Kai Volatility made. That is, in part, a primer for what we will be talking more about, soon.

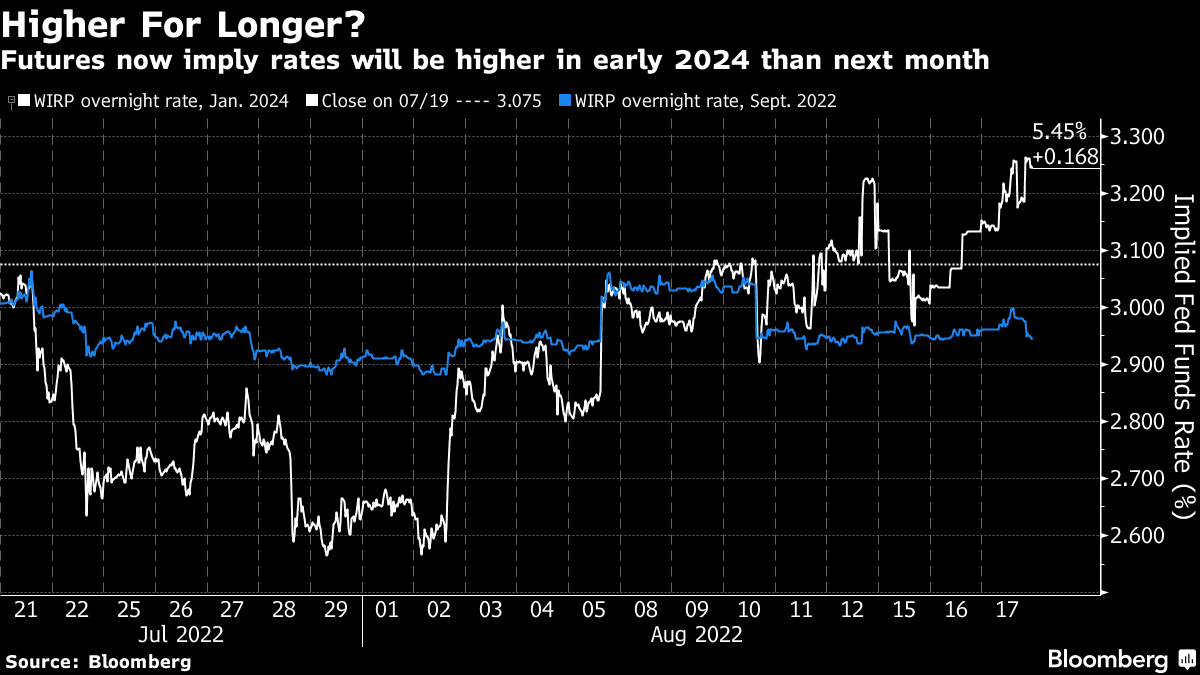
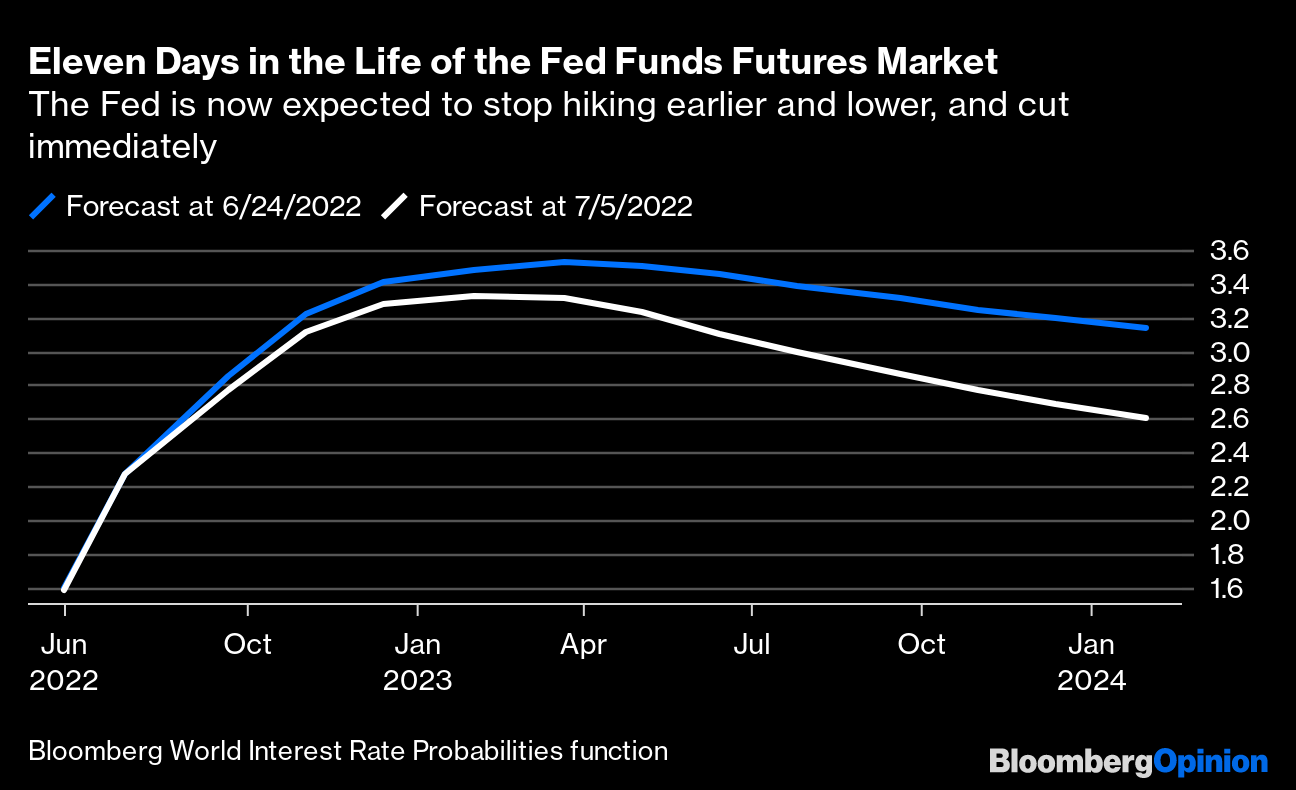
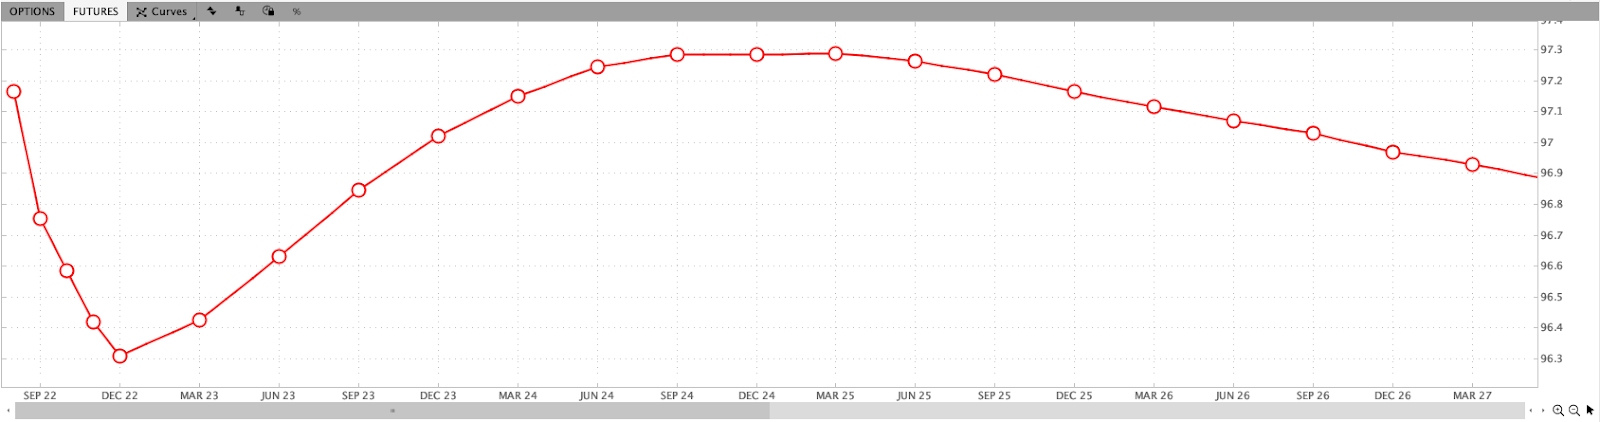
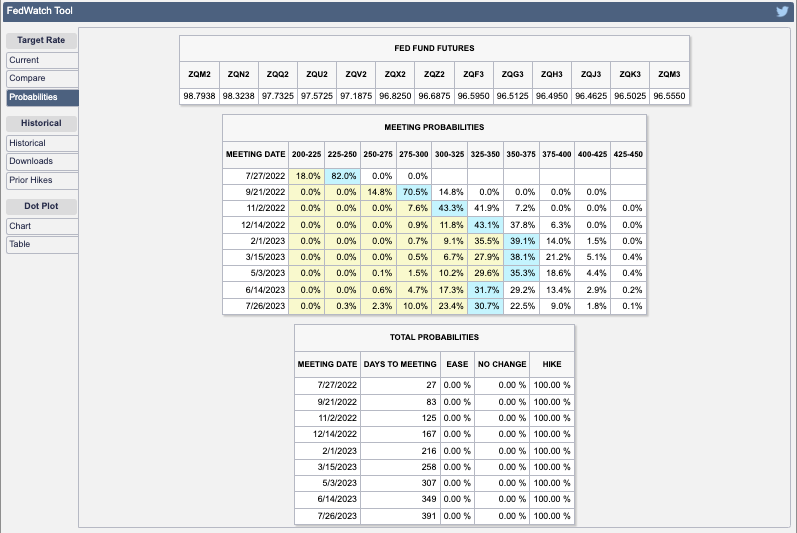
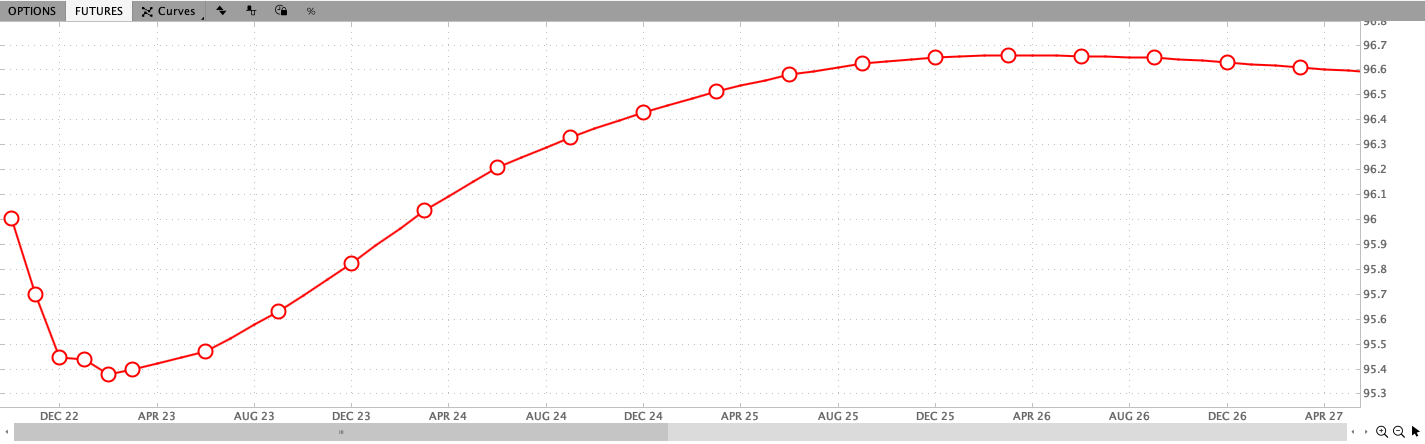
Next – we have futures markets pricing rate a peak in the overnight rate at ~4.6% in February of 2023. From thereon, rate cuts are implied.

Graphic: Via Charles Schwab Corporation’s (NYSE: SCHW) TD Ameritrade thinkorswim. Observed is the Eurodollar, the interest offered on U.S. dollar-denominated deposits held at banks outside of the U.S. (i.e., participants’ outlook on interest rates).

It’s becoming the consensus that “[f]or hikes to reduce inflation, they need to hurt growth,” Jean Boivin and Alex Brazier of BlackRock Inc (NYSE: BLK) explained.

“There is no way around this,” they add. “We estimate it would require a deep recession in the U.S., with around as much as 2% hit to growth in the U.S., and 3 million more unemployed, and an even deeper recession in Europe.”

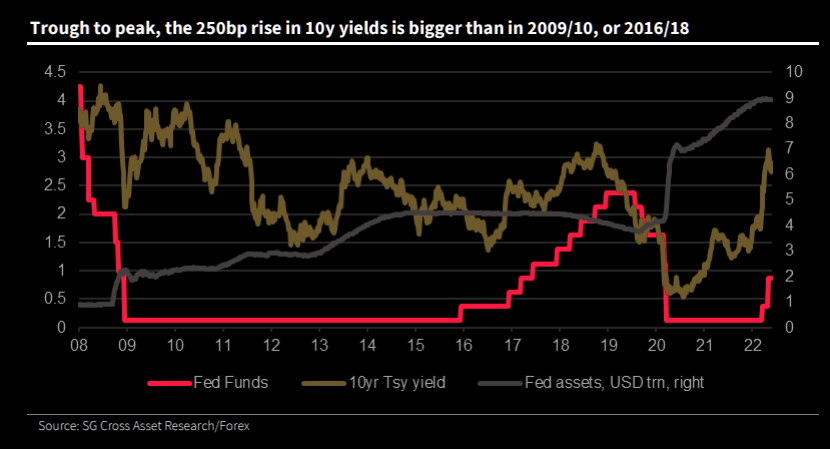
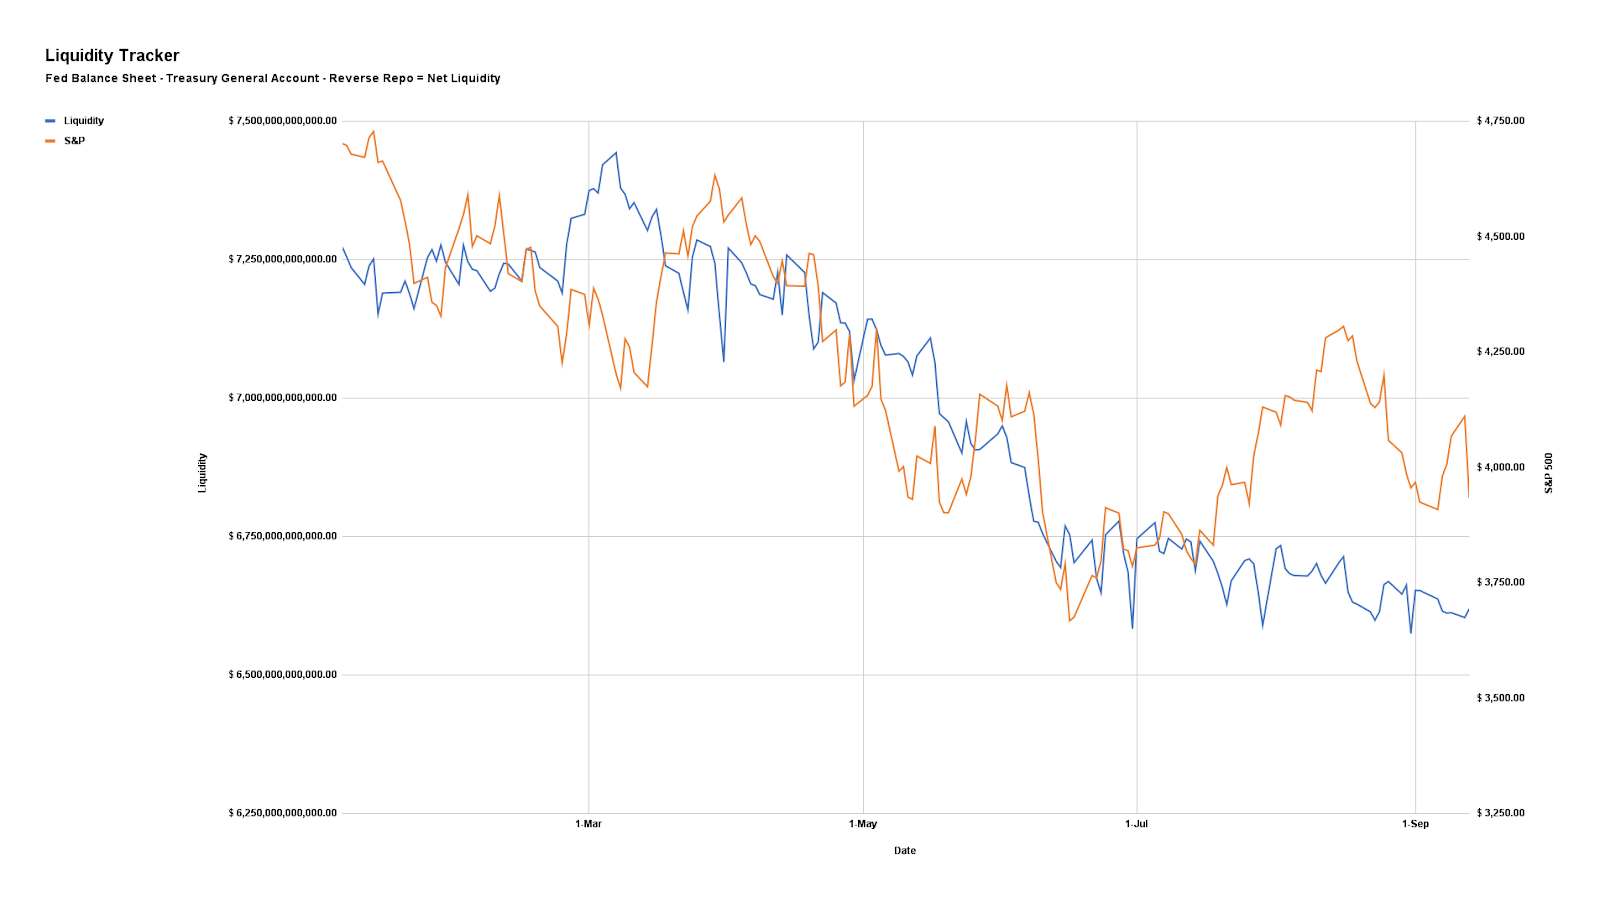
It’s the impact of rising rates and quantitative tightening (the latter which will compound the impacts of the former) that are part of the toolkit used to cool the sticky inflation.

Graphic: Via Physik Invest. Data compiled by @jkonopas623. Fed Balance Sheet data, here. Treasury General Account Data, here. Reverse Repo data, here. NL = BS – TGA – RRP.

Ray Dalio, of Bridgewater Associates LP, said that rates rising “toward the higher end of the 4.5% to 6% range … will bring private sector credit growth down, which will bring private sector spending and, hence, the economy down with it.”

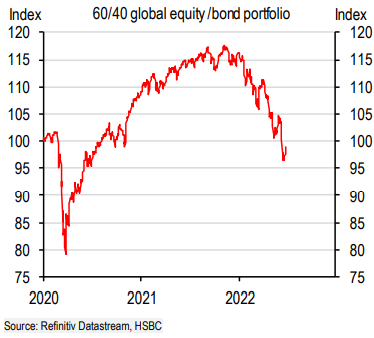
Accordingly, equity prices could plunge upwards of 20%, as a result.

Graphic: Retrieved from Bloomberg via Michael J. Kramer. “What is amazing is how expensive this market is relative to rates. The spread between the S&P 500 Earnings yield and the 10-Yr nominal rate is at multi-year lows.”

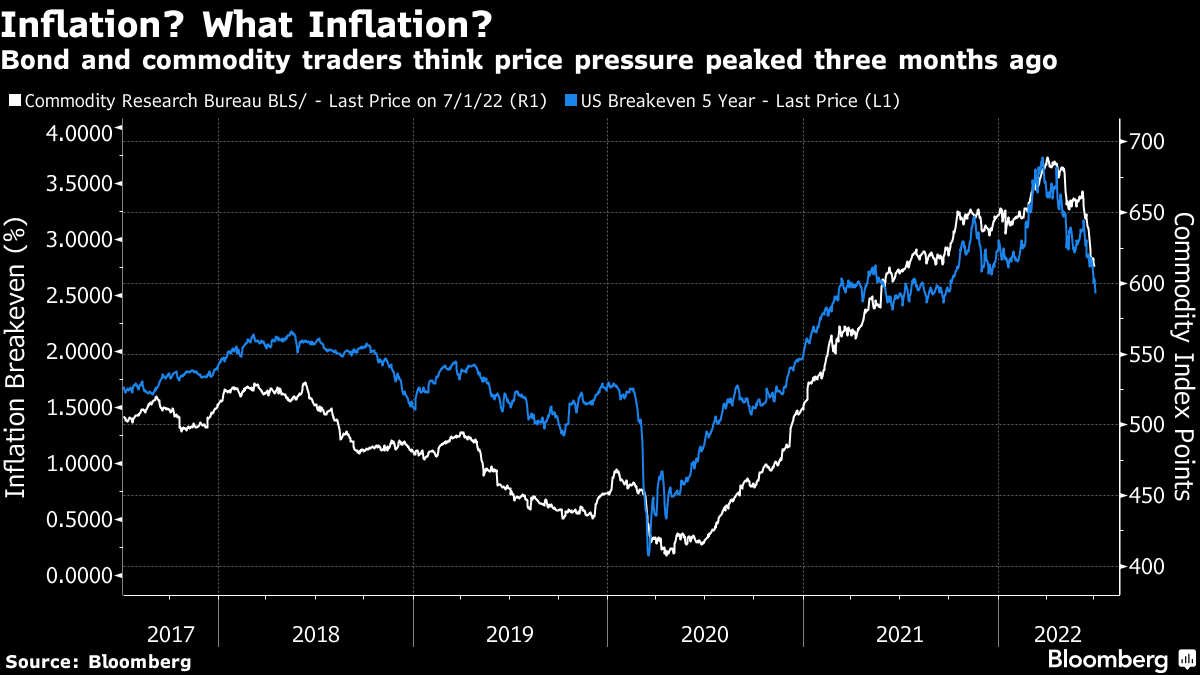
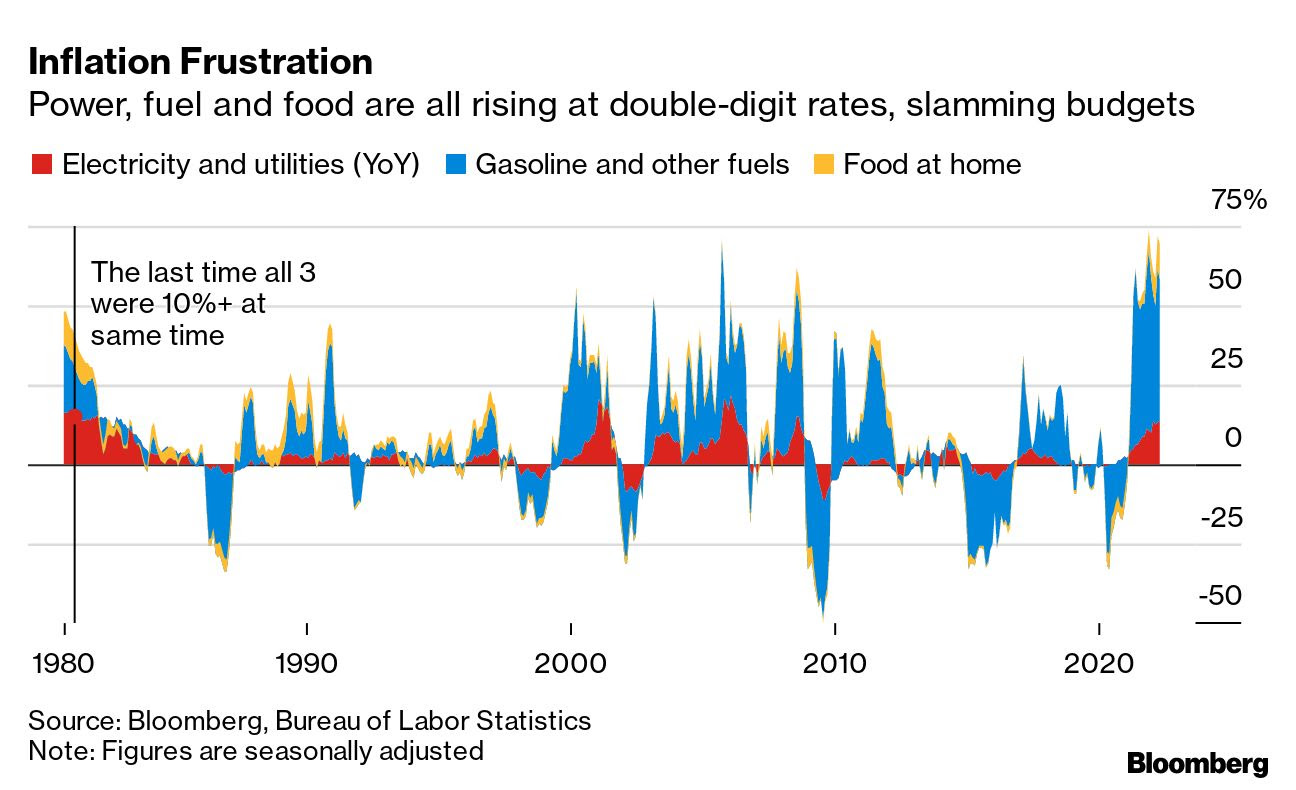
Further, per Bloomberg’s John Authers, it’s the case that “[a]ll major global synchronized crises ended with moderate inflation and low growth; that hasn’t been reached yet.” Separately, a peak in inflation “doesn’t come close to guaranteeing equity gains.”

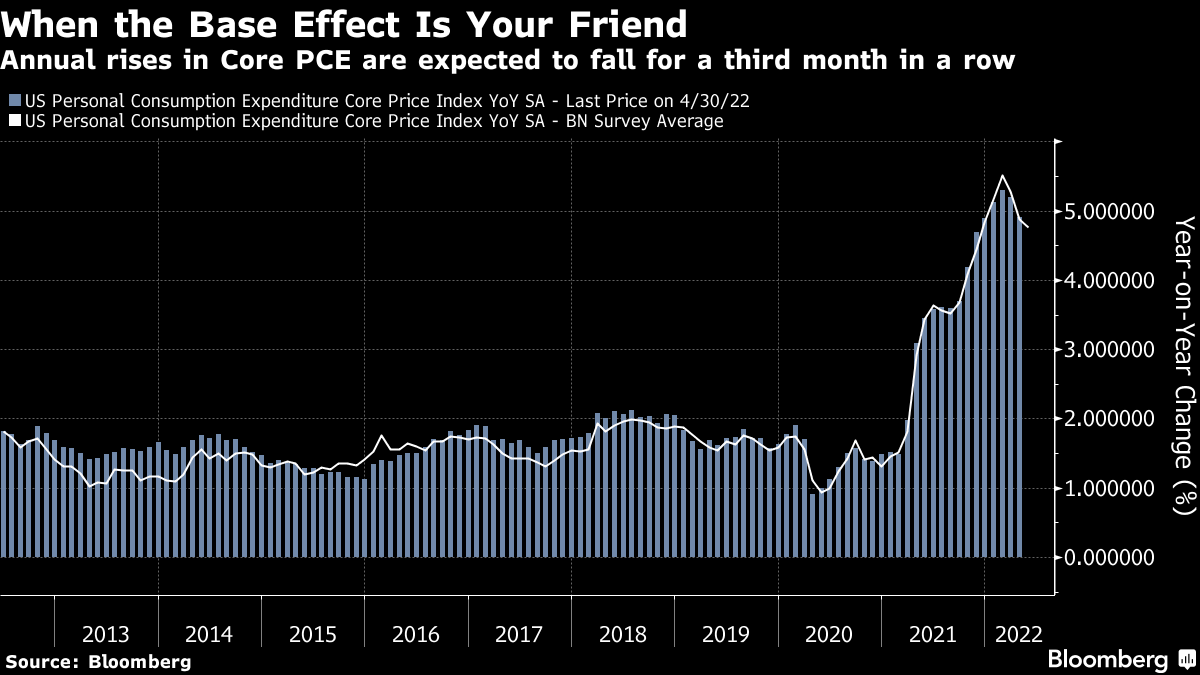
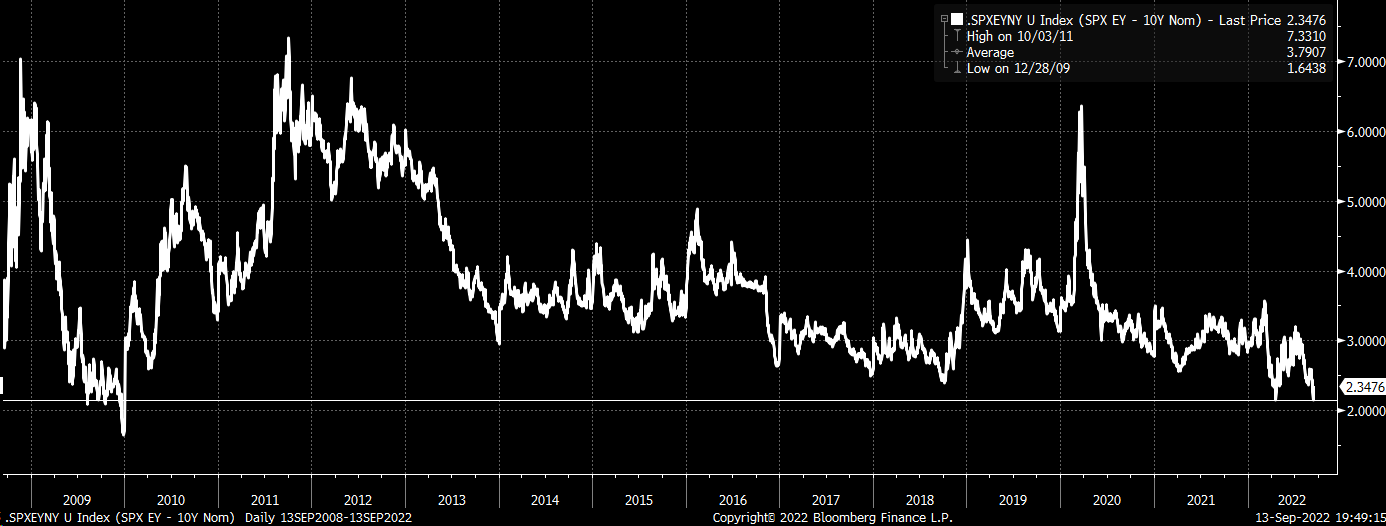
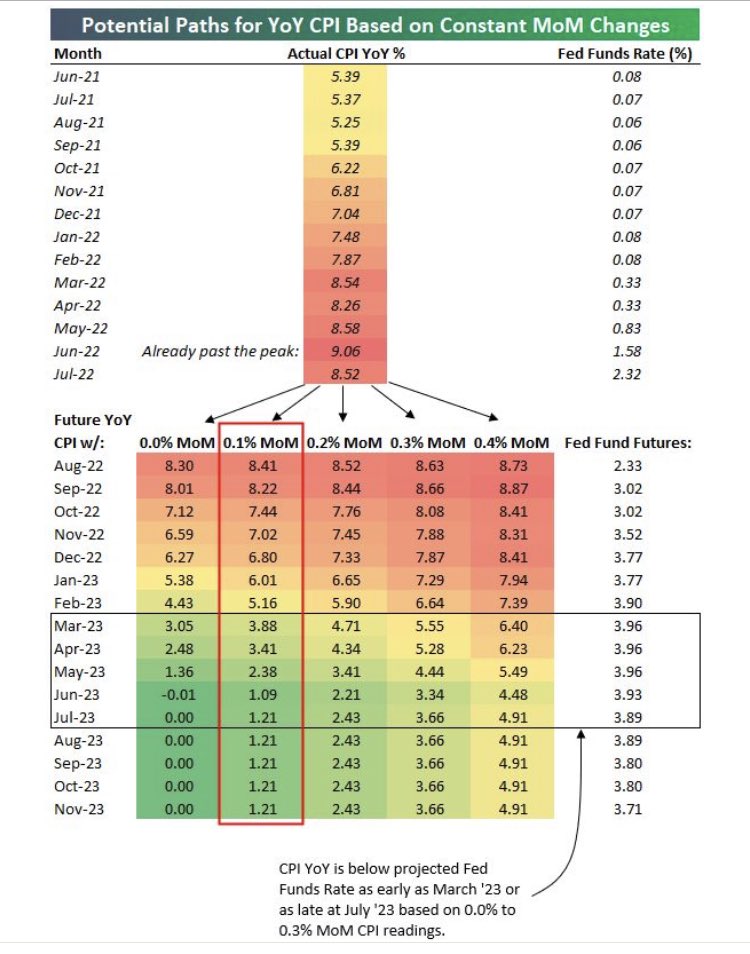
The pivot will come when there’s a “sustainable path to 2% (not 3 or 4%) inflation” and a “fed funds that is greater than CPI for a few quarters,” explained Alfonso Peccatiello of The Macro Compass.

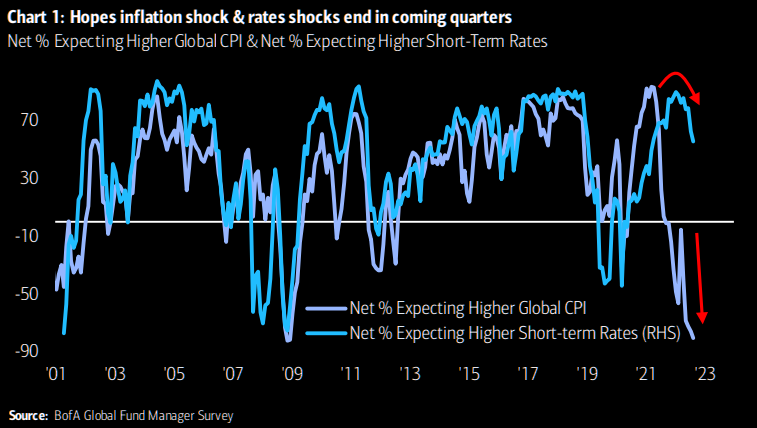
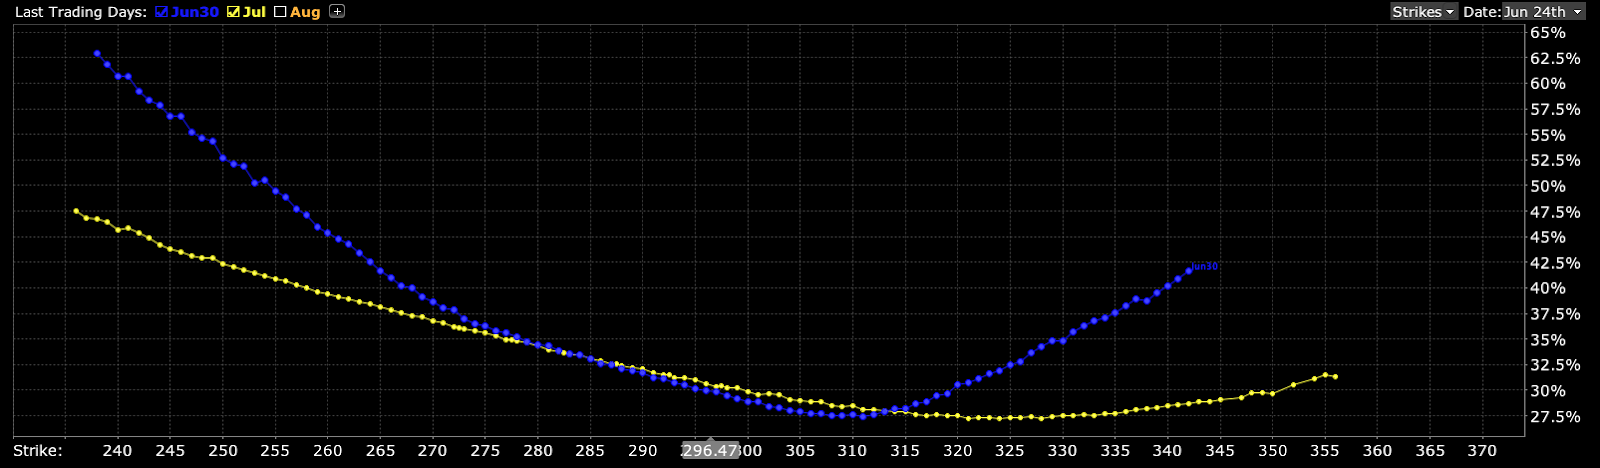
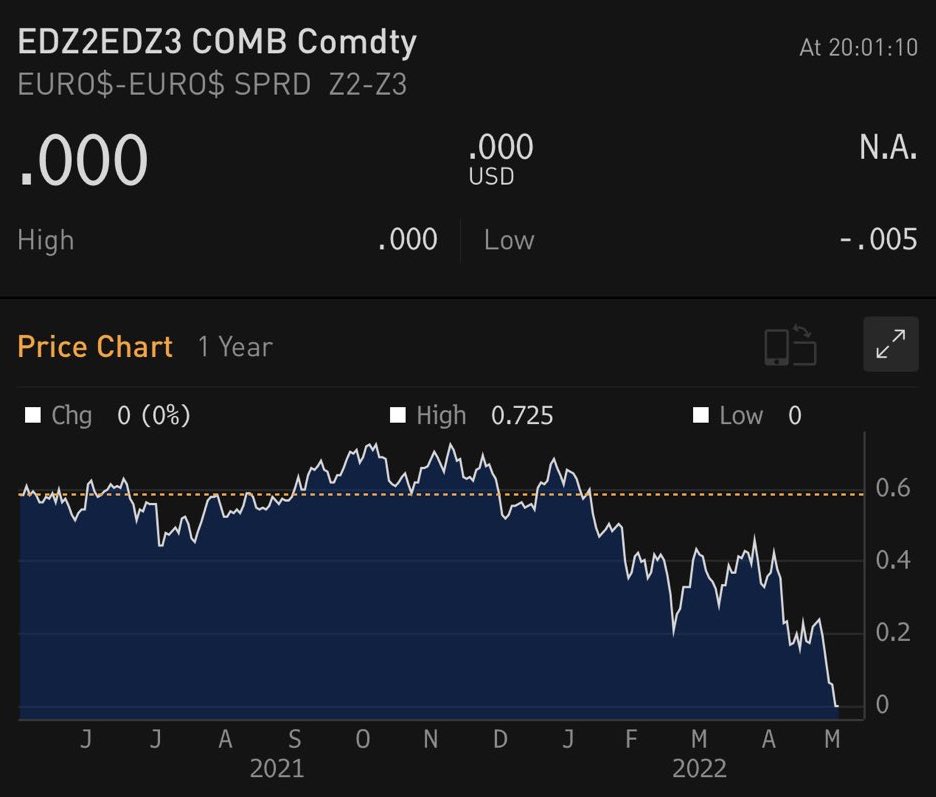
“The timing mostly depends [on] the MoM CPI ahead,” he added, pointing to a graphic that suggests “there is no ‘pivot’ earlier than mid-2023, and it could well be later. Looking at the SOFR curve, that’s also what’s roughly priced in.”
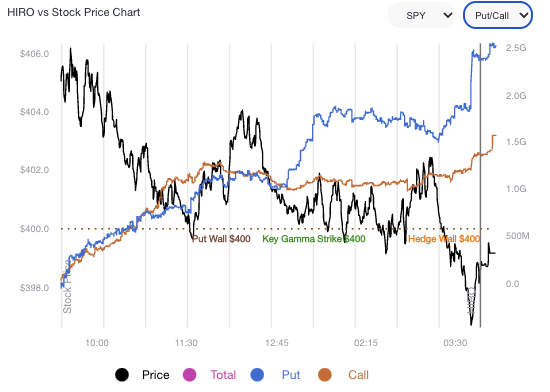
Graphic: Retrieved from Bespoke Investment Group via Alfonso Peccatiello.

Positioning

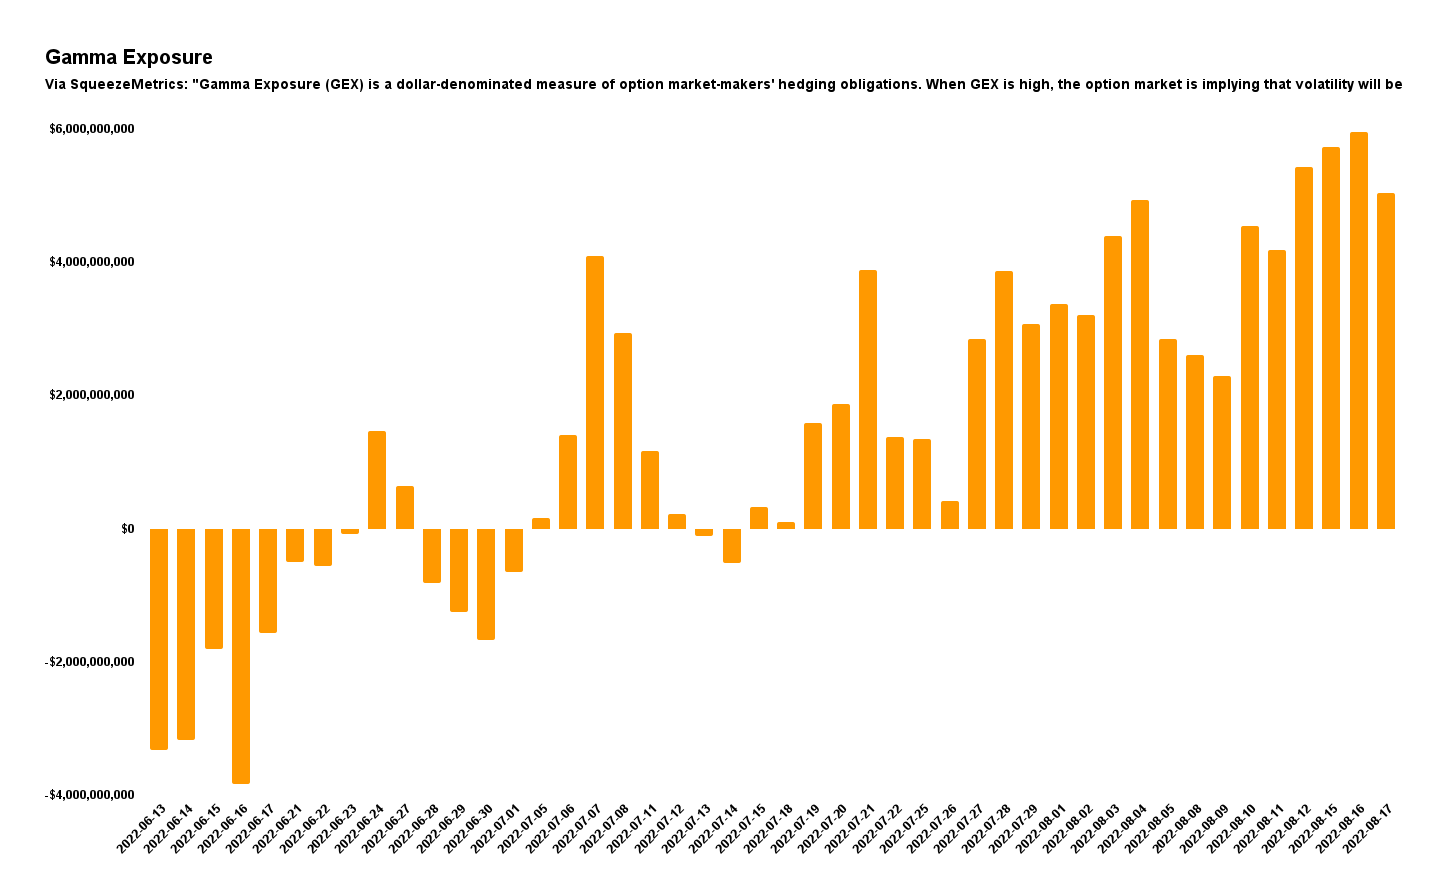
Ahead of a multi-derivative expiry, markets are trading sideways to lower. Demands to protect equity downside (with puts), compounded macro-type selling earlier this week.

Now, with traders well hedged, Kai Volatility’s Cem Karsan put forth that there is a “race to monetize,” which is lending to “relatively flat” trade and “lack of follow-through.”

Graphic: Retrieved from Pat Hennessy. “Every large down move in SPX this year (quantified by <= -2 Zscore) has been followed by a relatively flat day/lack of follow through. Any ideas as to why this is?”

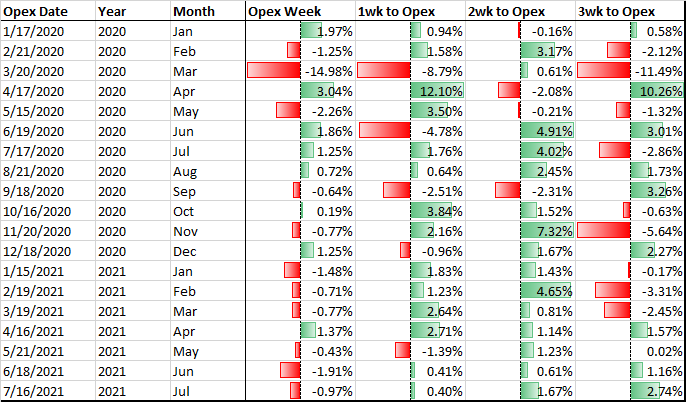
From hereon, as we said, a lot of the exposure demanded is short-dated. Should that exposure not be rolled forward in time, and allowed to expire, “SPX/ES dealers [who] are well hedged,” will unwind their hedges which may drive bullishness “through OpEx,” added Karsan.

Notwithstanding, this “has [the] potential to drive a tail post” OpEx. In [the] tech/meme market melt-up of 2020-2021, positioning was [the] exact opposite.”

Technical

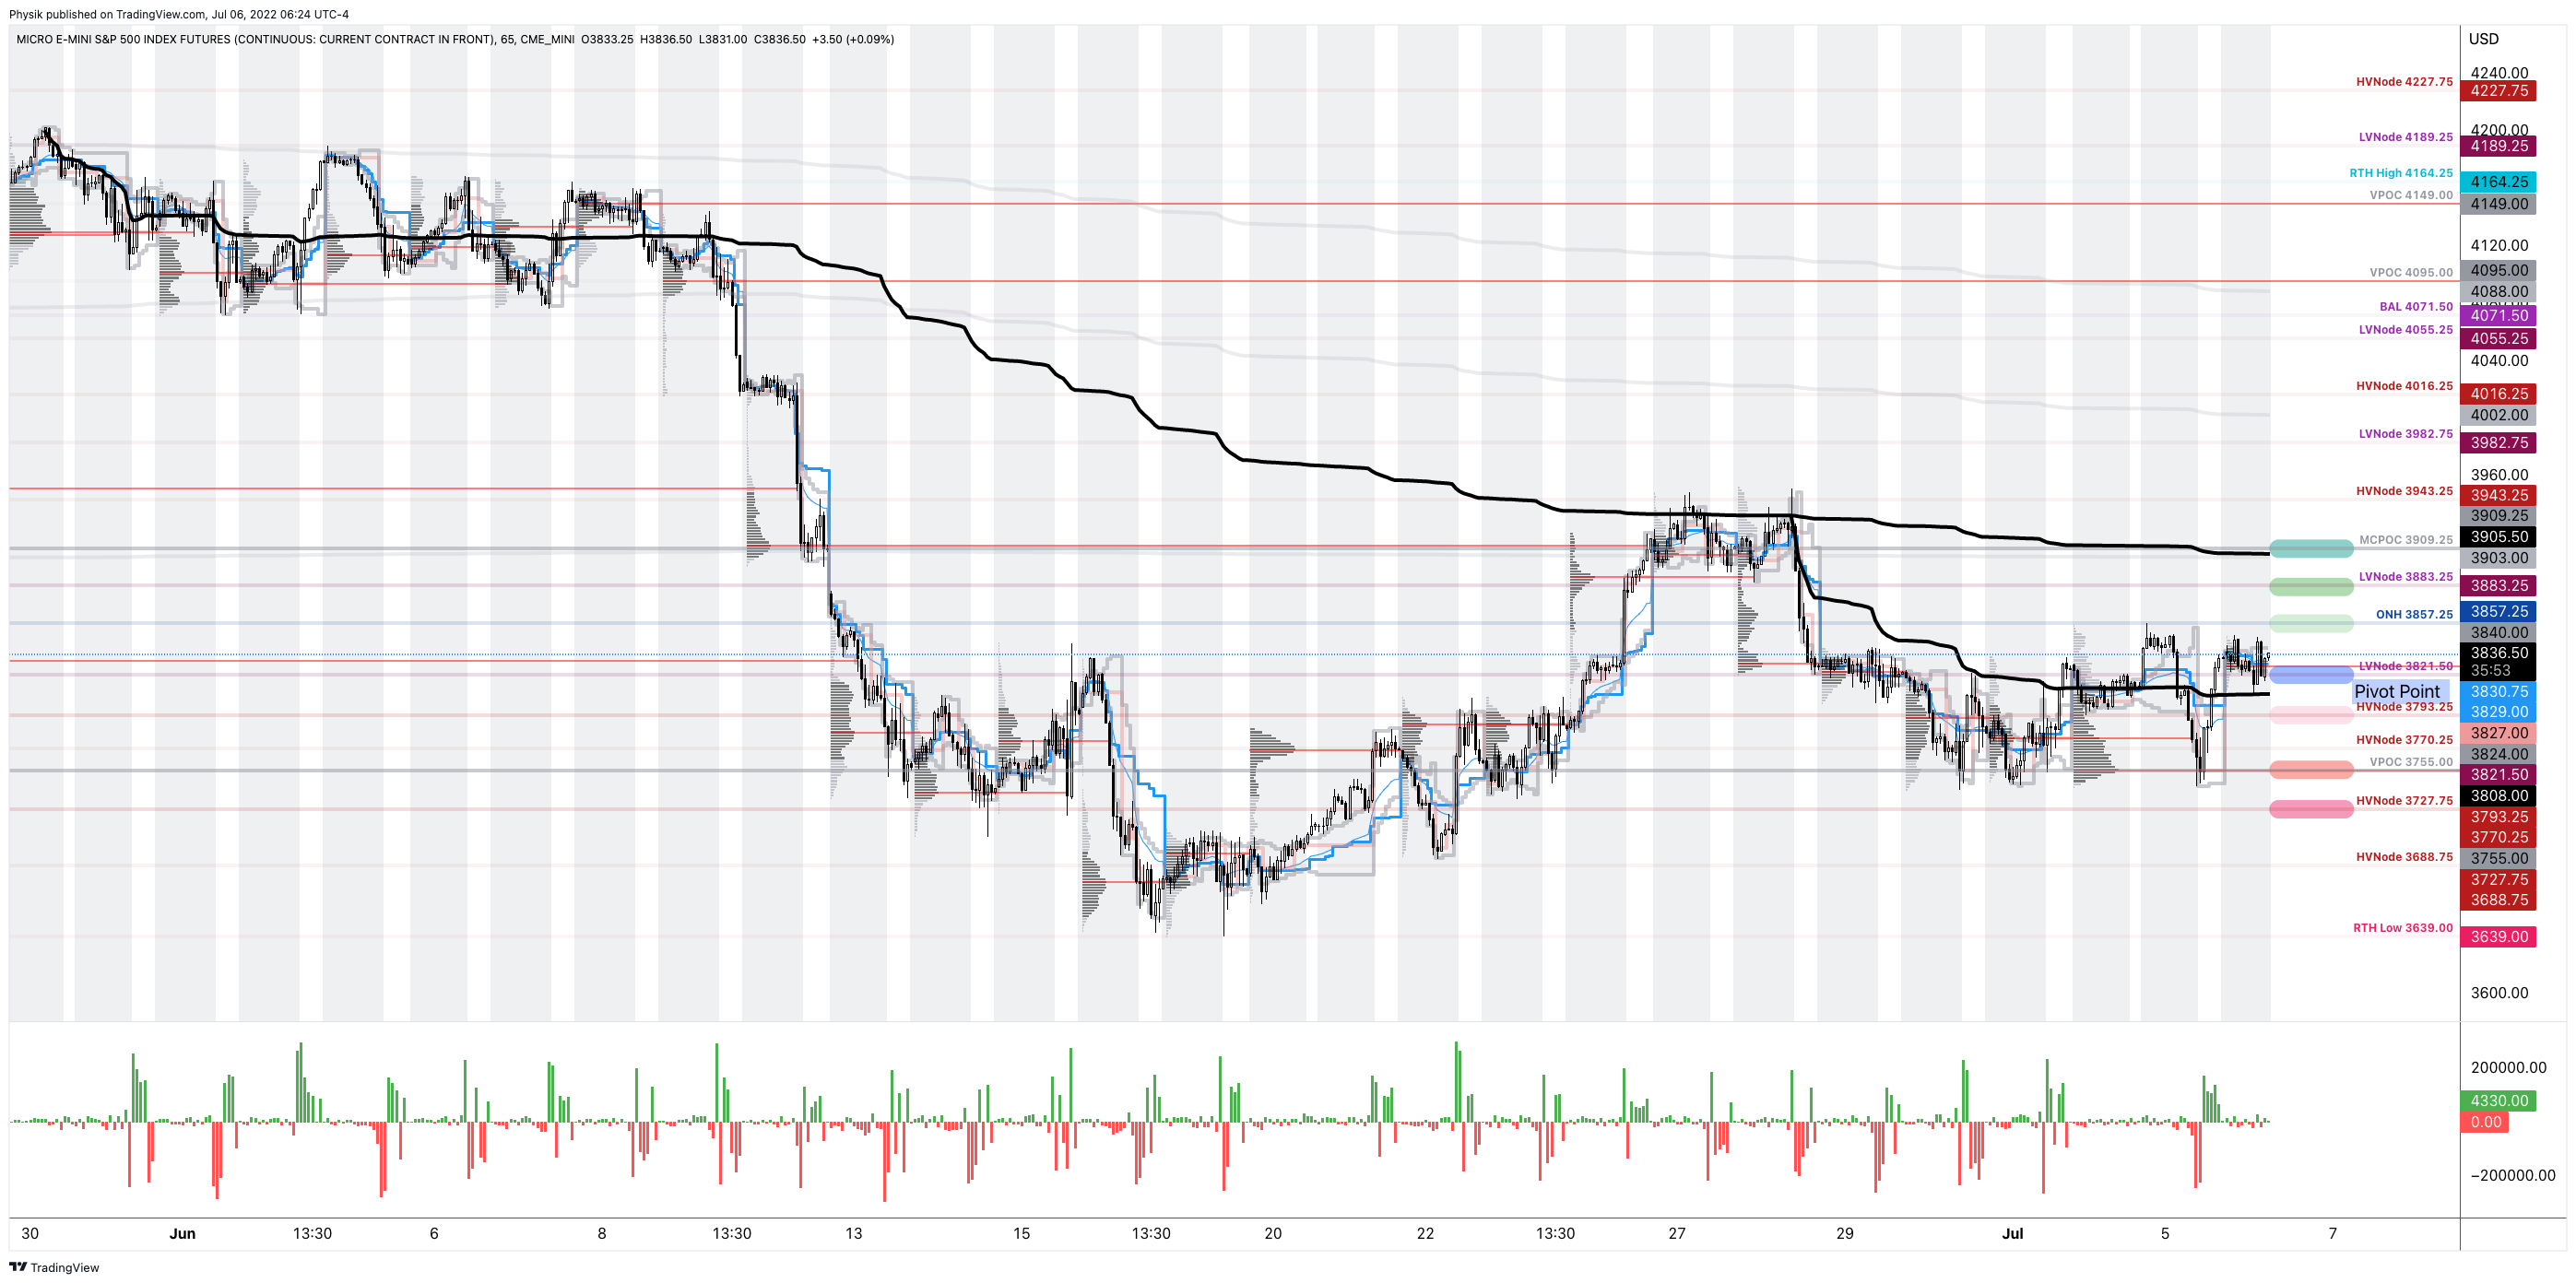
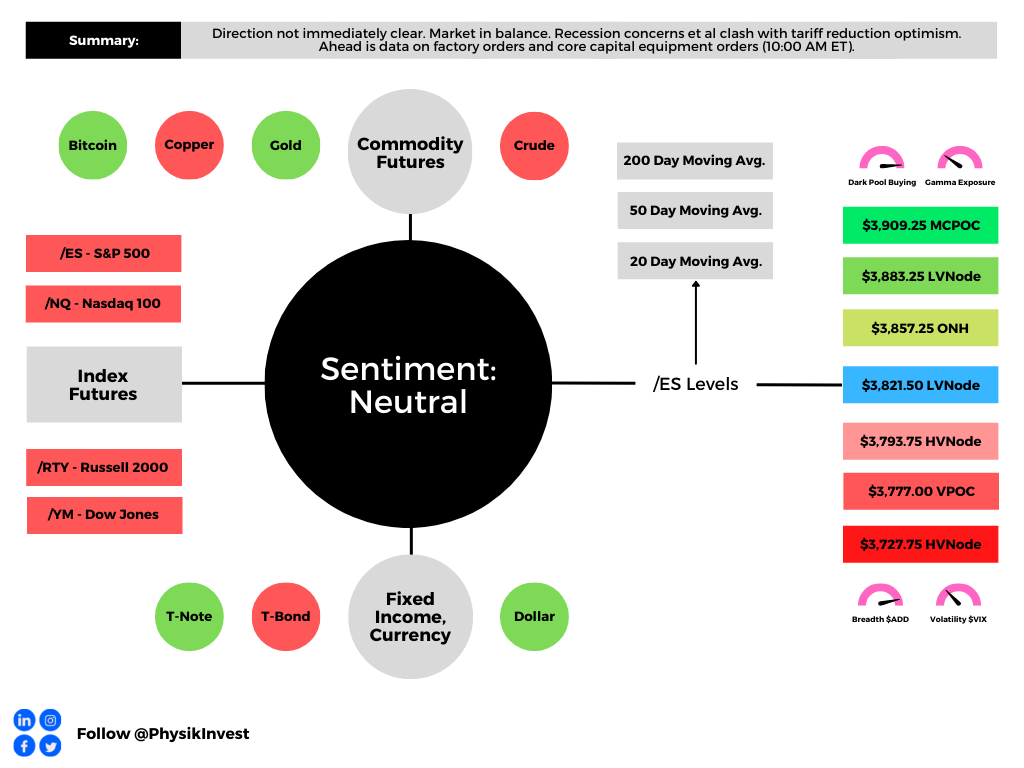
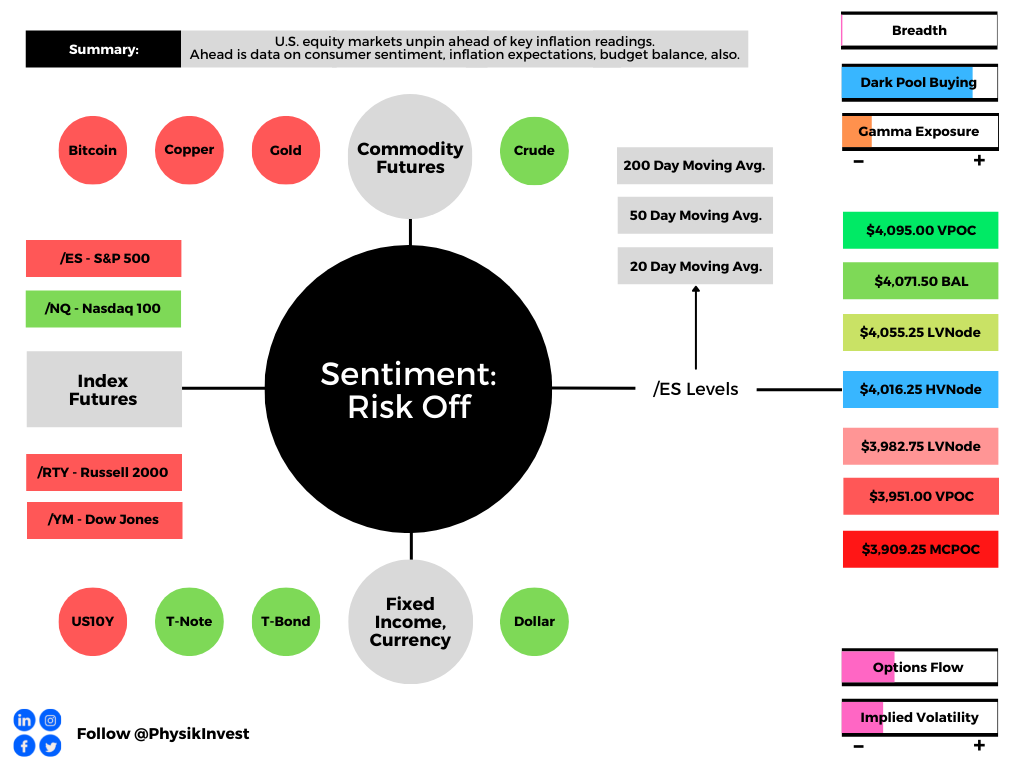
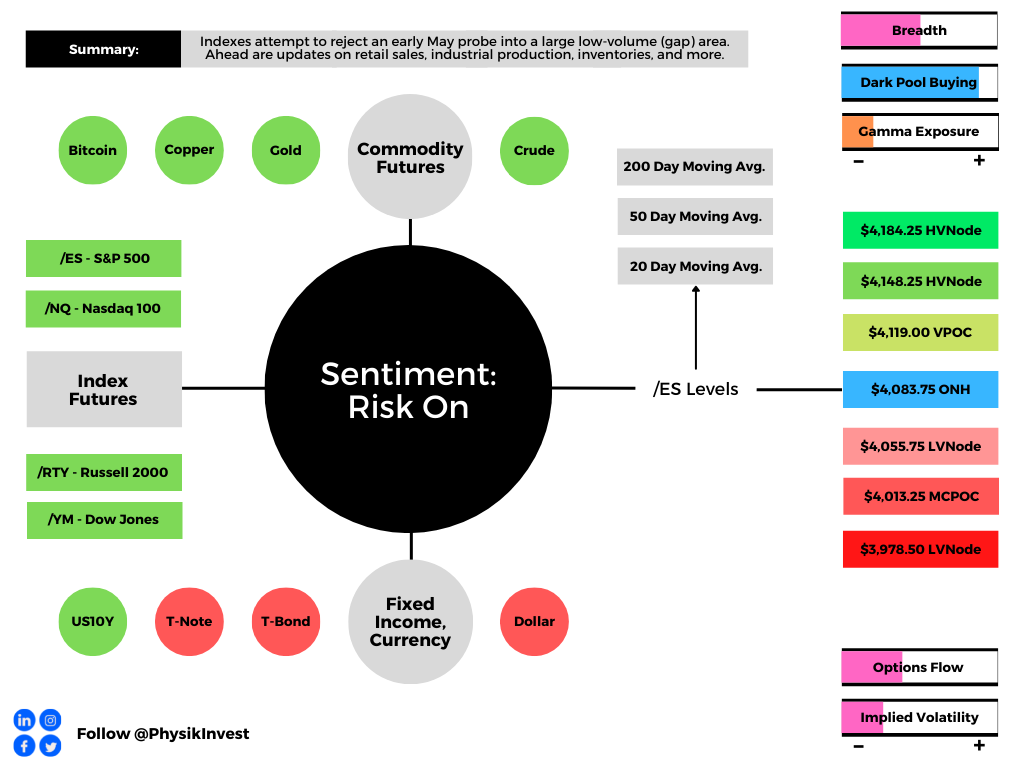
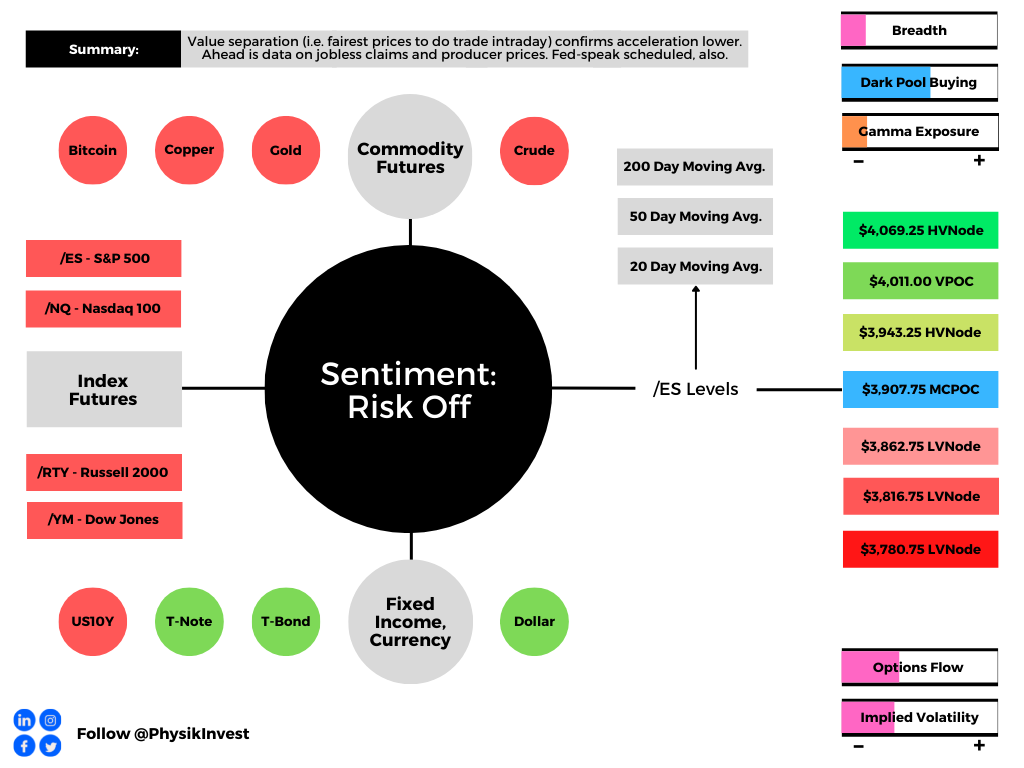
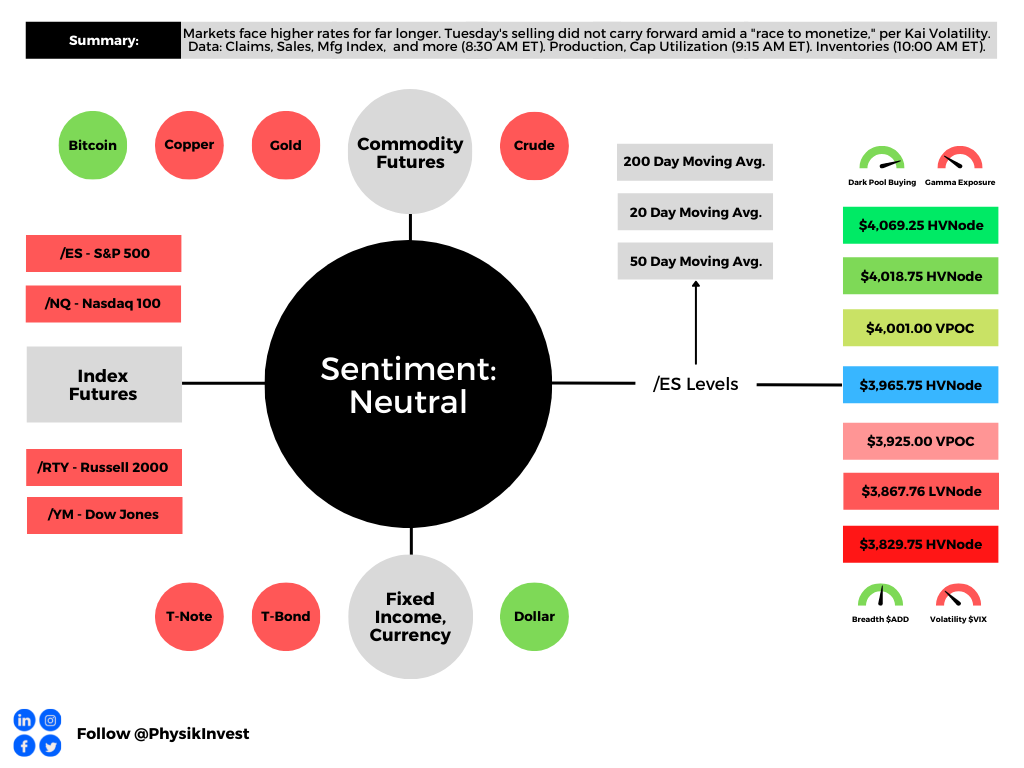
As of 7:45 AM ET, Thursday’s regular session (9:30 AM – 4:00 PM ET), in the S&P 500, is likely to open in the middle part of a balanced overnight inventory, inside of prior-range and -value, suggesting a limited potential for immediate directional opportunity.

In the best case, the S&P 500 trades higher.

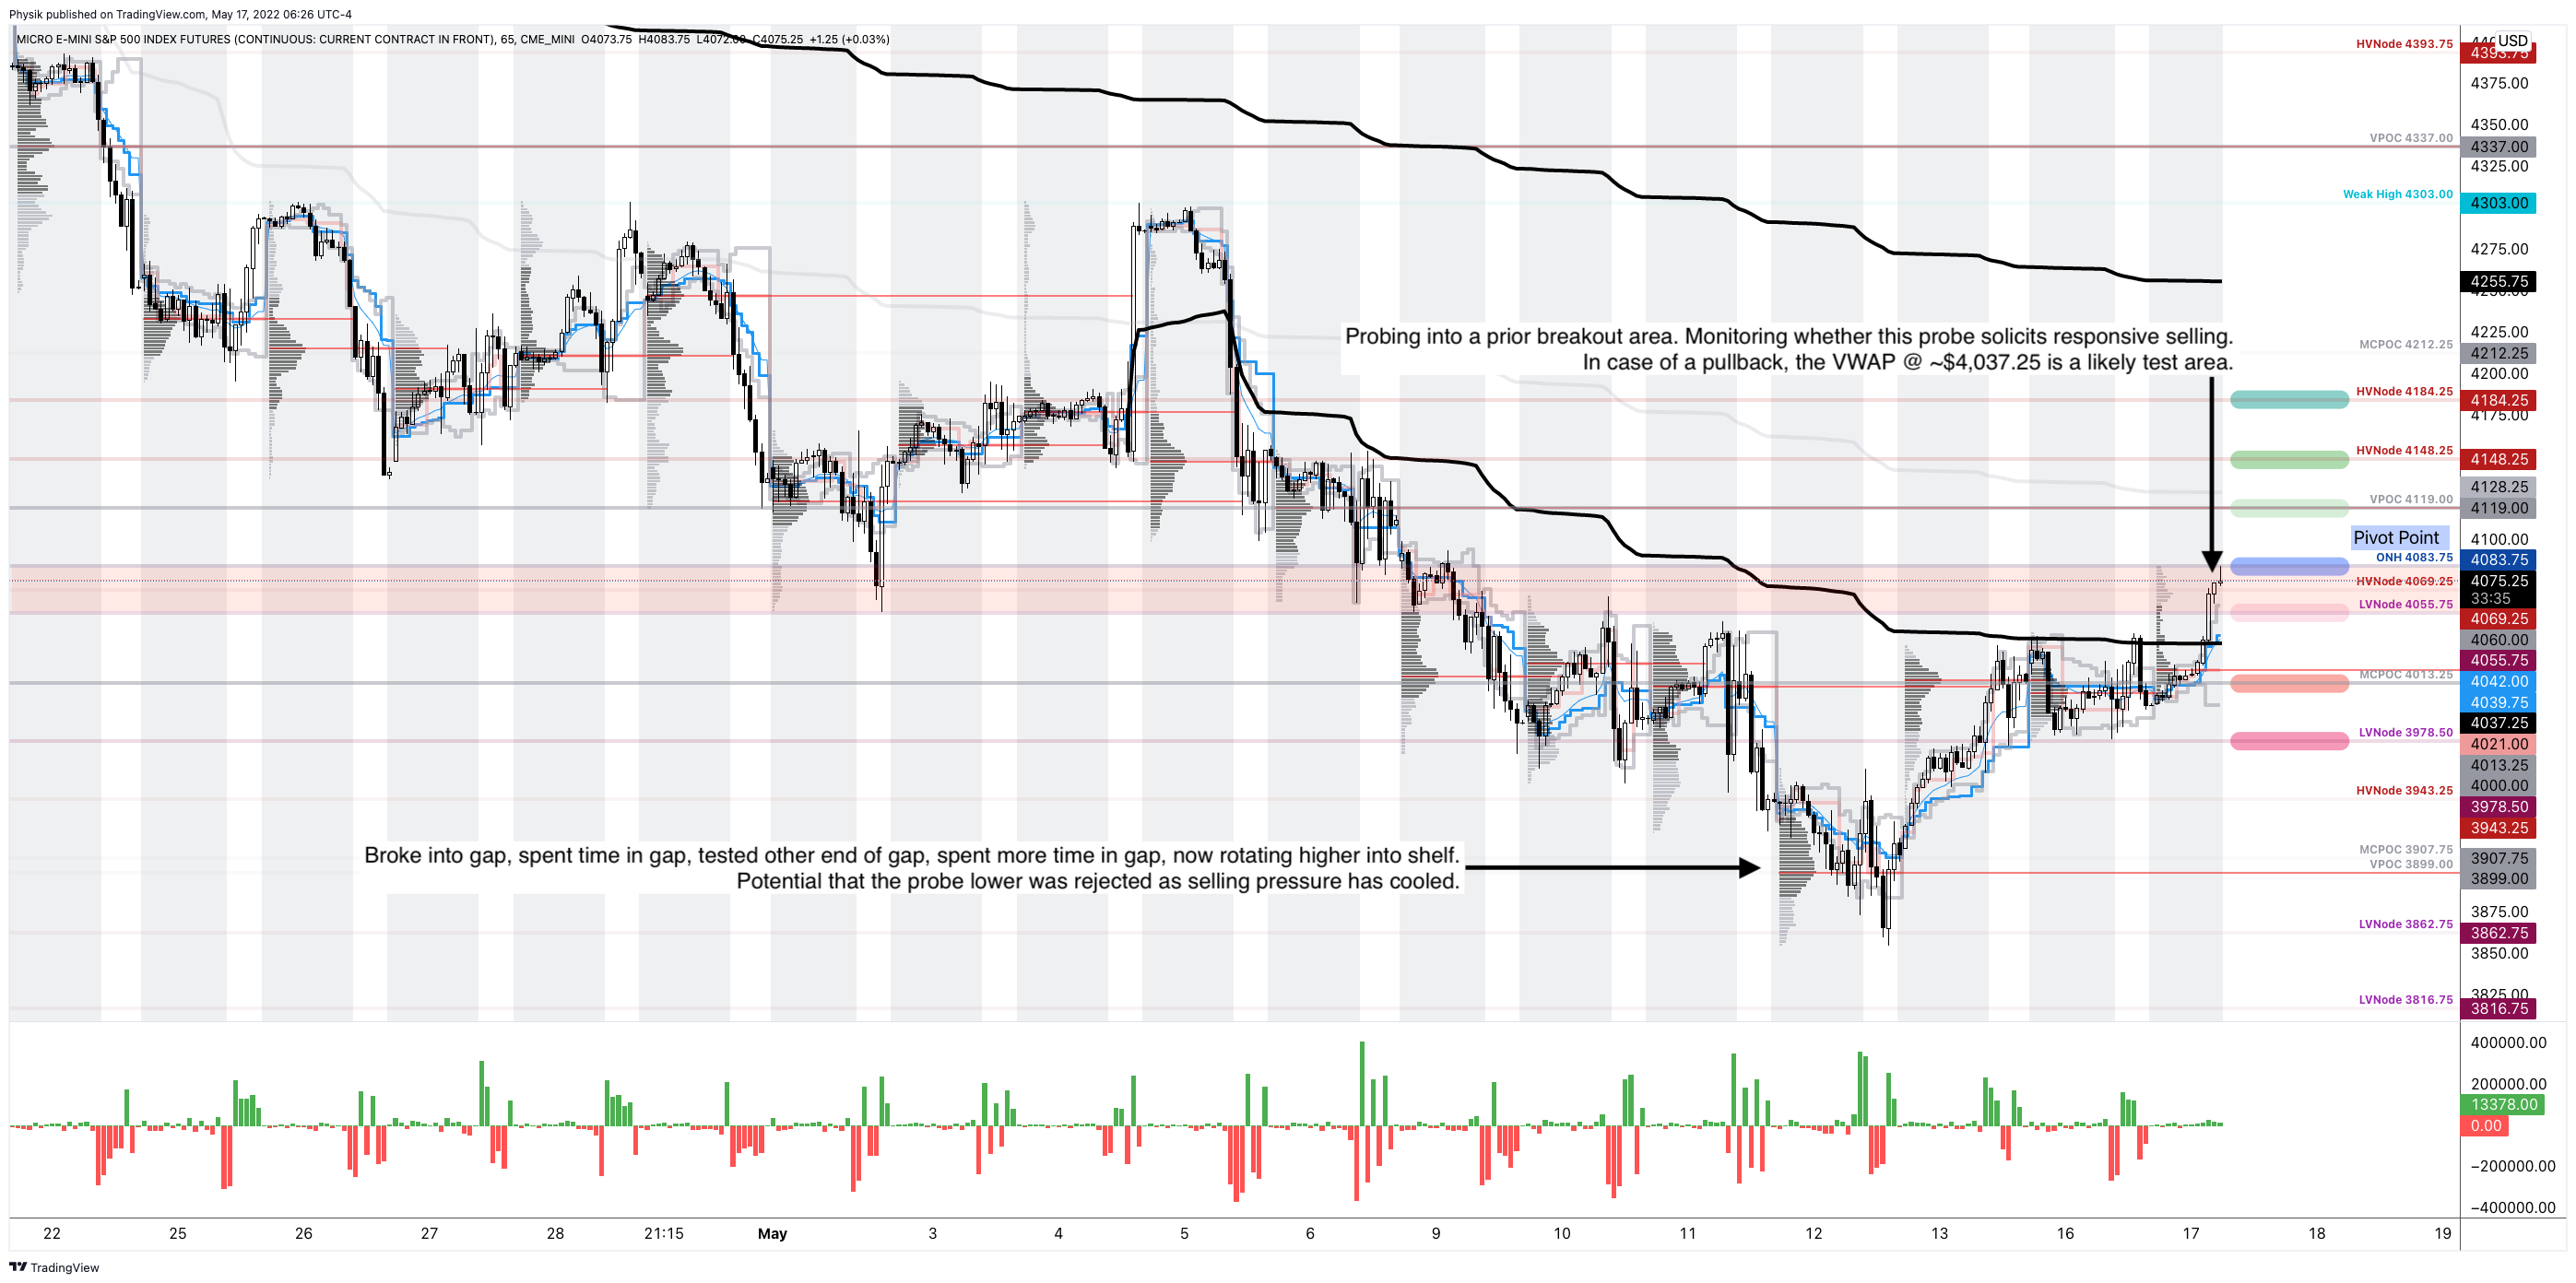
Any activity above the $3,965.75 HVNode puts into play the $4,001.00 VPOC. Initiative trade beyond the VPOC could reach as high as the $4,018.75 and $4,069.25 HVNodes, or higher.

In the worst case, the S&P 500 trades lower.

Any activity below the $3,965.75 HVNode puts into play the $3,925.00 VPOC. Initiative trade beyond the VPOC could reach as low as the $3,867.75 LVNode and $3,829.75 HVNode, or lower.

Click here to load today’s key levels into the web-based TradingView charting platform. Note that all levels are derived using the 65-minute timeframe. New links are produced, daily.
Graphic: 65-minute profile chart of the Micro E-mini S&P 500 Futures.

Definitions

Volume Areas: A structurally sound market will build on areas of high volume (HVNodes). Should the market trend for long periods of time, it will lack sound structure, identified as low volume areas (LVNodes). LVNodes denote directional conviction and ought to offer support on any test. 

If participants were to auction and find acceptance into areas of prior low volume (LVNodes), then future discovery ought to be volatile and quick as participants look to HVNodes for favorable entry or exit.

POCs: POCs are valuable as they denote areas where two-sided trade was most prevalent in a prior day session. Participants will respond to future tests of value as they offer favorable entry and exit.

MCPOCs: POCs are valuable as they denote areas where two-sided trade was most prevalent over numerous day sessions. Participants will respond to future tests of value as they offer favorable entry and exit.

About

After years of self-education, strategy development, mentorship, and trial-and-error, Renato Leonard Capelj began trading full-time and founded Physik Invest to detail his methods, research, and performance in the markets.

Capelj also develops insights around impactful options market dynamics at SpotGamma and is a Benzinga reporter.

Some of his works include conversations with ARK Invest’s Catherine Wood, investors Kevin O’Leary and John Chambers, FTX’s Sam Bankman-Fried, ex-Bridgewater Associate Andy Constan, Kai Volatility’s Cem Karsan, The Ambrus Group’s Kris Sidial, among many others.

Disclaimer

In no way should the materials herein be construed as advice. Derivatives carry a substantial risk of loss. All content is for informational purposes only.

Categories
Commentary

Daily Brief For August 18, 2022

The daily brief is a free glimpse into the prevailing fundamental and technical drivers of U.S. equity market products. Join the 800+ that read this report daily, below!

Graphic updated 7:20 AM ET. Sentiment Neutral if expected /ES open is inside of the prior day’s range. /ES levels are derived from the profile graphic at the bottom of the following section. Levels may have changed since initially quoted; click here for the latest levels. SqueezeMetrics Dark Pool Index (DIX) and Gamma (GEX) calculations are based on where the prior day’s reading falls with respect to the MAX and MIN of all occurrences available. A higher DIX is bullish. At the same time, the lower the GEX, the more (expected) volatility. Learn the implications of volatility, direction, and moneyness. Breadth reflects a reading of the prior day’s NYSE Advance/Decline indicator. VIX reflects a current reading of the CBOE Volatility Index (INDEX: VIX) from 0-100.
Hey team – the Daily Brief will be paused until August 29, at least, due to Renato’s travel commitments. 

Apologies and thank you for the support!

Positioning

As of 7:20 AM ET, Thursday’s expected volatility, via the Cboe Volatility Index (INDEX: VIX), sits at ~1.05%. Net Gamma exposures (generally) rising may promote tighter trading ranges.

Graphic: Via Physik Invest. Data retrieved from SqueezeMetrics.

As an aside, real quick, in a rising market, characterized by demand for call options, those who are on the other side of options trades, hedge in a manner that may bolster the upside (i.e., the naive theory is that if customers buy calls, then counterparties sell calls + buy stock to hedge).

That said, if IVOL drops, liquidity providers’ out-of-the-money (in-the-money) Delta exposures drop (rise) and, thus, they will sell (buy) underlying hedges which may pressure (support) the advance or play into pinning action, as seen over the past week or so at the $4,300.00 options strike, at which there is a lot of open interest and volume, in the S&P 500.

Read: The Implied Order Book by SqueezeMetrics for a sort-of detailed primer on this.

Graphic: Updated 8/15/2022. Retrieved from SqueezeMetrics.

Given realized (RVOL) and implied (IVOL) volatility measures, as well as skew, it is beneficial to be a buyer of options structures to protect against (potential) downside (e.g., S&P 500 [INDEX: SPX] +1 x -2 Short Ratio Put Spread | 200+ Points Wide | 15-30 DTE | @ $0.00 or better).

This is not to say that call options, which we said could “outperform” their Delta (i.e., exposure to direction) weeks ago, are out of favor (note: this is the case for something such as an SPX, not a Bed Bath & Beyond Inc [NASDAQ: BBBY]).

Graphic: Retrieved from Corey Hoffstein. Via Goldman Sachs Group Inc (NYSE: GS).

No! On the contrary, Goldman Sachs Group Inc (NYSE: GS) strategists say “call premiums are attractive.” This is “evidenced by [their] GS-EQMOVE model which estimates 33% probability of a 1-month 5% up-move versus only 13% implied by the options market.”

A quick check of implied volatility skew, which is a plot of the implied volatility levels for options across different strike prices, shows a smile in the shortest of tenors, rather than a usual smirk.

Graphic: Retrieved from Cboe Global Markets Inc (BATS: CBOE).

Given this, the options with strike prices above current market prices are seemingly more pricey than those that have more time to expiration. One could think about structuring something like a Short Ratio Call Spread or, even, a Long Call Calendar Spread at or above current prices. 

In the latter, any sideways-to-higher movement would allow for that spread to expand for profit.

Graphic: Via Banco Santander SA (NYSE: SAN) research, the return profile, at expiry, of a classic 1×2 (long 1, short 2 further away) ratio spread.

Context: Participants’ proactive hedging of positive Delta equity exposure, via negative Delta put option exposures, as well as the monetization of those hedges into the decline, resulted in poor performance in IVOL metrics like the Cboe Volatility Index (INDEX: VIX).

Therefore, per the Cboe, it’s the case that “since the launch of the VIX Index, the past six-month period has been the weakest for volatility in 29 years, relative to similar [SPX] price moves.”

Accordingly, its structures we thought would work best, given the potential for measured selling, which others thought would carry a lot of risks, such as Short Ratio Put Spreads, that performed best, seen below.

Graphic: Via Pat Hennessy. “[T]he performance of short-dated 1×2 put ratios in SPX this year. Despite being short the tail, the grind lower has been well captured by this trade structure.”

Moreover, it’s the case that after a nearly 20% multi-month run, higher, markets are stretched. 

To continue this pace would require, per JPMorgan Chase & Co (NYSE: JPM) strategists, a continued interest in demand for positive Delta exposure via equity or options, lower prints of consumer price data, as well as a dovish Federal Reserve (Fed) inflection.

The former we see now via call option volumes. The latter, not so much as the Federal Open Market Committee (FOMC) minutes “left the door open to another ‘unusually large’ increase at the next meeting in September,” in spite of a commitment to dial back if the data supported.

Graphic: Via Physik Invest. Data compiled by @jkonopas623. Fed Balance Sheet data, here. Treasury General Account Data, here. Reverse Repo data, here. NL = BS – TGA – RRP.

Presently, retail sales are steady, and supply pressures, though starting to ease, remain, bolstering inflation which the Fed is ultimately trying to stop from becoming entrenched.

Graphic: Retrieved from Bloomberg.

Though there are fundamental contexts we are leaving out (e.g., negative earnings revisions, Chinese retail, industrial output, and investment data missing which prompted an easing, the use of tools like Treasury buybacks to ease disruptions via Fed-action, as well as increasing recession odds), in short, the focus should be on the technicals which actually make us money.

Graphic: Retrieved from The Market Ear. Via Bank of America Corporation (NYSE: BAC).

And, presently, on the heels of macro- and volatility-type re-leveraging, per Deutsche Bank AG (NYSE: DB) the technical contexts are bullish. 

Keith Lerner, the co-chief investment officer and chief market strategist at Truist Financial Corporation’s (NYSE: TFC) Advisory Services puts it all well:

“Even if the Fed does pivot, they are less likely to support the markets as quickly as they have in the past given the scar tissue left behind as a result of the inflation challenges of the past year… The market rally over the past four weeks has been nothing short of impressive. Such strong buying pressure following indiscriminate selling has historically been a very positive sign for the market, often following important market bottoms. This is a welcome sign. Still, other factors in our work are less supportive. Indeed, markets are not only fighting the Fed, but the most aggressive global monetary tightening cycle in decades.”

Graphic: Retrieved from Bloomberg. Via Truist Financial Corporation (NYSE: TFC).

Beyond this, from a volatility perspective, we’d look for the VIX to sink below 15 to increase our optimism over a “sustained [and] better-than-typical” rally, per Jefferies Financial Group Inc (NYSE: JEF). Look at this last remark through the lens of participation on the part of traders who employ volatility-targeting strategies, for instance.

Graphic: Retrieved from The Market Ear. Via Jefferies Financial Group Inc (NYSE: JEF).

Technical

As of 7:20 AM ET, Thursday’s regular session (9:30 AM – 4:00 PM ET), in the S&P 500, is likely to open in the middle part of a balanced overnight inventory, inside of prior-range and -value, suggesting a limited potential for immediate directional opportunity.

In the best case, the S&P 500 trades higher.

Any activity above the $4,273.00 VPOC puts into play the $4,294.25 HVNode. Initiative trade beyond the HVNode could reach as high as the $4,337.00 VPOC and $4,393.75 HVNode, or higher.

In the worst case, the S&P 500 trades lower.

Any activity below the $4,273.00 VPOC puts into play the $4,253.25 HVNode. Initiative trade beyond the HVNode could reach as low as the $4,231.00 VPOC and $4,202.75 RTH Low, or lower.

Click here to load today’s key levels into the web-based TradingView charting platform. Note that all levels are derived using the 65-minute timeframe. New links are produced, daily.
Graphic: 65-minute profile chart of the Micro E-mini S&P 500 Futures.

Considerations: Responsiveness near key-technical areas (that are discernable visually on a chart), suggests technically-driven traders with short time horizons are very active. 

Such traders often lack the wherewithal to defend retests and, additionally, the type of trade may be indicative of the other time frame participants waiting for more information to initiate trades.

Definitions

Volume Areas: A structurally sound market will build on areas of high volume (HVNodes). Should the market trend for long periods of time, it will lack sound structure, identified as low volume areas (LVNodes). LVNodes denote directional conviction and ought to offer support on any test. 

If participants were to auction and find acceptance into areas of prior low volume (LVNodes), then future discovery ought to be volatile and quick as participants look to HVNodes for favorable entry or exit.

POCs: POCs are valuable as they denote areas where two-sided trade was most prevalent in a prior day session. Participants will respond to future tests of value as they offer favorable entry and exit.

Gamma: Gamma is the sensitivity of an option to changes in the underlying price. Dealers that take the other side of options trades hedge their exposure to risk by buying and selling the underlying. When dealers are short-gamma, they hedge by buying into strength and selling into weakness. When dealers are long-gamma, they hedge by selling into strength and buying into weakness. The former exacerbates volatility. The latter calms volatility.

Vanna: The rate at which the delta of an option changes with respect to volatility.

Charm: The rate at which the delta of an option changes with respect to time.

About

After years of self-education, strategy development, mentorship, and trial-and-error, Renato Leonard Capelj began trading full-time and founded Physik Invest to detail his methods, research, and performance in the markets.

Capelj also develops insights around impactful options market dynamics at SpotGamma and is a Benzinga reporter.

Some of his works include conversations with ARK Invest’s Catherine Wood, investors Kevin O’Leary and John Chambers, FTX’s Sam Bankman-Fried, ex-Bridgewater Associate Andy Constan, Kai Volatility’s Cem Karsan, The Ambrus Group’s Kris Sidial, among many others.

Disclaimer

In no way should the materials herein be construed as advice. Derivatives carry a substantial risk of loss. All content is for informational purposes only.

Categories
Commentary

Daily Brief For July 6, 2022

The daily brief is a free glimpse into the prevailing fundamental and technical drivers of U.S. equity market products. Join the 300+ that read this report daily, below!

Graphic updated 6:25 AM ET. Sentiment Neutral if expected /ES open is inside of the prior day’s range. /ES levels are derived from the profile graphic at the bottom of the following section. Levels may have changed since initially quoted; click here for the latest levels. SqueezeMetrics Dark Pool Index (DIX) and Gamma (GEX) calculations are based on where the prior day’s reading falls with respect to the MAX and MIN of all occurrences available. A higher DIX is bullish. At the same time, the lower the GEX, the more (expected) volatility. Learn the implications of volatility, direction, and moneyness. Breadth reflects a reading of the prior day’s NYSE Advance/Decline indicator. VIX reflects a current reading of the CBOE Volatility Index (INDEX: VIX) from 0-100.

What To Expect

Fundamental: Impressive was the strength of the Nasdaq 100 (INDEX: NDX), relative to the S&P 500 (INDEX: SPX), yesterday. 

Graphic: Via Charles Schwab Corporation-owned (NYSE: SCHW) TD Ameritrade’s Thinkorswim. Retrieved by Physik Invest.

This is as traders are now paring back their bets on monetary tightening, given the deterioration in the U.S. economic outlook. The NDX, which has been most sensitive to changes in monetary policies, accordingly, responded best as that index is comprised of assets that have the most to lose in a high-rate, aggressive quantitative tightening (QT) environment.

Graphic: Via Bloomberg. “In less than two weeks, the market has dropped its prediction for a peak rate brought forward the moment of the first cut, and forecasts a far more aggressive cutting program that will start next spring.”

For context, QT is the central banking authorities’ removal of balance sheet assets via sales or the non-reinvestment of the principal sum of maturing securities. Accordingly, if bonds are sold, their values fall and yields rise. This pushes yield-hungry investors into less risky categories.

Graphic: Retrieved from @patrick_saner. “A 60/40 portfolio is now worth less than before the pandemic.”

“As you look at where to park your cash for the next six months, you could do worse than to look at a mix of oversold treasuries and stocks – offering both compelling yield and a good degree of value protection,” explains Toggle CEO Jan Szilagyi in a note.

Graphic: Via Toggle.

These are comments, however, in the face of what has been a “multiple compression,” as we talked about last week. The upcoming earnings season is likely to shed clarity with respect to corporates’ ability to weather or pass on higher costs, among other things.

In the case of a so-called “earnings compression,” some commentators suggest the market is not priced correctly and another leg lower may be initiated.

Adding, expected are the Federal Open Market Committee (FOMC) meeting minutes, today. 

They are likely to “indicate that policymakers were worried about the un-anchoring of inflation expectations, … justifying the Fed’s shift in placing more focus on headline inflation measures rather than just core measures,” according to Bloomberg’s chief U.S. economist Anna Wong.

Graphic: Via Bloomberg. “After surging consistently to hit an all-time high in the two years after the March 2020 shutdown, the [Commodity Research Bureau Raw Industrials index] turned sharply southward.”

Positioning: Data shows net gamma exposure increasing which may increasingly feed into smaller ranges if prices continue to rise.

Further, continued are gaps between volatility measures for the rates and equity markets. This is, in part, due to the supply of volatility, as we’ve talked about in past commentaries.

The Ambrus Group’s Kris Sidial adds: “Another reason why equity vol on the index level has been so well offered is due to the structured products market continuing its dominance.”

“Investors are turning to alternatives in this market & these solutions continue to gain attention which leads to index level vol selling.”

Graphic: Via The Ambrus Group’s Kris Sidial. “[S]ome dealers will opportunistically look to sell vol in some buckets in the front of the term structure.”

Given this, the relationship between realized volatility (RVOL) has crept and, at times, exceeded that which the market has implied (IVOL). This, coupled with naive metrics for skew, suggests to us that it still makes sense to be a buyer of volatility, albeit via more complex structures.

Graphic: Via Pat Hennessy. “Tomorrow’s SPX expo (Jul1) is wildin… 26 vol for any strike with a 37 or 38 handle with a ridiculous curvature in the tails. God speed to all the 1dte theta gang. Selling OTM puts/calls for the same vol as ATM seems… umm… not good.”

Technical: As of 6:30 AM ET, Wednesday’s regular session (9:30 AM – 4:00 PM ET), in the S&P 500, is likely to open in the mid-to-upper part of a balanced overnight inventory, inside of prior-range and -value, suggesting a potential for immediate directional opportunity.

In the best case, the S&P 500 trades higher.

Any activity above the $3,821.50 LVNode puts into play the $3,857.25 ONH. Initiative trade beyond the ONH could reach as high as the $3,883.25 LVNode and $3,909.25 MCPOC, or higher.

In the worst case, the S&P 500 trades lower.

Any activity below the $3,821.50 LVNode puts into play the $3,793.25 HVNode. Initiative trade beyond the HVNode could reach as low as the $3,755.00 VPOC and $3,727.75 HVNode, or lower.

Click here to load today’s key levels into the web-based TradingView charting platform. Note that all levels are derived using the 65-minute timeframe. New links are produced, daily.
Graphic: 65-minute profile chart of the Micro E-mini S&P 500 Futures.

Definitions

Overnight Rally Highs (Lows): Typically, there is a low historical probability associated with overnight rally-highs (lows) ending the upside (downside) discovery process.

Volume Areas: A structurally sound market will build on areas of high volume (HVNodes). Should the market trend for long periods of time, it will lack sound structure, identified as low volume areas (LVNodes). LVNodes denote directional conviction and ought to offer support on any test. 

If participants were to auction and find acceptance into areas of prior low volume (LVNodes), then future discovery ought to be volatile and quick as participants look to HVNodes for favorable entry or exit.

POCs: POCs are valuable as they denote areas where two-sided trade was most prevalent in a prior day session. Participants will respond to future tests of value as they offer favorable entry and exit.

About

After years of self-education, strategy development, mentorship, and trial-and-error, Renato Leonard Capelj began trading full-time and founded Physik Invest to detail his methods, research, and performance in the markets.

Capelj also develops insights around impactful options market dynamics at SpotGamma and is a Benzinga reporter.

Some of his works include conversations with ARK Invest’s Catherine Wood, investors Kevin O’Leary and John Chambers, FTX’s Sam Bankman-Fried, former Bridgewater Associate Andy Constan, Kai Volatility’s Cem Karsan, The Ambrus Group’s Kris Sidial, among many others.

Disclaimer

In no way should the materials herein be construed as advice. Derivatives carry a substantial risk of loss. All content is for informational purposes only.

Categories
Commentary

Daily Brief For July 5, 2022

The daily brief is a free glimpse into the prevailing fundamental and technical drivers of U.S. equity market products. Join the 300+ that read this report daily, below!

Graphic updated 6:30 AM ET. Sentiment Neutral if expected /ES open is inside of the prior day’s range. /ES levels are derived from the profile graphic at the bottom of the following section. Levels may have changed since initially quoted; click here for the latest levels. SqueezeMetrics Dark Pool Index (DIX) and Gamma (GEX) calculations are based on where the prior day’s reading falls with respect to the MAX and MIN of all occurrences available. A higher DIX is bullish. At the same time, the lower the GEX, the more (expected) volatility. Learn the implications of volatility, direction, and moneyness. SHIFT data used for S&P 500 (INDEX: SPX) options activity. Note that options flow is sorted by the call premium spent; if more positive, then more was spent on call options. Breadth reflects a reading of the prior day’s NYSE Advance/Decline indicator. VIX reflects a current reading of the CBOE Volatility Index (INDEX: VIX) from 0-100.

What To Expect

Fundamental: In the headlines were the chip boom’s loss of steam, the Bank of England’s consideration of 50-year mortgages, the potential collapse or rise in oil by year-end, NATO’s resumption of expansion processes, slowing car sales, China tariffs reduction, Germany’s first monthly trade deficit since 1991 on inflation, and more.

Graphic: Via Bloomberg.

Key in last week’s narratives was U.S. manufacturing’s decline as new orders were below that of inventories.

Bloomberg’s John Authers explains that “[t]he signal grows even more discomforting if the new orders number is below the recessionary cutoff at 50.”

Graphic: Via Eric Basmajian. “Given that the ISM Manufacturing PMI holds a very strong correlation to earnings estimates, credit spreads, and more, the probability that we see further declines should be a warning sign that more turbulence is ahead in cyclical risk assets.”

“​​If the new story of imminent slowdown and a limited monetary tightening campaign turns out to be true, then the narrative on earnings will have to change. That positivity about earnings is what is keeping stocks from selling off far more,” Authers adds.

“The next couple of weeks will bring critical macro data on inflation and employment; but immediately after that, the earnings numbers will start to flow. It might not be pretty.”

Graphic: Via Charles Schwab Corporation-owned (NYSE: SCHW) TD Ameritrade’s Thinkorswim. The Eurodollar (FUTURE: /GE) futures curve is a reflection of participants’ outlook on interest rates. The peak of the Fed-rate-hike cycle – terminal rate – is around DEC 2022.

Positioning: Data on net gamma exposures points to more volatile ranges. 

Given the relationship between realized (RVOL) and implied (IVOL) volatility, as well as naive metrics for skew, it makes sense to not be a seller of volatility, especially in options that are short-dated and farther out.

Graphic: Via Pat Hennessy. “Tomorrow’s SPX expo (Jul1) is wildin… 26 vol for any strike with a 37 or 38 handle with a ridiculous curvature in the tails. God speed to all the 1dte theta gang. Selling OTM puts/calls for the same vol as ATM seems… umm… not good.”

Moreover, participants’ combined view is that markets are likely to head lower, via Deutsche Bank AG (NYSE: DB).

Graphic: Via Deutsche Bank AG (NYSE: DB). Taken from The Market Ear.

However, as we discussed in sessions prior, their demand for exposure to the upside resulted in “a flattening in the downside strike skew, while the upside wings have become more smiley.”

Graphic: Via JPMorgan Chase & Co (NYSE: JPM). Taken from The Market Ear.

A “higher starting point” in implied volatility (IVOL), and a still-present right-tail (from the positioning for a bear market rally), make it so we may position, for less cost, in short-dated structures with asymmetric payouts, on both sides of the market.

Read: For more on how to play, read the Daily Brief for June 30, 2022.

Technical: As of 6:30 AM ET, Tuesday’s regular session (9:30 AM – 4:00 PM ET), in the S&P 500, is likely to open in the middle part of a balanced overnight inventory, inside of prior-range and -value, suggesting a limited potential for immediate directional opportunity.

In the best case, the S&P 500 trades higher.

Any activity above the $3,821.50 LVNode puts into play the $3,857.25 ONH. Initiative trade beyond the ONH could reach as high as the $3,883.25 LVNode and $3,909.25 MCPOC, or higher.

In the worst case, the S&P 500 trades lower.

Any activity below the $3,821.50 LVNode puts into play the $3,793.75 HVNode. Initiative trade beyond the HVNode could reach as low as the $3,777.00 VPOC and $3,727.75 HVNode, or lower.

Click here to load today’s key levels into the web-based TradingView charting platform. Note that all levels are derived using the 65-minute timeframe. New links are produced, daily.
Graphic: 65-minute profile chart of the Micro E-mini S&P 500 Futures.

Definitions

Overnight Rally Highs (Lows): Typically, there is a low historical probability associated with overnight rally-highs (lows) ending the upside (downside) discovery process.

Volume Areas: A structurally sound market will build on areas of high volume (HVNodes). Should the market trend for long periods of time, it will lack sound structure, identified as low volume areas (LVNodes). LVNodes denote directional conviction and ought to offer support on any test. 

If participants were to auction and find acceptance into areas of prior low volume (LVNodes), then future discovery ought to be volatile and quick as participants look to HVNodes for favorable entry or exit.

POCs: POCs are valuable as they denote areas where two-sided trade was most prevalent in a prior day session. Participants will respond to future tests of value as they offer favorable entry and exit.

About

After years of self-education, strategy development, mentorship, and trial-and-error, Renato Leonard Capelj began trading full-time and founded Physik Invest to detail his methods, research, and performance in the markets.

Capelj also develops insights around impactful options market dynamics at SpotGamma and is a Benzinga reporter.

Some of his works include conversations with ARK Invest’s Catherine Wood, investors Kevin O’Leary and John Chambers, FTX’s Sam Bankman-Fried, former Bridgewater Associate Andy Constan, Kai Volatility’s Cem Karsan, The Ambrus Group’s Kris Sidial, among many others.

Disclaimer

In no way should the materials herein be construed as advice. Derivatives carry a substantial risk of loss. All content is for informational purposes only.

Categories
Commentary

Daily Brief For June 30, 2022

The daily brief is a free glimpse into the prevailing fundamental and technical drivers of U.S. equity market products. Join the 300+ that read this report daily, below!

What Happened

Overnight, equity index and commodity futures auctioned lower while bonds, the dollar, and implied volatility metrics were bid at the tail-end of the quarterly rebalancing period.

Participants have bet on a half-point rate cut in 2023 amid heightened recession odds, all the while the projected target rate sits in the range of 2.25-2.50% for the July 27, 2022 meeting.

Pursuant to this letter’s remarks in the days prior, trades biased long volatility are performing well, particularly those structured a standard deviation and beyond prior prices. We’ll unpack why that is, today.

Ahead is data on PCE inflation, disposable income, and consumer spending, as well as jobless claims (8:30 AM ET) and Chicago PMI (9:45 AM ET).

Graphic updated 6:30 AM ET. Sentiment Risk-Off if expected /ES open is below the prior day’s range. /ES levels are derived from the profile graphic at the bottom of the following section. Levels may have changed since initially quoted; click here for the latest levels. SqueezeMetrics Dark Pool Index (DIX) and Gamma (GEX) calculations are based on where the prior day’s reading falls with respect to the MAX and MIN of all occurrences available. A higher DIX is bullish. At the same time, the lower the GEX, the more (expected) volatility. Learn the implications of volatility, direction, and moneyness. SHIFT data used for S&P 500 (INDEX: SPX) options activity. Note that options flow is sorted by the call premium spent; if more positive, then more was spent on call options. Breadth reflects a reading of the prior day’s NYSE Advance/Decline indicator. VIX reflects a current reading of the CBOE Volatility Index (INDEX: VIX) from 0-100.

What To Expect

Fundamental: Discussed in recent letters were the prospects of whether a recession would be necessary for stemming inflation.

Read: The Fed needs to remove the heat from the demand without prompting an accident among mortgage financiers.

Graphic: Via Bloomberg. “[W]hat’s happened to mortgage-backed bonds this year is a radical departure. Bloomberg’s index dates back to 1988 when the asset class was still in its infancy. This is the first time it has ever withstood a decline that stretches into double figures.”

“That’s the message the market took,” Bloomberg’s John Authers explained. “[T]he most painful surprise over the second half of this year would be for inflation to stay sticky.”

“That would quash the belief in a swift easing campaign in 2023.”

Graphic: CME Group Inc’s (NASDAQ: CME) FedWatch Tool.

Some, like the Federal Reserve’s (Fed) Loretta Mester, suggest that gone are the days to err on the side of being too accommodative.

“It also calls into question the conventional view that monetary policy should always look through supply shocks,” Mester said. “In some circumstances, such shocks could threaten the stability of inflation expectations and would require policy action.”

Graphic: Via Bloomberg. “The Richmond Fed’s survey of manufacturing isn’t generally one of the most closely monitored releases, but as this one was the worst since the Great Recession (barring only one month during the Covid shutdown), it garnered more attention than usual.”

Moreover, the Fed’s preferred inflation measure – the personal consumption expenditure deflator (PCE) – is set to update. The expectation is that core PCE drops, “thanks to base effects from last year,” bolstering the “narrative that inflation will soon be licked.”

Graphic: Via Bloomberg.

Positioning: Discussed, earlier this week, was whether it made sense to lean toward owning volatility, rather than selling it outright.

A “higher starting point” in implied volatility (IVOL), and a still-present right-tail (from the positioning for a bear market rally), made it so we could position, for less cost, in short-dated structures with asymmetric payouts, on both sides of the market.

Read: Trading Volatility, Correlation, Term Structure and Skew by Colin Bennett et al. Originally sourced via Academia.edu.

For instance, S&P 500 (INDEX: SPX) spreads +1 (near-the-money) x -2 (out-of-the-money), in excess of 200 points or so in width and up to 15 days to expiration, are performing well, today, pricing in excess of a 600% gain, only after pricing for little to no cost to enter in the days prior.

Disclaimer: Have delta in the direction you want the market to move, as well as positive gamma. In our case, we wanted negative delta (short bias) and positive gamma (profits amplified).

Graphic: Via Glyn Holton. “Positive gamma corresponds to curvature that opens upward. Negative gamma corresponds to curvature that opens downward.”

Recent market weaknesses will allow us to monetize and rotate those proceeds into speculative directional bets on the call-side, potentially. After all, the money is made in not losing it. Stay nimble. These are not trade recommendations. Be open-minded.

Graphic: Via Pat Hennessy. “[T]he performance of short-dated 1×2 put ratios in SPX this year. Despite being short the tail, the grind lower has been well captured by this trade structure.”

Technical: As of 6:30 AM ET, Thursday’s regular session (9:30 AM – 4:00 PM ET), in the S&P 500, will likely open in the lower part of a negatively skewed overnight inventory, outside of prior-range and -value, suggesting a potential for immediate directional opportunity.

In the best case, the S&P 500 trades higher; activity above the $3,770.75 HVNode puts in play the $3,793.25 Ledge. Initiative trade beyond the Ledge could reach as high as the $3,821.50 LVNode and $3,840.75 ONH, or higher.

In the worst case, the S&P 500 trades lower; activity below the $3,770.75 HVNode puts in play the $3,735.75 HVNode. Initiative trade beyond the HVNode could reach as low as the $3,722.50 LVNode and $3,696.00 LVNode, or lower.

Click here to load today’s key levels into the web-based TradingView charting platform. Note that all levels are derived using the 65-minute timeframe. New links are produced, daily.
Graphic: 65-minute profile chart of the Micro E-mini S&P 500 Futures.

Considerations: Responsiveness near key-technical areas (that are discernable visually on a chart), suggests technically-driven traders with short time horizons are very active. 

Such traders often lack the wherewithal to defend retests and, additionally, the type of trade may be indicative of the other time frame participants waiting for more information to initiate trades.

Definitions

Overnight Rally Highs (Lows): Typically, there is a low historical probability associated with overnight rally-highs (lows) ending the upside (downside) discovery process.

Volume Areas: A structurally sound market will build on areas of high volume (HVNodes). Should the market trend for long periods of time, it will lack sound structure, identified as low volume areas (LVNodes). LVNodes denote directional conviction and ought to offer support on any test. 

If participants were to auction and find acceptance into areas of prior low volume (LVNodes), then future discovery ought to be volatile and quick as participants look to HVNodes for favorable entry or exit.

About

After years of self-education, strategy development, mentorship, and trial-and-error, Renato Leonard Capelj began trading full-time and founded Physik Invest to detail his methods, research, and performance in the markets.

Capelj also develops insights around impactful options market dynamics at SpotGamma and is a Benzinga reporter.

Some of his works include conversations with ARK Invest’s Catherine Wood, investors Kevin O’Leary and John Chambers, FTX’s Sam Bankman-Fried, Kai Volatility’s Cem Karsan, The Ambrus Group’s Kris Sidial, among many others.

Disclaimer

In no way should the materials herein be construed as advice. Derivatives carry a substantial risk of loss. All content is for informational purposes only.

Categories
Commentary

Daily Brief For June 28, 2022

The daily brief is a free glimpse into the prevailing fundamental and technical drivers of U.S. equity market products. Join the 300+ that read this report daily, below!

What Happened

Overnight, equity index futures rotated higher, along with commodities. Implied volatility was bid. Bonds were lower. 

In the news were some changes to China’s COVID policies, the European Central Bank’s (ECB) intent to follow its peers and raise interest rates in July by 25 basis points, and the Group of Seven (G-7) leaders are talking about geopolitics and placing limitations on Russia. 

At home, mortgage lenders are turning “desperate” as soaring rates roil their industry. Some are bracing for a 20% reduction in business as 30-year mortgage rates level out below 5.75%.

Pursuant to some of our analyses last week, Scion Asset Management founder Michael Burry suggested a “supply gut at retail is the bullwhip effect.” More on this, later.

Ahead is data on trade in goods (8:30 AM ET), S&P Case-Shiller U.S. home price index (9:00 AM ET), consumer confidence index (10:00 AM ET), as well as updates by Federal Reserve (Fed) members (8:00 AM ET and 12:30 PM ET).

Graphic updated 6:30 AM ET. Sentiment Neutral if expected /ES open is inside of the prior day’s range. /ES levels are derived from the profile graphic at the bottom of the following section. Levels may have changed since initially quoted; click here for the latest levels. SqueezeMetrics Dark Pool Index (DIX) and Gamma (GEX) calculations are based on where the prior day’s reading falls with respect to the MAX and MIN of all occurrences available. A higher DIX is bullish. At the same time, the lower the GEX, the more (expected) volatility. Learn the implications of volatility, direction, and moneyness. SHIFT data used for S&P 500 (INDEX: SPX) options activity. Note that options flow is sorted by the call premium spent; if more positive, then more was spent on call options. Breadth reflects a reading of the prior day’s NYSE Advance/Decline indicator. VIX reflects a current reading of the CBOE Volatility Index (INDEX: VIX) from 0-100.

What To Expect

Fundamental: Though badly timed, last year ARK Invest’s Cathie Wood said inflation would be on its way out due in part to inventory build-ups and their impact on commodity prices.

Graphic: Via Societe Generale SA (OTC: SCGLY).

At the time, she asked whether the velocity of money was depressed given pent-up savings and demand for assets, putting forth disappointing GDP updates (which grew, mostly, on the back of inventories) and slightly negative retail final sales as support for her broader thesis. 

Recall happenings in real estate – the iBuying debacle – late last year. Wood said this: 

“This is unsustainable, … and I’m wondering if even the housing market inflation is going to give way, here.”

Participants were extending moneyness to nonmonetary assets, given monetary policies and an environment of debt and leverage that ultimately cuts into asset price volatility. Ultimately, these trends bolster the risks of carry when volatility does rise and the demand for money pushes deflation, particularly in asset prices.

Read: Daily brief for May 18, 2022.

Graphic: Via the Investment Company Institute. Taken from Joseph Wang. “Investors are selling everything for cash.”

With bank deposits to drain about $1 trillion or so by year-end, that volatility is happening, now, as investors “continue to lower their selling prices to compete for the cash they want.”

Scion Asset Management’s Michael Burry nods at the “supply gut” in retail. Like Wood, he thinks that it is a deflationary pulse that manifests disinflation in consumer prices, prompting the Fed to reverse itself on rates and quantitative tightening (QT).

Read: DC’s Chartbook #16 on the “fundamental evolution in the global money markets.”

Graphic: Via Societe Generale SA (OTC: SCGLY).

That’s as Credit Suisse Group AG’s (NYSE: CS) Zoltan Pozsar, who gained much attention this year on his bold market commentary, said the Fed is likely to change course as it “can only deal with nominal [and] not real chokepoints.” This is as “nominal balance sheet and liquidity trends will, at some point, clash with the realities of a garden variety of supply chain issues.”

Graphic: Via @BarnabeBearBull. “[L]ast week 18 Central Banks tightened their monetary policy (12% of all monitored CBs), including 4 of the top 9. Strongest move in a while.”

Positioning: Incredible is the still-depressed volatility skew we’ve talked about ad nauseam on.

Graphic: Via JPMorgan Chase & Co (NYSE: JPM). Taken from The Market Ear. “Overwriting longs and using the premium to buy downside protection is relatively cheaper now.”

It’s the strong supply of volatility. Participants are hedging, buying into volatility that is closer to current prices, and selling (skew) that which is farther out. 

The counterparts are long that volatility further out, which they may sell into declines, and all of this, together, “results in vol underperformance on market declines,” per Sergei Perfiliev.

Graphic: Via Physik Invest. Taken from TradingView. The top is S&P 500 (INDEX: SPX). The second, from the top, is the Nations SkewDex (INDEX: SDEX), a clearer measure of options skew. The second from the bottom is the Cboe Volatility Index (INDEX: VIX). The bottom is the Cboe VVIX index (INDEX: VVIX), a naive measure of skew.

For that reason, the volatility that the markets are realizing (RVOL) is heightened and, at times, in excess of that implied.

Graphic: Via Goldman Sachs Group Inc (NYSE: GS). Taken from The Market Ear. “SPX 6-month realized volatility is at a level rarely seen outside of major crises; current 6-month implied volatility has been exceeded in just 3 periods since 1940.”

As said, yesterday, given these dynamics, it makes sense to lean toward owning volatility, rather than selling it. A “higher starting point” in IVOL, and a still-present right-tail (from the positioning for a bear market rally), make it so we may position, for less cost, in short-dated structures with asymmetric payouts (call and put side), precisely as we’ve been talking about for half-a-year.

Graphic: Via Pat Hennessy. “[T]he performance of short-dated 1×2 put ratios in SPX this year. Despite being short the tail, the grind lower has been well captured by this trade structure.”

In the near term, from a positioning perspective, the front-running of quarter-end repositioning flow is (and is expected), in part, to add to the equity market upside.

Graphic: Taken by Physik Invest from Interactive Brokers Group Inc (NASDAQ: IBKR) on 6/24/2022. Multi-expiry skew in the Invesco QQQ Trust Series 1 (NASDAQ: QQQ). Notice the v-shape in the shorter maturity and smirk in the longer maturity. Here’s what that means.

Technical: As of 6:30 AM ET, Tuesday’s regular session (9:30 AM – 4:00 PM ET), in the S&P 500, will likely open in the mid-to-upper part of a balanced overnight inventory, inside of prior-range and -value, suggesting a limited potential for immediate directional opportunity.

In the best case, the S&P 500 trades higher; activity above the $3,909.25 MCPOC puts in play the $3,943.25 HVNode. Initiative trade beyond the HVNode could reach as high as the $3,982.75 LVNode and $4,016.25 HVNode, or higher.

In the worst case, the S&P 500 trades lower; activity below the $3,909.25 MCPOC puts in play the $3,885.75 ONL. Initiative trade beyond the ONL could reach as low as the $3,821.50 LVNode and $3,793.25 Ledge, or lower.

Click here to load today’s key levels into the web-based TradingView charting platform. Note that all levels are derived using the 65-minute timeframe. New links are produced, daily.
Graphic: 65-minute profile chart of the Micro E-mini S&P 500 Futures.

Balanced (Two-Timeframe Or Bracket) Trade The Status Quo: Rotational trade that denotes current prices offer favorable entry and exit. 

Balance areas make it easy to spot a change in the market (i.e., the transition from two-time frame trade, or balance, to one-time frame trade, or trend). 

Modus operandi is responsive trade (i.e., fade the edges), rather than initiative trade (i.e., play the break).

Definitions

Overnight Rally Highs (Lows): Typically, there is a low historical probability associated with overnight rally-highs (lows) ending the upside (downside) discovery process.

Volume Areas: A structurally sound market will build on areas of high volume (HVNodes). Should the market trend for long periods of time, it will lack sound structure, identified as low volume areas (LVNodes). LVNodes denote directional conviction and ought to offer support on any test. 

If participants were to auction and find acceptance into areas of prior low volume (LVNodes), then future discovery ought to be volatile and quick as participants look to HVNodes for favorable entry or exit.

MCPOCs: POCs are valuable as they denote areas where two-sided trade was most prevalent over numerous day sessions. Participants will respond to future tests of value as they offer favorable entry and exit.

About

After years of self-education, strategy development, mentorship, and trial-and-error, Renato Leonard Capelj began trading full-time and founded Physik Invest to detail his methods, research, and performance in the markets.

Capelj also develops insights around impactful options market dynamics at SpotGamma and is a Benzinga reporter.

Some of his works include conversations with ARK Invest’s Catherine Wood, investors Kevin O’Leary and John Chambers, FTX’s Sam Bankman-Fried, Kai Volatility’s Cem Karsan, The Ambrus Group’s Kris Sidial, among many others.

Disclaimer

In no way should the materials herein be construed as advice. Derivatives carry a substantial risk of loss. All content is for informational purposes only.

Categories
Commentary

Daily Brief For June 10, 2022

The daily brief is a free glimpse into the prevailing fundamental and technical drivers of U.S. equity market products. Join the 300+ that read this report daily, below!

What Happened

Overnight, equity index futures continued lower after breaking a multi-day consolidation late yesterday afternoon.

This is amid growth concerns and the European Central Bank (ECB) decision to end asset purchases this month and commit to a 25-basis-point interest rate hike at its next meeting, setting the stage for further rate hikes, potentially 50-basis-points or higher.

Ahead are updates to consumer prices (8:30 AM ET), which may shed further clarity on the path of the Federal Reserve’s policies. Later are updates to consumer sentiment and inflation expectations (10:00 AM ET), as well as the budget balance (2:00 PM ET).

Graphic updated 6:30 AM ET. Sentiment Risk-Off if expected /ES open is below the prior day’s range. /ES levels are derived from the profile graphic at the bottom of the following section. Levels may have changed since initially quoted; click here for the latest levels. SqueezeMetrics Dark Pool Index (DIX) and Gamma (GEX) calculations are based on where the prior day’s reading falls with respect to the MAX and MIN of all occurrences available. A higher DIX is bullish. At the same time, the lower the GEX, the more (expected) volatility. Learn the implications of volatility, direction, and moneyness. SHIFT data used for S&P 500 (INDEX: SPX) options activity. Note that options flow is sorted by the call premium spent; if more positive, then more was spent on call options. Breadth reflects a reading of the prior day’s NYSE Advance/Decline indicator. VIX reflects a current reading of the CBOE Volatility Index (INDEX: VIX) from 0-100.

What To Expect

Fundamental: The CPI report is a driver of perceptions regarding future Fed activity.

Graphic: Via Societe Generale SA (OTC: SCGLY). Taken from The Market Ear. SocGen’s Kit Juckes explains that “the Fed put its foot down on the accelerator in 2020, harder than ever before, to keep the global economy going. Now it’s put its foot on the brake, equally hard but perhaps, a little bit late. How this plays out will become clearer in the coming weeks.”

Expected is an 8.2% rise year-over-year (YoY) and 0.7% month-over-month (MoM). In April, these numbers were 8.3% and 0.3%, respectively.

Core CPI (which excludes food and energy) is expected to rise by a rate lower than in April, 5.9% YoY and 0.5% MoM, respectively.

Graphic: Via Bloomberg. “For two straight months, fuel, power and grocery-store food have all been rising at double-digit annual rates—and tomorrow’s data is likely to show a further surge. Meantime, stocks fell with growth concerns in focus after the ECB moved to combat inflation.”

What matters most is the latter – core inflation – which the Fed has more control over. If lower than expected, that may warrant more appetite for risk.

“While inflation in some parts of the world [is] yet to peak, there are at least some signs emerging that we may not be too far off in terms of a turning point,” adds Khoon Goh of Australia & New Zealand Banking Group ADR (OTC: ANZBY).

Bloomberg reports semiconductor prices are now down 14% from the middle of last year. Also, the spot rate for shipping containers fell 26% while fertilizer prices are 24% below their record.

Still, the commitment to aggressive contractionary monetary policies is likely to remain. This reduction of liquidity and credit has consequences on the real economy and asset prices which rose and kept the deflationary pressures of monetary intervention at bay.

Positioning: It remains profitable to own options structures as implied (IVOL) underprices the volatility which is realized (RVOL).

This is the result of what options analytics service SqueezeMetrics suggests is an “absolute slamming” (i.e., sale of options) that’s compressing IVOL in shorter-dated tenors. 

It is “[o]nly rational to consider a bulk of them as put underwrites, because completely irrational otherwise.”

Important to note that this is in the context of next week’s large options expirations.

Into those events, typically, the frontrunning of delta hedging flows with respect to changes in time (charm), mainly, and volatility (vanna) provide an added boost. 

Graphic: Via SpotGamma. “SPX prices X-axis. Option delta Y-axis. When the factors of implied volatility and time change, hedging ratios change. For instance, if SPX is at $4,700.00 and IV jumps 15% (all else equal), the dealer may sell an additional 0.2 deltas to hedge their exposure to the addition of a positive 0.2 delta. The graphic is for illustrational purposes, only.”

As stated Monday, however, the marginal impact of further volatility compression, since IVOL was falling from already low levels, was likely to do less to bolster equity upside. 

A lot of the supportive action happened in the days and weeks prior, hence the comments on owning options.

Graphic: @pat_hennessy breaks down returns for the S&P 500, categorized by the week relative to OPEX. 

Technical: As of 6:30 AM ET, Friday’s regular session (9:30 AM – 4:00 PM ET), in the S&P 500, will likely open in the lower part of a negatively skewed overnight inventory, outside of prior-range and -value, suggesting a potential for immediate directional opportunity.

In the best case, the S&P 500 trades higher; activity above the $4,016.25 HVNode puts in play the $4,055.25 LVNode. Initiative trade beyond the LVNode could reach as high as the $4,071.50 BAL and $4,095.00 VPOC, or higher.

In the worst case, the S&P 500 trades lower; activity below the $4,016.25 HVNode puts in play the $3,982.75 LVNode. Initiative trade beyond the LVNode could reach as low as the $3,951.00 VPOC and $3,909.25 MCPOC, or lower.

Click here to load today’s key levels into the web-based TradingView charting platform. Note that all levels are derived using the 65-minute timeframe. New links are produced, daily.
Graphic: 65-minute profile chart of the Micro E-mini S&P 500 Futures.

Standard Balance-Break + Gap Scenarios: A change in the market (i.e., the transition from two-time frame trade, or balance, to one-time frame trade, or trend) is occurring.

Monitor for acceptance (i.e., more than 1-hour of trade) outside of the balance area. 

Leaving value behind on a gap-fill or failing to fill a gap (i.e., remaining outside of the prior session’s range) is a go-with indicator. 

Rejection (i.e., return inside of balance) portends a move to the opposite end of the balance.

Definitions

Volume Areas: A structurally sound market will build on areas of high volume (HVNodes). Should the market trend for long periods of time, it will lack sound structure, identified as low volume areas (LVNodes). LVNodes denote directional conviction and ought to offer support on any test. 

If participants were to auction and find acceptance into areas of prior low volume (LVNodes), then future discovery ought to be volatile and quick as participants look to HVNodes for favorable entry or exit.

Point Of Control: POCs are valuable as they denote areas where two-sided trade was most prevalent in a prior day session. Participants will respond to future tests of value as they offer favorable entry and exit.

Micro Composite Point Of Control: POCs are valuable as they denote areas where two-sided trade was most prevalent over numerous day sessions. Participants will respond to future tests of value as they offer favorable entry and exit.

Volume-Weighted Average Prices (VWAPs): A metric highly regarded by chief investment officers, among other participants, for quality of trade. Additionally, liquidity algorithms are benchmarked and programmed to buy and sell around VWAPs.

About

After years of self-education, strategy development, mentorship, and trial-and-error, Renato Leonard Capelj began trading full-time and founded Physik Invest to detail his methods, research, and performance in the markets.

Capelj also develops insights around impactful options market dynamics at SpotGamma and is a Benzinga reporter.

Some of his works include conversations with ARK Invest’s Catherine Wood, investors Kevin O’Leary and John Chambers, FTX’s Sam Bankman-Fried, Kai Volatility’s Cem Karsan, The Ambrus Group’s Kris Sidial, among many others.

Disclaimer

In no way should the materials herein be construed as advice. Derivatives carry a substantial risk of loss. All content is for informational purposes only.

Categories
Commentary

Daily Brief For May 17, 2022

The daily brief is a free glimpse into the prevailing fundamental and technical drivers of U.S. equity market products. Join the 300+ that read this report daily, below!

What Happened

Overnight, equity index futures were higher. The S&P 500, in particular, probed the high end of the low-volume (gap) area it broke into on May 9, 2022.

The key is to monitor whether the S&P 500 is able to sustain the prices it discovered overnight. If so, then the odds that participants are, indeed, hammering out a bottom are heightened.

Ahead is data on retail sales (8:30 AM ET), industrial production and capacity utilization (9:15 AM ET), the NAHB home builders’ index, and business inventories (10:00 AM ET).

Fed-speak is scattered. At 9:15 AM ET, the Philadelphia Fed’s Patrick Harker speaks on health care. At 2:00 PM ET, Fed Chair Jerome Powell is interviewed by the WSJ. At 2:30 PM ET, the Cleveland Fed’s Loretta Mester talks at an inflation conference. And, lastly, at 6:45 PM ET, the Chicago Fed’s Charles Evans speaks.

Graphic updated 6:50 AM ET. Sentiment Risk-On if expected /ES open is above the prior day’s range. /ES levels are derived from the profile graphic at the bottom of the following section. Levels may have changed since initially quoted; click here for the latest levels. SqueezeMetrics Dark Pool Index (DIX) and Gamma (GEX) calculations are based on where the prior day’s reading falls with respect to the MAX and MIN of all occurrences available. A higher DIX is bullish. At the same time, the lower the GEX, the more (expected) volatility. Learn the implications of volatility, direction, and moneyness. SHIFT data used for S&P 500 (INDEX: SPX) options activity. Note that options flow is sorted by the call premium spent; if more positive, then more was spent on call options. Breadth reflects a reading of the prior day’s NYSE Advance/Decline indicator. VIX reflects a current reading of the CBOE Volatility Index (INDEX: VIX) from 0-100.

What To Expect

Fundamental: Out of all the news, it was noteworthy when Elon Musk broke with the prevailing opinion to declare the U.S. was facing a tough recession that would last up to 18 months. 

This is on the heels of a large “misallocation of capital,” he says, caused by the government printing “a zillion amount of more money than it had.”

Musk cautioned companies to watch their costs and cash flows, the latter of which we talked on the importance of in cycles where monetary conditions are tighter and there is less money to be had for corporates who are taking “the long view” and “competing on eyeballs and growth,” per Kai Volatility’s Cem Karsan who this letter’s writer spoke with last summer.

As Karsan puts it, over the last four decades, monetary policy was a go-to for supporting the economy. Money was sent to capital and that promoted deflation, ultimately creating “a disinterest and unimportance to cash flows.”

“Monetary policy has a velocity of almost zero, it goes directly to ‘Planet Palo Alto,’ and Palo Alto creates new technologies,” Moontower’s Kris Abdelmesih puts well in a summary of Karsan’s macro thesis.

“They’re sophisticated, futuristic people. They provide new self-driving cars and things getting delivered to your doorstep. They create supply … [and] does not increase demand. And so it is deflationary.”

Over the last years, in light of talk to address increasing inequality, money was sent to labor, so to speak, and that promoted inflation.

Moreover, today’s contractionary monetary policy is a blunt tool and is not equipped to “address the main problem which is a lack of supply to absorb the demand.”

Please read Moontower’s full write-up, here.

That’s sort of in accordance with comments we quoted Credit Suisse Group AG’s (NYSE: CS) Zoltan Pozsar making, yesterday. Essentially, “the Fed is pursuing demand destruction through negative wealth effects,” as the “central banks can only deal with nominal” chokepoints.

By that token, we must “[c]onsider at least the possibility that the extreme volatility and lack of liquidity [we] see in markets is by design, and the Fed will not be deterred by it, but rather that it will be emboldened by it in its singular pursuit of price stability.”

With even President Biden endorsing the closure of the “wealth window,” Karsan believes corporations will have to worry about making money again.

“These cycles are a lot shorter than the monetary supply-side cycles but they tend to be very bad for multiples and great for economic growth.”

With that in mind, there is no escape. Even the traditional bond-stock relationship – the 60/40 framework – is at risk of being upended.

Graphic: Via Andy Constan of Damped Spring Advisors. “Zero rate hikes in 2023. Clearly, a recession is being priced in.” Per Bloomberg, a Bank of America Corporation (NYSE: BAC) survey puts the Fed put (a pivot) at $3,529.00 in the S&P 500.

Positioning: Measures of implied volatility came in. That’s significant since participants have a lot of exposure to put options.

Further, we see liquidity providers being short those puts. As volatility continues to come in, the exposure of those options to direction (delta) compresses. 

As a result, liquidity providers will taper some of their negative delta short stock and futures hedges to that positive delta put position.

Graphic: Via SpotGamma. “SPX prices X-axis. Option delta Y-axis. When the factors of implied volatility and time change, hedging ratios change. For instance, if SPX is at $4,700.00 and IV jumps 15% (all else equal), the dealer may sell an additional 0.2 deltas to hedge their exposure to the addition of a positive 0.2 delta. The graphic is for illustrational purposes, only.”

Those delta hedging flows with respect to changes in volatility (vanna) are on top of what has historically been a front-running of the bullish flow associated with the delta decay of options, particularly with respect to time (charm), into options expirations (OPEX). 

Graphic: @pat_hennessy breaks down returns for the S&P 500, categorized by the week relative to OPEX. 

Notwithstanding, though proxies for buying and this hedging of existing options positioning, at the surface, appear to point to positively (skewed) forward returns, we have concern over the level at which from implied volatility is dropping from, and the general divergence between the volatility realized and implied, talked about yesterday.

Basically, as SpotGamma says, there’s not as much “stored energy to catalyze a rally.” 

SqueezeMetrics adds

The Cboe Volatility Index (INDEX: VIX) compressing, while dealer gamma exposure is “more negative than it’s been in years is not how you get sustained rallies–it’s how you get energy for bigger downside moves.”

Therefore, we continue to focus on participating in upside with as little debit risk as possible, via the use of complex strategies, further validated by quoted research.

Graphic: Via Goldman Sachs Group Inc. The VIX’s “high starting point leaves vol high overall, and we like strategies with a short volatility bias, including put selling and 1×2 call spread overlays.”

Technical: As of 6:30 AM ET, Tuesday’s regular session (9:30 AM – 4:00 PM ET), in the S&P 500, will likely open in the upper part of a positively skewed overnight inventory, outside of prior-range and -value, suggesting a potential for immediate directional opportunity.

In the best case, the S&P 500 trades higher; activity above the $4,083.75 overnight high (ONH) puts in play the $4,119.00 untested point of control (VPOC). Initiative trade beyond the VPOC could reach as high as the $4,148.25 and $4,184.25 high volume nodes (HVNodes), or higher.

In the worst case, the S&P 500 trades lower; activity below the $4,083.75 ONH puts in play the $4,055.75 low volume area (LVNode). Initiative trade beyond the LVNode could reach as low as the $4,013.25 micro composite point of control (MCPOC) and $3,978.50 LVNode, or lower.

Click here to load today’s key levels into the web-based TradingView charting platform. Note that all levels are derived using the 65-minute timeframe. New links are produced, daily.
Graphic: 65-minute profile chart of the Micro E-mini S&P 500 Futures.

Considerations: A push-and-pull between the largest of S&P 500 weights.

For instance, Apple Inc (NASDAQ: AAPL) is clinging to its prior trend.

Graphic: Via Bloomberg.

All the while products like Amazon Inc (NASDAQ: AMZN), are trading into key supports.

Graphic: Via Bloomberg.

We continue to monitor our market internals and (large) changes in positioning (e.g., open interest builds at higher prices further out in time) that will provide further validation to this most recent S&P 500 reversal.

Graphic: Market Internals as pioneered by (a mentor of mine) Peter Reznicek. Current reads of breadth (top charts), in particular, are uninspiring. An advance you do not short has an advance-decline line that’s pegged at +2,000, coupled with a Tick (bottom left) that has trouble closing below 0 for nearly the entirety of a session. Caution.

What People Are Saying

Definitions

Overnight Rally Highs (Lows): Typically, there is a low historical probability associated with overnight rally-highs (lows) ending the upside (downside) discovery process.

Volume Areas: A structurally sound market will build on areas of high volume (HVNodes). Should the market trend for long periods of time, it will lack sound structure, identified as low volume areas (LVNodes). LVNodes denote directional conviction and ought to offer support on any test. 

If participants were to auction and find acceptance into areas of prior low volume (LVNodes), then future discovery ought to be volatile and quick as participants look to HVNodes for favorable entry or exit.

POCs: POCs are valuable as they denote areas where two-sided trade was most prevalent in a prior day session. Participants will respond to future tests of value as they offer favorable entry and exit.

MCPOCs: POCs are valuable as they denote areas where two-sided trade was most prevalent over numerous day sessions. Participants will respond to future tests of value as they offer favorable entry and exit.

About

After years of self-education, strategy development, mentorship, and trial-and-error, Renato Leonard Capelj began trading full-time and founded Physik Invest to detail his methods, research, and performance in the markets.

Capelj also develops insights around impactful options market dynamics at SpotGamma and is a Benzinga reporter.

Some of his works include conversations with ARK Invest’s Catherine Wood, investors Kevin O’Leary and John Chambers, FTX’s Sam Bankman-Fried, Kai Volatility’s Cem Karsan, The Ambrus Group’s Kris Sidial, among many others.

Disclaimer

In no way should the materials herein be construed as advice. Derivatives carry a substantial risk of loss. All content is for informational purposes only.

Categories
Commentary

Daily Brief For May 12, 2022

The daily brief is a free glimpse into the prevailing fundamental and technical drivers of U.S. equity market products. Join the 300+ that read this report daily, below!

What Happened

Overnight, equity index futures auctioned lower, mostly, alongside most commodities and crypto.

Notable is how orderly the selling has been, particularly in the equity space. That’s due in part to suppressive volatility selling, as well as passive flows supporting the largest index constituents.

The fundamental narrative has changed little. Chief among participants’ worries are growth and inflation, the monetary response to the two, as well as chokepoints not limited to supply chains.

Ahead is data on jobless claims and the producer price index (8:30 AM ET), as well as Fed-speak by Mary Daly (4:00 PM ET).

Graphic updated 7:15 AM ET. Sentiment Risk-Off if expected /ES open is below the prior day’s range. /ES levels are derived from the profile graphic at the bottom of the following section. Levels may have changed since initially quoted; click here for the latest levels. SqueezeMetrics Dark Pool Index (DIX) and Gamma (GEX) calculations are based on where the prior day’s reading falls with respect to the MAX and MIN of all occurrences available. A higher DIX is bullish. At the same time, the lower the GEX, the more (expected) volatility. Learn the implications of volatility, direction, and moneyness. SHIFT data used for S&P 500 (INDEX: SPX) options activity. Note that options flow is sorted by the call premium spent; if more positive, then more was spent on call options. Breadth reflects a reading of the prior day’s NYSE Advance/Decline indicator. VIX reflects a current reading of the CBOE Volatility Index (INDEX: VIX) from 0-100.

What To Expect

Fundamental: In Wednesday’s morning letter, we talked about the expectations for annual inflation to have peaked and month-on-month inflation to have risen a small amount.

Per Bloomberg, “the broader CPI rose 0.3% from the prior month and 8.3% on an annual basis, a slight cooling but still among the highest readings in decades.”

Stocks were sold, after, on the limited change to the broader fundamental outlook. The hardest hit was growth and technology, including cryptocurrency. 

“Now that central banks are unwinding monetary support, growth stocks’ valuations have further to fall,” Citigroup Inc (NYSE: C) strategists including Robert Buckland said

Notwithstanding, “any stabilization in nominal yields should eventually help to stabilize real yields and hence equity valuations.” 

This is because higher rates play into bigger discounts on future profit.

Graphic: Via Bloomberg.

Positioning: Orderly selling continues.

Despite falling about the same distance (peak to present low) during the equity market rout of 2020, selling, this time around is steady and there is no panic, and that’s partly the result of there being “plenty of put-buyers, but nearly as many sellers,” according to SqueezeMetrics.

Accordingly, using off-exchange short sales as a proxy for buying activity, we see implicit buying support, and that’s due in part to “passive flows” which ultimately end up “supporting the largest stocks,” hence the index’s strength versus smaller (and much weaker) constituents.

Taken together, some metrics this letter often looks to for insight into the potential distribution of future returns, carry less weight; it’s odds and when the largest stocks succumb to fundamental weaknesses, for lack of a better way of expressing it, that likely takes the indexes with it.

Graphic: Via Physik Invest. Data retrieved from SqueezeMetrics. A higher DIX/GEX ratio has historically been associated with S&P 500 outperformance in the subsequent month. A very low DIX/GEX ratio has historically been associated with positive S&P 500 performance in the subsequent month, though there are many more negative outliers.

Moreover, with the S&P 500’s break of $4,000.00, an area around which there is a lot of open interest, particularly on the put side, “increases capitulation risk” in the case participants start reaching for protection and indirectly taking from market liquidity as liquidity providers sell into weakness to hedge.

Notwithstanding, later this month is a large options expiration (OPEX), and expected is the roll-off of a large amount of put-heavy negative gamma. Per Pat Hennessy of IPS Strategic Capital, returns one to two weeks prior are skewed bullish.

Ways to participate in upside, while limiting downside, markedly, were discussed on May 10. Making money is one thing. Not losing money is another.

Lose less when wrong. Make more when right.
Graphic: @pat_hennessy breaks down returns for the S&P 500, categorized by the week relative to OPEX. 

Technical: As of 6:45 AM ET, Thursday’s regular session (9:30 AM – 4:00 PM ET), in the S&P 500, will likely open in the lower part of a negatively skewed overnight inventory, outside of prior-range and -value, suggesting a potential for immediate directional opportunity.

In the best case, the S&P 500 trades higher; activity above the $3,907.75 micro composite point of control (MCPOC) puts in play the $3,943.25 high volume area (HVNode). Initiative trade beyond the $3,943.25 HVNode could reach as high as the $4,011.00 untested point of control (VPOC) and $4,069.25 HVNode, or higher.

In the worst case, the S&P 500 trades lower; activity below the $3,907.75 MCPOC puts in play the $3,862.75 LVNode. Initiative trade beyond the $3,862.75 LVNode could reach as low as the $3,816.75 and $3,780.75 LVNodes, or lower.

Click here to load today’s key levels into the web-based TradingView charting platform. Note that all levels are derived using the 65-minute timeframe. New links are produced, daily.
Graphic: 65-minute profile chart of the Micro E-mini S&P 500 Futures.

What People Are Saying

Definitions

Volume Areas: A structurally sound market will build on areas of high volume (HVNodes). Should the market trend for long periods of time, it will lack sound structure, identified as low volume areas (LVNodes). LVNodes denote directional conviction and ought to offer support on any test. 

If participants were to auction and find acceptance into areas of prior low volume (LVNodes), then future discovery ought to be volatile and quick as participants look to HVNodes for favorable entry or exit.

POCs: POCs are valuable as they denote areas where two-sided trade was most prevalent in a prior day session. Participants will respond to future tests of value as they offer favorable entry and exit.

MCPOCs: POCs are valuable as they denote areas where two-sided trade was most prevalent over numerous day sessions. Participants will respond to future tests of value as they offer favorable entry and exit.

About

After years of self-education, strategy development, mentorship, and trial-and-error, Renato Leonard Capelj began trading full-time and founded Physik Invest to detail his methods, research, and performance in the markets.

Capelj also develops insights around impactful options market dynamics at SpotGamma and is a Benzinga reporter.

Some of his works include conversations with ARK Invest’s Catherine Wood, investors Kevin O’Leary and John Chambers, FTX’s Sam Bankman-Fried, Kai Volatility’s Cem Karsan, The Ambrus Group’s Kris Sidial, among many others.

 Disclaimer

In no way should the materials herein be construed as advice. Derivatives carry a substantial risk of loss. All content is for informational purposes only.

Categories
Commentary

Daily Brief For May 10, 2022

The Daily Brief is a free glimpse into the prevailing fundamental and technical drivers of U.S. equity market products. Join the 200+ that read this report daily, below!

What Happened

Overnight, equity index futures auctioned sideways to higher, inside of the prior day’s range. Most other commodity and bond futures were bid while implied volatility metrics came in a bit.

Notable was the depth and breadth of Monday’s decline. Though the indexes were tame, some of which is attributable to suppressive hedging, single stocks expanded their ranges, greatly, to the downside, and this points to potential capitulation.

On the news front, a U.S. central bank report found that “the risk of a sudden significant deterioration [in liquidity] appears higher than normal” and stablecoin use to meet margin requirements in crypto trades makes them “vulnerable to runs.”

This is just as some algorithmic stablecoins have lost their peg (e.g., UST/USD ~$0.60).

Additionally, the report found elevated inflation, as well as the reaction to that “could negatively affect domestic economic activity, asset prices, credit quality, and financial conditions.”

Ahead is data on real household debt (11:00 AM ET).

Graphic updated 6:25 AM ET. Sentiment Neutral if expected /ES open is inside of the prior day’s range. /ES levels are derived from the profile graphic at the bottom of the following section. Levels may have changed since initially quoted; click here for the latest levels. SqueezeMetrics Dark Pool Index (DIX) and Gamma (GEX) calculations are based on where the prior day’s reading falls with respect to the MAX and MIN of all occurrences available. A higher DIX is bullish. At the same time, the lower the GEX, the more (expected) volatility. Learn the implications of volatility, direction, and moneyness. SHIFT data used for S&P 500 (INDEX: SPX) options activity. Note that options flow is sorted by the call premium spent; if more positive, then more was spent on call options. Breadth reflects a reading of the prior day’s NYSE Advance/Decline indicator. VIX reflects a current reading of the CBOE Volatility Index (INDEX: VIX) from 0-100.

What To Expect

Context: We continue to build out the narrative.

A market-wide drop, Monday, pointed to signs of capitulation as “small-time investors offloaded a net of about $1 billion in equities, the most aggressive selling in 14 months,” per JPMorgan Chase & Co (NYSE: JPM).

Graphic: Via @TaviCosta. “Nasdaq has already declined almost as much as it did during the March 2020 crash. Back then, the Fed was all about saving the stock market and the economy. Today, it’s all about how much more they are going to hike rates.

Notwithstanding, the volatility divergences this letter has pointed to, in the face of pronounced realized volatility, continue.

Graphic: Via Topdown Charts. Wednesday (FOMC) price rise (right) versus Thursday (post-FOMC) liquidation.

As Pat Hennessy of IPS Strategic Capital explains, at-the-money implied volatility is high and term structure is in backwardation, which are reflections of uncertainty and demand for hedges.

Graphic: Via SpotGamma. At-the-money implied volatility is backwardated given the heightened demand for shorter-dated protection, relative to that which is longer-dated.

“It’s just rare to see wingy short-dated puts like this so cheap relative to ATM.”

As explained in Monday’s letter (and in greater detail, Friday), a measure like the Cboe VVIX Index (INDEX: VVIX), or the volatility of volatility, has a mean below 100 and a high correlation with the Cboe Volatility Index (INDEX: VIX) during times of stress.

When realized volatility is as high as it is, today, the VVIX typically trades closer to 150.

To quote Benn Eifert of QVR Advisors: “Skew goes up if vol outperforms the skew curve a lot on  a selloff.”

Graphic: Updated May 9, 2022. The VVIX via Physik Invest.

What’s going on? 

There is really negative sentiment and emotion, both of which are playing into market weaknesses and realized volatility. However, that realized volatility is not priced in.

There are “plenty of put-buyers, but nearly as many sellers,” SqueezeMetrics explains

You “don’t have to protect what you don’t own. Some investors de-grossed. Short momo (e.g., CTA) wants to bet on a bleed (a la 2000), but not on a crash. Put underwriting! No carry trades elsewhere. Sell SPX vol!”

Graphic: Via SpotGamma’s Hedging Impact of Real-Time Options (HIRO) indicator, the SPDR S&P 500 ETF Trust (NYSE: SPY) was a recipient of heavy put selling and call buying on 5/9/22.

Why does this matter?

When you think there is to be an outsized move in the underlying, relative to what is priced, you buy options (positive exposure to gamma) so that you may have gains that are potentially amplified in case of directional movement.

When you think there is to be an outsized move in the implied volatility, relative to what is priced, you buy options (positive exposure to volga) so that you may have gains that are potentially amplified in case of implied volatility repricing.

So, in all, it is a question of whether the reward is worth the risk (see below “How To Play”).

Based on stretched positioning, equity markets are positioned for upside. Notwithstanding, the potential for large negative outliers, remains. In the case of an outlier, the consequent repricing of volatility may increase the reward, relative to the risk, for selling options, particularly puts.

As The Ambrus Group’s Kris Sidial sums well: 

With an S&P 500 below $4,000.00, “I would expect more of an aggressive reach for hedges … that spot- vol correlation break (weakness) would not be as present.”

“Spot- vol correlation has sucked recently, but vol relative strength should kick in.”

How I’m Playing: Borrowing from May 3’s letter, here.

Presently, the market is stretched to the downside and, as SpotGamma says, “traders are underpricing right-tail risk,” which opens the window for unique ways to play a returns distribution that continues to be skewed positive (albeit with large negative outliers).

This letter’s author is concentrated on zero- and low-cost bets ($0.00-$1.00 debit to open) that deliver asymmetric payouts (sometimes in excess of $10.00 credit to close) in case of violent and short-lived reversals.

This letter’s author is structured positive delta and gamma in the Nasdaq 100 (INDEX: NDX) via ratios spread (1×2) and butterfly (1x2x1) structures.

Graphic: Via Banco Santander SA (NYSE: SAN) research, the return profile, at expiry, of a classic 1×2 (long 1, short 2 further away) ratio spread.

The concern with these strategies is the width and time to expiry. Should either of those be wrong, then spreads initially positive gamma turn negative, meaning losses are amplified.

For instance, in the Nasdaq 100, to put in short, 500-1000 points wide ratio spreads (buy the closer leg, sell two of the farther legs) expiring in ten to fifteen days work well.

For those spreads that are not zero cost, debits can be offset with credit sales (on the put side) in products that have shown relative strength like the S&P 500 (INDEX: SPX). This, inherently, carries more risk, and, as explained, the risk has yet to meet the reward.

Read more about these strategies, here. The above is NOT a trade recommendation or advice.

Technical: As of 6:30 AM ET, Tuesday’s regular session (9:30 AM – 4:00 PM ET), in the S&P 500, will likely open in the middle part of a balanced overnight inventory, inside of prior-range and -value, suggesting a limited potential for immediate directional opportunity.

In the best case, the S&P 500 trades higher; activity above the $3,978.50 low volume area (LVNode/gap boundary) puts in play the $4,055.75 LVNode/gap boundary. Initiative trade beyond the $4,055.75 could reach as high as the $4,119.00 untested point of control (VPOC) and $4,153.25 regular trade high (RTH High), or higher.

In the worst case, the S&P 500 trades lower; activity below the $3,978.50 LVNode/gap boundary puts in play the $3,943.25 high volume area (HVNode). Initiative trade beyond the $3,943.25 could reach as low as the $3,907.75 HVNode and $3,862.75 LVNode, or lower.

Click here to load today’s key levels into the web-based TradingView charting platform. Note that all levels are derived using the 65-minute timeframe. New links are produced, daily.
Graphic: 65-minute profile chart of the Micro E-mini S&P 500 Futures.

Definitions

Cave-Fill Process: Widened the area deemed favorable to transact at by an increased share of participants. This is a good development.

Volume Areas: A structurally sound market will build on areas of high volume (HVNodes). Should the market trend for long periods of time, it will lack sound structure, identified as low volume areas (LVNodes). LVNodes denote directional conviction and ought to offer support on any test. 

If participants were to auction and find acceptance into areas of prior low volume (LVNodes), then future discovery ought to be volatile and quick as participants look to HVNodes for favorable entry or exit.

Gamma: Gamma is the sensitivity of an option to changes in the underlying price.

Vanna: The rate at which the delta of an option changes with respect to volatility.

Charm: The rate at which the delta of an option changes with respect to time.

Options: If an option buyer was short (long) stock, he or she would buy a call (put) to hedge upside (downside) exposure. Option buyers can also use options as an efficient way to gain directional exposure.

POCs: POCs are valuable as they denote areas where two-sided trade was most prevalent in a prior day session. Participants will respond to future tests of value as they offer favorable entry and exit.

MCPOCs: POCs are valuable as they denote areas where two-sided trade was most prevalent over numerous day sessions. Participants will respond to future tests of value as they offer favorable entry and exit.

Options Expiration (OPEX): Reduction of dealer gamma exposure.

Volume-Weighted Average Prices (VWAPs): A metric highly regarded by chief investment officers, among other participants, for quality of trade. Additionally, liquidity algorithms are benchmarked and programmed to buy and sell around VWAPs.

About

After years of self-education, strategy development, mentorship, and trial-and-error, Renato Leonard Capelj began trading full-time and founded Physik Invest to detail his methods, research, and performance in the markets.

Capelj also develops insights around impactful options market dynamics at SpotGamma and is a Benzinga reporter.

Some of his works include conversations with ARK Invest’s Catherine Wood, investors Kevin O’Leary and John Chambers, FTX’s Sam Bankman-Fried, Kai Volatility’s Cem Karsan, The Ambrus Group’s Kris Sidial, among many others.

Disclaimer

In no way should the materials herein be construed as advice. Derivatives carry a substantial risk of loss. All content is for informational purposes only.