Hey, all! I hope you had a great weekend. We’re sticking to our promise, as shared on Substack. Today, we dive into what’s driving markets and what the near future may look like. Generally speaking, on Monday, we will do deeper dives like this. Friday, we will do recaps. Trade ideas are coming soon via monthly research, which will look similar to this linked document.
Climbing A Wall Of Worry
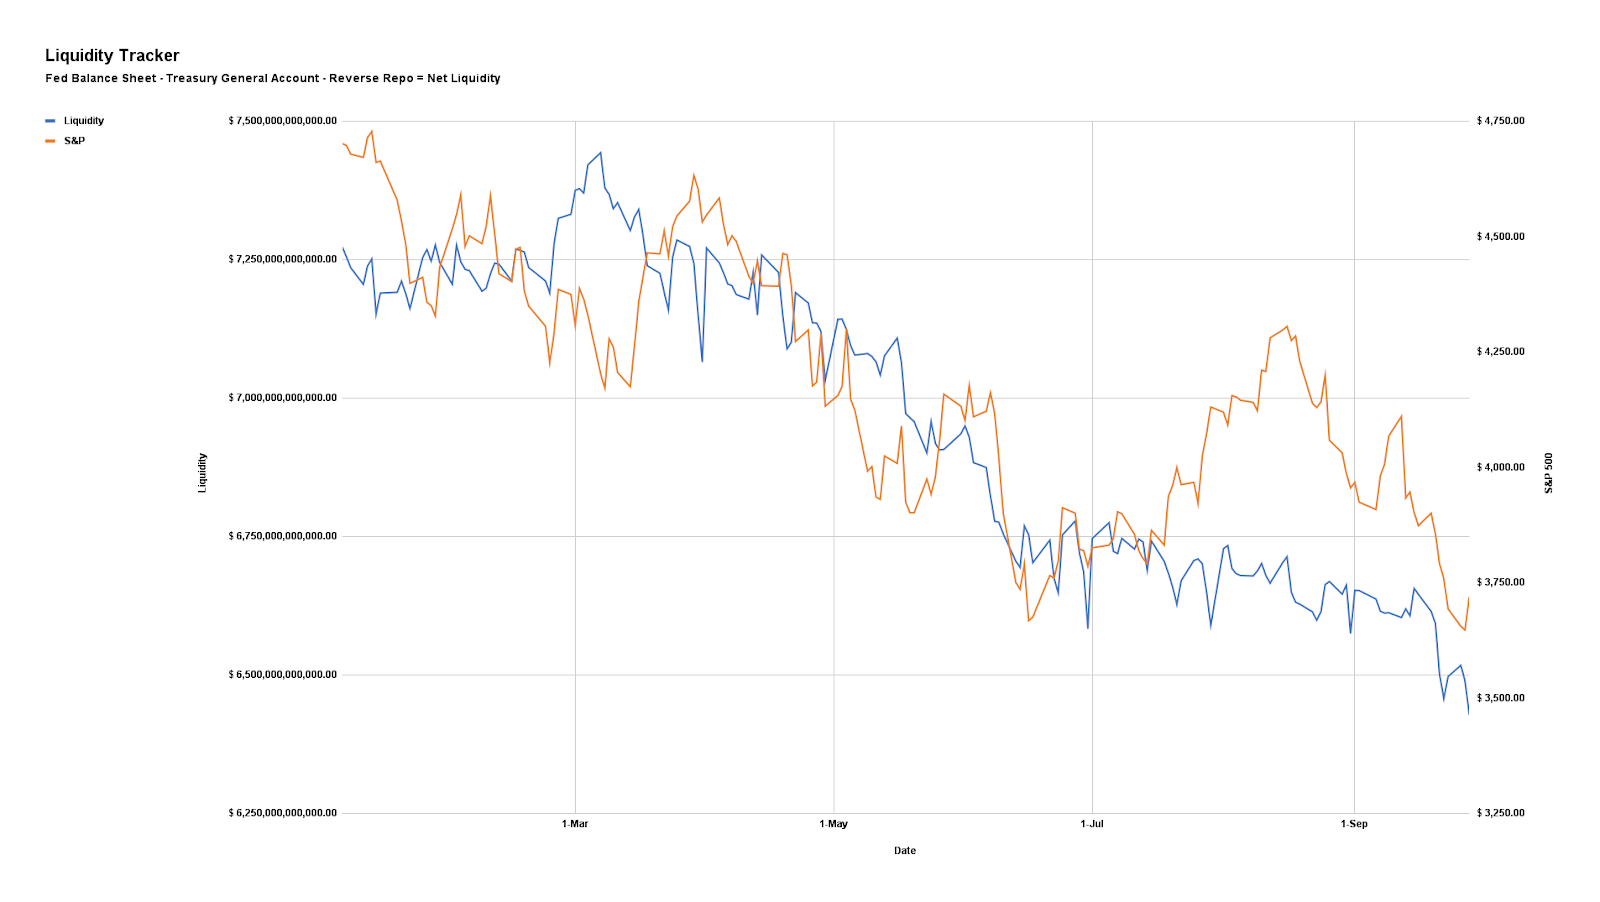
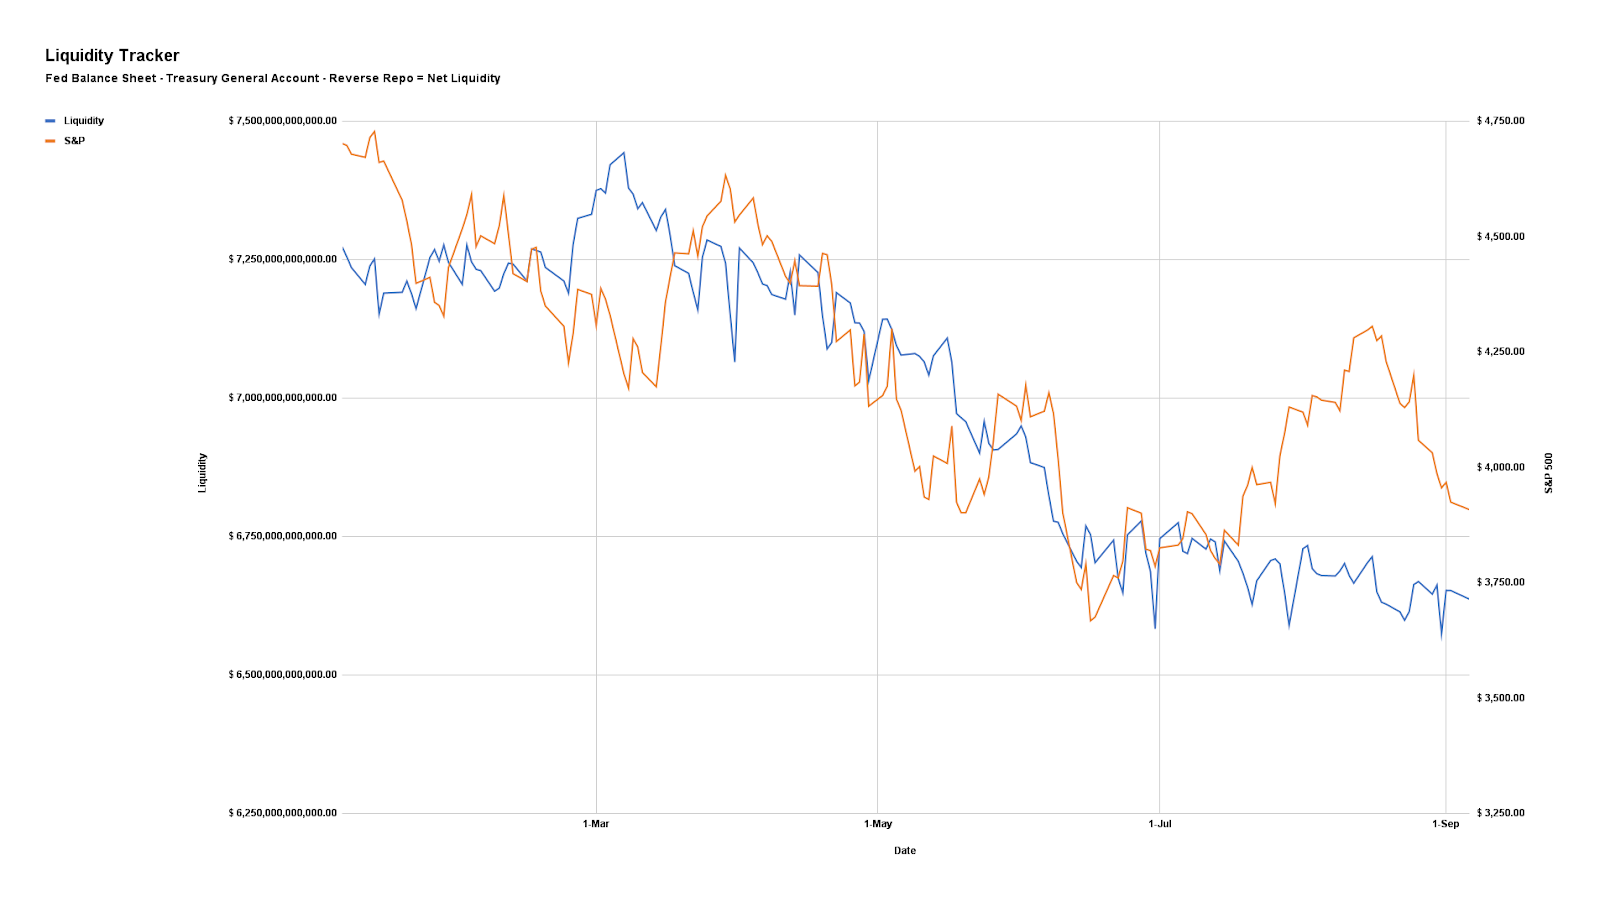
The upward momentum persists in markets, benefiting from the unwinding of short positions from 2022, relief in inflation, global liquidity injections (with additional back-door support), enthusiastic technology investors, and the effects of reinvestment and re-collateralization. Yes, indeed, Santa Claus exists!
The question is, how much longer can this strength last? According to CrossBorder Capital, the answer is longer. Equities and monetary hedges like gold and crypto may do well with tailwinds, including global liquidity boosts, lasting well into 2025. Is an S&P 500 reaching $5,000 within the realm of possibility?
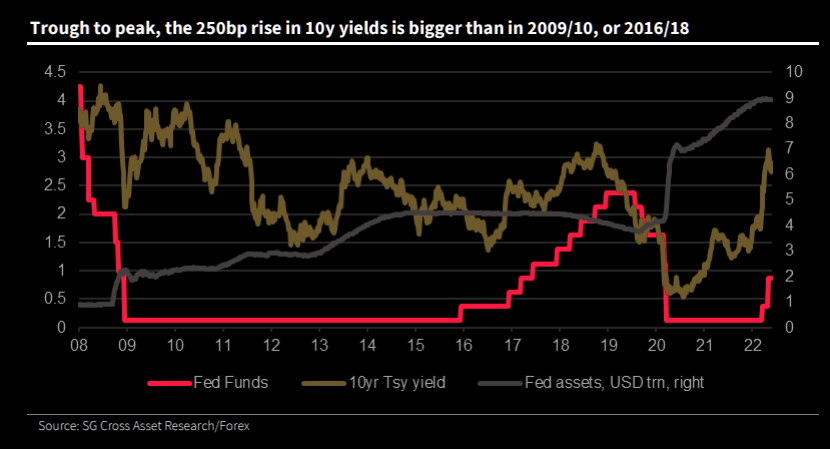
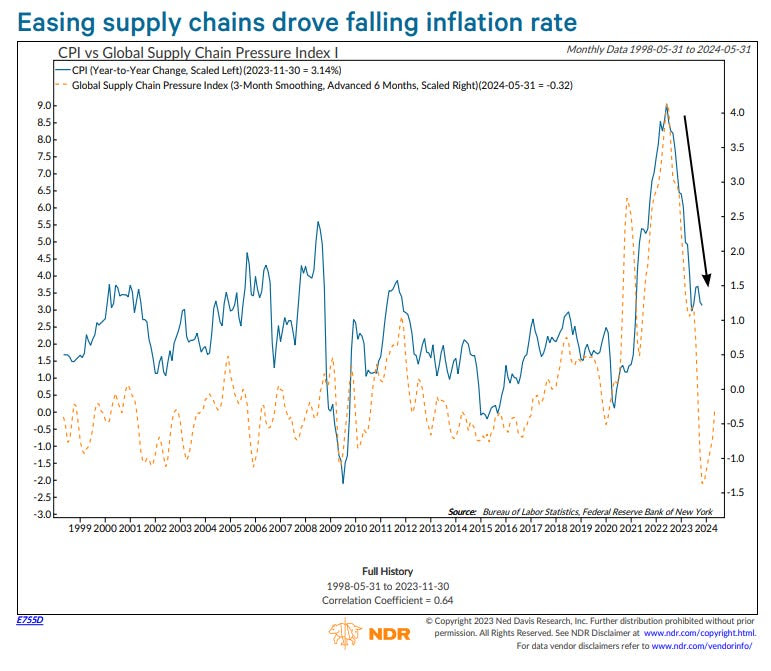
That’s a take hot enough to grab your attention, isn’t it? We digress. It’s been a couple of years since central banks began tightening. With it being this late in the economic cycle, the effects of contractionary monetary policy should be felt, right? Well, not as you imagined heading into last year. The economy is strong, and inflation was better managed than anticipated.
Is it that the economy is less sensitive to monetary policy? Citadel’s Kenneth Griffin states that monetary tightening struggles to offset fiscal stimulus. Jerome Powell, Chair of the Federal Reserve, has had his mission to engineer a soft landing complicated. “Whether it is the Inflation Reduction Act or other programs that have increased spending, we keep stimulating the economy out of DC.”
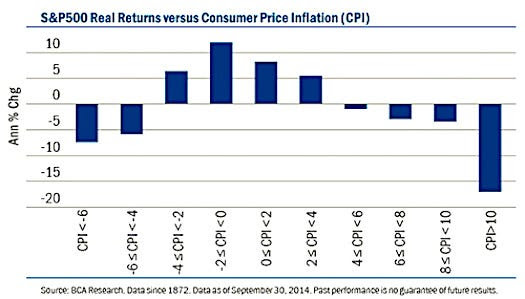
However, having such a resilient demand-driven economy does not guarantee any upward stock trends will be consistent. Instead, we may get fluctuations marked by abrupt declines, reminiscent of the seventies when markets, adjusted for inflation, experienced losses exceeding 50%.

That’s the outlook envisioned by some, including Cem Karsan of Kai Volatility. In his analysis, this policy divergence traces back to the era of easy money spanning decades—instances like the Federal Reserve buying long-term bonds, reducing their yields, and steering investors towards riskier assets. A “growth engine” resulted, as Karsan describes it, driving innovation and globalization, accompanied by low inflation and occasional deflation.
The bulk of the stimulus predominantly benefiting the top echelons—corporations focused on profit generation through cost-cutting and expanding market share—contributed to a widening gap between the privileged and the less privileged (i.e., the wealth effect and labor competing globally with other labor and technology). If the current emphasis is on populist fiscal measures (such as increasing the velocity of money by directly injecting funds into the hands of the public and, consequently, into the economy) to address inequality and enhance the average person’s spending capacity, this could be the catalyst for sparking inflation and the potential for elevated yields for years to come.

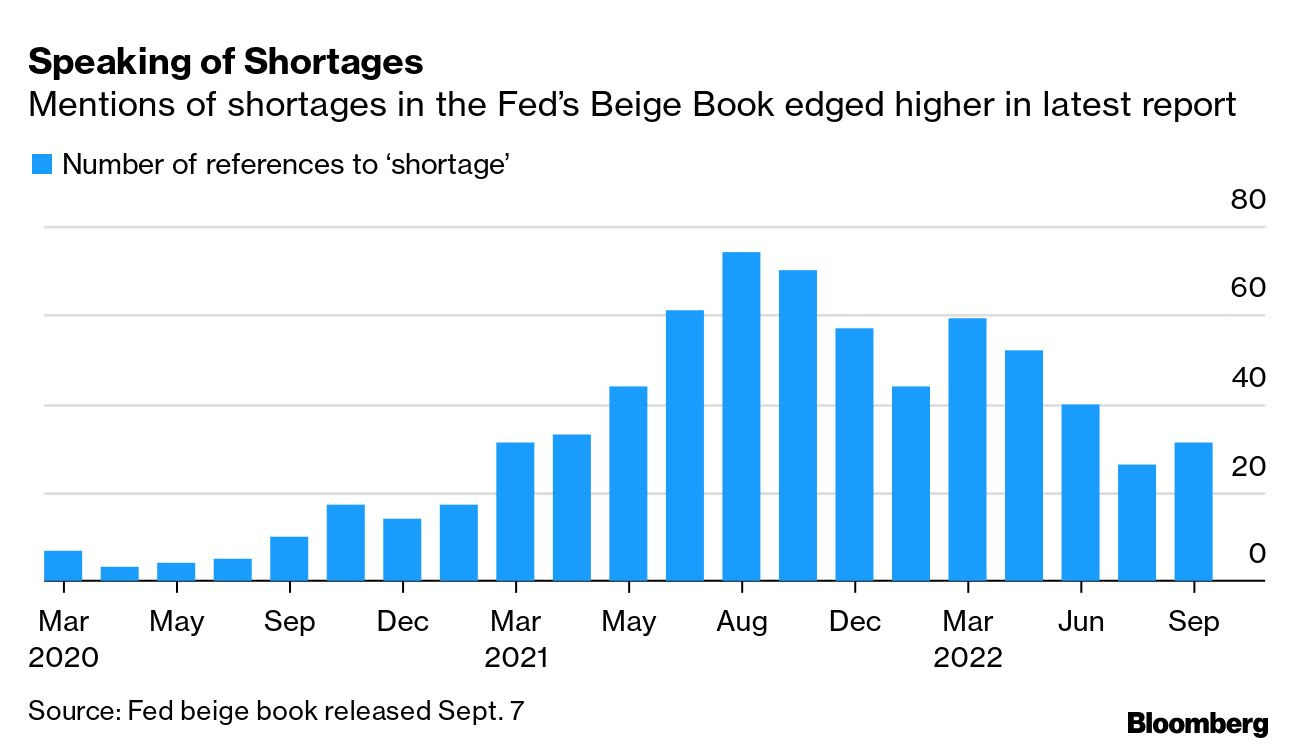
We’re attempting to combat a long-term trend with short-term tools, Karsan adds, indicating that inflation may persist for 10 to 15 years, bolstered by protectionism and conflicts, too, where those holding assets or commodities will have better control over wealth and inflation. The reduced fluidity in the movement of goods can lead to “localized price spikes,” upholds Hari Krishnan from SCT Capital Management.
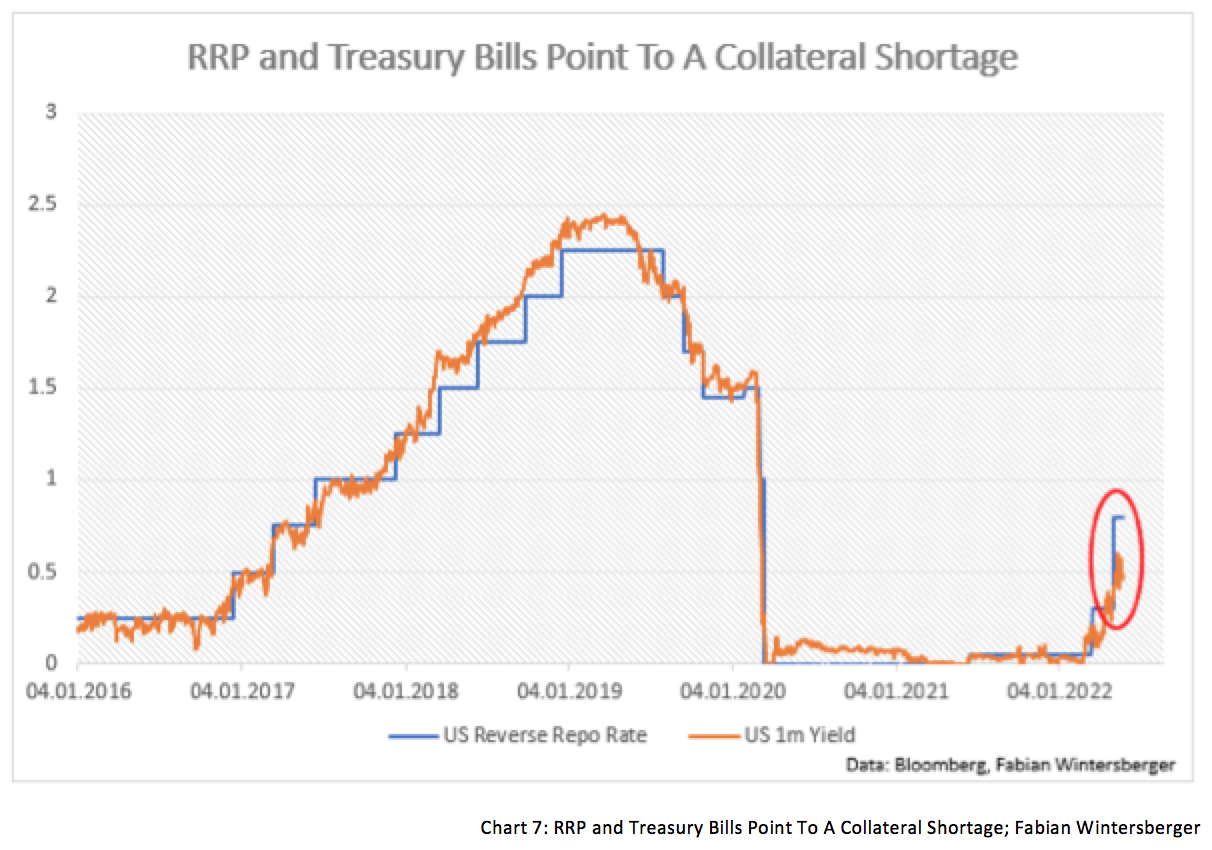
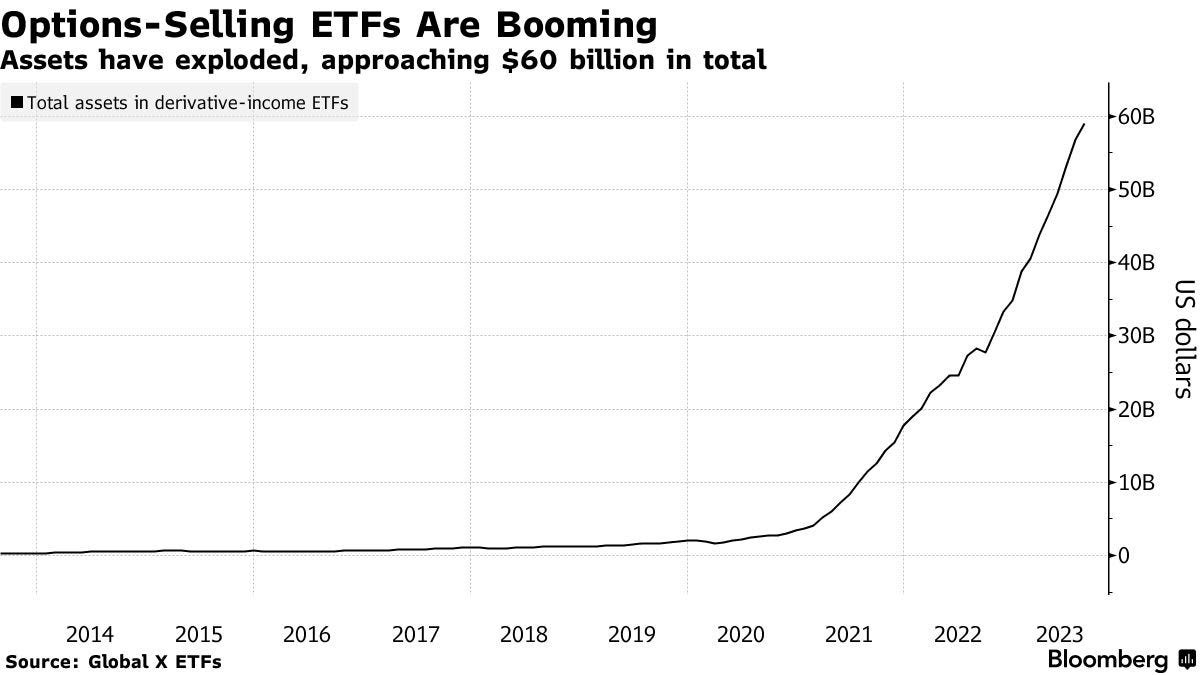
It’s a new era, and as Karsan points out, the tail is getting thicker, indicating a shift towards one-sided and risky positioning. Why is that so? Individuals are hedging the above realities, turning to Treasuries (used as collateral) and short equity options or volatility (the all-encompassing term) to enhance returns.
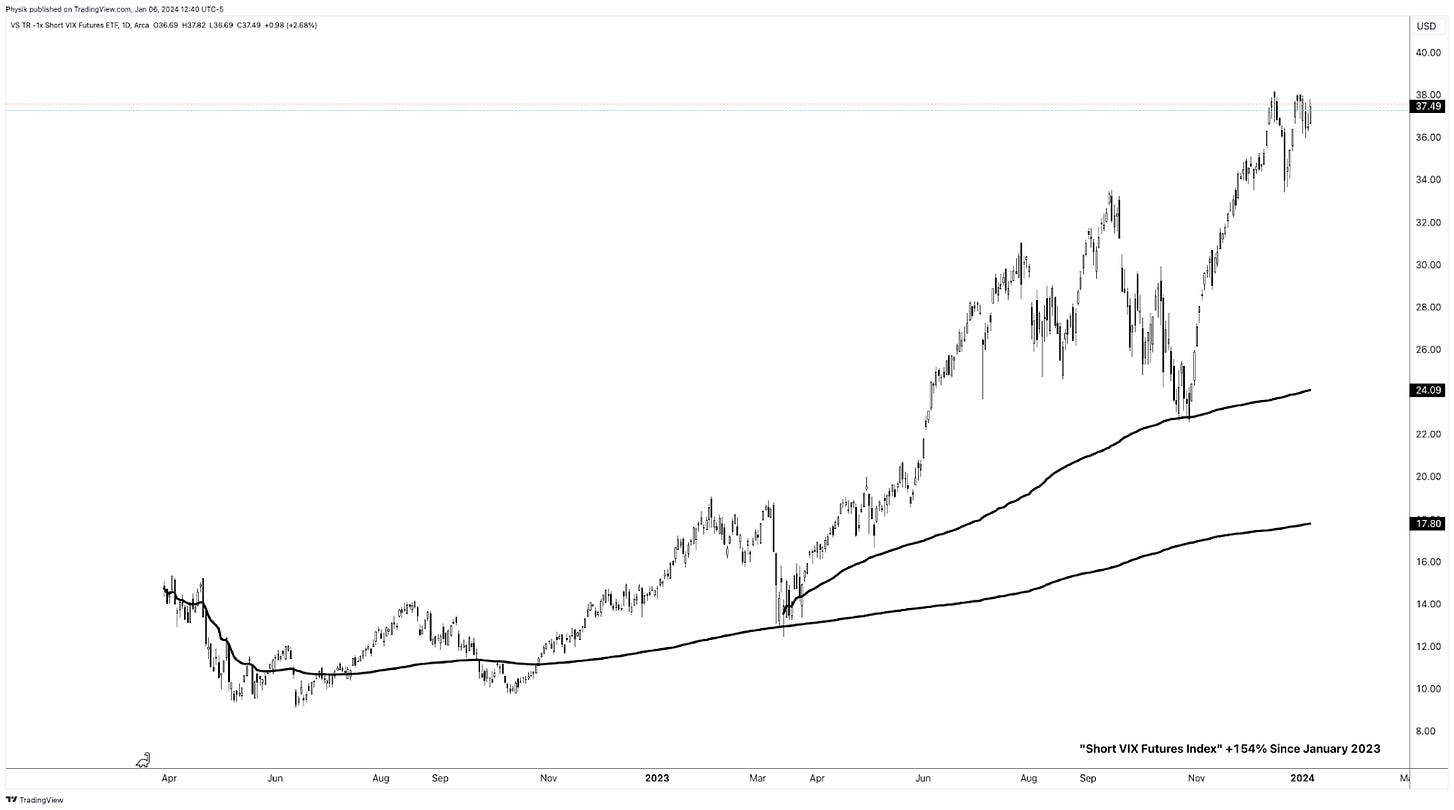
The rise of these structured products has led to an “over-positioning into short volatility. While stabilizing within a specific range, this situation creates conditions for potential instability and abrupt movements.
“If you remember 2017, right before we got into Volmageddon in February 2018, the volatility environment smelled similar to right now,” Amy Wu Silverman, head of derivatives strategy at RBC Capital Markets, shared with Bloomberg. “It works until it doesn’t.”
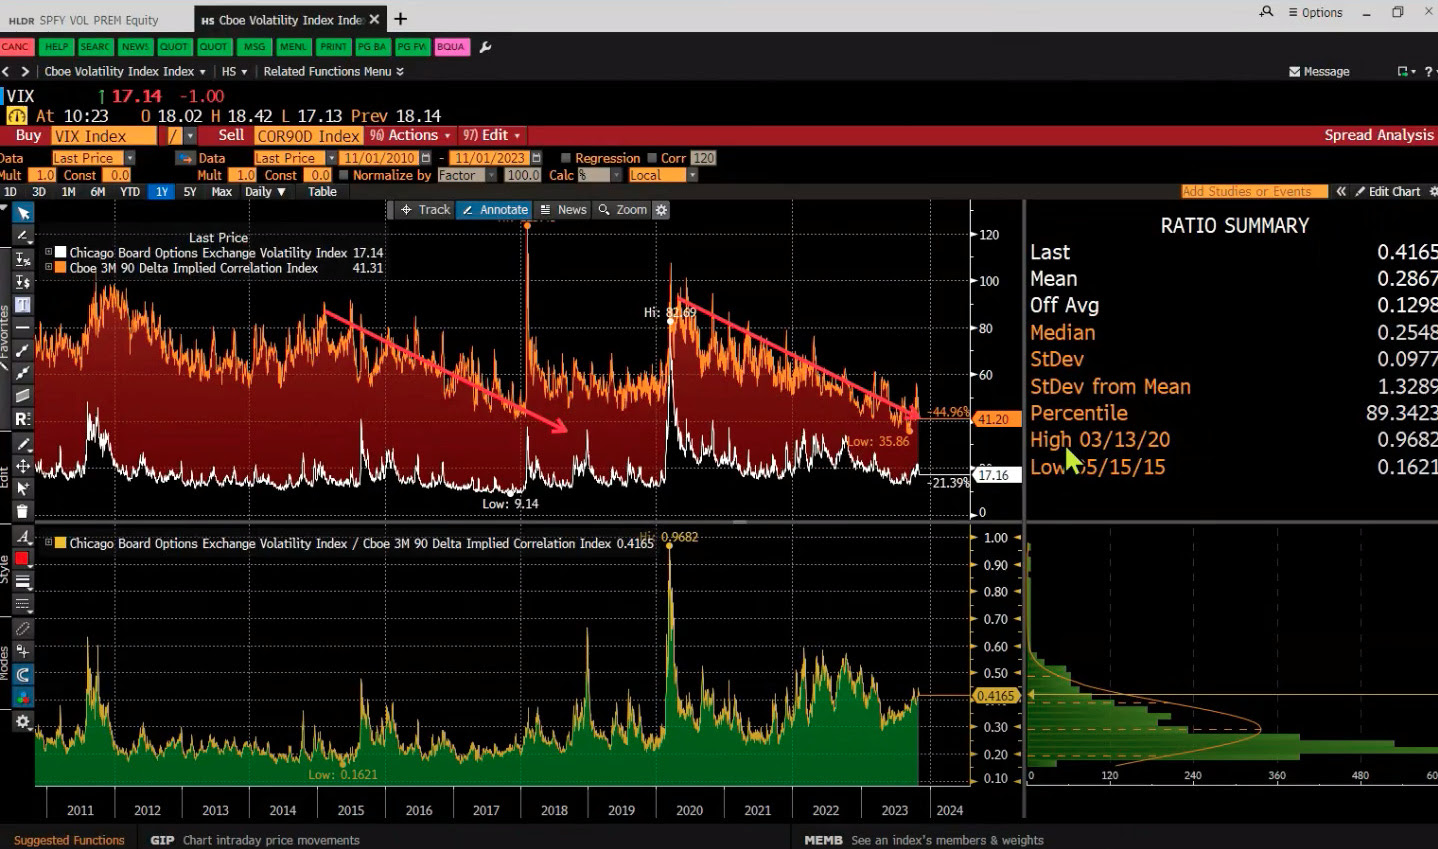
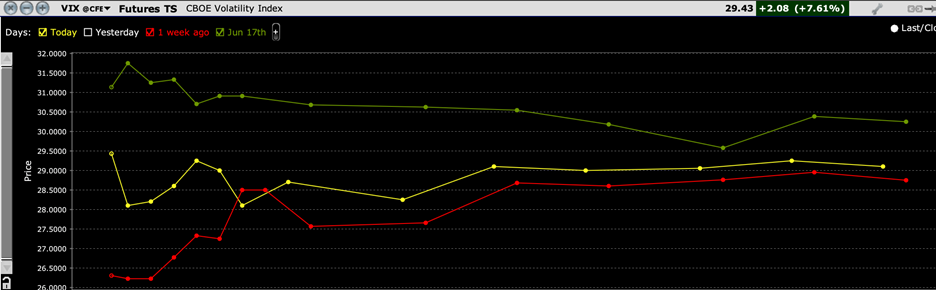
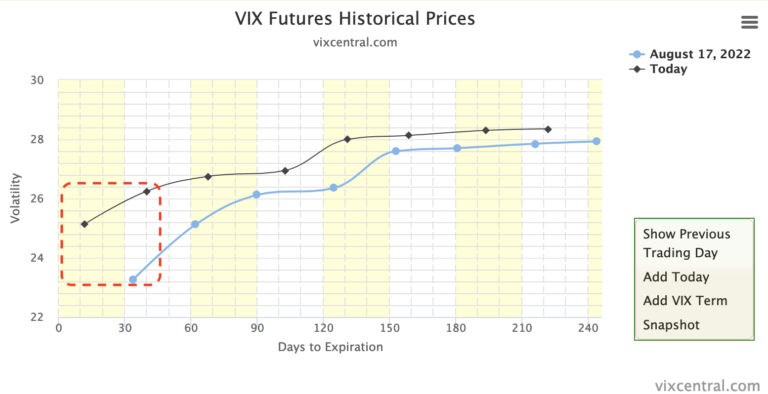
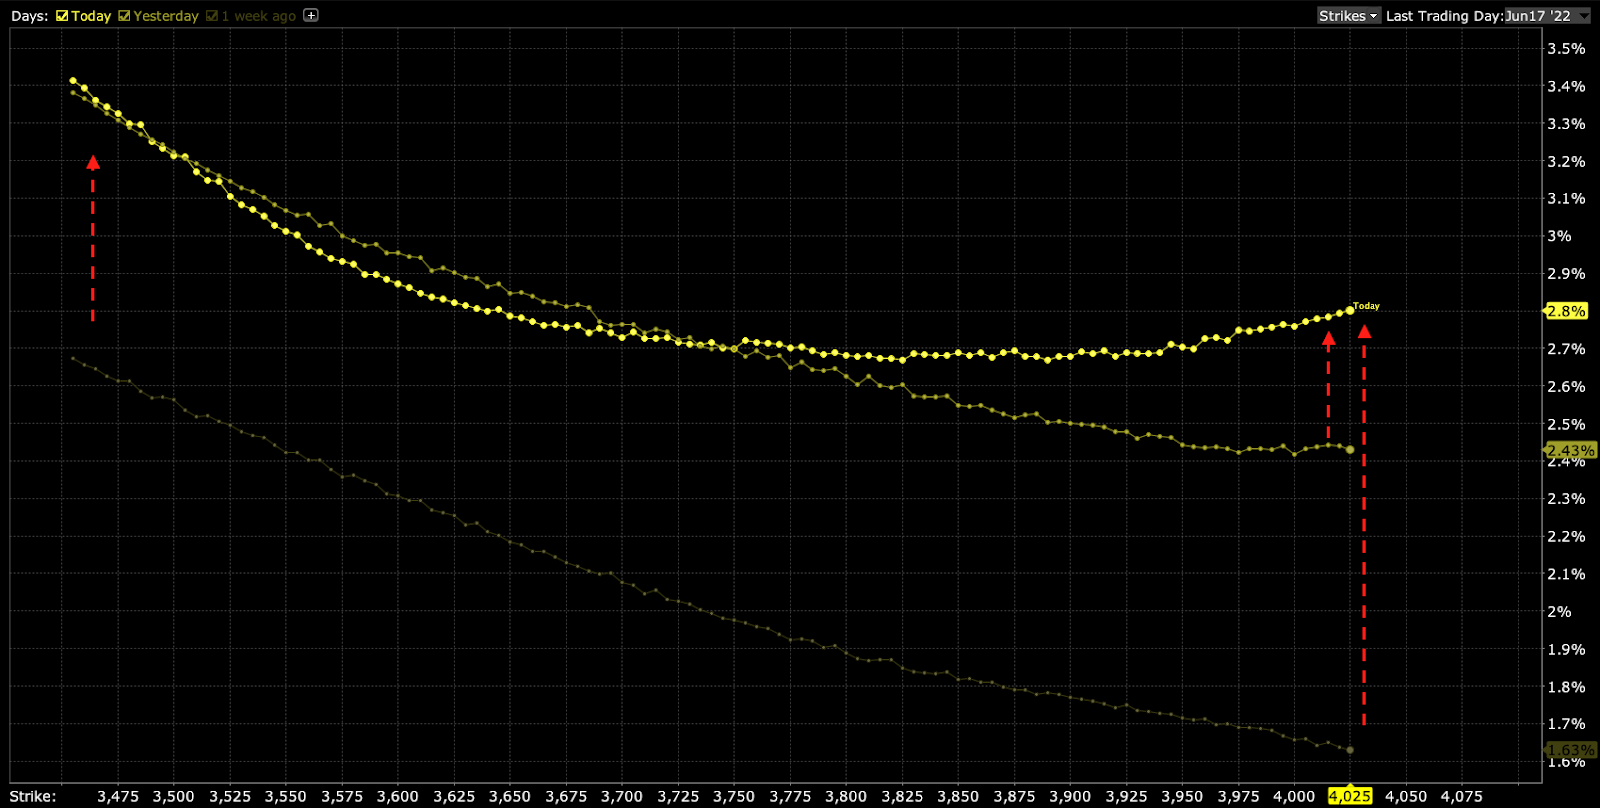
Kris Sidial from The Ambrus Group explains highly responsive spot-vol beta results. For example, we see quick fluctuations in volatility measures like the Cboe’s Volatility Index or VIX. He adds it’s a crowding of the dispersion trade, where participants shift from underperforming longer-dated options to shorter-dated ones for purposes like hedging, directional trading, and yield enhancement. This activity supports and stabilizes the indexes while the individual components underneath occasionally fluctuate pretty drastically. The only way to reconcile these fluctuations is through a decrease in correlation.

This environment is reminiscent of the 1999 to 2000 period, mentioned by Michael Green from Simplify Asset Management during a pre-event call for a Benzinga appearance. Despite the costliness of growth stocks in the late nineties, they still managed to double and triple.
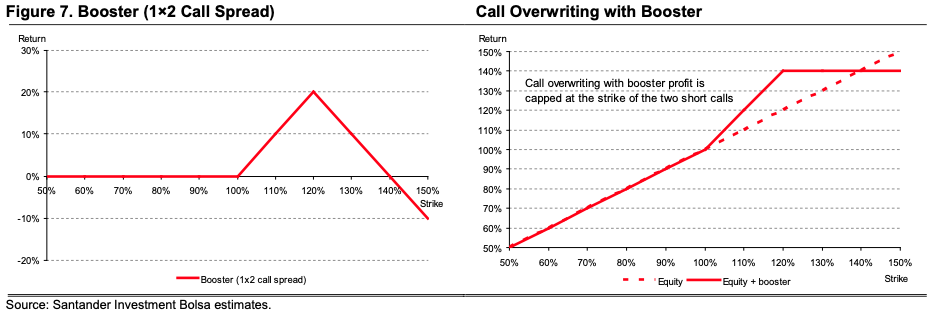
In this scenario, the go-to trade of stocks and bonds (e.g., 60/40) may be less effective. Instead, at least over the short term, one could own long-term call options while selling stocks. Why? Karsan says that volatility “pinning leads to a momentum factor” that sustains itself. As yields rise, more liquidity flows into alternatives like structured products. With index volatility subdued and at a lower limit, positive flows persist until more significant market trends take over.
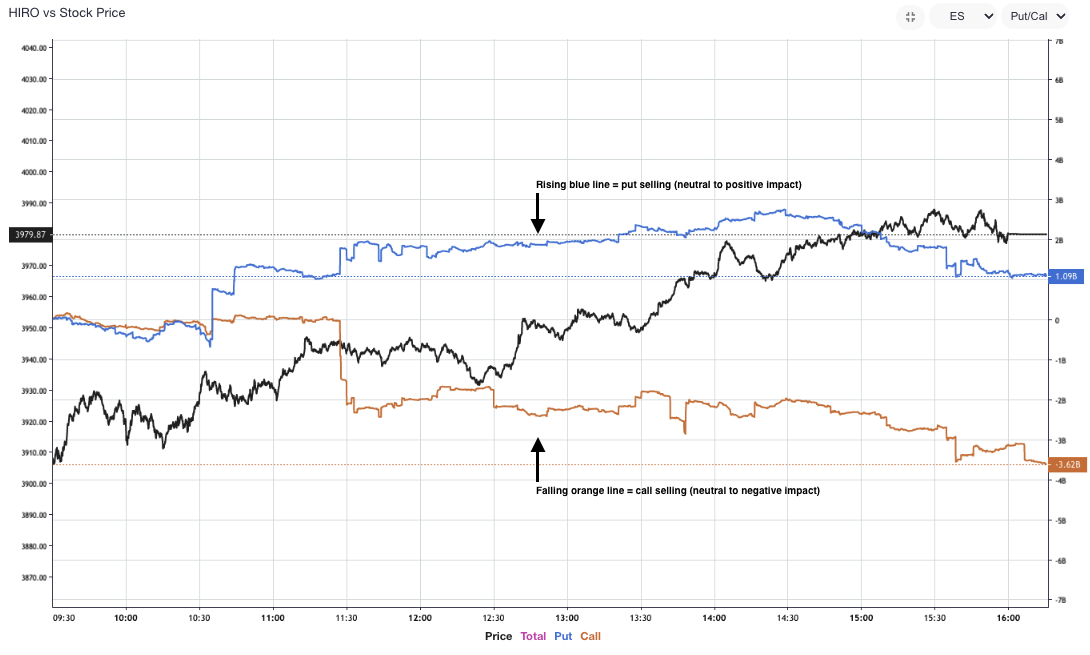
“By expressing to the market that you don’t think the price will go up more, and might even go down a bit—you actually *cause* the market to go up, and to get bid when it goes down,” says SqueezeMetrics. “Irony is the market’s love language.”

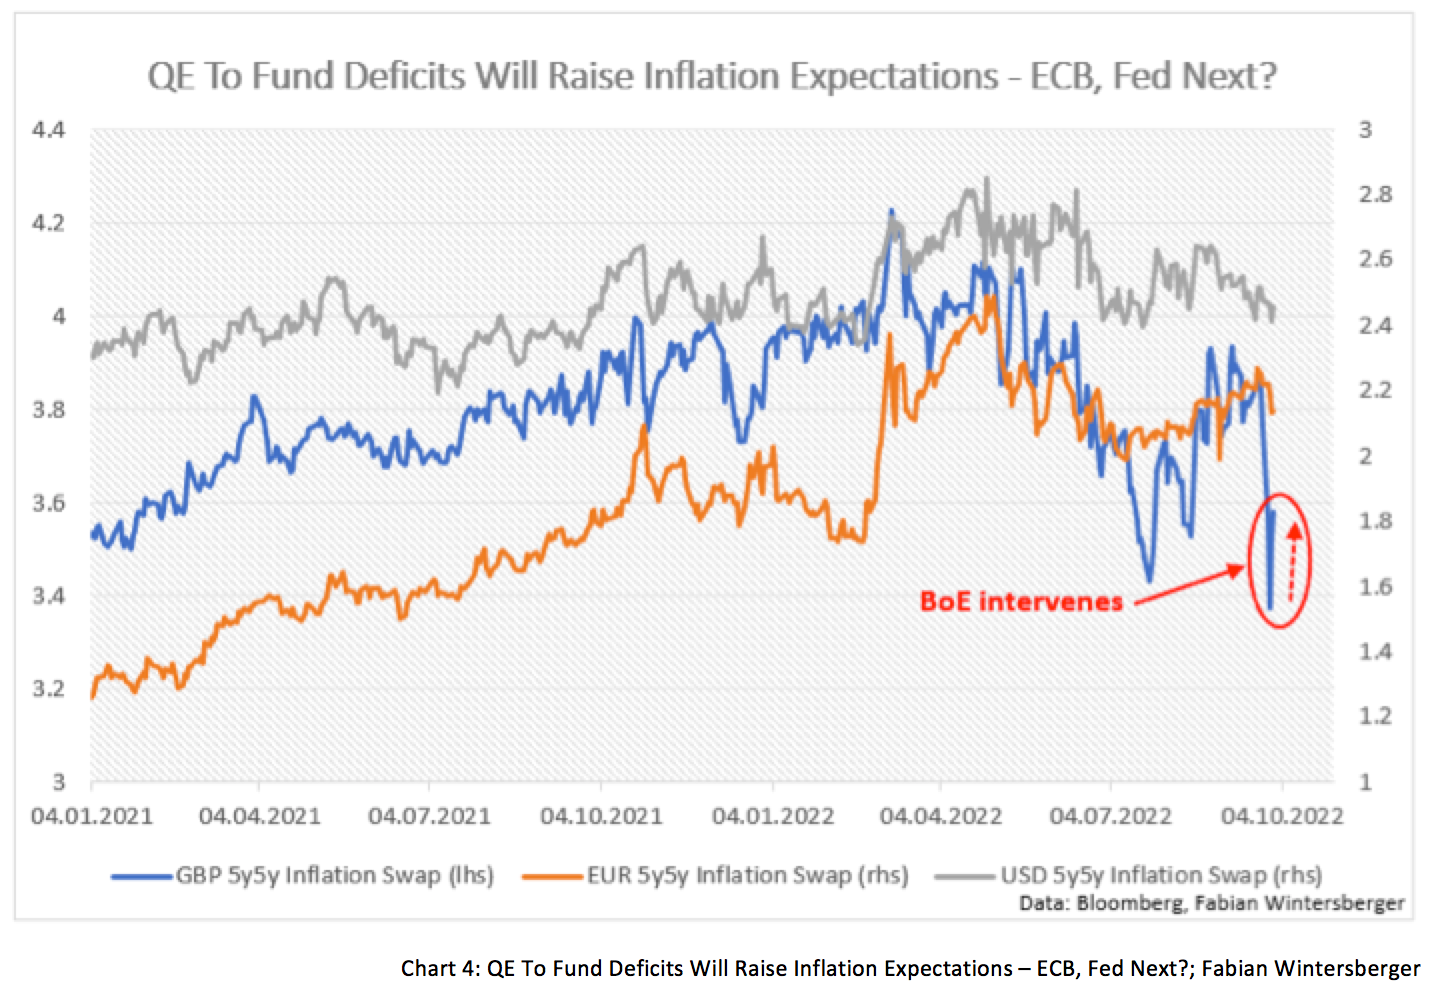
Looking ahead to 2024, Fabian Wintersberger predicts a higher stock market, dismissing concerns of a second wave of inflation in 2024. The changes in the money supply typically impact the broader economy with an 18-month lag, implying projected rate cuts in 2024 may not affect inflation until 2025 or 2026.
“It seems that the Fed’s and the ECB’s projections are too high, and inflation might turn into deflation in the second half of 2024.” Otherwise, we’re likely in the seventh or eighth inning because higher real yields are starting to come through the economy, Griffin states, noting the Federal Reserve will likely make it clear they will get near a 2% rate in time, stabilizing as best they can employment and prices.

“[Jerome Powell] had a horrible hand to play. We’ve had the pandemic supply chain shocks and massive fiscal stimulus. And he’s supposed to try to achieve price stability. That’s a no-win scenario.”
As interest rates decline, the discussed structured product trades and dispersion flows might slow or reverse. The question arises: will the diminishing volatility supply compound challenges arising from weakened macro liquidity, potentially outweighing the anticipated benefits of interest rate cuts and stimulative fiscal measures? We’re working on unraveling this.
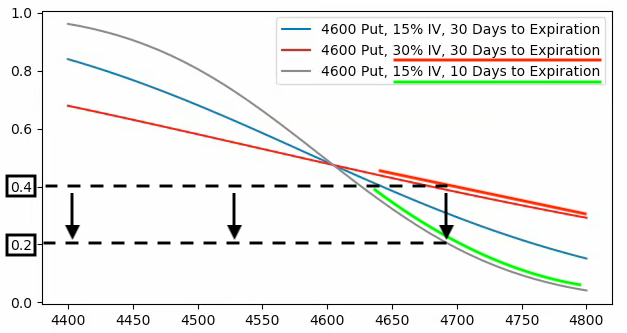
While euphoria seems scarce and fragility is not prominently signaled, as Sidial points out, the telltale signs will come as an “explosion” of convexity in the 3-, 5-, and 7-day terms of the volatility structure, as noted by Karsan. Until these signs emerge, former open markets desk trader Joseph Wang suggests cautious optimism, advocating for bullishness amid digestion in terms of time or price.