
The daily brief is a free glimpse into the prevailing fundamental and technical drivers of U.S. equity market products. Join the 300+ that read this report daily, below!
What Happened
Overnight, equity index futures auctioned lower, mostly, alongside most commodities and crypto.
Notable is how orderly the selling has been, particularly in the equity space. That’s due in part to suppressive volatility selling, as well as passive flows supporting the largest index constituents.
The fundamental narrative has changed little. Chief among participants’ worries are growth and inflation, the monetary response to the two, as well as chokepoints not limited to supply chains.
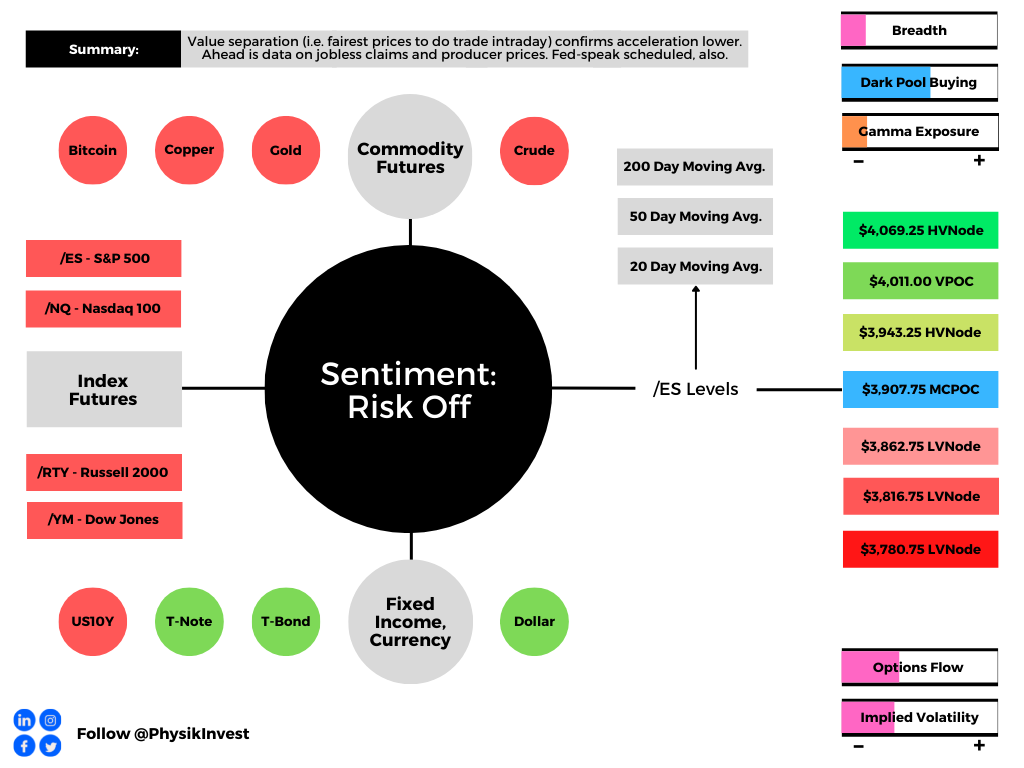
Ahead is data on jobless claims and the producer price index (8:30 AM ET), as well as Fed-speak by Mary Daly (4:00 PM ET).
What To Expect
Fundamental: In Wednesday’s morning letter, we talked about the expectations for annual inflation to have peaked and month-on-month inflation to have risen a small amount.
Per Bloomberg, “the broader CPI rose 0.3% from the prior month and 8.3% on an annual basis, a slight cooling but still among the highest readings in decades.”
Stocks were sold, after, on the limited change to the broader fundamental outlook. The hardest hit was growth and technology, including cryptocurrency.
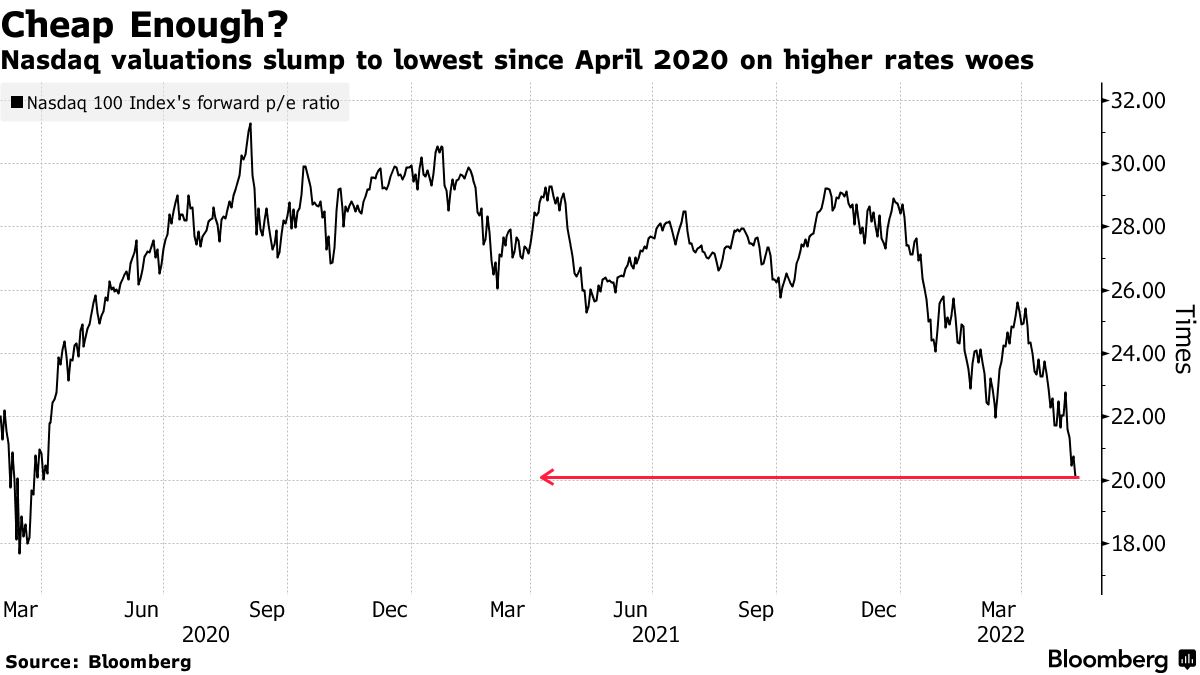
“Now that central banks are unwinding monetary support, growth stocks’ valuations have further to fall,” Citigroup Inc (NYSE: C) strategists including Robert Buckland said.
Notwithstanding, “any stabilization in nominal yields should eventually help to stabilize real yields and hence equity valuations.”
This is because higher rates play into bigger discounts on future profit.
Positioning: Orderly selling continues.
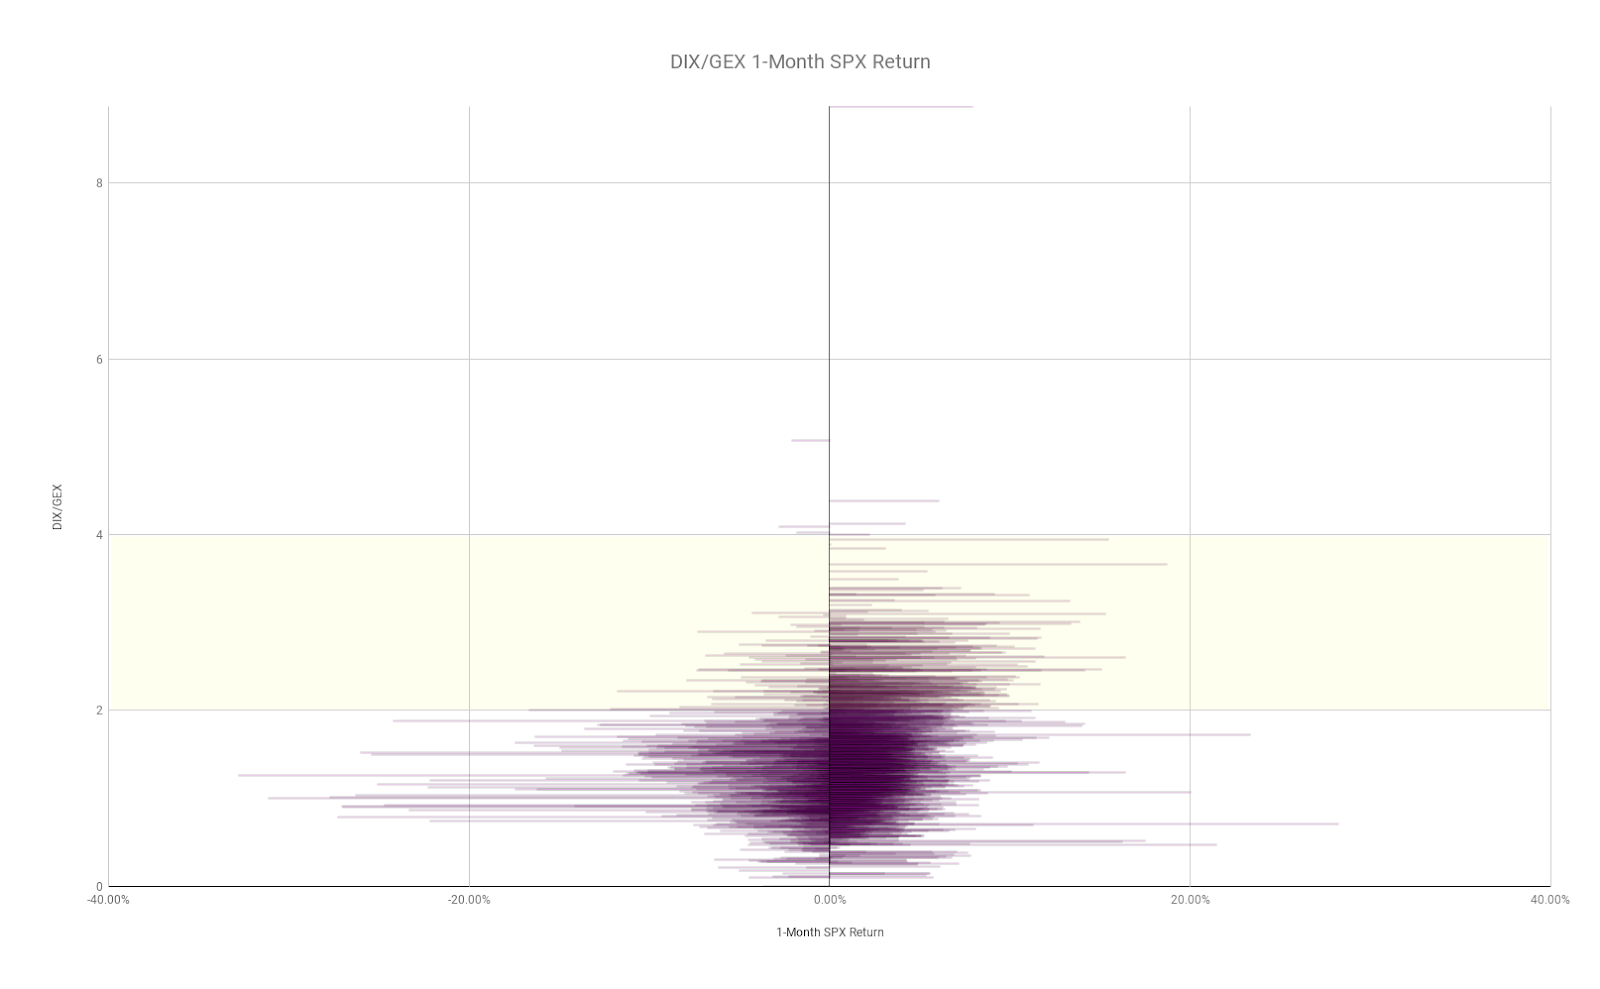
Despite falling about the same distance (peak to present low) during the equity market rout of 2020, selling, this time around is steady and there is no panic, and that’s partly the result of there being “plenty of put-buyers, but nearly as many sellers,” according to SqueezeMetrics.
Accordingly, using off-exchange short sales as a proxy for buying activity, we see implicit buying support, and that’s due in part to “passive flows” which ultimately end up “supporting the largest stocks,” hence the index’s strength versus smaller (and much weaker) constituents.
Taken together, some metrics this letter often looks to for insight into the potential distribution of future returns, carry less weight; it’s odds and when the largest stocks succumb to fundamental weaknesses, for lack of a better way of expressing it, that likely takes the indexes with it.
Moreover, with the S&P 500’s break of $4,000.00, an area around which there is a lot of open interest, particularly on the put side, “increases capitulation risk” in the case participants start reaching for protection and indirectly taking from market liquidity as liquidity providers sell into weakness to hedge.
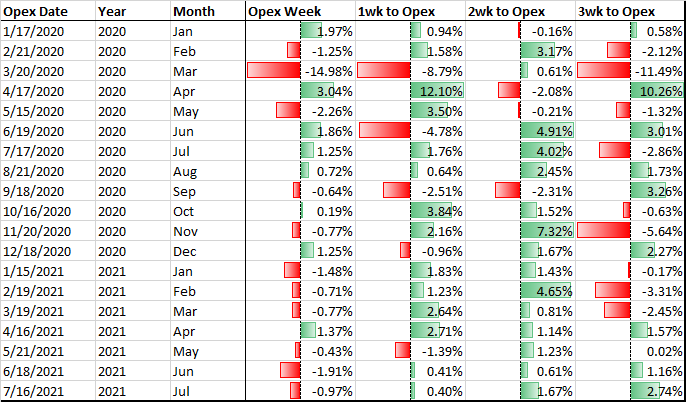
Notwithstanding, later this month is a large options expiration (OPEX), and expected is the roll-off of a large amount of put-heavy negative gamma. Per Pat Hennessy of IPS Strategic Capital, returns one to two weeks prior are skewed bullish.
Ways to participate in upside, while limiting downside, markedly, were discussed on May 10. Making money is one thing. Not losing money is another.

Lose less when wrong. Make more when right.
Technical: As of 6:45 AM ET, Thursday’s regular session (9:30 AM – 4:00 PM ET), in the S&P 500, will likely open in the lower part of a negatively skewed overnight inventory, outside of prior-range and -value, suggesting a potential for immediate directional opportunity.
In the best case, the S&P 500 trades higher; activity above the $3,907.75 micro composite point of control (MCPOC) puts in play the $3,943.25 high volume area (HVNode). Initiative trade beyond the $3,943.25 HVNode could reach as high as the $4,011.00 untested point of control (VPOC) and $4,069.25 HVNode, or higher.
In the worst case, the S&P 500 trades lower; activity below the $3,907.75 MCPOC puts in play the $3,862.75 LVNode. Initiative trade beyond the $3,862.75 LVNode could reach as low as the $3,816.75 and $3,780.75 LVNodes, or lower.
Click here to load today’s key levels into the web-based TradingView charting platform. Note that all levels are derived using the 65-minute timeframe. New links are produced, daily.

What People Are Saying
Definitions
Volume Areas: A structurally sound market will build on areas of high volume (HVNodes). Should the market trend for long periods of time, it will lack sound structure, identified as low volume areas (LVNodes). LVNodes denote directional conviction and ought to offer support on any test.
If participants were to auction and find acceptance into areas of prior low volume (LVNodes), then future discovery ought to be volatile and quick as participants look to HVNodes for favorable entry or exit.
POCs: POCs are valuable as they denote areas where two-sided trade was most prevalent in a prior day session. Participants will respond to future tests of value as they offer favorable entry and exit.
MCPOCs: POCs are valuable as they denote areas where two-sided trade was most prevalent over numerous day sessions. Participants will respond to future tests of value as they offer favorable entry and exit.
About
After years of self-education, strategy development, mentorship, and trial-and-error, Renato Leonard Capelj began trading full-time and founded Physik Invest to detail his methods, research, and performance in the markets.
Capelj also develops insights around impactful options market dynamics at SpotGamma and is a Benzinga reporter.
Some of his works include conversations with ARK Invest’s Catherine Wood, investors Kevin O’Leary and John Chambers, FTX’s Sam Bankman-Fried, Kai Volatility’s Cem Karsan, The Ambrus Group’s Kris Sidial, among many others.
Disclaimer
In no way should the materials herein be construed as advice. Derivatives carry a substantial risk of loss. All content is for informational purposes only.


