Categories
Commentary

Daily Brief For June 30, 2022

The daily brief is a free glimpse into the prevailing fundamental and technical drivers of U.S. equity market products. Join the 300+ that read this report daily, below!

What Happened

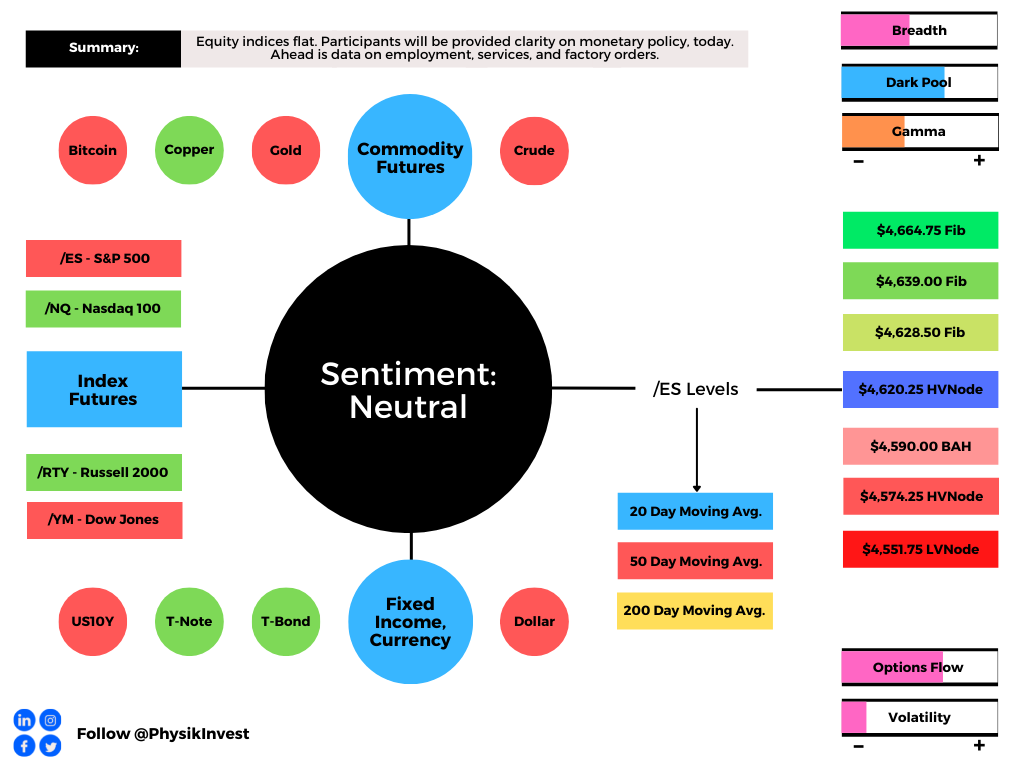
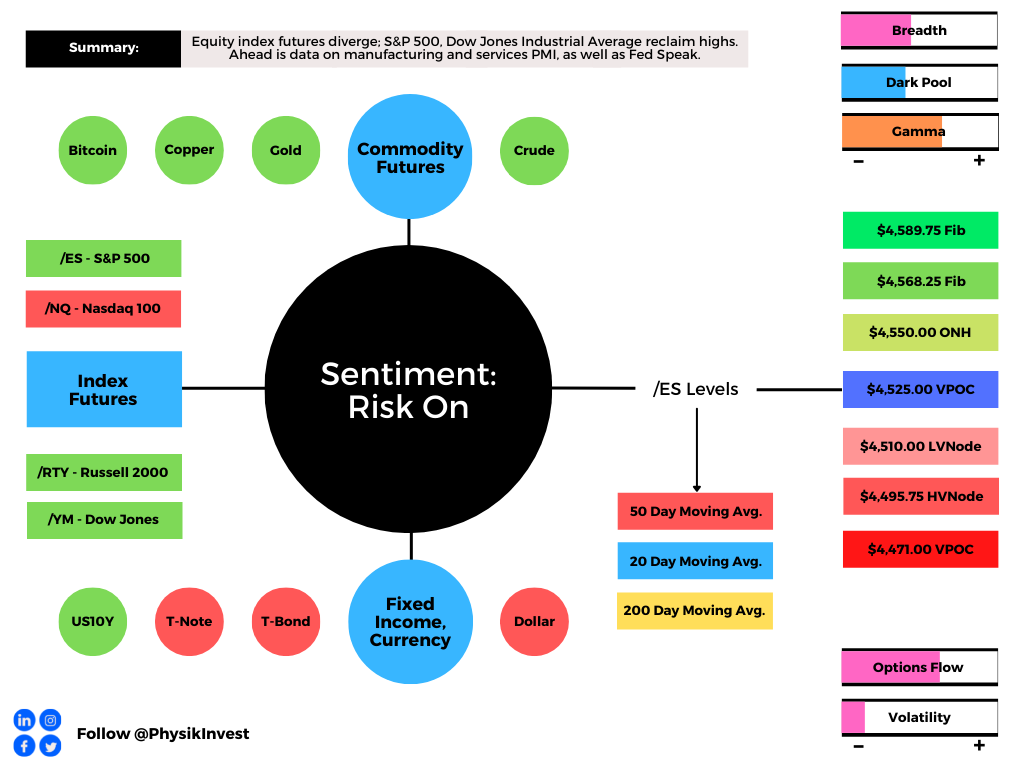
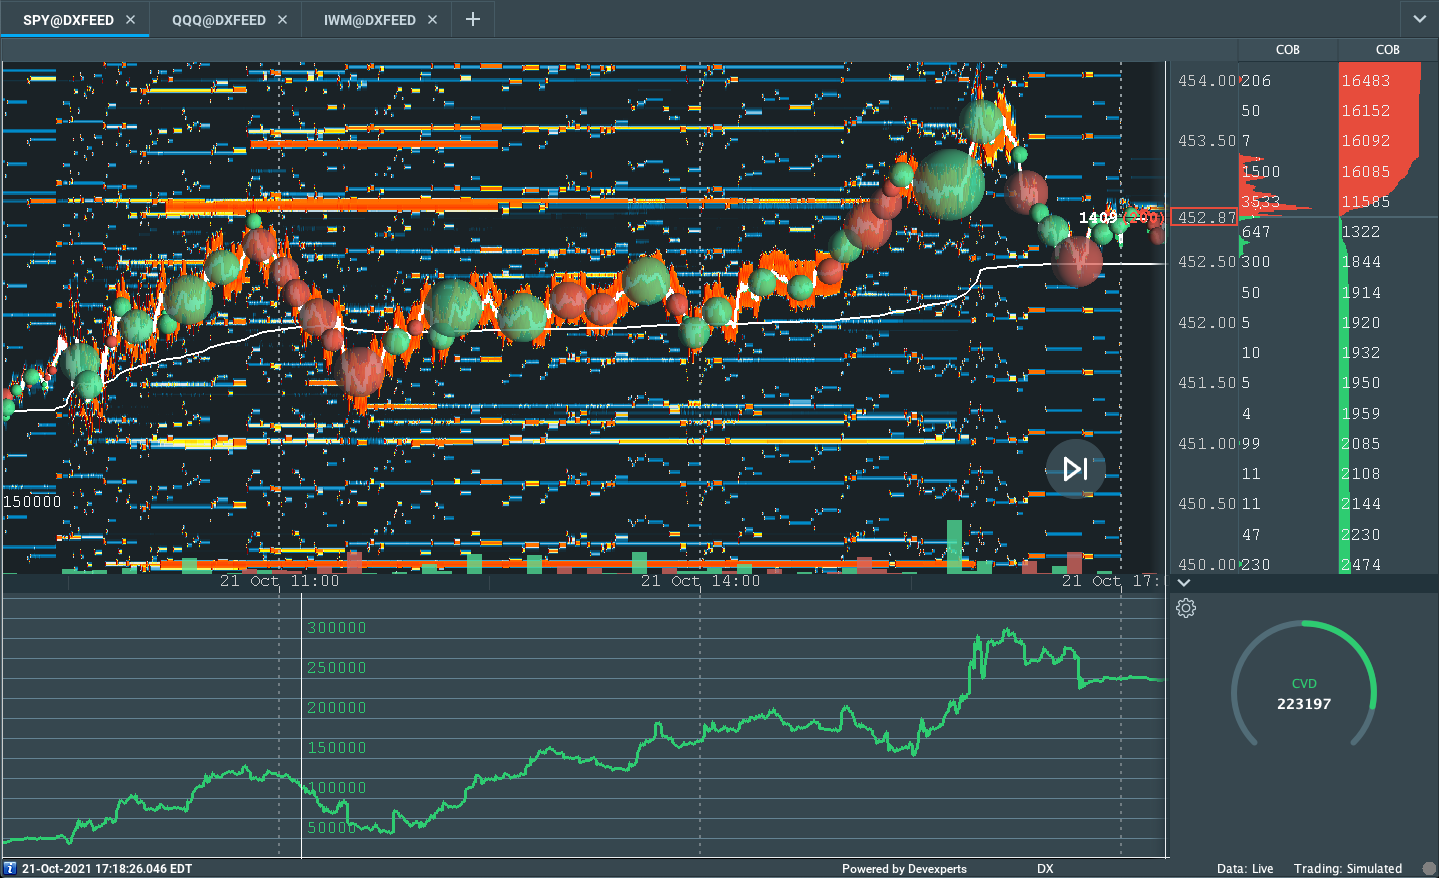
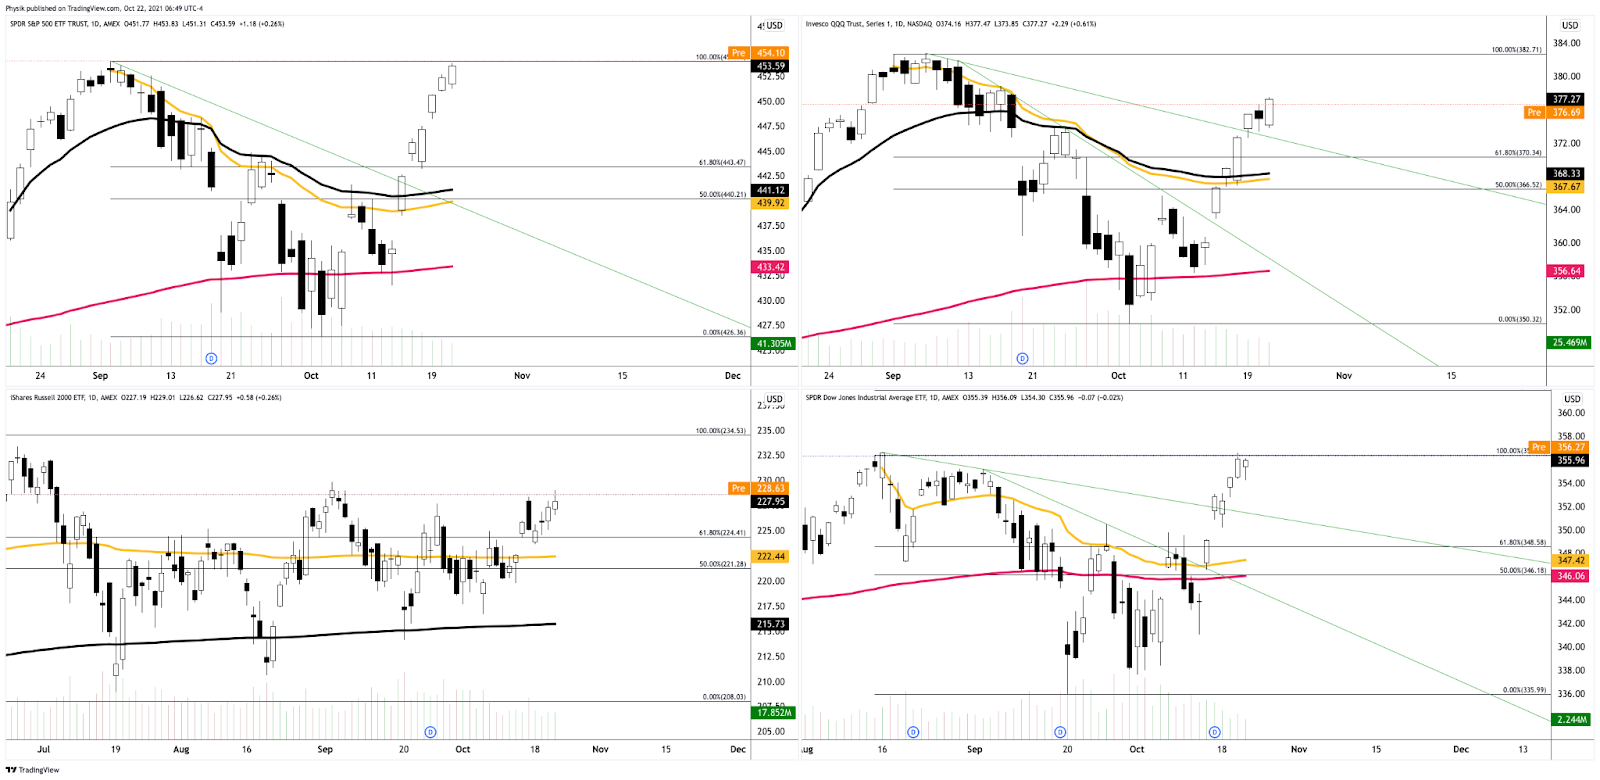
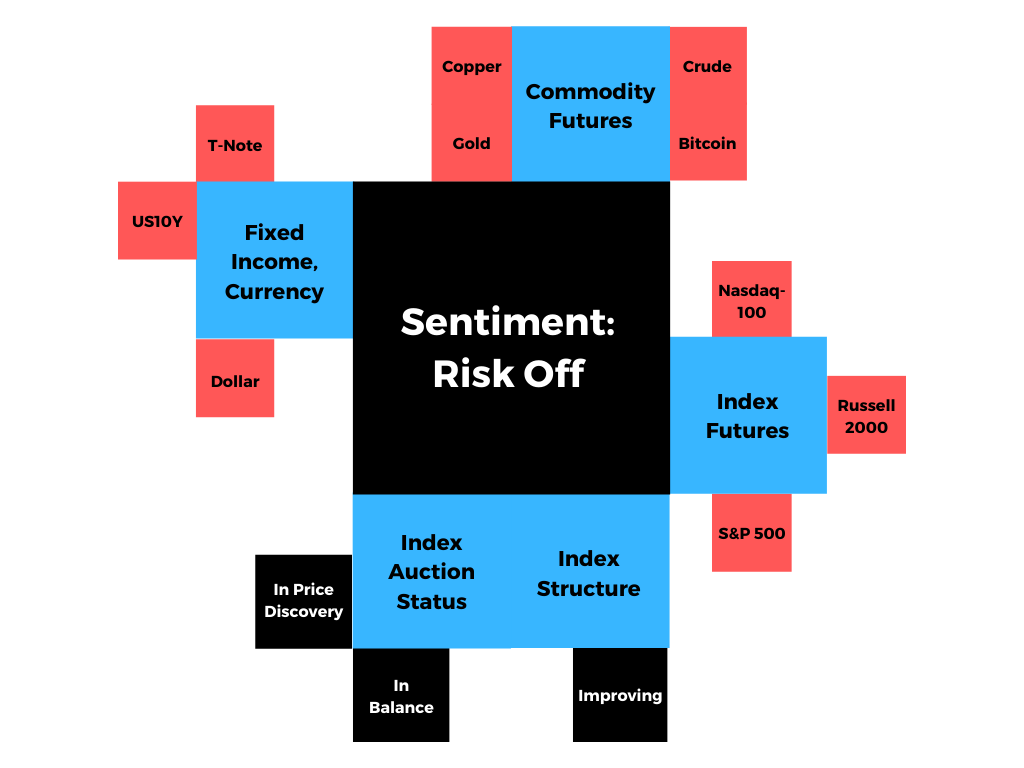
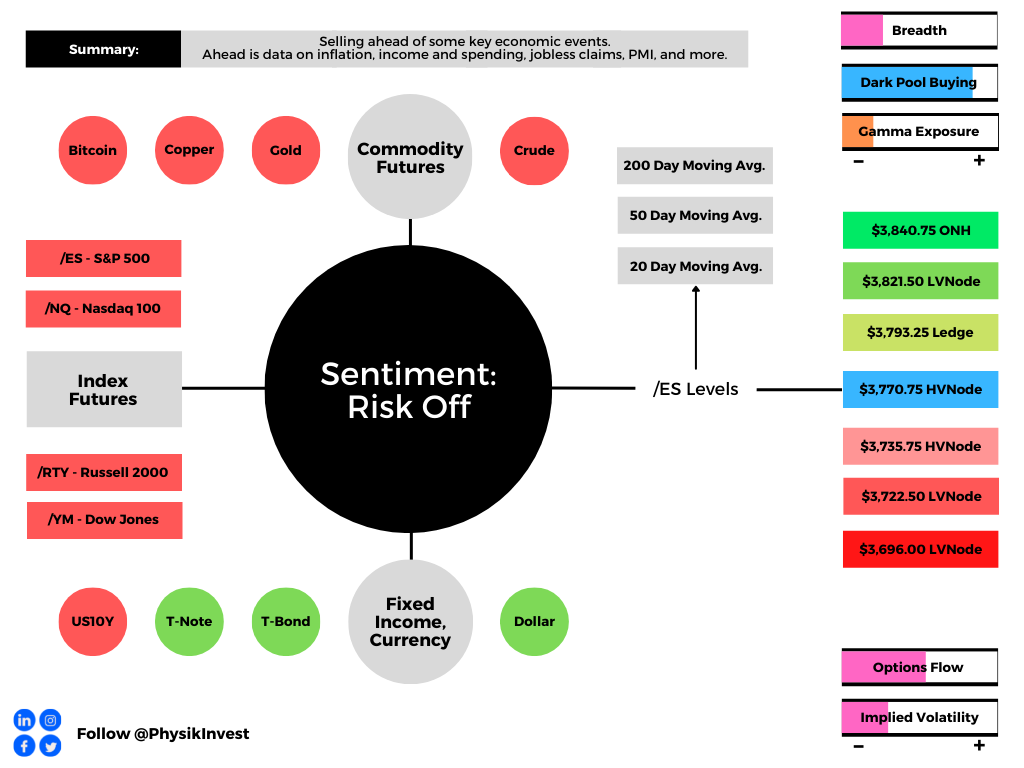
Overnight, equity index and commodity futures auctioned lower while bonds, the dollar, and implied volatility metrics were bid at the tail-end of the quarterly rebalancing period.

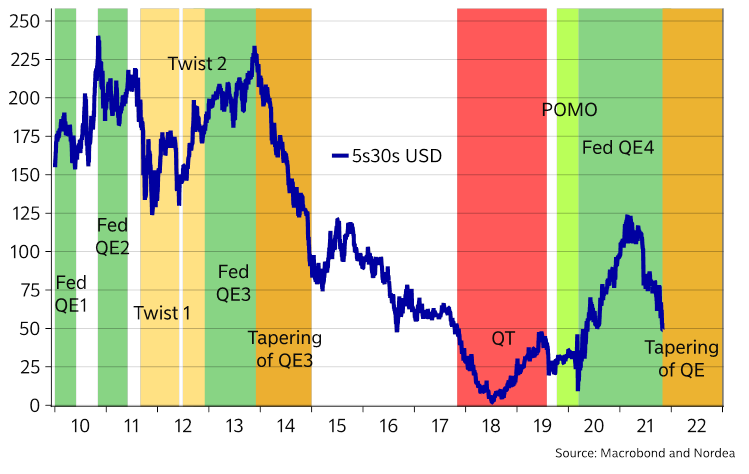
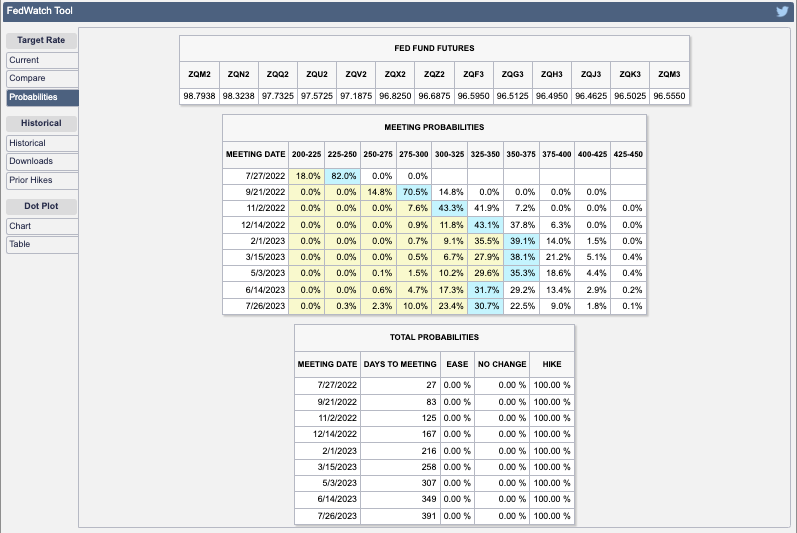
Participants have bet on a half-point rate cut in 2023 amid heightened recession odds, all the while the projected target rate sits in the range of 2.25-2.50% for the July 27, 2022 meeting.

Pursuant to this letter’s remarks in the days prior, trades biased long volatility are performing well, particularly those structured a standard deviation and beyond prior prices. We’ll unpack why that is, today.

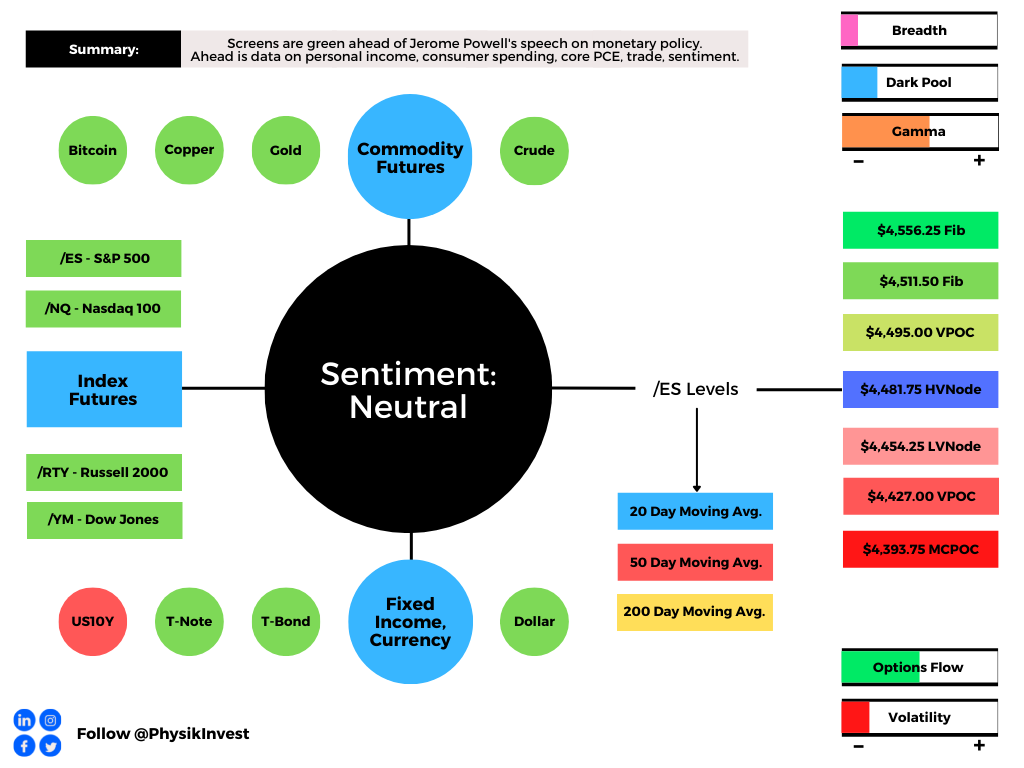
Ahead is data on PCE inflation, disposable income, and consumer spending, as well as jobless claims (8:30 AM ET) and Chicago PMI (9:45 AM ET).

Graphic updated 6:30 AM ET. Sentiment Risk-Off if expected /ES open is below the prior day’s range. /ES levels are derived from the profile graphic at the bottom of the following section. Levels may have changed since initially quoted; click here for the latest levels. SqueezeMetrics Dark Pool Index (DIX) and Gamma (GEX) calculations are based on where the prior day’s reading falls with respect to the MAX and MIN of all occurrences available. A higher DIX is bullish. At the same time, the lower the GEX, the more (expected) volatility. Learn the implications of volatility, direction, and moneyness. SHIFT data used for S&P 500 (INDEX: SPX) options activity. Note that options flow is sorted by the call premium spent; if more positive, then more was spent on call options. Breadth reflects a reading of the prior day’s NYSE Advance/Decline indicator. VIX reflects a current reading of the CBOE Volatility Index (INDEX: VIX) from 0-100.

What To Expect

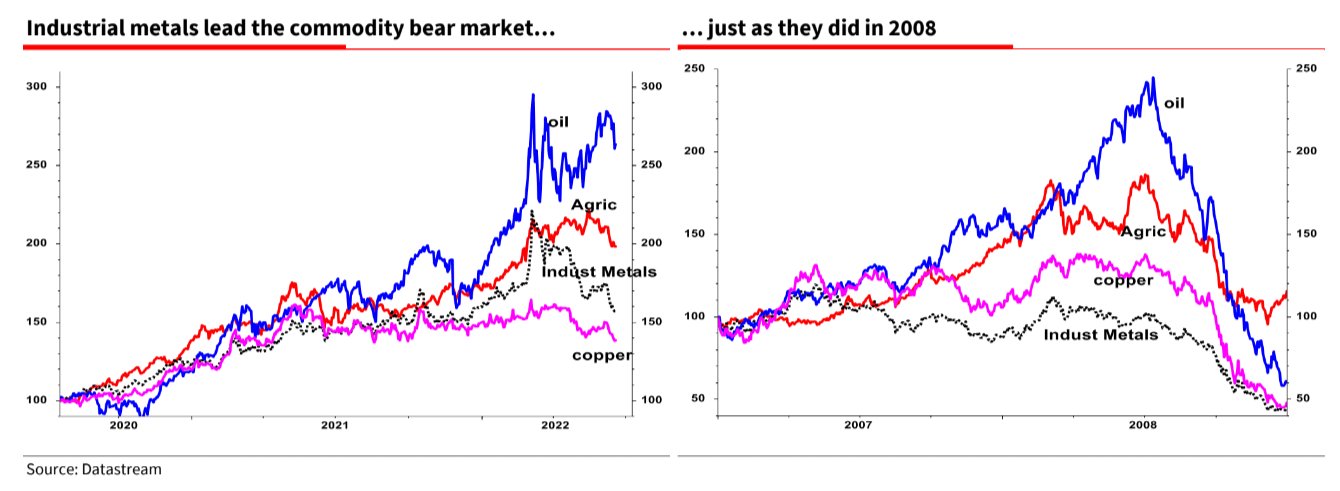
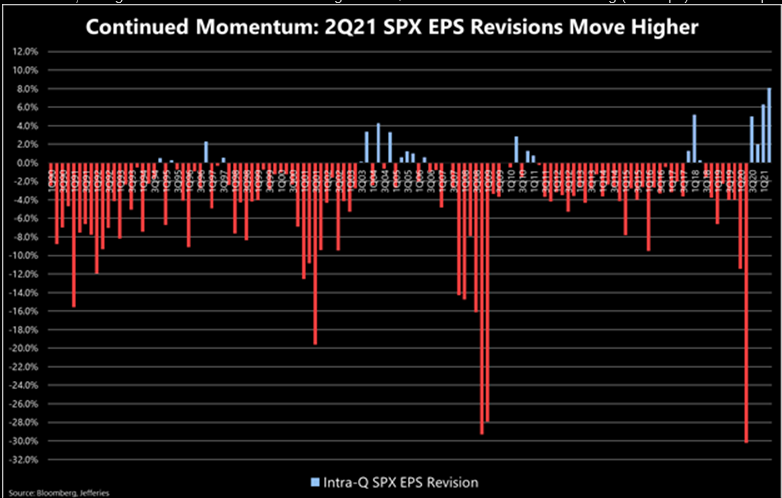
Fundamental: Discussed in recent letters were the prospects of whether a recession would be necessary for stemming inflation.

Read: The Fed needs to remove the heat from the demand without prompting an accident among mortgage financiers.

Graphic: Via Bloomberg. “[W]hat’s happened to mortgage-backed bonds this year is a radical departure. Bloomberg’s index dates back to 1988 when the asset class was still in its infancy. This is the first time it has ever withstood a decline that stretches into double figures.”

“That’s the message the market took,” Bloomberg’s John Authers explained. “[T]he most painful surprise over the second half of this year would be for inflation to stay sticky.”

“That would quash the belief in a swift easing campaign in 2023.”

Graphic: CME Group Inc’s (NASDAQ: CME) FedWatch Tool.

Some, like the Federal Reserve’s (Fed) Loretta Mester, suggest that gone are the days to err on the side of being too accommodative.

“It also calls into question the conventional view that monetary policy should always look through supply shocks,” Mester said. “In some circumstances, such shocks could threaten the stability of inflation expectations and would require policy action.”

Graphic: Via Bloomberg. “The Richmond Fed’s survey of manufacturing isn’t generally one of the most closely monitored releases, but as this one was the worst since the Great Recession (barring only one month during the Covid shutdown), it garnered more attention than usual.”

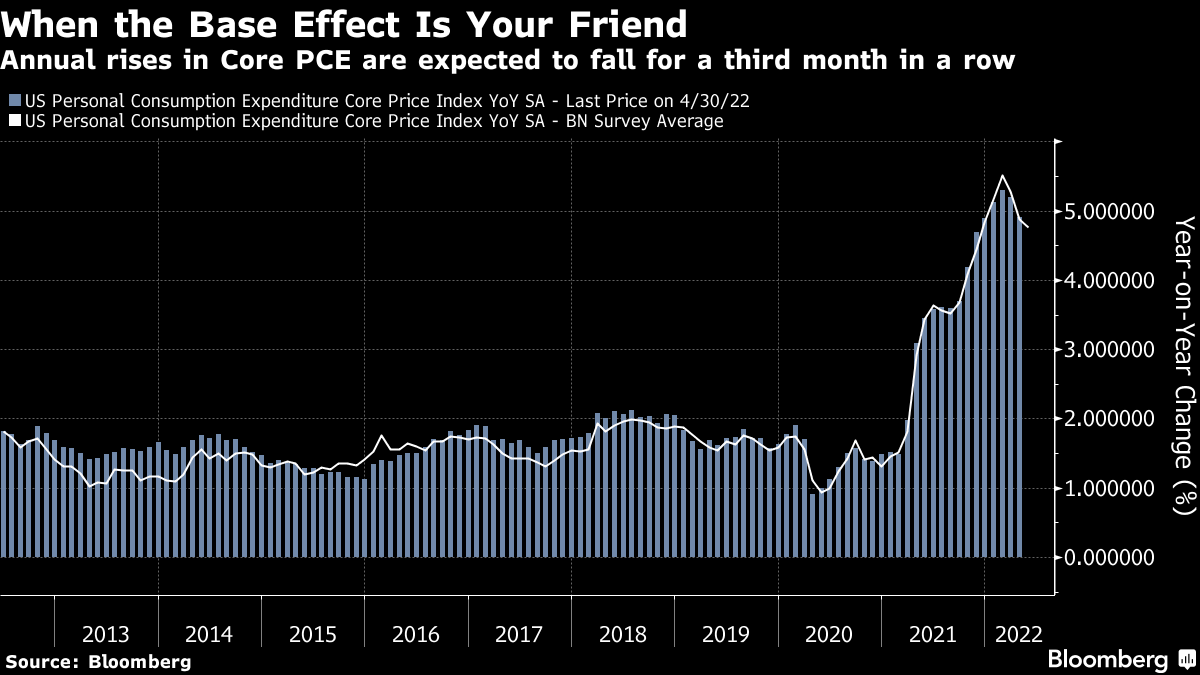
Moreover, the Fed’s preferred inflation measure – the personal consumption expenditure deflator (PCE) – is set to update. The expectation is that core PCE drops, “thanks to base effects from last year,” bolstering the “narrative that inflation will soon be licked.”

Graphic: Via Bloomberg.

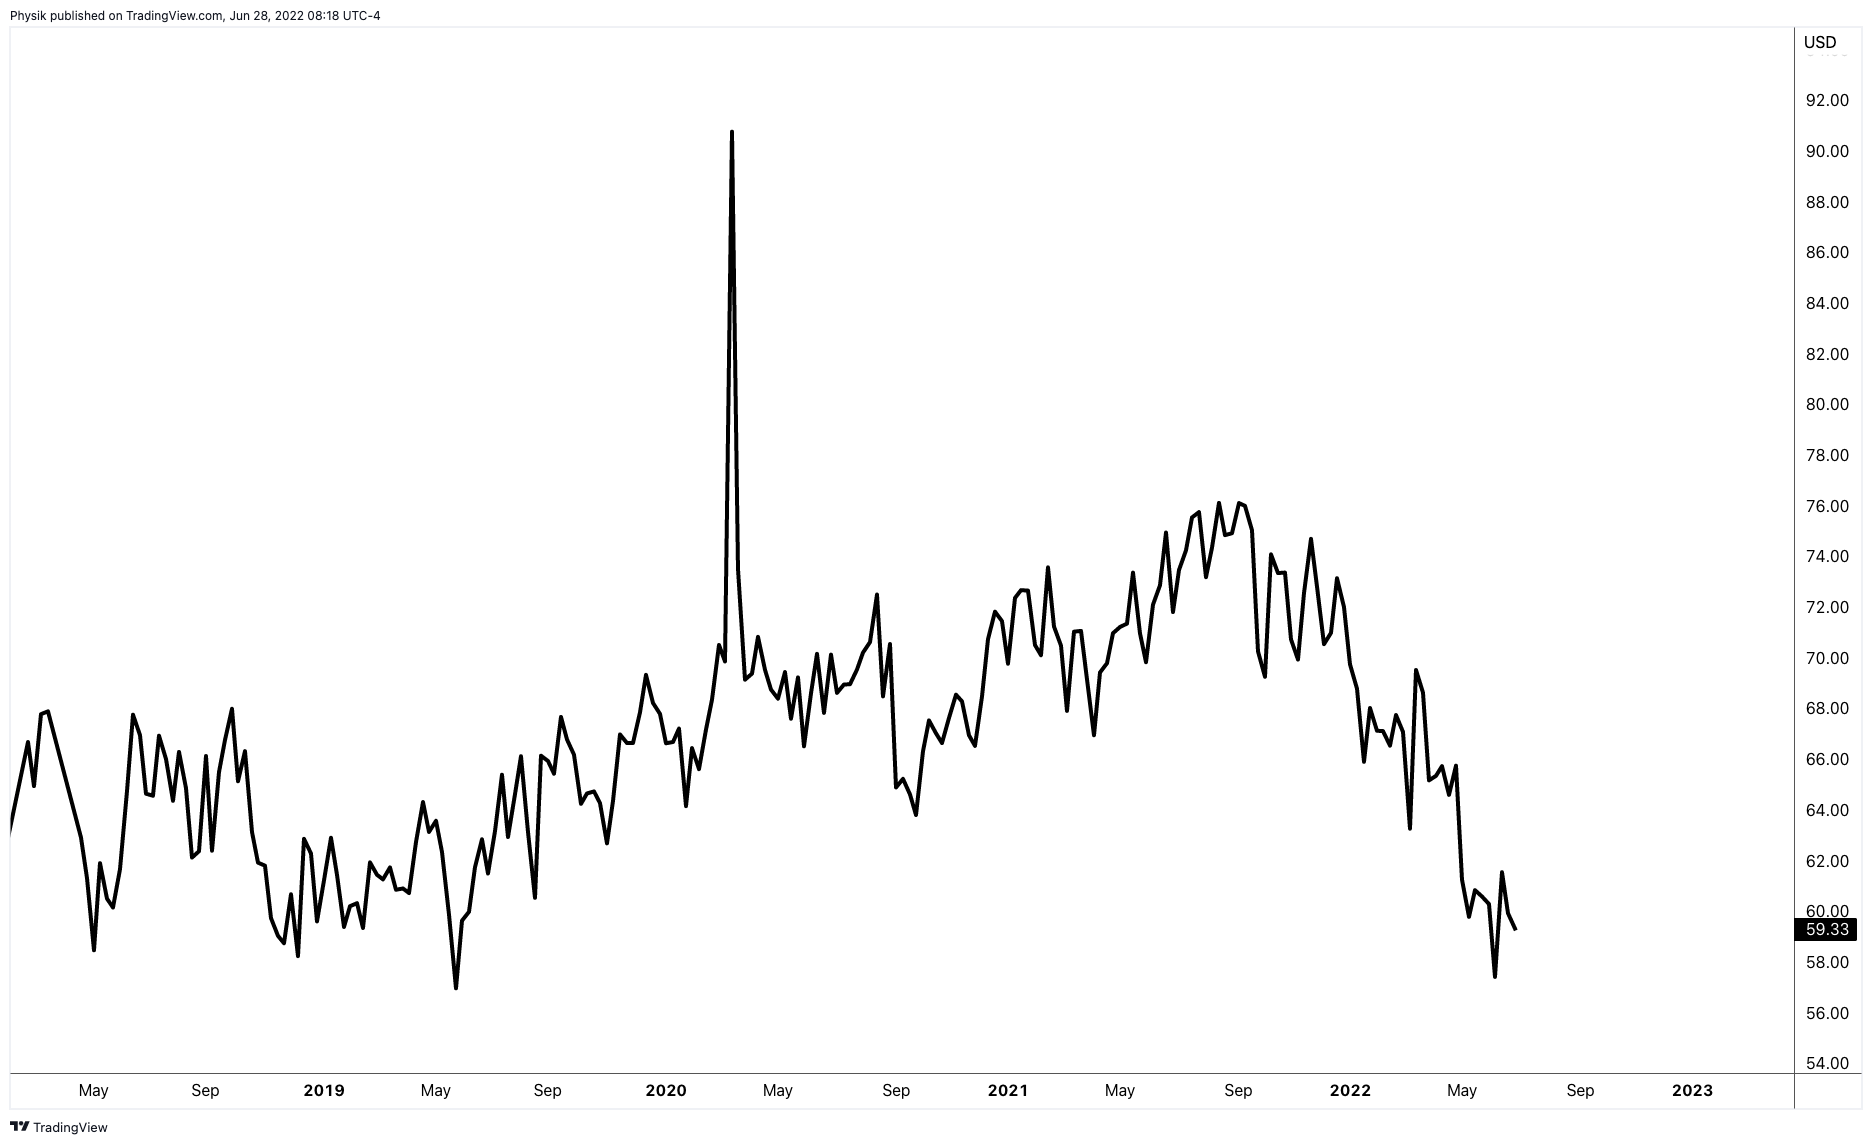
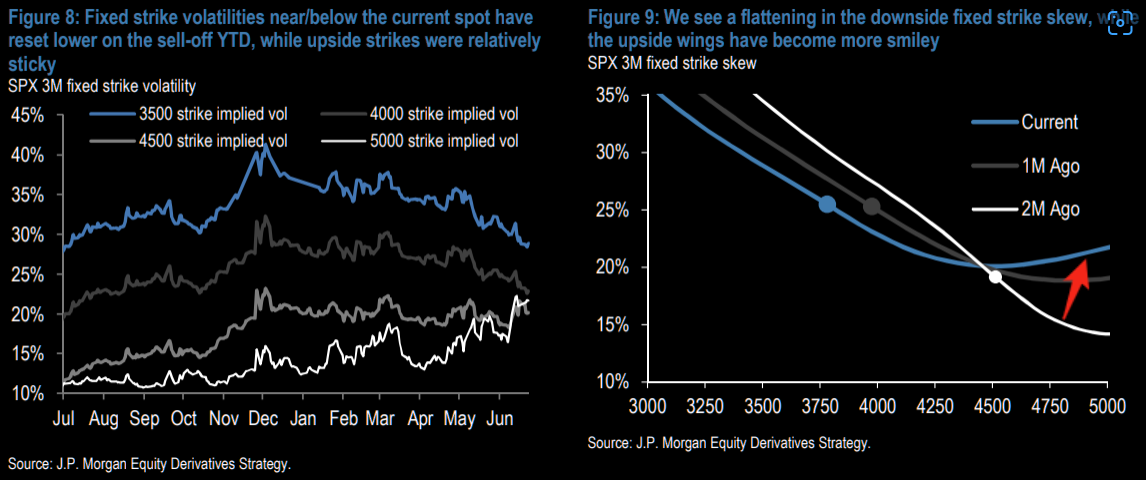
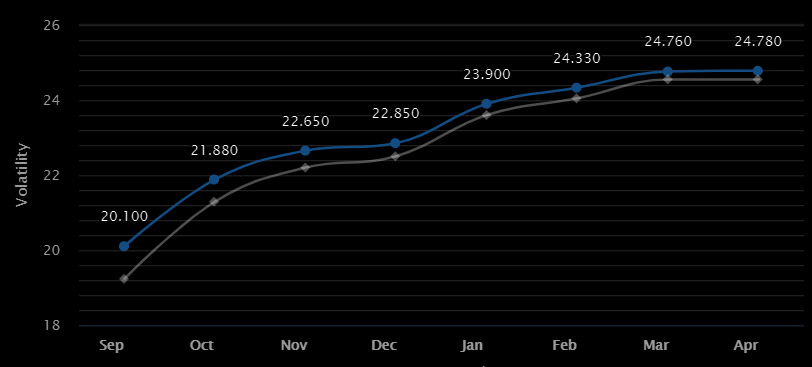
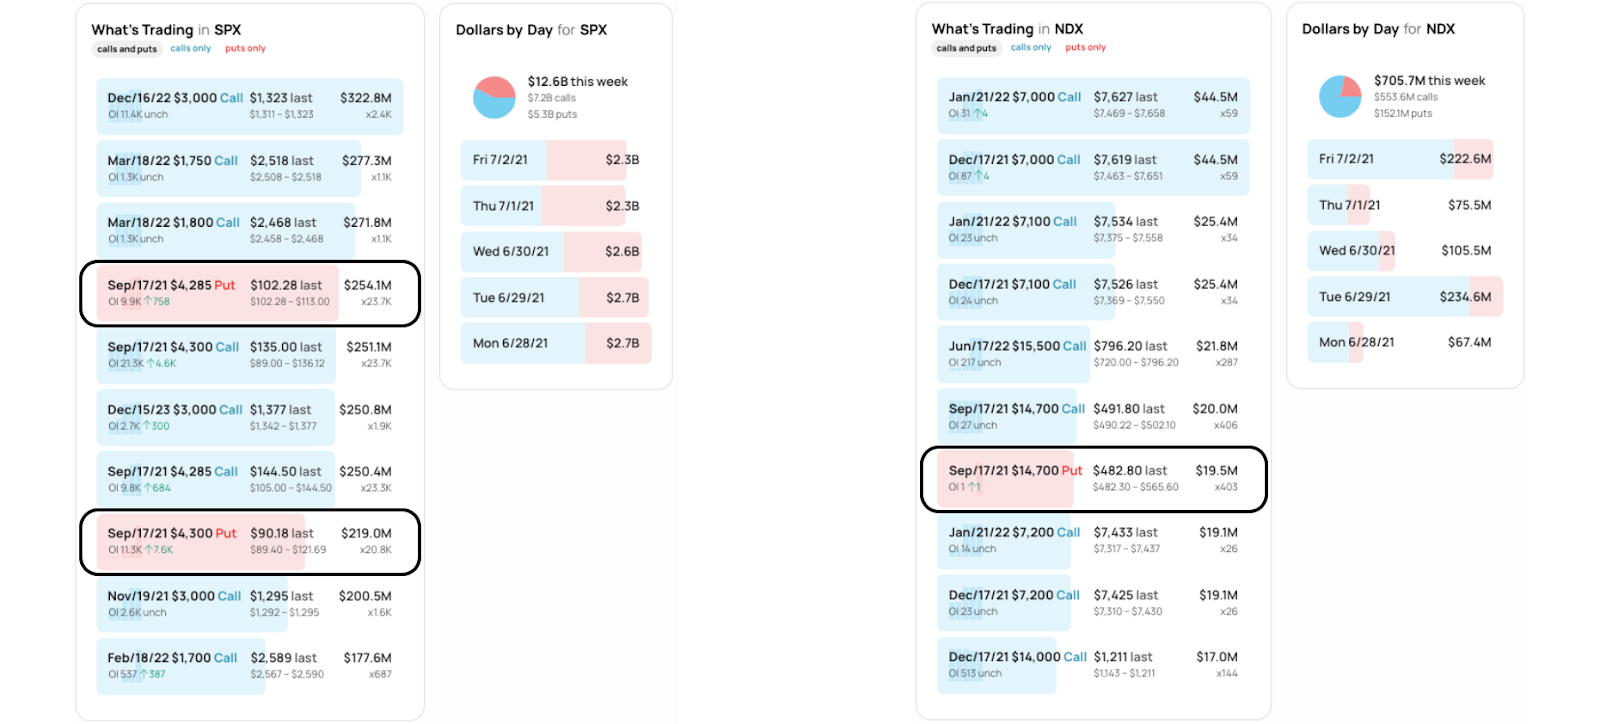
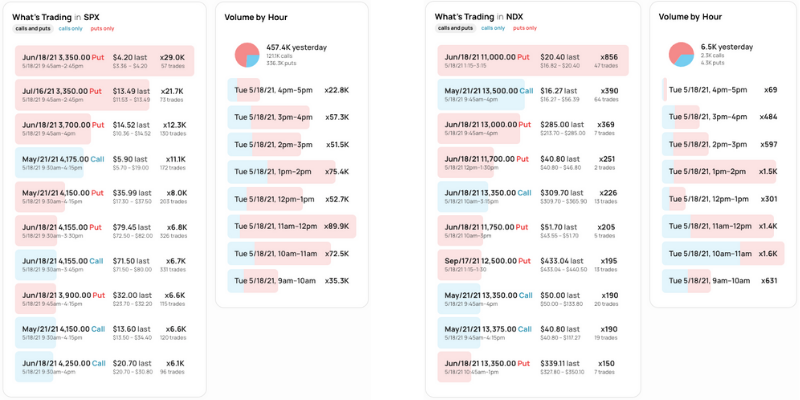
Positioning: Discussed, earlier this week, was whether it made sense to lean toward owning volatility, rather than selling it outright.

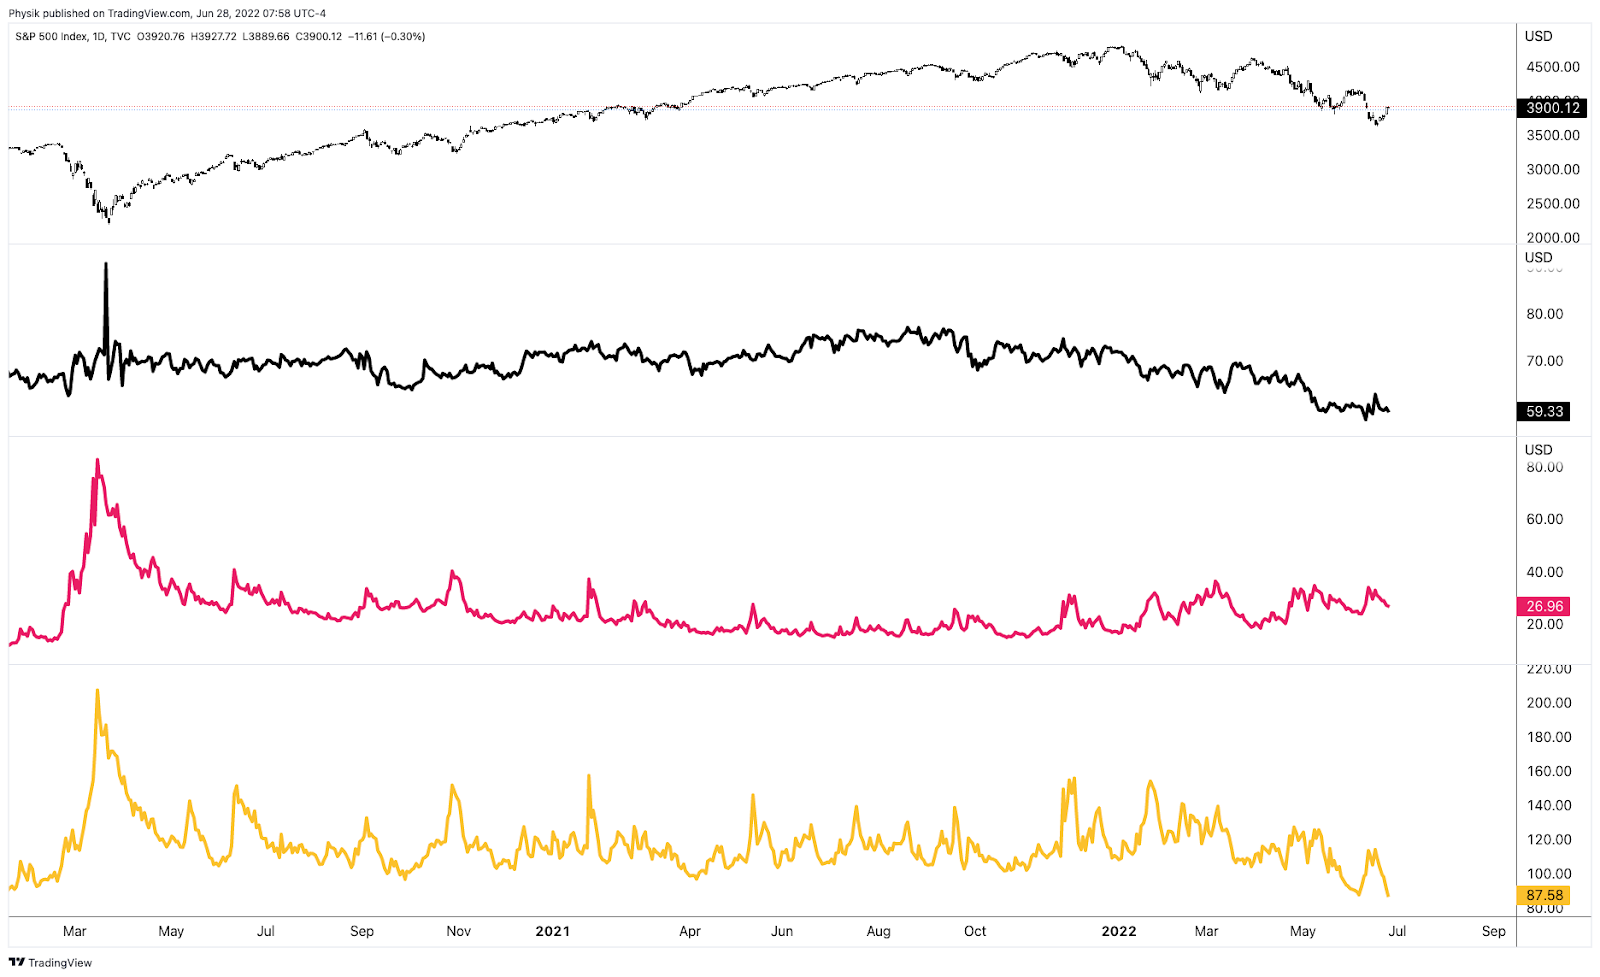
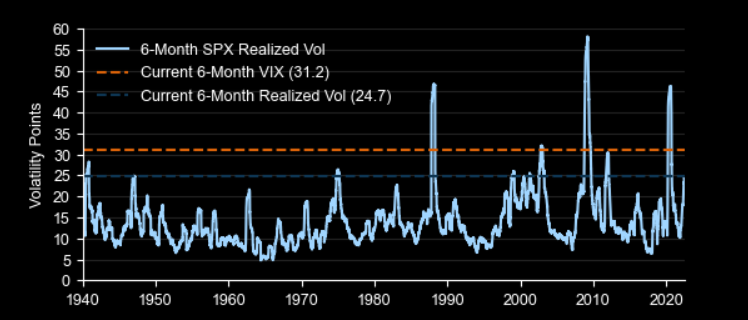
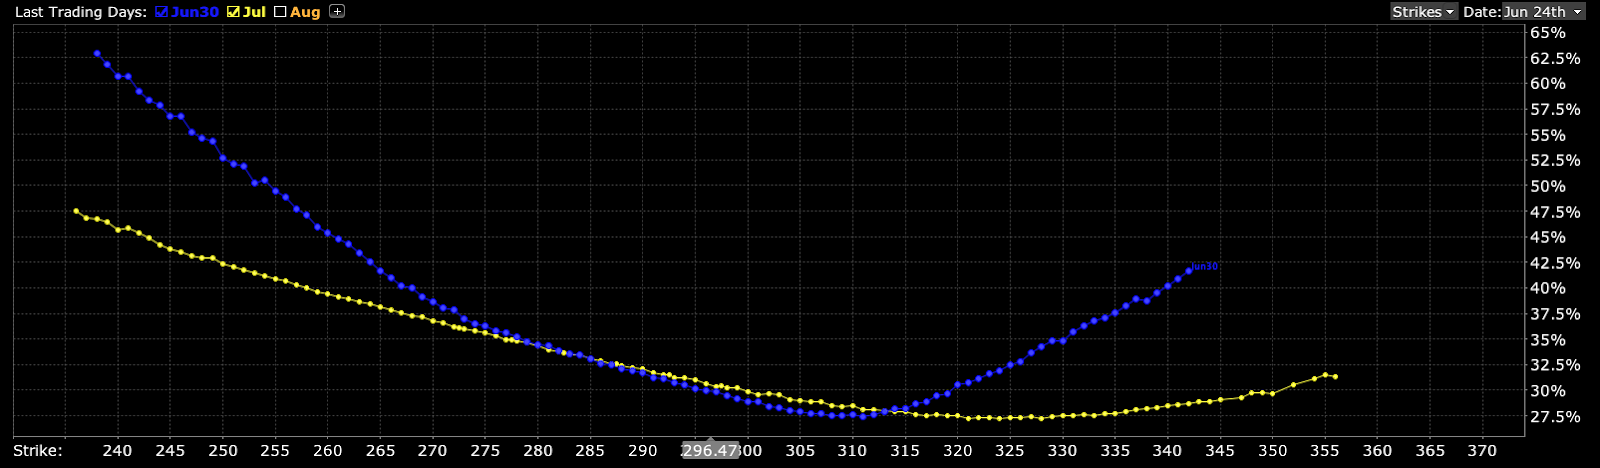
A “higher starting point” in implied volatility (IVOL), and a still-present right-tail (from the positioning for a bear market rally), made it so we could position, for less cost, in short-dated structures with asymmetric payouts, on both sides of the market.

Read: Trading Volatility, Correlation, Term Structure and Skew by Colin Bennett et al. Originally sourced via Academia.edu.

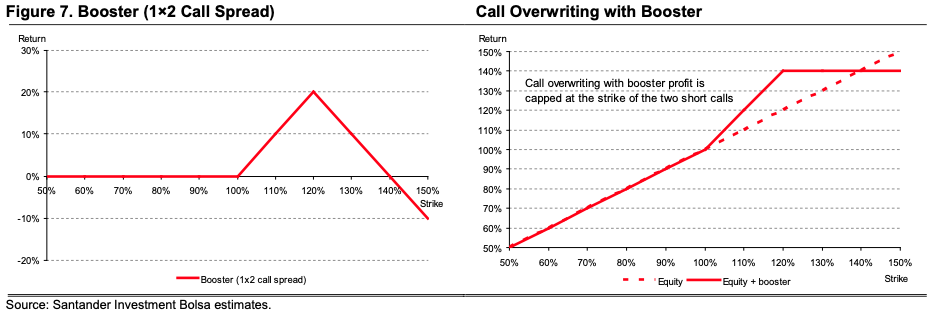
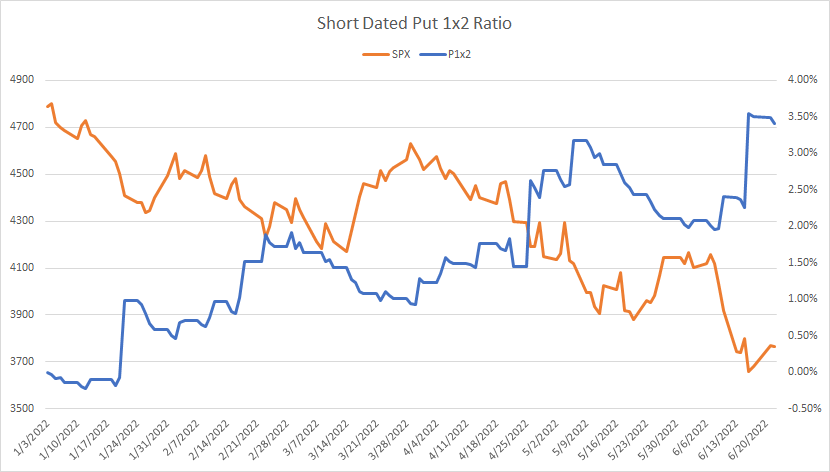
For instance, S&P 500 (INDEX: SPX) spreads +1 (near-the-money) x -2 (out-of-the-money), in excess of 200 points or so in width and up to 15 days to expiration, are performing well, today, pricing in excess of a 600% gain, only after pricing for little to no cost to enter in the days prior.

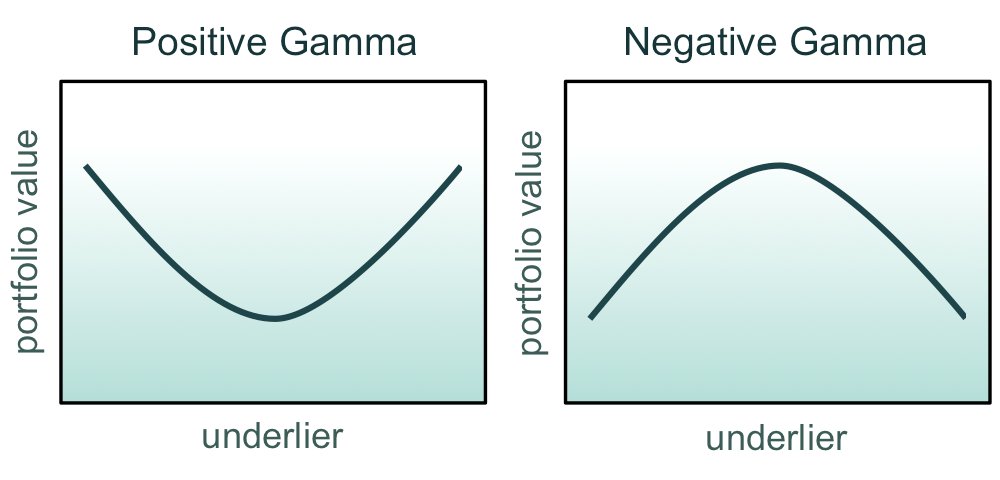
Disclaimer: Have delta in the direction you want the market to move, as well as positive gamma. In our case, we wanted negative delta (short bias) and positive gamma (profits amplified).

Graphic: Via Glyn Holton. “Positive gamma corresponds to curvature that opens upward. Negative gamma corresponds to curvature that opens downward.”

Recent market weaknesses will allow us to monetize and rotate those proceeds into speculative directional bets on the call-side, potentially. After all, the money is made in not losing it. Stay nimble. These are not trade recommendations. Be open-minded.

Graphic: Via Pat Hennessy. “[T]he performance of short-dated 1×2 put ratios in SPX this year. Despite being short the tail, the grind lower has been well captured by this trade structure.”

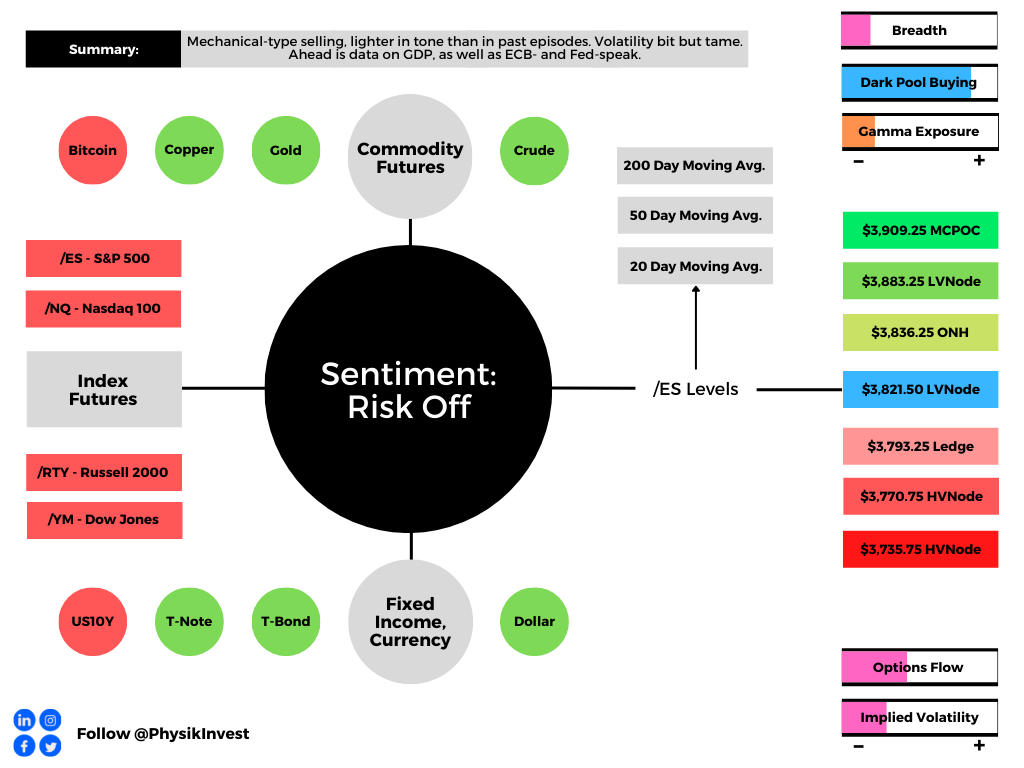
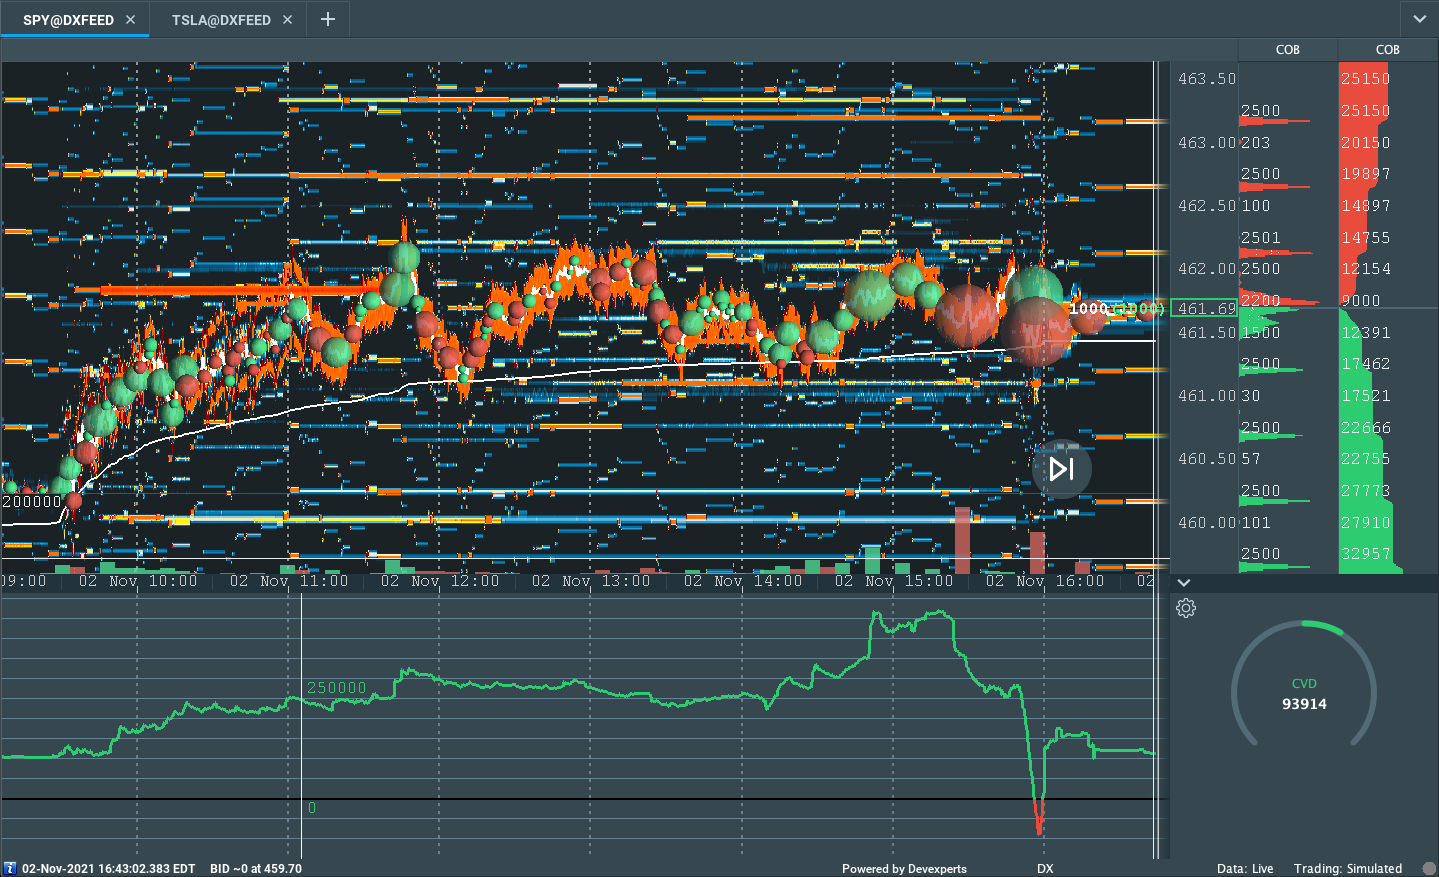
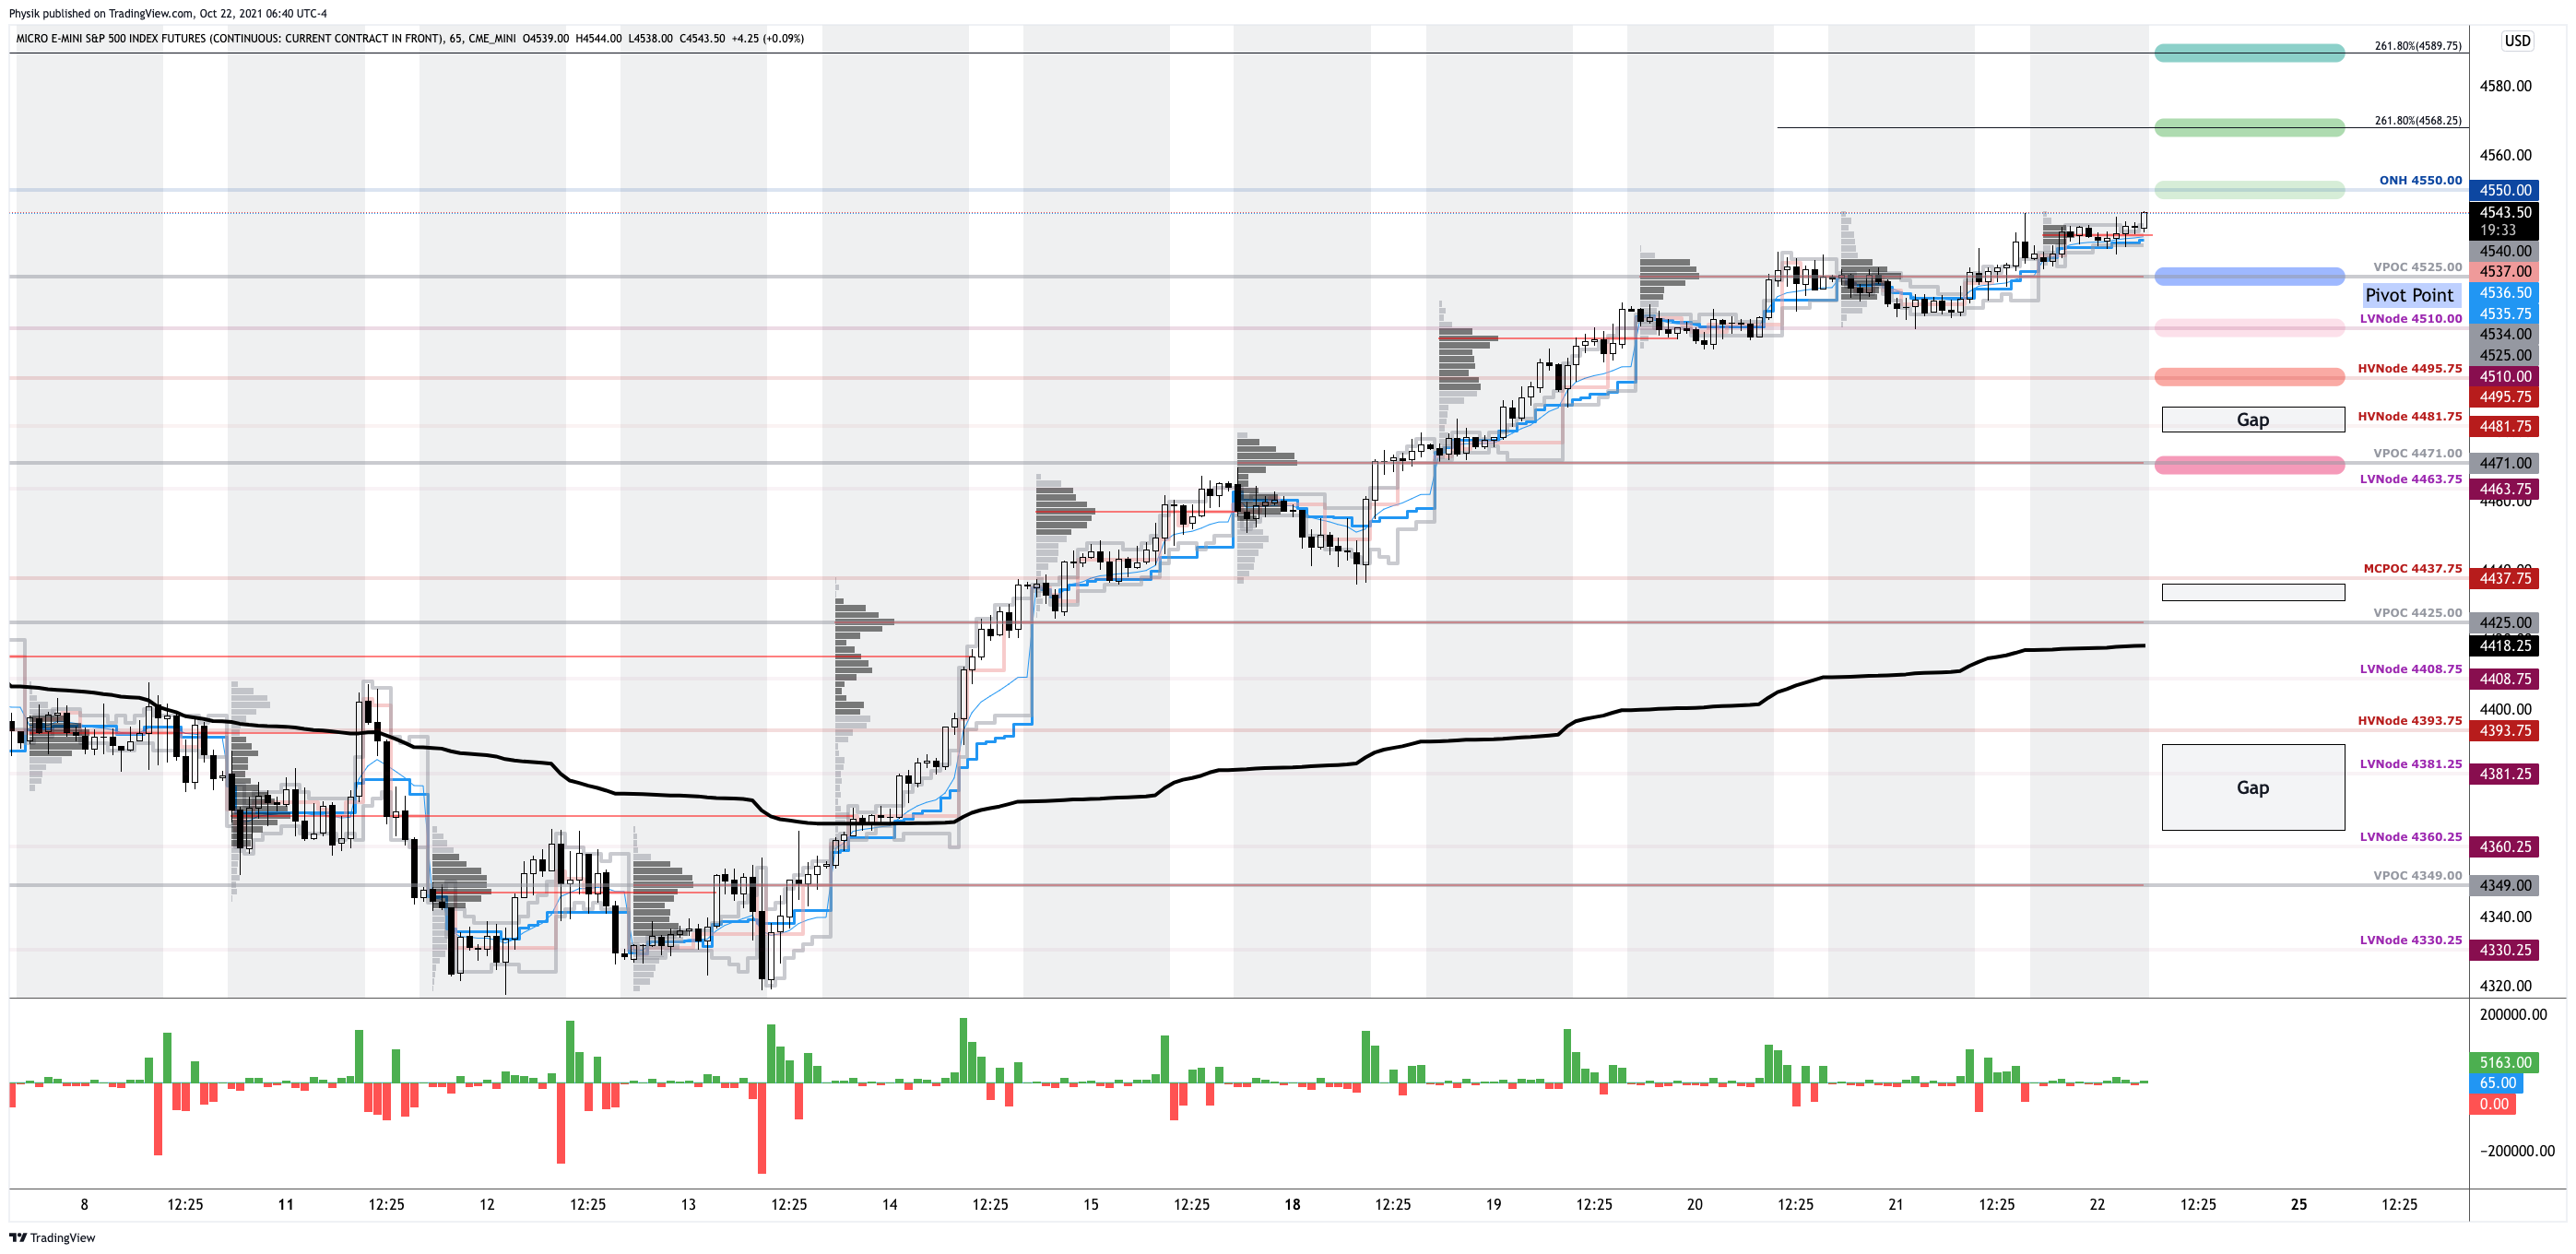
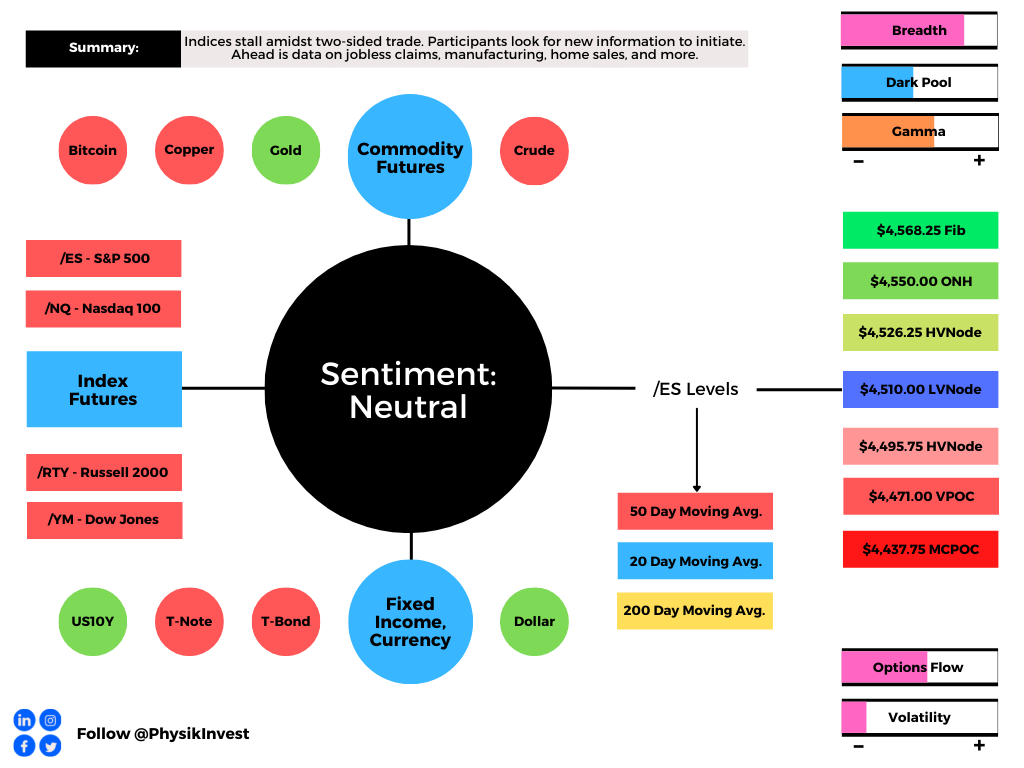
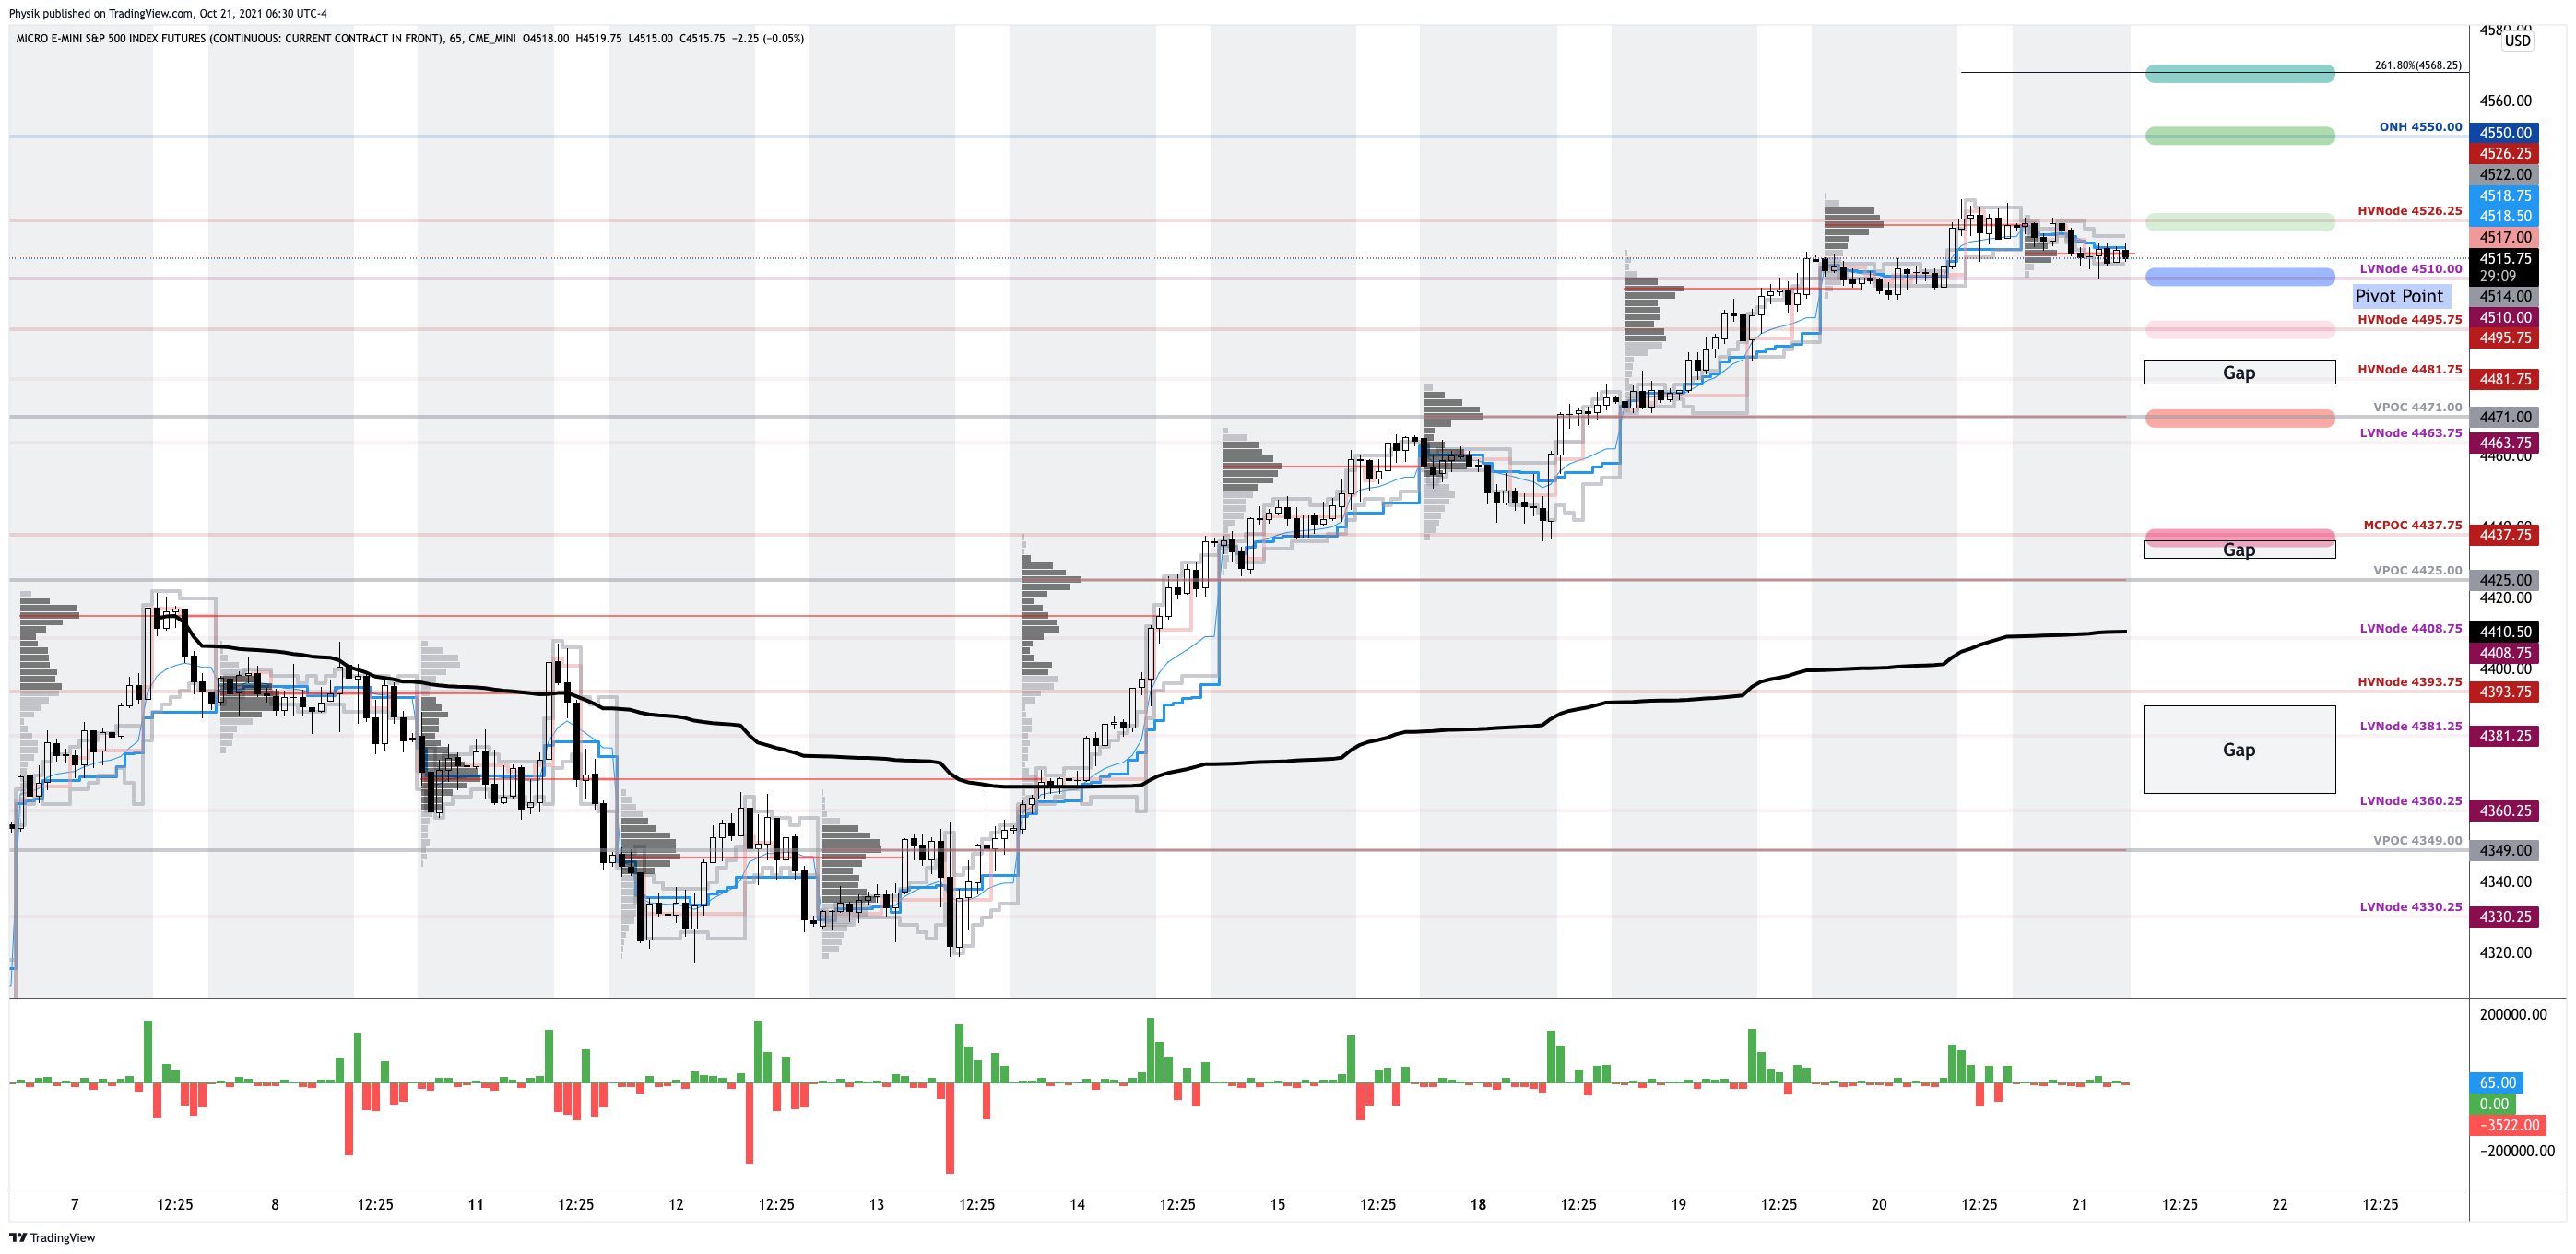
Technical: As of 6:30 AM ET, Thursday’s regular session (9:30 AM – 4:00 PM ET), in the S&P 500, will likely open in the lower part of a negatively skewed overnight inventory, outside of prior-range and -value, suggesting a potential for immediate directional opportunity.

In the best case, the S&P 500 trades higher; activity above the $3,770.75 HVNode puts in play the $3,793.25 Ledge. Initiative trade beyond the Ledge could reach as high as the $3,821.50 LVNode and $3,840.75 ONH, or higher.

In the worst case, the S&P 500 trades lower; activity below the $3,770.75 HVNode puts in play the $3,735.75 HVNode. Initiative trade beyond the HVNode could reach as low as the $3,722.50 LVNode and $3,696.00 LVNode, or lower.

Click here to load today’s key levels into the web-based TradingView charting platform. Note that all levels are derived using the 65-minute timeframe. New links are produced, daily.
Graphic: 65-minute profile chart of the Micro E-mini S&P 500 Futures.

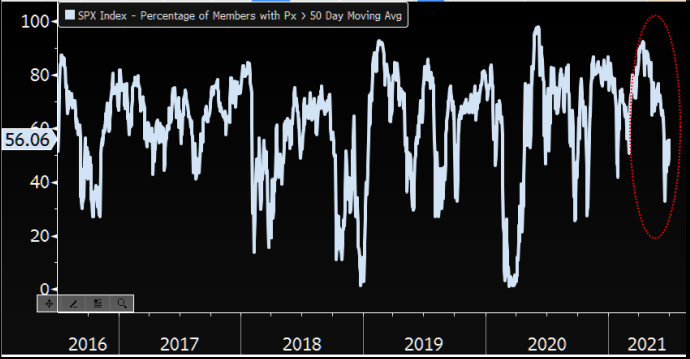
Considerations: Responsiveness near key-technical areas (that are discernable visually on a chart), suggests technically-driven traders with short time horizons are very active. 

Such traders often lack the wherewithal to defend retests and, additionally, the type of trade may be indicative of the other time frame participants waiting for more information to initiate trades.

Definitions

Overnight Rally Highs (Lows): Typically, there is a low historical probability associated with overnight rally-highs (lows) ending the upside (downside) discovery process.

Volume Areas: A structurally sound market will build on areas of high volume (HVNodes). Should the market trend for long periods of time, it will lack sound structure, identified as low volume areas (LVNodes). LVNodes denote directional conviction and ought to offer support on any test. 

If participants were to auction and find acceptance into areas of prior low volume (LVNodes), then future discovery ought to be volatile and quick as participants look to HVNodes for favorable entry or exit.

About

After years of self-education, strategy development, mentorship, and trial-and-error, Renato Leonard Capelj began trading full-time and founded Physik Invest to detail his methods, research, and performance in the markets.

Capelj also develops insights around impactful options market dynamics at SpotGamma and is a Benzinga reporter.

Some of his works include conversations with ARK Invest’s Catherine Wood, investors Kevin O’Leary and John Chambers, FTX’s Sam Bankman-Fried, Kai Volatility’s Cem Karsan, The Ambrus Group’s Kris Sidial, among many others.

Disclaimer

In no way should the materials herein be construed as advice. Derivatives carry a substantial risk of loss. All content is for informational purposes only.

Categories
Commentary

Daily Brief For June 29, 2022

The daily brief is a free glimpse into the prevailing fundamental and technical drivers of U.S. equity market products. Join the 300+ that read this report daily, below!

What Happened

Overnight, equity index futures traded sideways-to-lower, keeping intact the bearish tone from yesterday. Commodities were mixed. Bonds, the dollar, and implied volatility were bid.

At a micro-level, the selling was not similar to that of past market turmoil events. Instead, stocks were sold, but on the back of tame and steady volumes. Adding, the market’s responsiveness to key visual areas may mean that participants with shorter time horizons are more active, pointing to the potential that those with larger horizons are waiting for better entry or more information.

In terms of the news, similar to yesterday, narratives remain uninspiring. The key is that there are signs that inflation may soon turn the corner, as discussed in yesterday morning’s letter. In accordance with that perspective are comments by trader and macro strategist Andy Constan, who this letter’s author spoke with last week and will share insights extracted, below.

Ahead is data on GDP (8:30 AM ET), as well as talks by Federal Reserve (Fed) and European Central Bank (ECB) officials (9:00 AM ET, 11:30 AM ET, and 1:05 PM ET).

Graphic updated 6:40 AM ET. Sentiment Risk-Off if expected /ES open is below the prior day’s range. /ES levels are derived from the profile graphic at the bottom of the following section. Levels may have changed since initially quoted; click here for the latest levels. SqueezeMetrics Dark Pool Index (DIX) and Gamma (GEX) calculations are based on where the prior day’s reading falls with respect to the MAX and MIN of all occurrences available. A higher DIX is bullish. At the same time, the lower the GEX, the more (expected) volatility. Learn the implications of volatility, direction, and moneyness. SHIFT data used for S&P 500 (INDEX: SPX) options activity. Note that options flow is sorted by the call premium spent; if more positive, then more was spent on call options. Breadth reflects a reading of the prior day’s NYSE Advance/Decline indicator. VIX reflects a current reading of the CBOE Volatility Index (INDEX: VIX) from 0-100.

What To Expect

Perspectives: This letter’s objective is to provide salient information one may use in developing a tradeable narrative. Today, we’re taking a different approach and adding some diversity to the format by threading important points from the conversation Physik Invest’s Renato Capelj had with trader and macro strategist Andy Constan, the CEO and CIO of Damped Spring Advisors.

Without further ado, here it is.

The University of Pennsylvania alumnus had his start in finance in the 1980s when he joined Salomon Brothers. There, he excelled quickly and was the “go-to for questions.”

At one point, Salomon tapped Constan for his assistance with the 1987 stock market crash where he learned more about self-reinforcing market strains and how dynamic hedging processes may manifest market volatility.

Constan, later, managed Salomon’s derivatives operations, as well as the sale of those services. He said a lot of his success, in those years, was owed to making “everything systematic” and “operat[ing] with a framework.”

He, then, spent some time at Ray Dalio’s Bridgewater Associates where he was key in the firm’s research on volatility as an asset class. The lesson Bridgewater instilled was to “spend time finding the persistent trade,” parameterizing and executing, accordingly.

The alpha stream from the capture of that systemic edge is an asset itself.

Through the decades of experience, Constan eventually pivoted after recognizing that edges built on top of relative value (RV) – “the capture of inefficiencies generated from some form of concentrated positioning that pushes assets out of whack” – would fail on macro happenings.

Most noteworthy were Constan’s comments on the market’s de-rate

As we’ve talked about in this letter in the past, for decades monetary policies were the go-to instrument for stimulation. This money stocked a technological revolution, bolstered the supply of goods, and, by that token, promoted deflation, which was kept at bay by rising asset prices.

Trends in the geopolitical climate, a focus on fiscal stimulation, as well as supply chokepoints, have stoked goods and services inflation. The commitment to addressing inequality, as well as misallocations of capital through a tightening of liquidity and credit has consequences on the economy and asset prices, which are highly connected given multi-decade trends.

Stemming inflation, via supply-side economics, alone, is folly, as explained in the article. Trends like de-globalization are destructive to prosperity.

“The most destructive things to future prosperity are the tendencies that have developed over the last five years, like Brexit, the border wall, and the war in Ukraine. Comparative advantages, which globalization is essential for, generates uninsured supply chains and now we’re spending money on insurance.”

As the article explains, at its core, prices are set by the equilibrium between the supply and demand for goods. Both are not in line, and the stimulative monetary policies that helped keep the supply-side in check are not on the table, all the while supply chain replication is not adding to production.

Though that’s inflationary, political gridlock is a dampener on the trend.

What about the more pressing matter? Are we in a recession? 

The simple answer is yes, and 2022 is likely to be a 1% total GDP year with a 4% inflation rate. That said, an equity market recovery is not off the table.

We’re in a recession — a period of modestly to significantly below-trend growth — and the fiscal side would have to not force the Fed to do more by having a large spending bill which would hurt markets in a meaningful way.”

On the expression of opinions, Constan’s preferred method is to use defined risk options trades structured around his macro theses two to four months out in maturity. 

If volatility is rich, he will lean on selling credit. If volatility is cheap, he will opt to buy spreads. 

“I want deltas and leverage. My macro indicators give me an edge on price and in the worst case, the loss is limited to 10%, if everything has to go against me all at once. I can be 100% invested and only risk 10%.”

Read Full-Text: Former Bridgewater Associate Talks Recession Odds, Capturing A Macro Edge

Follow Andy Constan on Twitter, here.

Positioning: Little has changed. The volatility that the markets are realizing (RVOL) is high and, at times, in excess of that implied (IVOL). 

To cut to the chase, there’s a “higher starting point” in IVOL, and a still-present right-tail (from the positioning for a bear market rally).

Graphic: Taken by Physik Invest from Interactive Brokers Group Inc (NASDAQ: IBKR) on 6/24/2022. Multi-expiry skew in the Invesco QQQ Trust Series 1 (NASDAQ: QQQ). Notice the v-shape in the shorter maturity and smirk in the longer maturity. Here’s what that means.

Both make it so we may, for zero or no cost, trade short-dated structures with asymmetric payouts.

Read: Trading Volatility, Correlation, Term Structure and Skew by Colin Bennett et al. Originally sourced via Academia.edu.

Graphic: Via Banco Santander SA (NYSE: SAN) research, the return profile, at expiry, of a classic 1×2 (long 1, short 2 further away) ratio spread (the inverse of a back spread).

Technical: As of 6:30 AM ET, Wednesday’s regular session (9:30 AM – 4:00 PM ET), in the S&P 500, will likely open in the lower part of a negatively skewed overnight inventory, outside of prior-range and -value, suggesting a potential for immediate directional opportunity.

In the best case, the S&P 500 trades higher; activity above the $3,821.50 LVNode puts in play the $3,836.25 ONH. Initiative trade beyond the ONH could reach as high as the $3,883.25 LVNode and $3,909.25 MCPOC, or higher.

In the worst case, the S&P 500 trades lower; activity below the $3,821.50 LVNode puts in play the $3,793.25 Ledge. Initiative trade beyond the Ledge could reach as low as the $3,770.75 and $3,735.75 HVNode, or lower.

Click here to load today’s key levels into the web-based TradingView charting platform. Note that all levels are derived using the 65-minute timeframe. New links are produced, daily.
Graphic: 65-minute profile chart of the Micro E-mini S&P 500 Futures.

Considerations: Push-and-pull (responsiveness) near key-technical areas (that are discernable visually on a chart), suggests technically-driven traders with short time horizons are very active. 

Such traders often lack the wherewithal to defend retests and, additionally, the type of trade may be indicative of the other time frame participants waiting for more information to initiate trades.

What People Are Saying

Definitions

Overnight Rally Highs (Lows): Typically, there is a low historical probability associated with overnight rally-highs (lows) ending the upside (downside) discovery process.

Volume Areas: A structurally sound market will build on areas of high volume (HVNodes). Should the market trend for long periods of time, it will lack sound structure, identified as low volume areas (LVNodes). LVNodes denote directional conviction and ought to offer support on any test. 

If participants were to auction and find acceptance into areas of prior low volume (LVNodes), then future discovery ought to be volatile and quick as participants look to HVNodes for favorable entry or exit.

MCPOCs: POCs are valuable as they denote areas where two-sided trade was most prevalent over numerous day sessions. Participants will respond to future tests of value as they offer favorable entry and exit.

Volume-Weighted Average Prices (VWAPs): A metric highly regarded by chief investment officers, among other participants, for quality of trade. Additionally, liquidity algorithms are benchmarked and programmed to buy and sell around VWAPs.

About

After years of self-education, strategy development, mentorship, and trial-and-error, Renato Leonard Capelj began trading full-time and founded Physik Invest to detail his methods, research, and performance in the markets.

Capelj also develops insights around impactful options market dynamics at SpotGamma and is a Benzinga reporter.

Some of his works include conversations with ARK Invest’s Catherine Wood, investors Kevin O’Leary and John Chambers, FTX’s Sam Bankman-Fried, Kai Volatility’s Cem Karsan, The Ambrus Group’s Kris Sidial, among many others.

Disclaimer

In no way should the materials herein be construed as advice. Derivatives carry a substantial risk of loss. All content is for informational purposes only.

Categories
Commentary

Daily Brief For June 28, 2022

The daily brief is a free glimpse into the prevailing fundamental and technical drivers of U.S. equity market products. Join the 300+ that read this report daily, below!

What Happened

Overnight, equity index futures rotated higher, along with commodities. Implied volatility was bid. Bonds were lower. 

In the news were some changes to China’s COVID policies, the European Central Bank’s (ECB) intent to follow its peers and raise interest rates in July by 25 basis points, and the Group of Seven (G-7) leaders are talking about geopolitics and placing limitations on Russia. 

At home, mortgage lenders are turning “desperate” as soaring rates roil their industry. Some are bracing for a 20% reduction in business as 30-year mortgage rates level out below 5.75%.

Pursuant to some of our analyses last week, Scion Asset Management founder Michael Burry suggested a “supply gut at retail is the bullwhip effect.” More on this, later.

Ahead is data on trade in goods (8:30 AM ET), S&P Case-Shiller U.S. home price index (9:00 AM ET), consumer confidence index (10:00 AM ET), as well as updates by Federal Reserve (Fed) members (8:00 AM ET and 12:30 PM ET).

Graphic updated 6:30 AM ET. Sentiment Neutral if expected /ES open is inside of the prior day’s range. /ES levels are derived from the profile graphic at the bottom of the following section. Levels may have changed since initially quoted; click here for the latest levels. SqueezeMetrics Dark Pool Index (DIX) and Gamma (GEX) calculations are based on where the prior day’s reading falls with respect to the MAX and MIN of all occurrences available. A higher DIX is bullish. At the same time, the lower the GEX, the more (expected) volatility. Learn the implications of volatility, direction, and moneyness. SHIFT data used for S&P 500 (INDEX: SPX) options activity. Note that options flow is sorted by the call premium spent; if more positive, then more was spent on call options. Breadth reflects a reading of the prior day’s NYSE Advance/Decline indicator. VIX reflects a current reading of the CBOE Volatility Index (INDEX: VIX) from 0-100.

What To Expect

Fundamental: Though badly timed, last year ARK Invest’s Cathie Wood said inflation would be on its way out due in part to inventory build-ups and their impact on commodity prices.

Graphic: Via Societe Generale SA (OTC: SCGLY).

At the time, she asked whether the velocity of money was depressed given pent-up savings and demand for assets, putting forth disappointing GDP updates (which grew, mostly, on the back of inventories) and slightly negative retail final sales as support for her broader thesis. 

Recall happenings in real estate – the iBuying debacle – late last year. Wood said this: 

“This is unsustainable, … and I’m wondering if even the housing market inflation is going to give way, here.”

Participants were extending moneyness to nonmonetary assets, given monetary policies and an environment of debt and leverage that ultimately cuts into asset price volatility. Ultimately, these trends bolster the risks of carry when volatility does rise and the demand for money pushes deflation, particularly in asset prices.

Read: Daily brief for May 18, 2022.

Graphic: Via the Investment Company Institute. Taken from Joseph Wang. “Investors are selling everything for cash.”

With bank deposits to drain about $1 trillion or so by year-end, that volatility is happening, now, as investors “continue to lower their selling prices to compete for the cash they want.”

Scion Asset Management’s Michael Burry nods at the “supply gut” in retail. Like Wood, he thinks that it is a deflationary pulse that manifests disinflation in consumer prices, prompting the Fed to reverse itself on rates and quantitative tightening (QT).

Read: DC’s Chartbook #16 on the “fundamental evolution in the global money markets.”

Graphic: Via Societe Generale SA (OTC: SCGLY).

That’s as Credit Suisse Group AG’s (NYSE: CS) Zoltan Pozsar, who gained much attention this year on his bold market commentary, said the Fed is likely to change course as it “can only deal with nominal [and] not real chokepoints.” This is as “nominal balance sheet and liquidity trends will, at some point, clash with the realities of a garden variety of supply chain issues.”

Graphic: Via @BarnabeBearBull. “[L]ast week 18 Central Banks tightened their monetary policy (12% of all monitored CBs), including 4 of the top 9. Strongest move in a while.”

Positioning: Incredible is the still-depressed volatility skew we’ve talked about ad nauseam on.

Graphic: Via JPMorgan Chase & Co (NYSE: JPM). Taken from The Market Ear. “Overwriting longs and using the premium to buy downside protection is relatively cheaper now.”

It’s the strong supply of volatility. Participants are hedging, buying into volatility that is closer to current prices, and selling (skew) that which is farther out. 

The counterparts are long that volatility further out, which they may sell into declines, and all of this, together, “results in vol underperformance on market declines,” per Sergei Perfiliev.

Graphic: Via Physik Invest. Taken from TradingView. The top is S&P 500 (INDEX: SPX). The second, from the top, is the Nations SkewDex (INDEX: SDEX), a clearer measure of options skew. The second from the bottom is the Cboe Volatility Index (INDEX: VIX). The bottom is the Cboe VVIX index (INDEX: VVIX), a naive measure of skew.

For that reason, the volatility that the markets are realizing (RVOL) is heightened and, at times, in excess of that implied.

Graphic: Via Goldman Sachs Group Inc (NYSE: GS). Taken from The Market Ear. “SPX 6-month realized volatility is at a level rarely seen outside of major crises; current 6-month implied volatility has been exceeded in just 3 periods since 1940.”

As said, yesterday, given these dynamics, it makes sense to lean toward owning volatility, rather than selling it. A “higher starting point” in IVOL, and a still-present right-tail (from the positioning for a bear market rally), make it so we may position, for less cost, in short-dated structures with asymmetric payouts (call and put side), precisely as we’ve been talking about for half-a-year.

Graphic: Via Pat Hennessy. “[T]he performance of short-dated 1×2 put ratios in SPX this year. Despite being short the tail, the grind lower has been well captured by this trade structure.”

In the near term, from a positioning perspective, the front-running of quarter-end repositioning flow is (and is expected), in part, to add to the equity market upside.

Graphic: Taken by Physik Invest from Interactive Brokers Group Inc (NASDAQ: IBKR) on 6/24/2022. Multi-expiry skew in the Invesco QQQ Trust Series 1 (NASDAQ: QQQ). Notice the v-shape in the shorter maturity and smirk in the longer maturity. Here’s what that means.

Technical: As of 6:30 AM ET, Tuesday’s regular session (9:30 AM – 4:00 PM ET), in the S&P 500, will likely open in the mid-to-upper part of a balanced overnight inventory, inside of prior-range and -value, suggesting a limited potential for immediate directional opportunity.

In the best case, the S&P 500 trades higher; activity above the $3,909.25 MCPOC puts in play the $3,943.25 HVNode. Initiative trade beyond the HVNode could reach as high as the $3,982.75 LVNode and $4,016.25 HVNode, or higher.

In the worst case, the S&P 500 trades lower; activity below the $3,909.25 MCPOC puts in play the $3,885.75 ONL. Initiative trade beyond the ONL could reach as low as the $3,821.50 LVNode and $3,793.25 Ledge, or lower.

Click here to load today’s key levels into the web-based TradingView charting platform. Note that all levels are derived using the 65-minute timeframe. New links are produced, daily.
Graphic: 65-minute profile chart of the Micro E-mini S&P 500 Futures.

Balanced (Two-Timeframe Or Bracket) Trade The Status Quo: Rotational trade that denotes current prices offer favorable entry and exit. 

Balance areas make it easy to spot a change in the market (i.e., the transition from two-time frame trade, or balance, to one-time frame trade, or trend). 

Modus operandi is responsive trade (i.e., fade the edges), rather than initiative trade (i.e., play the break).

Definitions

Overnight Rally Highs (Lows): Typically, there is a low historical probability associated with overnight rally-highs (lows) ending the upside (downside) discovery process.

Volume Areas: A structurally sound market will build on areas of high volume (HVNodes). Should the market trend for long periods of time, it will lack sound structure, identified as low volume areas (LVNodes). LVNodes denote directional conviction and ought to offer support on any test. 

If participants were to auction and find acceptance into areas of prior low volume (LVNodes), then future discovery ought to be volatile and quick as participants look to HVNodes for favorable entry or exit.

MCPOCs: POCs are valuable as they denote areas where two-sided trade was most prevalent over numerous day sessions. Participants will respond to future tests of value as they offer favorable entry and exit.

About

After years of self-education, strategy development, mentorship, and trial-and-error, Renato Leonard Capelj began trading full-time and founded Physik Invest to detail his methods, research, and performance in the markets.

Capelj also develops insights around impactful options market dynamics at SpotGamma and is a Benzinga reporter.

Some of his works include conversations with ARK Invest’s Catherine Wood, investors Kevin O’Leary and John Chambers, FTX’s Sam Bankman-Fried, Kai Volatility’s Cem Karsan, The Ambrus Group’s Kris Sidial, among many others.

Disclaimer

In no way should the materials herein be construed as advice. Derivatives carry a substantial risk of loss. All content is for informational purposes only.

Categories
Commentary

Daily Brief For November 3, 2021

Abstract

Equity index futures and commodities were mixed. Bonds sideways to higher. Volatility bid.

Ahead is a heavy day of economic releases, in the face of fundamental narratives and positioning metrics that may later support directional resolve.

What Happened

Overnight, equity index futures were flat as participants wait to initiate the next leg – higher or lower – until they are provided clarity on monetary policy frameworks, the pace of the economic recovery, and the like.

Ahead is ADP employment (8:15 AM ET), Markit services PMI (9:45 AM ET), ISM services index and factory orders (10:00 AM ET), as well as Federal Reserve statements (2:00 PM ET).

Graphic updated 6:30 AM ET. Sentiment Neutral if expected /ES open is inside of the prior day’s range. /ES levels are derived from the profile graphic at the bottom of the following section. Levels may have changed since initially quoted; click here for the latest levels. SqueezeMetrics Dark Pool Index (DIX) and Gamma (GEX) calculations are based on where the prior day’s reading falls with respect to the MAX and MIN of all occurrences available. A higher DIX is bullish. At the same time, the lower the GEX, the more (expected) volatility. Learn the implications of volatility, direction, and moneyness. SHIFT data used for S&P 500 (INDEX: SPX) options activity. Note that options flow is sorted by the call premium spent; if more positive then more was spent on call options. Breadth reflects a reading of the prior day’s NYSE Advance/Decline indicator. VIX reflects a current reading of the CBOE Volatility Index (INDEX: VIX) from 0-100.

What To Expect

Action: On lackluster breadth and market liquidity metrics, the best case outcome occurred, evidenced by participants’ exploration of new prices in the S&P 500.

Intent: The intraday excess high marks potential exhaustion (or willingness to end trend). Also, the rounding of the composite profile (i.e., developing ledge) suggests participants are either painting themselves into a corner or there is a lack of conviction to take price higher.

Validation: Sideways trade, above the $4,590.00 balance area high (BAH), and overlapping value areas, validates the market’s intent to pause ahead of new information.

Consideration: Poor structure left behind prior initiative trade (as evidenced by the presence of numerous gaps and p-shaped emotional, multiple-distribution profile structures which denote short-covering and a lack of material, new-money buying) adds to technical instability.

Should the market crack, participants will likely look to check old value (i.e., revisit, repair, and strengthen) these pockets of low-volume. This is called the “cave-fill” process, in volume profile terms.

Graphic: Flat delta (i.e., non-committed buying as measured by volume delta or buying and selling power as calculated by the difference in volume traded at the bid and offer) in SPDR S&P 500 ETF Trust (NYSE: SPY), one of the largest ETFs that track the S&P 500 index, via Bookmap. The readings are supportive of responsive trade (i.e., rotational trade that suggests current prices offer favorable entry and exit; the market is in balance).

Context: Federal Open Market Committee (FOMC) announcement later today.

The announcement will provide participants with color on the economic recovery and the Federal Reserve’s intent to continue supporting the economy, at the rate it has. 

Nordea’s Andreas Steno Larsen states: “Jay Powell will have to walk on eggshells to prevent an acceleration of the front-end of the USD yield curve. Arguments for the Fed to tighten policy keep piling up and hence we see a swift tapering process (30B a meeting) and a first hike in June.” 

“The combination of 1) even higher inflation prints during Q4 (with several extremely volatile base effects), 2) a removal of USD liquidity, 3) a historically weak credit impulse into 2022 (due to a massive credit expansion 20/21) sounds like the perfect flattener setup to us,” which may weigh on sentiment and long term investments.

Graphic: “Keep flattening the yield curve during tapering,” via Nordea.

In terms of positioning, the CBOE Volatility Index (INDEX: VIX) was a touch higher, while spreads across the VIX futures term structure widened with demand coming in at the front.

Such a situation, as touched on yesterday, in addition to the long-gamma environment (in which counterparties hedge their warehoused options risk by buying underlying into weakness and selling into strength), has the effect of making it difficult to resolve directionally.

The reasons are: (1) options will slide down their term structure (vanna) and (2) skew decays (charm). When this happens, we expect to see supportive flows as dealers cover their short equity/futures hedges. 

With volatility bid, the effect of vanna and charm is dulled. As a result, it is likely that participants see more movement after the FOMC announcement.

To note, the potential for upside resolve comes down to how participants take the FOMC announcement. We know that, according to SpotGamma, there is increased capital being committed to higher and higher options strikes, a development often seen as bullish.

Expectations: As of 6:30 AM ET, Wednesday’s regular session (9:30 AM – 4:00 PM ET), in the S&P 500, will likely open in the middle part of a neutral overnight inventory, inside of prior-range and -value, suggesting a limited potential for immediate directional opportunity.

Balance (Two-Timeframe Or Bracket) Is The Status Quo: Rotational trade that denotes current prices offer favorable entry and exit. Modus operandi is responsive trade (i.e., fade the edges), rather than initiative trade (i.e., play the break).

In the best case, the S&P 500 trades sideways or higher; activity above the $4,620.25 high volume area (HVNode) pivot puts in play the $4,628.50 Fibonacci extension. Initiative trade beyond $4,628.50 could reach the $4,639.00 and $4,664.75 Fibonacci levels, or higher.

In the worst case, the S&P 500 trades lower; activity below the $4,620.25 HVNode puts in play the $4,590.00 balance area high (BAH). Initiative trade beyond the BAH could reach as low as the $4,574.25 HVNode and $4,551.75 low volume area (LVNode), or lower.

Click here to load today’s updated key levels into the web-based TradingView charting platform. Note that all levels are derived using the 65-minute timeframe. New links are produced, daily.
Graphic: 65-minute profile chart of the Micro E-mini S&P 500 Futures. Learn about the profile.

What People Are Saying

Definitions

Cave-Fill Process: Widened the area deemed favorable to transact at by an increased share of participants. This is a good development.

Volume Areas: A structurally sound market will build on areas of high volume (HVNodes). Should the market trend for long periods of time, it will lack sound structure, identified as low volume areas (LVNodes). LVNodes denote directional conviction and ought to offer support on any test. 

If participants were to auction and find acceptance into areas of prior low volume (LVNodes), then future discovery ought to be volatile and quick as participants look to HVNodes for favorable entry or exit.

Excess: A proper end to price discovery; the market travels too far while advertising prices. Responsive, other-timeframe (OTF) participants aggressively enter the market, leaving tails or gaps which denote unfair prices.

Ledges: Flattened area on the profile which suggests responsive participants are in control, or initiative participants lack the confidence to continue the discovery process. The ledge will either hold and force participants to liquidate (cover) their positions, or crack and offer support (resistance).

Value-Area Placement: Perception of value unchanged if value overlapping (i.e., inside day). Perception of value has changed if value not overlapping (i.e., outside day). Delay trade in the former case.

About

After years of self-education, strategy development, and trial-and-error, Renato Leonard Capelj began trading full-time and founded Physik Invest to detail his methods, research, and performance in the markets.

Additionally, Capelj is a Benzinga finance and technology reporter interviewing the likes of Shark Tank’s Kevin O’Leary, JC2 Ventures’ John Chambers, and ARK Invest’s Catherine Wood, as well as a SpotGamma contributor, developing insights around impactful options market dynamics.

Disclaimer

At this time, Physik Invest does not manage outside capital and is not licensed. In no way should the materials herein be construed as advice. Derivatives carry a substantial risk of loss. All content is for informational purposes only.

Categories
Commentary

Daily Brief For October 22, 2021

Editor’s Note: Due to travel commitments, the Daily Brief will not be sent 10/25-10/27.

Apologies and have a great weekend!

Market Commentary

Out of sync with bonds, equity index futures were mostly sideways to higher. Commodities were higher. Volatility compressed.

  • Ahead is manufacturing, services PMI.
  • Participants discover uncharted prices.
  • Options positioning presented tailwind.

What Happened: U.S. stock index futures, less the Nasdaq 100, auctioned sideways to higher overnight as participants looked to discover new prices.

Ahead is data on manufacturing and services PMI (9:45 AM ET), as well as Fed-speak (10:00 and 11:00 AM ET).

Graphic updated 6:40 AM ET. Sentiment Risk-On if expected /ES open is above the prior day’s range. /ES levels are derived from the profile graphic at the bottom of the following section. Levels may have changed since initially quoted; click here for the latest levels. SqueezeMetrics Dark Pool Index (DIX) and Gamma (GEX) calculations are based on where the prior day’s reading falls with respect to the MAX and MIN of all occurrences available. A higher DIX is bullish. At the same time, the lower the GEX, the more (expected) volatility. SHIFT data used for S&P 500 (INDEX: SPX) options activity. Note that options flow is sorted by the call premium spent; if more positive then more was spent on call options. Breadth reflects a reading of the prior day’s NYSE Advance/Decline indicator. VIX reflects a current reading of the CBOE Volatility Index (INDEX: VIX) from 0-100.

What To Expect: As of 6:30 AM ET, Friday’s regular session (9:30 AM – 4:00 PM EST) in the S&P 500 will likely open on a small gap, just outside of prior-range and -value, suggesting a potential for immediate directional opportunity.

Gap Scenarios: Gaps ought to fill quickly. Should they not, that’s a signal of strength; do not fade. Leaving value behind on a gap-fill or failing to fill a gap (i.e., remaining outside of the prior session’s range) is a go-with indicator.

Auctioning and spending at least 1-hour of trade back in the prior range suggests a lack of conviction; in such a case, do not follow the direction of the most recent initiative activity.

During the prior day’s regular trade, on light volume, nonparticipatory intraday breadth, and supportive market liquidity metrics, the best case outcome occurred, evidenced by upside resolve, above flattened day timeframe profile structures, or ledges.

This activity comes after prior sessions left behind numerous gaps and emotional, multiple-distribution profile structures.

Further, Thursday’s overnight gap in range, below value, set indices up for what is called the cave-fill process (characterized by repair and strengthening of low volume areas).

The day timeframe activity rejected lower prices; participants auctioned to new highs in both regular and overnight trade, putting in play a recovery of the un-adjusted overnight high (ONH) at $4,550.00.

Graphic: Supportive delta (i.e., committed buying as measured by volume delta or buying and selling power as calculated by the difference in volume traded at the bid and offer) in SPDR S&P 500 ETF Trust (NYSE: SPY), one of the largest ETFs that track the S&P 500 index, via Bookmap. The readings are supportive of initiative trade.

Zooming out, we see that though the Nasdaq 100 firmed this week, it did not recover as much ground as its peers, the S&P 500 and Dow Jones Industrial Average, both of which are trading at or above their all-time high figures. 

Graphic: SPDR S&P 500 ETF (NYSE: SPY) top left, Invesco QQQ Trust Series 1 (NASDAQ: QQQ) top right, iShares Russell 2000 ETF (NYSE: IWM) bottom left, SPDR Dow Jones Industrial Average ETF Trust (NYSE: DIA) bottom right.

This recovery has been swift and built on relatively poor – low volume – structures that ought to offer minimal support; what this simply means is that higher prices need validation.

Note: Value is defined by where 70% of the day’s trade happened, the bulk of where volume is. 

Think of the absence of high volume structures, on the way up, leaving no value to base off of. If prices are followed by value, that means that they are supported. If there is an open above (below) value, a market will auction lower (higher) in search of buyers (sellers). After auctioning too far from value, the response by higher timeframe participants will introduce single-print buying and selling tails as those participants look to take advantage of higher (lower) prices to sell (buy). 

Please read this excerpt from Mind Over Markets, for additional context.

Further, the aforementioned trade is happening in the context of improving breadth amidst a seasonally bullish cycle of contributions, rebalancing, and earnings, as well as the risks associated with a taper in asset purchases and a hike in rates.

In terms of positioning, the CBOE Volatility Index (INDEX: VIX) was lower, while the VIX futures term structure settled in contango; supply at the front end of the curve, alongside the long-gamma environment, signals a potential for near-term equity market stability.

According to SpotGamma analyses, this is where the so-called vanna (i.e., inflows as a result of options sliding down their term structure) dynamic comes to dominate. Adding, we look for increased interest in options strikes that are higher in price and further out in time.

Moreover, for today, participants may make use of the following frameworks.

In the best case, the S&P 500 trades sideways or higher; activity above the $4,525.00 untested point of control (VPOC) puts in play the $4,550.00 overnight high (ONH). Initiative trade beyond the ONH could reach as high as the $4,568.25 and $4,589.75 Fibonacci extensions, or higher.

In the worst case, the S&P 500 trades lower; activity below the $4,525.00 VPOC puts in play the $4,510.00 low volume area (LVNode). Initiative trade beyond the LVNode could reach as low as the $4,495.75 high volume area (HVNode) and $4,471.00 VPOC, or lower.

Click here to load today’s updated real-time key levels into the web-based TradingView charting platform. Please note that all levels are derived using the 65-minute timeframe.
Graphic: 65-minute profile chart of the Micro E-mini S&P 500 Futures updated 6:30 AM ET.

Definitions

Cave-Fill Process: Widened the area deemed favorable to transact at by an increased share of participants. This is a good development.

Overnight Rally Highs (Lows): Typically, there is a low historical probability associated with overnight rally-highs (lows) ending the upside (downside) discovery process.

Volume Areas: A structurally sound market will build on areas of high volume (HVNodes). Should the market trend for long periods of time, it will lack sound structure, identified as low volume areas (LVNodes). LVNodes denote directional conviction and ought to offer support on any test. 

If participants were to auction and find acceptance into areas of prior low volume (LVNodes), then future discovery ought to be volatile and quick as participants look to HVNodes for favorable entry or exit.

POCs: POCs are valuable as they denote areas where two-sided trade was most prevalent in a prior day session. Participants will respond to future tests of value as they offer favorable entry and exit.

Excess: A proper end to price discovery; the market travels too far while advertising prices. Responsive, other-timeframe (OTF) participants aggressively enter the market, leaving tails or gaps which denote unfair prices.

Ledges: Flattened area on the profile which suggests responsive participants are in control, or initiative participants lack the confidence to continue the discovery process. The ledge will either hold and force participants to liquidate (cover) their positions, or crack and offer support (resistance).

Volume-Weighted Average Prices (VWAPs): A metric highly regarded by chief investment officers, among other participants, for quality of trade. Additionally, liquidity algorithms are benchmarked and programmed to buy and sell around VWAPs.

News And Analysis

U.K. consumer confidence falls amidst cheerless news.

Growth digitalization of finance intensifying competition.

Supply issues could haunt the holidays after sales rise.

Substantial progress toward Fed’s mandates. Tapering?

Think everything’s expensive now? Wait there is more.

Big jump in home sales – impressive considering supply.

Biden: U.S. would defend Taiwan from attack by China.

Online wager, engagement key to sports betting growth.

What People Are Saying

About

After years of self-education, strategy development, and trial-and-error, Renato Leonard Capelj began trading full-time and founded Physik Invest to detail his methods, research, and performance in the markets. 

Additionally, Capelj is a finance and technology reporter. Some of his biggest works include interviews with leaders such as John Chambers, founder and CEO, JC2 Ventures, Kevin O’Leary, businessman and Shark Tank host, Catherine Wood, CEO and CIO, ARK Invest, among others.

Disclaimer

At this time, Physik Invest does not manage outside capital and is not licensed. In no way should the materials herein be construed as advice. Derivatives carry a substantial risk of loss. All content is for informational purposes only.

Categories
Commentary

Daily Brief For October 21, 2021

Market Commentary

In sync with bonds, equity index futures were sideways to lower. Commodities were mixed. Volatility expanded lightly.

  • Ahead is jobless claims data and more.
  • Many companies surpass expectations.
  • Positioned for sideways trade, balance.

What Happened: U.S. stock index futures auctioned sideways to lower overnight alongside news that among the S&P 500 companies that have disclosed their corporate results, 84% have posted earnings that surpassed expectations.

Ahead is jobless claims and Philadelphia Fed manufacturing (8:30 AM ET) data, Fed speak (9:00 AM ET), as well as existing home sales and leading economic indicators (10:00 AM ET) updates.

Graphic updated 6:45 AM ET. Sentiment Neutral if expected /ES open is inside of the prior day’s range. /ES levels are derived from the profile graphic at the bottom of the following section. Levels may have changed since initially quoted; click here for the latest levels. SqueezeMetrics Dark Pool Index (DIX) and Gamma (GEX) calculations are based on where the prior day’s reading falls with respect to the MAX and MIN of all occurrences available. A higher DIX is bullish. At the same time, the lower the GEX, the more (expected) volatility. SHIFT data used for S&P 500 (INDEX: SPX) options activity. Note that options flow is sorted by the call premium spent; if more positive then more was spent on call options. Breadth reflects a reading of the prior day’s NYSE Advance/Decline indicator. VIX reflects a current reading of the CBOE Volatility Index (INDEX: VIX) from 0-100.

What To Expect: As of 6:30 AM ET, Thursday’s regular session (9:30 AM – 4:00 PM EST) in the S&P 500 will likely open on a light gap, just inside of prior-range and -value, suggesting a limited potential for immediate directional opportunity. 

Adding, during the prior day’s regular trade, in the face of strong intraday breadth and divergent market liquidity metrics, equity indices – specifically the S&P 500 – had a tough time expanding the range to the upside, leaving a ledge, or flattened area on the intraday profile.

This activity comes after prior sessions left behind numerous gaps and emotional, multiple-distribution profile structures.

Thursday’s gap in range, below value, sets up indices for what is called the cave-fill process.

It’s highly likely that participants will look to revisit, repair, and strengthen areas of low volume (LVNodes).

Graphic: Divergent delta (i.e., mostly non-committed buying as measured by volume delta or buying and selling power as calculated by the difference in volume traded at the bid and offer) in SPDR S&P 500 ETF Trust (NYSE: SPY), one of the largest ETFs that track the S&P 500 index, via Bookmap. The readings are supportive of responsive trade or balance (i.e., rotational trade that suggests current prices offer favorable entry and exit).

Zooming out, we see that though the Nasdaq 100 firmed this week, it did not recover as much ground as its peers, the S&P 500 and Dow Jones Industrial Average.

Given where the indices are in relation to their anchored volume-weighted average price levels (VWAPs), the average buyer, since the all-time high, holds a winning position

Sideways-to-higher trade, above the upward sloping trendline, as well as the 50.00% and 61.8% retracements, keeps in play a recovery of the all-time high in the S&P 500, Nasdaq 100, and Russell 2000, like the Dow Jones Industrial Average.

Graphic: SPDR S&P 500 ETF (NYSE: SPY) top left, Invesco QQQ Trust Series 1 (NASDAQ: QQQ) top right, iShares Russell 2000 ETF (NYSE: IWM) bottom left, SPDR Dow Jones Industrial Average ETF Trust (NYSE: DIA) bottom right.

Further, the aforementioned trade is happening in the context of improving breadth amidst a seasonally bullish cycle of contributions, rebalancing, and earnings, as well as the risks associated with a taper in asset purchases and a hike in rates.

In terms of positioning, the CBOE Volatility Index (INDEX: VIX) was slightly higher, after the October 20 expiration, while the VIX futures term structure shows a bit of demand coming in at the front end of the curve. 

These conditions – coupled with the long-gamma environment and suppression in realized volatility as the S&P 500 trades around $4,510.00, a figure in the vicinity of what options modeling platform SpotGamma calls a Call Wall (i.e., level at which positive options gamma, essentially delta sensitivity to the underlying price, is highest) – point to increased odds of near-term equity market stability, and some potential for back-filling.

Should participants increase their interest in options strikes that are higher in price and further out in time, they may be able to overcome the stickiness of the $4,500.00 S&P 500 area (the direct result of associated hedging pressures, and the like).

Moreover, for today, participants may make use of the following frameworks.

In the best case, the S&P 500 trades sideways or higher; activity above the $4,510.00 low volume area (LVNode) pivot puts in play the $4,526.25 high volume area (HVNode). Initiative trade beyond the $4,526.25 HVNode could reach as high as the $4,550.00 overnight high (ONH) and $4,568.25 Fibonacci extension, or higher.

In the worst case, the S&P 500 trades lower; activity below the $4,510.00 LVNode puts in play the $4,495.75 HVNode. Initiative trade beyond the $4,495.75 HVNode could reach as low as the $4,471.00 untested point of control (VPOC) and $4,437.75 micro composite point of control (MCPOC), or lower.

Click here to load today’s updated real-time key levels into the web-based TradingView charting platform. Please note that all levels are derived using the 65-minute timeframe.
Graphic: 65-minute profile chart of the Micro E-mini S&P 500 Futures updated 6:30 AM ET.

Definitions

Cave-Fill Process: Widened the area deemed favorable to transact at by an increased share of participants. This is a good development.

Overnight Rally Highs (Lows): Typically, there is a low historical probability associated with overnight rally-highs (lows) ending the upside (downside) discovery process.

Volume Areas: A structurally sound market will build on areas of high volume (HVNodes). Should the market trend for long periods of time, it will lack sound structure, identified as low volume areas (LVNodes). LVNodes denote directional conviction and ought to offer support on any test. 

If participants were to auction and find acceptance into areas of prior low volume (LVNodes), then future discovery ought to be volatile and quick as participants look to HVNodes for favorable entry or exit.

Gamma: Gamma is the sensitivity of an option to changes in the underlying price. Dealers that take the other side of options trades hedge their exposure to risk by buying and selling the underlying. When dealers are short-gamma, they hedge by buying into strength and selling into weakness. When dealers are long-gamma, they hedge by selling into strength and buying into weakness. The former exacerbates volatility. The latter calms volatility.

POCs: POCs are valuable as they denote areas where two-sided trade was most prevalent in a prior day session. Participants will respond to future tests of value as they offer favorable entry and exit.

MCPOCs: POCs are valuable as they denote areas where two-sided trade was most prevalent over numerous day sessions. Participants will respond to future tests of value as they offer favorable entry and exit.

Significance Of Prior ATHs, ATLs: Prices often encounter resistance (support) at prior highs (lows) due to the supply (demand) of old business. These areas take time to resolve. Breaking and establishing value (i.e., trading more than 30-minutes beyond this level) portends continuation.

Balance (Two-Timeframe Or Bracket): Rotational trade that denotes current prices offer favorable entry and exit. Balance-areas make it easy to spot a change in the market (i.e., the transition from two-time frame trade, or balance, to one-time frame trade, or trend). 

Modus operandi is responsive trade (i.e., fade the edges), rather than initiative trade (i.e., play the break).

Ledges: Flattened area on the profile which suggests responsive participants are in control, or initiative participants lack the confidence to continue the discovery process. The ledge will either hold and force participants to liquidate (cover) their positions, or crack and offer support (resistance).

More On Volume-Weighted Average Prices (VWAPs): A metric highly regarded by chief investment officers, among other participants, for quality of trade. Additionally, liquidity algorithms are benchmarked and programmed to buy and sell around VWAPs.

News And Analysis

COVID-19 Impacts: A market-implied probability of default perspective.

The Pfizer-BioNTech booster shot restores full coronavirus protections.

Evergrande shares plunging as deal talks end, sales sink nearly 100%.

China’s common prosperity agenda is risky near-term, okay long-term.

Consumer gut on inflation is wrong. That’s a Federal Reserve problem.

What People Are Saying

About

After years of self-education, strategy development, and trial-and-error, Renato Leonard Capelj began trading full-time and founded Physik Invest to detail his methods, research, and performance in the markets. 

Additionally, Capelj is a finance and technology reporter. Some of his biggest works include interviews with leaders such as John Chambers, founder and CEO, JC2 Ventures, Kevin O’Leary, businessman and Shark Tank host, Catherine Wood, CEO and CIO, ARK Invest, among others.

Disclaimer

At this time, Physik Invest does not manage outside capital and is not licensed. In no way should the materials herein be construed as advice. Derivatives carry a substantial risk of loss. All content is for informational purposes only.

Categories
Commentary

Daily Brief For August 27, 2021

Market Commentary

Equity index futures, commodities, bonds, and the dollar were sideways to higher overnight.

  • Some complacency? Let’s talk it out.
  • Ahead: Misc data and Jackson Hole.
  • Building a base for directional move.

What Happened: U.S. stock index futures auctioned higher overnight as investors continued to position themselves to better act on new monetary policy information.

Ahead is data on personal income (8:30 AM ET), consumer spending (8:30 AM ET), core PCE (8:30 AM ET), trade in goods (8:30 AM ET), University of Michigan sentiment (10:00 AM ET). Later, Federal Reserve Chair Jerome Powell speaks at the Jackson Hole Economic Symposium (10:00 AM ET).

Graphic updated 6:30 AM ET. Sentiment Neutral if expected /ES open is inside of the prior day’s range. SqueezeMetrics Dark Pool Index (DIX) and Gamma (GEX) calculations are based on where the prior day’s reading falls with respect to the MAX and MIN of all occurrences available. A higher DIX is bullish. At the same time, the lower the GEX, the more (expected) volatility. SHIFT data used for S&P 500 (INDEX: SPX) options activity approximation. Note that options flow is sorted by the call premium spent; if more positive then more was spent on call options. Breadth reflects a reading of the prior day’s Advance/Decline indicator. VIX reflects a current reading of the CBOE Volatility Index (INDEX: VIX) from 0-100.

What To Expect: As of 6:30 AM ET, Friday’s regular session (9:30 AM – 4:00 PM EST) in the S&P 500 will likely open inside of prior-range and -value, suggesting a limited potential for immediate directional opportunity.

Adding, during the prior day’s regular trade, on weak intraday breadth and divergent market liquidity metrics, the worst-case outcome occurred, evidenced by trade below the $4,484.25 high volume area (HVNode) pivot. This is significant because S&P 500 printed prices in a pocket of low-volume left behind by strong initiative buying earlier in the week. Given the overnight retracement, the index is back to basing for what may be strong directional resolve.

Balance (Two-Timeframe Or Bracket) Trade Is In Play: Rotational trade that denotes current prices offer favorable entry and exit. Balance-areas make it easy to spot a change in the market (i.e., the transition from two-time frame trade, or balance, to one-time frame trade, or trend). 

Modus operandi is responsive trade (i.e., fade the edges), rather than initiative trade (i.e., play the break).

Further, the aforementioned trade is happening in the context of the important Jackson Hole event and a shift higher in the VIX futures terms structure into and through the August 26-28 event. The implications of these events on price are contradictory; to elaborate, extended positioning – which alone suggests risks are asymmetric – coupled with a pronounced shift in shorter-dated VIX expiries, warns of elevated near-term risks for equity market stability.

Graphic: VIX term structure shifts higher with the biggest move happening at the short end of the curve from The Market Ear.

Moreover, for today, participants may make use of the following frameworks.

In the best case, the S&P 500 trades sideways or higher; activity above the $4,481.75 high volume area (HVNode) pivot puts in play the $4,495.00 untested point of control (VPOC). Initiative trade beyond the VPOC could reach as high as the $4,511.50 and $4,556.25 Fibonacci-derived price targets.

In the worst case, the S&P 500 trades lower; activity below the $4,481.75 HVNode pivot likely puts in play the $4,454.25 low volume area (LVNode), a ledge resolved during Monday’s breakout. Initiative trade beyond the LVNode could reach as low as the $4,427.00 VPOC and $4,393.75 micro-composite point of control (MCPOC). 

Volume Areas: A structurally sound market will build on past areas of high volume. Should the market trend for long periods of time, it will lack sound structure (identified as a low volume area which denotes directional conviction and ought to offer support on any test). 

If participants were to auction and find acceptance into areas of prior low volume, then future discovery ought to be volatile and quick as participants look to areas of high volume for favorable entry or exit.

POCs: POCs are valuable as they denote areas where two-sided trade was most prevalent. Participants will respond to future tests of value as they offer favorable entry and exit.

Ledges: Flattened area on the profile which suggests responsive participants are in control, or initiative participants lack the confidence to continue the discovery process. The ledge will either hold and force participants to liquidate (cover) their positions, or crack and offer support (resistance).
Graphic: 65-minute profile chart of the Micro E-mini S&P 500 Futures updated 6:30 AM ET.

News And Analysis

Previous COVID preventing infection better than shot.

Critical battle for support as rates risk pivoting higher.

Tax clash testing unity over President Biden’s agenda.

China planning to ban U.S. IPOs for some tech firms.

Southwest to cut fall flights following a tough summer.

Soviet Union collapse turned Russia into powerhouse.

European speculative-grade defaults may fall to 3.5%.

What People Are Saying

About

After years of self-education, strategy development, and trial-and-error, Renato Leonard Capelj began trading full-time and founded Physik Invest to detail his methods, research, and performance in the markets. 

Additionally, Capelj is a finance and technology reporter. Some of his biggest works include interviews with leaders such as John Chambers, founder and CEO, JC2 Ventures, Kevin O’Leary, businessman and Shark Tank host, Catherine Wood, CEO and CIO, ARK Invest, among others.

Disclaimer

At this time, Physik Invest does not manage outside capital and is not licensed. In no way should the materials herein be construed as advice. Derivatives carry a substantial risk of loss. All content is for informational purposes only.

Categories
Commentary

Daily Brief For July 6, 2021

Market Commentary

Equity index futures sideways in overnight trade.

  • Commodities firm up. Oil is stretched.
  • Ahead: PMI, ISM, employment trends.
  • NDX firmed relative to SPX, RUT, DJI.

What Happened: U.S. stock index futures diverged overnight. 

Participants explored higher prices in both the S&P 500 and Nasdaq 100. The Dow Jones Industrial Average and Russell 2000 traded weak, within prior range. 

Today, participants will receive PMI, employment trend, and ISM non-manufacturing data. 

Graphic updated 7:05 AM ET.

What To Expect: Tuesday’s regular session (9:30 AM – 4:00 PM EST) in the S&P 500 will likely open just inside of prior-range and -value, suggesting a limited potential for immediate directional opportunity.

Adding, during the prior day’s regular trade, the best case outcome occurred, evidenced by initiative activity above the $4,311.50 high volume area (HVNode), up to $4,337.75, a Fibonacci-derived price target. 

Initiative Buying: Buying within or above the previous day’s value area.

Volume Areas: A structurally sound market will build on past areas of high volume. Should the market trend for long periods of time, it will lack sound structure (identified as a low volume area which denotes directional conviction and ought to offer support on any test). 

If participants were to auction and find acceptance into areas of prior low volume, then future discovery ought to be volatile and quick as participants look to areas of high volume for favorable entry or exit.

Sideways trade overnight comes after a rapid move higher on narrowing breadth and tapering volumes. 

Graphic: Breadth metrics from JPMorgan Chase & Co (NYSE: JPM), via The Market Ear.

With that, strategists at JPMorgan Chase & Co (NYSE: JPM) suggest stretched sentiment, positioning, and technical conditions have normalized with economic activity projected to stay significantly above trend. Goldman Sachs Group Inc (NYSE: GS) takes a bit of a less optimistic view; “Expectations of higher interest rates and higher corporate tax rates by year-end are the primary reasons we forecast that the S&P 500 will trade sideways during the next six months,” said David Kostin, chief US equity strategist for Goldman Sachs.

Goldman’s year-end price target for the S&P 500 sits at $4,300.00, a tad lower than where the index is today. To note, however, earnings estimates, the inventory positioning of participants, as well as early July seasonality metrics support the strong near-term performance.

Graphic: Earnings estimates from Jefferies, via The Market Ear

Given that big picture context, for today, participants can trade from the following frameworks. 

In the best case, the S&P 500 trades sideways or higher; activity above the $4,323.00 Point of Control (POC) puts in play the developing ledge at $4,348.25, an overnight high (ONH). Initiative trade beyond the ONH could reach as high as the $4,357.50 Fibonacci-derived price target.

POCs: POCs are valuable as they denote areas where two-sided trade was most prevalent. Participants will respond to future tests of value as they offer favorable entry and exit.

Overnight Rally Highs (Lows): Typically, there is a low historical probability associated with overnight rally-highs (lows) ending the upside (downside) discovery process.

Ledges: Flattened area on the profile which suggests responsive participants are in control, or initiative participants lack the confidence to continue the discovery process. The ledge will either hold and force participants to liquidate (cover) their positions, or crack and offer support (resistance).

In the worst case, the S&P 500 trades lower; activity below $4,323.00 puts in play the $4,299.00 POC. Initiative trade beyond the POC could reach as low as the $4,285.00 micro-composite POC and $4,263.25 low volume area (LVNode). 

Graphic: 65-minute profile chart of the Micro E-mini S&P 500 Futures.
Graphic: SHIFT search suggests participants were committing the most capital to call strikes at and below current prices in the cash-settled S&P 500 Index (INDEX: SPX) and Nasdaq 100 (INDEX: NDX), last week. This activity may denote (1) stock replacement, (2) hedges for underlying short positions, or (3) speculation on the upside. Also, there was a meaningful bid in longer-dated puts on the S&P 500 and Nasdaq 100. This dynamic suggests participants, despite their commitment to higher prices, are hedging against near-term risks, like the Jackson Hole Economic Symposium.

News And Analysis

Economy | Credit Conditions Q3 2021 – Reopening, Reflation, Reset. (S&P)

Markets | Stocks surge, comfort grows as the market fear gauge falls. (S&P)

Energy | Three scenarios for OPEC+, and the likely ones are bearish. (REU)

Markets | Chinese ride-hailing app Didi forced off of app stores in China. (REU)

COVID | Pfizer vaccine less effective against Delta variant, study finds. (FT)

Politics | Biden declares success in beating pandemic in July 4 speech. (BBG)

Politics | Global corporate tax overhaul faces rocky road to completion. (REU)

Markets | June jobs report was exactly what the markets wanted to get. (Axios)

What People Are Saying

Innovation And Emerging Trends

FinTech | Mortgage-focused startup Blend seeks $4B valuation in IPO. (REU)

FinTech | Turkish broker takes shot at financial titans with product focus. (BZ)

Economy | MMT economist on why China should boost fiscal spending. (BBG)

FinTech | Booking.com announces creation of new internal fintech unit. (Finextra)

M&A | JPMorgan’s big buying spree is Jamie Dimon’s busiest in years. (FT)

FinTech | Fidelity and BlackRock lead fintech startup’s $600M funding. (BBG)

Crypto | BIS finds that crypto investment doesn’t require special policy. (Block)

About

Renato founded Physik Invest after going through years of self-education, strategy development, and trial-and-error. His work reporting in the finance and technology space, interviewing leaders such as John Chambers, founder, and CEO, JC2 Ventures, Kevin O’Leary, businessman and Shark Tank host, Catherine Wood, CEO and CIO, ARK Invest, among others, afforded him the perspective and know-how very few come by.

Having worked in engineering and majored in economics, Renato is very detailed and analytical. His approach to the markets isn’t built on hope or guessing. Instead, he leverages the unique dynamics of time and volatility to efficiently act on opportunity.

Disclaimer

At this time, Physik Invest does not manage outside capital and is not licensed. In no way should the materials herein be construed as advice. Derivatives carry a substantial risk of loss. All content is for informational purposes only.

Categories
Results

Case Study: Trading A Balance-Breakout Failure In The Nasdaq 100

What Happened: On April 29, 2021, market participants attempted to move the Nasdaq 100 stock index from balance, an area of recent price acceptance, above a developing ledge, or flattened area on the composite volume profile.

Further, participants failed to find acceptance beyond the balance area, given the Nasdaq 100’s move back into the prior range. As a result, odds favored (1) sideways or (2) lower trade, as low as the balance area low (BAL) near $13,700.00.

Adding, a weak reaction by heavily-weighted index constituents to blowout earnings, as well as poor structure left behind prior price discovery, among other factors, such as the will to raise the Capital Gains Tax, suggested an increased potential to trade below the $13,700.00 BAL, into prior poor structures, or low volume areas (LVNodes), that ought to offer little-to-no support.

In response, the following sequence analysis unpacks how Physik Invest traded options tied to both the cash-settled Nasdaq 100 (INDEX: NDX) and Nasdaq 100 (CME: /NQ) future, leading up to the May 12, 2021 swing low. 

Note: Click here to view all transactions.

Sequence 1: On April 29, 2021, Physik Invest applied the balance-break and gap scenarios, monitoring for acceptance (i.e., more than 1-hour of trade) outside the balance area. 

To preface, gaps ought to fill quickly. 

Should they not, that’s a signal of weakness; leaving value behind on a gap-fill or failing to fill a gap (i.e., remaining outside of the prior session’s range) is a go-with indicator. 

Auctioning and spending at least 1-hour of trade back in the prior range suggests a lack of conviction.

After a confirmed balance-breakout failure, Physik Invest bought the following structures for a $203.00 debit. At this point, if all legs were to remain out of the money (i.e., expire worthless) by May 21, 2021, the maximum loss would have been $203.00, approximately 1/5 of a standard risk unit, or the debit risked in a typical position.

  • 13500+1/13300-2/13100+1 NDX long put ratio spread
  • 14100+3/14110-6/14140+3 NDX short call ratio spread
  • 14400-1 /NQ short call

By 5/10/2021, the aforementioned position was closed for a $1,855.00 credit, an 813.80% return on the initial debit outlay.

The above put-side structure was initiated against the $13,300 high volume area, also a prior balance area boundary. The reason being, a structurally sound market will build on past areas of high volume. Should the market trend for long periods of time, it will lack sound structure (identified as a low volume area which denotes directional conviction and ought to offer support on any test). If participants were to auction and find acceptance into areas of prior low volume, then future discovery ought to be volatile and quick as participants look to areas of high volume for favorable entry or exit.

Summary: After a failed balance-breakout setup presented itself, Physik Invest financed long put-side structures targeting a test of $13,300, with short-call exposure, risking ⅕ of a standard risk unit in debit, over a timeframe of one month.

In total, the sequence of trades net a $1,621.71 profit after commissions and fees.

The above strategies were employed in accordance with Physik Invest’s core edge: the trade of ratioed, multi-leg strategies that combine short and long positions to reduce risk and increase returns.

Yes, in hindsight, one could have opted for static short exposure (e.g., selling stock to open a position). However, the risks tied to such strategies are immense in a regime characterized by increased volatility and uncertainty.

By leveraging the dynamics of time and volatility, through complex spreads, unwanted directional risks were reduced.

Reflection: Hindsight is 20/20.

Though the entry was perfectly timed, the exit was not; 1-day prior to expiry, the 13500/13300/13100 ratio spread – which was removed for a $21.11 credit – priced at nearly $90.00. 

The correct move would have been to initiate the position with up to four 13500/13300/13100 ratio spreads. Thereafter, as prices moved lower, the position would have been pared down enough to at least cover the cost of any remaining spreads.

Those remaining spreads would have been kept on as so-called “lottery tickets.”

Categories
Commentary

Daily Brief For May 19, 2021

Market Commentary

Index futures in price discovery.

  • Light calendar – Fed speak, minutes.
  • Indices lower. Potential for response.

What Happened: U.S. stock index futures auctioned lower, overnight, alongside fears of inflation and a COVID-19 resurgence in some parts of the world.

Today’s calendar is rather light. Of interest is Fed-speak, ahead of the publication of April minutes.

Graphic updated 7:05 AM EST.

What To Expect: Wednesday’s regular session (9:30 AM – 4:00 PM EST) in the S&P 500 will likely open outside of prior -range and -value, suggesting a potential for immediate directional opportunity. 

Adding, during the prior day’s regular trade, after failing at the $4,177.25 developing ledge, the worst-case outcome occurred, evidenced by initiative trade below the $4,129.25 high volume area (HVNode), on an end-of-day spike.

Ledges: Flattened area on the profile which suggests responsive participants are in control, or initiative participants lack the confidence to continue the discovery process. The ledge will either hold and force participants to liquidate (cover) their positions, or crack and offer support (resistance).

Volume Areas: A structurally sound market will build on past areas of high volume. Should the market trend for long periods of time, it will lack sound structure (identified as a low volume area which denotes directional conviction and ought to offer support on any test). 

If participants were to auction and find acceptance into areas of prior low volume, then future discovery ought to be volatile and quick as participants look to areas of high volume for favorable entry or exit.

Spikes: Spike’s mark the beginning of a break from value. Spikes higher (lower) are validated by trade at or above (below) the spike base (i.e., the origin of the spike).

For today, participants can trade from the following frameworks. 

In the best case, the S&P 500 trades sideways or higher; activity above the $4,069.25 HVNode has the potential to trade up into the $4,122.25 HVNode. Initiative trade beyond the $4,122.25 HVNode could reach as high as the $4,134.00 spike base, a major pivot (i.e., above = bullish, below = neutral-to-bearish) for today’s trade.

In the worst case, the S&P 500 trades lower; activity below the $4,069.25 HVNode targets the LVNode boundary at $4,050.75. Auctioning past that boundary puts in play the poor structure at $4,015.00 and $4,001.00. Ultimately, in case of lower prices, participants would look for responsive buying to appear at and below the $3,970.75 price projection.

Graphic: 4-hour profile chart of the Micro E-mini S&P 500 Futures.
Graphic: SHIFT search suggests participants were most interested in longer-dated put strikes at and below current prices in the cash-settled S&P 500 Index (INDEX: SPX) and Nasdaq 100 Index (INDEX: NDX), May 18.

News And Analysis

Markets | Bitcoin plunges to $38,000 as Elon Musk-fueled rally collapses. (BBG)

Markets | The U.S. dollar is not crashing no matter what the banks say. (BBG)

Recovery | Fully vaccinated people could need a yearly COVID booster shot. (CNBC)

Economy | Yellen pushes higher taxes, stronger unions to the U.S. chamber. (CNBC)

Economy | U.K. inflation more than doubles as post-lockdown climb begins. (REU)

Economy | Biden tax proposal will most likely have a limited effect on ratings. (S&P)

Economy | European Union plans to open borders to vaccinated travelers. (Axios)

Energy | U.S. shale firms are limiting their outputs despite rising prices. (BBG)

Markets | High yield default rate is at its lowest rate since October 2019. (Forbes)

Economy | Construction starts pulled back in April due to supply problems. (MND)

What People Are Saying

Innovation And Emerging Trends

Markets | Biggest risk in markets has shifted; concerns over Fed inaction. (BBG)

FinTech | Global trading platform Stake adds $30M from Tiger, DST Global. (BZ)

FinTech | Secfi secures investment for its stock option financing platform. (BZ)

Energy | Paper company wants to make a wooden rival to car batteries. (BBG)

Trading | Fidelity’s pitch to America’s teens: no-fee brokerage accounts. (WSJ)

About

Renato founded Physik Invest after going through years of self-education, strategy development, and trial-and-error. His work reporting in the finance and technology space, interviewing leaders such as John Chambers, founder, and CEO, JC2 Ventures, Kevin O’Leary, businessman and Shark Tank host, Catherine Wood, CEO and CIO, ARK Invest, among others, afforded him the perspective and know-how very few come by.

Having worked in engineering and majored in economics, Renato is very detailed and analytical. His approach to the markets isn’t built on hope or guessing. Instead, he leverages the unique dynamics of time and volatility to efficiently act on opportunity.

Disclaimer

At this time, Physik Invest does not manage outside capital and is not licensed. In no way should the materials herein be construed as advice. Derivatives carry a substantial risk of loss. All content is for informational purposes only.