
The Daily Brief is a free glimpse into the prevailing fundamental and technical drivers of U.S. equity market products. Join the 200+ that read this report daily, below!
What Happened
Overnight, index and commodity futures were bid while yields and the Cboe Volatility Index (INDEX: VIX) came in, little.
In the news was continued crypto market turmoil. The TerraUSD stablecoin maintained its break with the U.S. dollar, trading as low as ~0.25. Shanghai reported a drop in new COVID-19 cases.
Key, today, is data on consumer prices (8:30 AM ET). If Wednesday’s print shows price pressures continuing to mount, traders will put more weight on the potential for larger hikes.
Later, is some Fed speak (12:00 PM ET) and federal budget updates (2:00 PM ET).
What To Expect
Fundamental: Shortened commentary, today.
Participants expect inflation to have peaked. This would be confirmed by the annual CPI printing 8.1%, down from 8.5% in March.
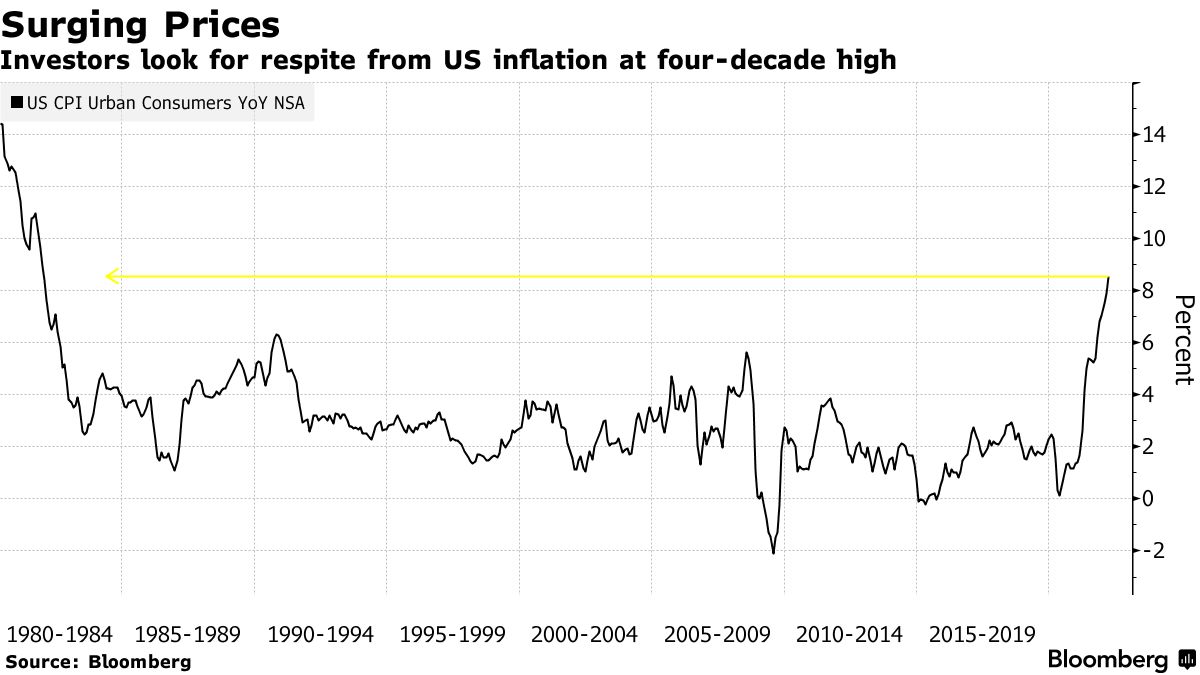
“Perhaps the tightest questions will concern core inflation (excluding food and fuel, which continue to be roiled by the situation in Ukraine),” says Bloomberg’s John Authers.
“Now, if the economists polled by Bloomberg are correct, core month-on-month inflation is going to rise a bit. That does not help the narrative that the peak is in. If this particular number comes in below expectations, we can expect that to be taken very, very positively on the markets.”
Positioning: Participants are most concerned and hedging against aggressive monetary policy action and economic chokepoints.
Investors will get clarity on some of these issues in the coming sessions.
Barring a worst-case scenario, if markets do not perform to the downside (i.e., do not trade lower), those highly-priced (often very short-dated) bets on direction will continue to decay (i.e., removal of event premiums).
Accordingly, hedging flows with respect to time and volatility may, then, bolster sharp rallies.
The alternative is that participants’ fears for whatever matter are not assuaged. In case of an imbalance, demand for protection may kick off a repricing of volatility, particularly that which is further away from current prices (i.e., skew), depressed by strong supply.
Whether any price rise kicks off a sustained reversal depends on what the fundamental situation is, then.
Presently, some of the largest index constituents (e.g., Apple Inc [NASDAQ: AAPL]) are starting to succumb to the fundamental situation, if we will, and that may feed into the indexes which are pinned due to passive and hedging flows.
In other words, fundamentals will trump this talk of positioning (i.e., it is only in the short-term does this positioning we’ve talked about have greater implications).
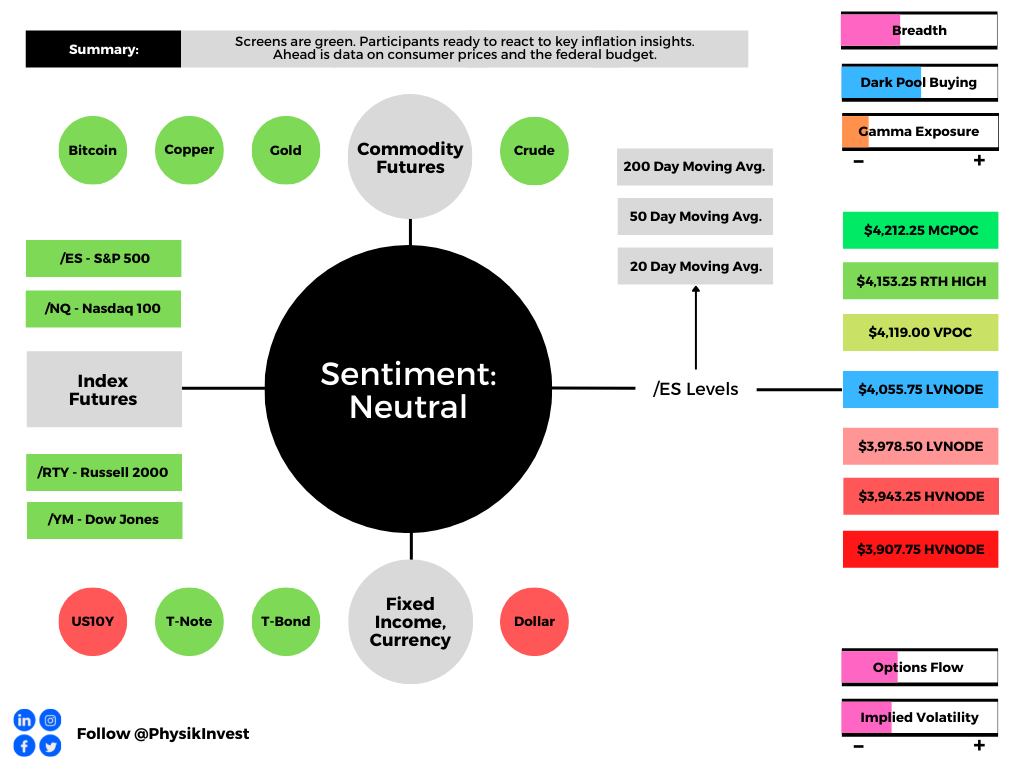
Technical: As of 6:30 AM ET, Wednesday’s regular session (9:30 AM – 4:00 PM ET), in the S&P 500, will likely open in the upper part of a positively skewed overnight inventory, inside of prior-range and -value, suggesting a limited potential for immediate directional opportunity.
In the best case, the S&P 500 trades higher; activity above the $4,055.75 low volume node (LVNode) puts into play the $4,119.00 untested point of control (VPOC). Initiative trade beyond the VPOC could reach as high as the $4,153.25 regular trade high (RTH High) and $4,212.25 micro composite point of control (VPOC), or higher.
In the worst case, the S&P 500 trades lower; activity below the $4,055.75 LVNode puts into play the $3,978.50 LVNode. Initiative trade beyond the $3,978.50 LVNode could reach as low as the $3,943.25 and $3,907.75 high volume areas (HVNode), or lower.
Click here to load today’s key levels into the web-based TradingView charting platform. Note that all levels are derived using the 65-minute timeframe. New links are produced, daily.

Definitions
Volume Areas: A structurally sound market will build on areas of high volume (HVNodes). Should the market trend for long periods of time, it will lack sound structure, identified as low volume areas (LVNodes). LVNodes denote directional conviction and ought to offer support on any test.
If participants were to auction and find acceptance into areas of prior low volume (LVNodes), then future discovery ought to be volatile and quick as participants look to HVNodes for favorable entry or exit.
POCs: POCs are valuable as they denote areas where two-sided trade was most prevalent in a prior day session. Participants will respond to future tests of value as they offer favorable entry and exit.
MCPOCs: POCs are valuable as they denote areas where two-sided trade was most prevalent over numerous day sessions. Participants will respond to future tests of value as they offer favorable entry and exit.
Volume-Weighted Average Prices (VWAPs): A metric highly regarded by chief investment officers, among other participants, for quality of trade. Additionally, liquidity algorithms are benchmarked and programmed to buy and sell around VWAPs.
About
After years of self-education, strategy development, mentorship, and trial-and-error, Renato Leonard Capelj began trading full-time and founded Physik Invest to detail his methods, research, and performance in the markets.
Capelj also develops insights around impactful options market dynamics at SpotGamma and is a Benzinga reporter.
Some of his works include conversations with ARK Invest’s Catherine Wood, investors Kevin O’Leary and John Chambers, FTX’s Sam Bankman-Fried, Kai Volatility’s Cem Karsan, The Ambrus Group’s Kris Sidial, among many others.
Disclaimer
In no way should the materials herein be construed as advice. Derivatives carry a substantial risk of loss. All content is for informational purposes only.


One reply on “Daily Brief For May 11, 2022”
[…] In Wednesday’s morning letter, we talked about the expectations for annual inflation to have peaked and month-on-month inflation […]