Categories
Commentary

Daily Brief For April 18, 2023

LOAD LEVELS ON TRADINGVIEW BY CLICKING HERE.

Bank of America Corporation (NYSE: BAC) sees allocations to equities versus bonds falling. That’s amid recession fears. Per EPB, “the cyclical economy has just started to shed jobs today, and leading indicators signal the recession is likely underway.”

“To get advanced warning of recessions, you must look at the construction and manufacturing sectors, even though these two sectors are only 13% of the labor market,” EPB adds, noting traditional indicators’ weakening predictability is not so great to ignore the insight. “It’s clear that the composition of traditional leading indicators remains appropriate, and thus, the current resounding recessionary signal should not be ignored.”

BAC strategist Michael Hartnett said, though, that this “consensus lust for recession” must soon be satisfied. Otherwise, the “pain trade” would be even higher yields and stocks; the S&P 500 (INDEX: SPX) is enjoying an accelerated rally which Jefferies Financial Group (NYSE: JEF) strategists think portends a period of flatness, now, over the coming weeks …
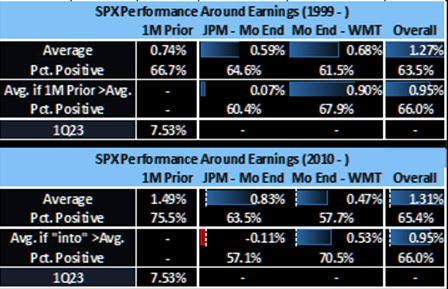
Graphic: Retrieved from Jefferies Financial Group (NYSE: JEF) via The Market Ear.

… and through options expiration (OpEx), typically a poor performance period for the SPX.
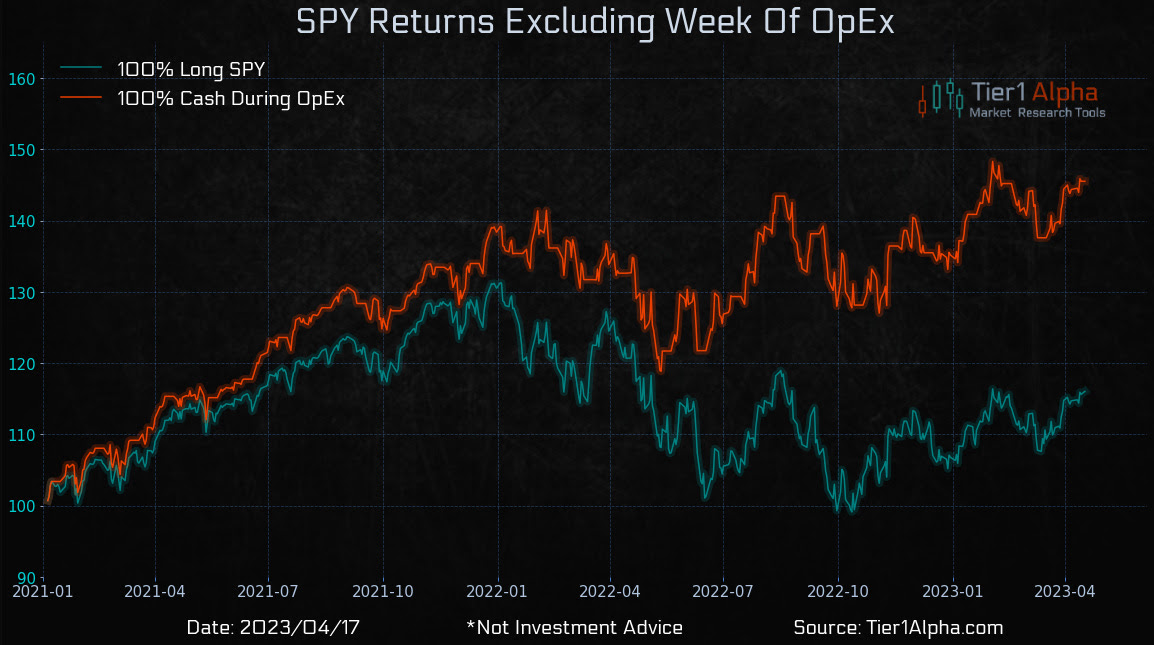
Displaying
Graphic: Retrieved from Tier1Alpha. 

Beyond the uninspiring fundamentals, the positioning contexts are supportive. Recall our letters published earlier this year. If the market consolidated and failed to break substantially, then falling implied volatility (IVOL) and time passing would bolster markets and, potentially, help build a platform for a rally into mid-year. A check of fixed-strike and top-line measures of IVOL like the Cboe Volatility Index or VIX confirms options activities are keeping markets intact.
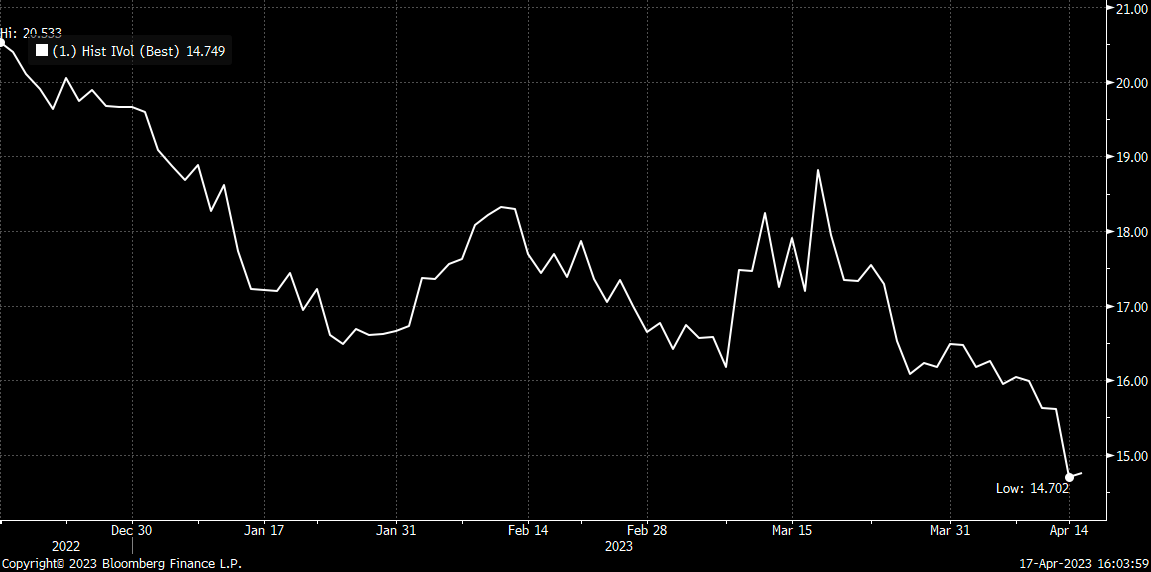
Graphic: Retrieved from Danny Kirsch of Piper Sandler (NYSE: PIPR). “SPX May $4,150.00 call volatility, the lack of realized volatility weighing on the market. Volatility low, not cheap.”

Beyond the rotation into shorter-dated options, just one of the factors exacerbating the decimation of longer-dated volatility, traders’ consensus is that markets won’t move a lot and/or they don’t need to hedge over longer time horizons; traders want punchier exposure to realized volatility (RVOL), and that they can get through shorter-dated options that have more gamma (i.e., exposure to changes in movement), not vega (i.e., exposure to changes in implied volatility).

Graphic: Retrieved from Goldman Sachs Group Inc (NYSE: GS) via Bloomberg.

Consequently, counterparties may be less dangerous to accelerating movement in either direction; hence, the growing likelihood of a period of flatness.
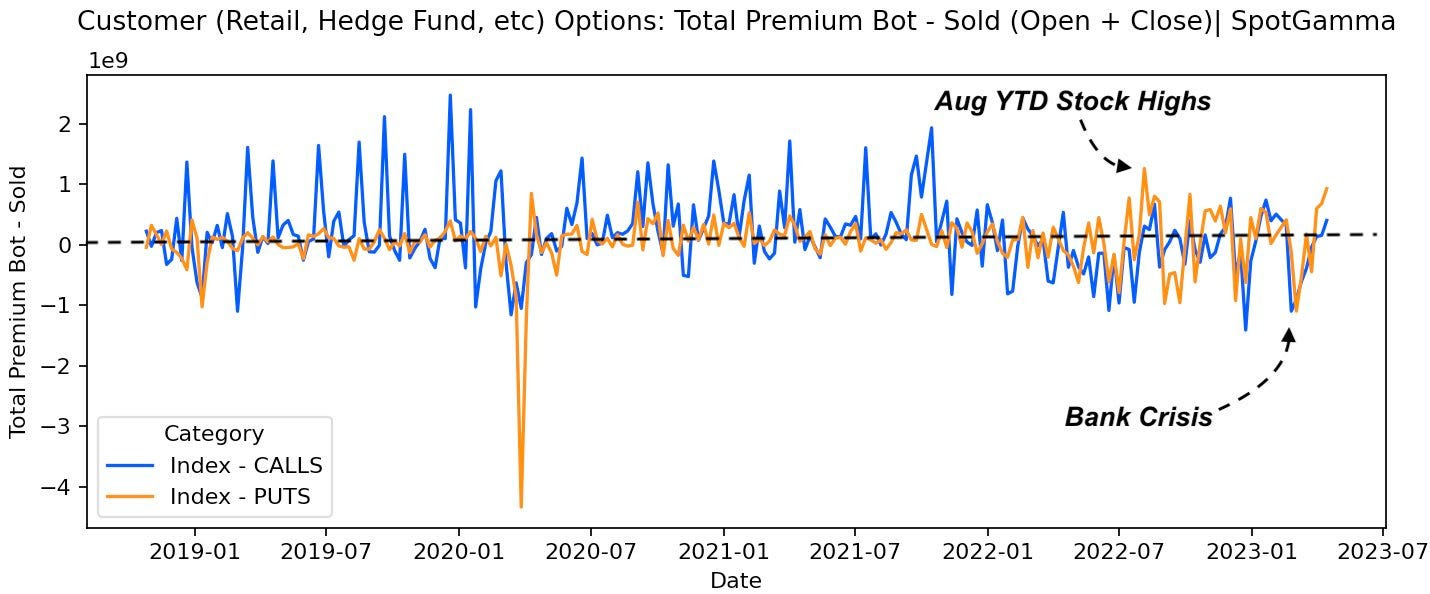
Graphic: Retrieved from SpotGamma.

“Despite the collapse in the 1-month realized volatility, we suspect most vol control funds have scaled into using their longer-term realized vols, which by design, lead to less aggressive rebalancing flows,” Tier1Alpha says. “For example, the 3-month rVol, which is currently driving our model, was essentially unchanged yesterday, which means volatility targets were maintained, and very little additional rebalancing had to occur. So even with the decline in the 1-month vol, overall risk exposure remained the same.”

With IVOL at a lower bound, the bullish impacts yielded by its compressing have largely played out. There may be more to be gained by movements higher in IVOL, in addition to the expiry of many call options this OpEx. By owning protection, particularly far from current prices, you are positioned to monetize on the market downside and non-linear repricings of volatility, as this letter has discussed in recent history. The caveat is that volatility can cluster and revert for longer; hence, your structure matters.

“I am concerned that VIX is underpricing the series of events that we know to expect over the coming weeks,” says Interactive Brokers Group Inc’s (NASDAQ: IBKR) Steve Sosnick. “While there is now an 88% implied likelihood of a 25 basis point hike, the likely path of any potential future hikes and assumed cuts should be more clarified at the meeting and in its aftermath.  And oh, has anyone ever heard the expression “sell in May and go away?”
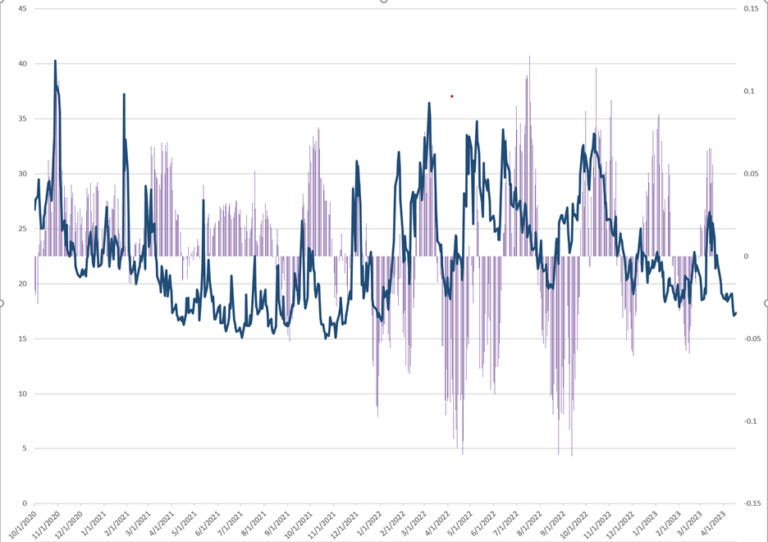
Graphic: Retrieved from Interactive Brokers Group Inc (NASDAQ: IBKR).

With call skews far up meaningfully steep in some products, still-present low- and zero-cost call structures this letter has talked about in the past remain attractive. If the market falls apart, your costs are low, and losses are minimal. If markets move higher into a “more combustible” position, wherein “volatility is sticky into a rally,” you may monetize your call structures and roll some of those profits into bear put spreads (i.e., buy put and sell another at a lower strike). An alternative option is neutral. Own something such as a T-bill or box spread (i.e., buy call and sell put at one strike and sell call and buy put at another higher strike). Some boxes are yielding upwards of 5.4% as of yesterday’s close.

To end, though the short-dated options activity may prompt cascading events in market downturns, the main issue is the reduced use of longer-dated options; a supply and demand imbalance likely resolves itself with an implied volatility repricing of a great size where longer-dated options outperform those that are shorter-dated.

Our locking in of rates or using the profits of call structures to position for a potential IVOL repricing, particularly in the back half of the year when dealer positioning is less clear, buybacks are to fall off of a cliff, rates may fall, and the boost from short-covering has played its course, is an attractive proposition given the context.
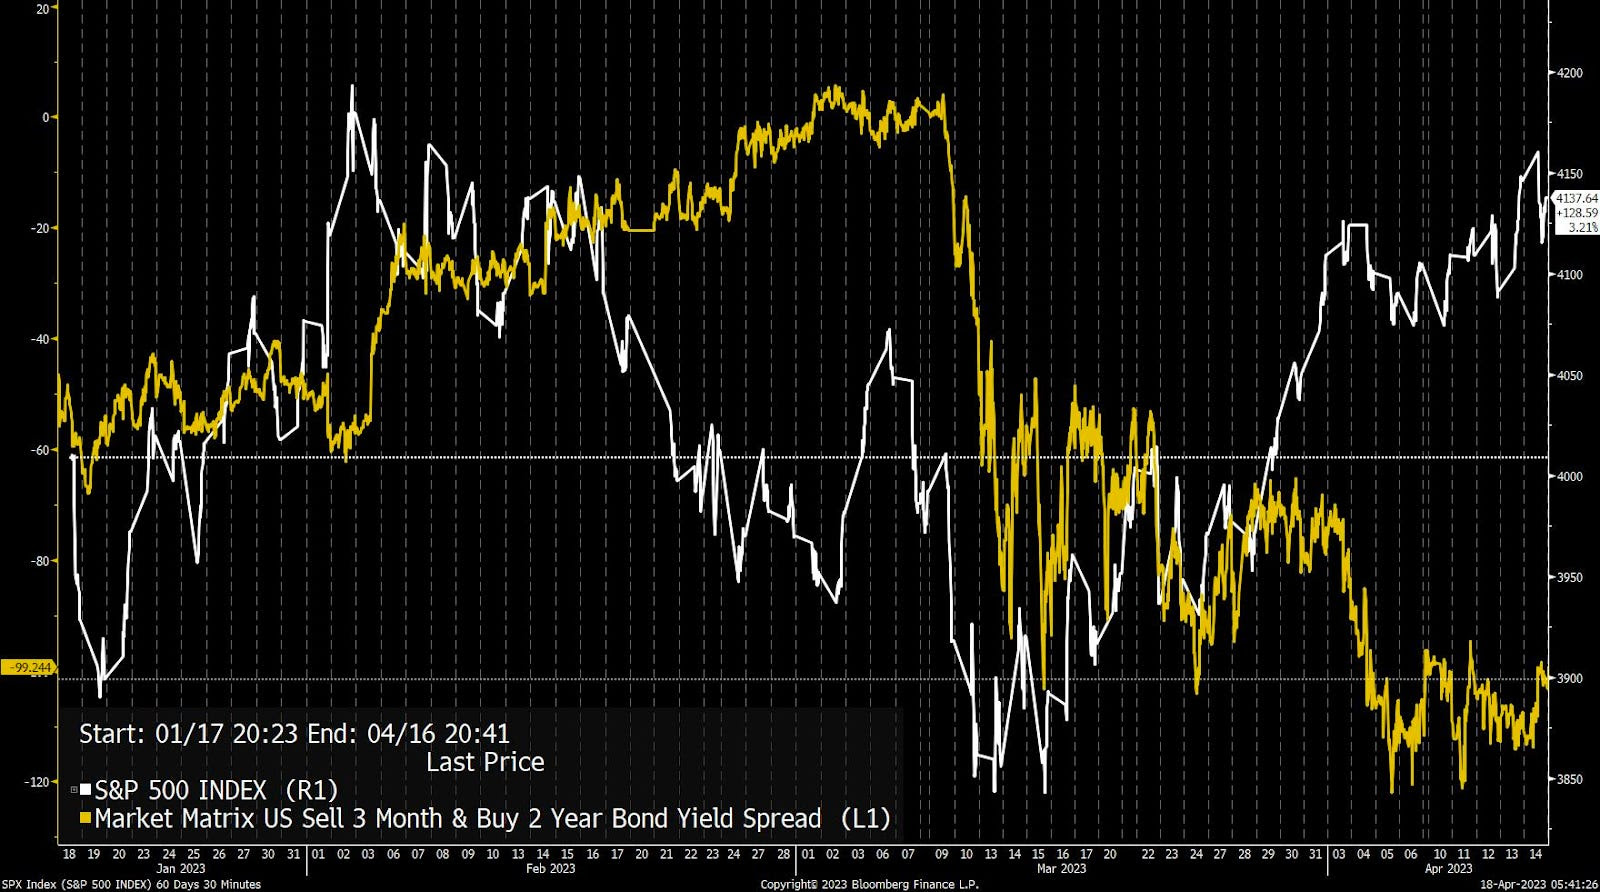
Graphic: Retrieved from Bloomberg. “The S&P 500 (white line) is well above its levels from early March, while the yield on the 3m-2y spread remains in a deep inversion, signifying meaningful expectations of cuts in the months ahead.”

About

Welcome to the Daily Brief by Physik Invest, a soon-to-launch research, consulting, trading, and asset management solutions provider. Learn about our origin story here, and consider subscribing for daily updates on the critical contexts that could lend to future market movement.

Separately, please don’t use this free letter as advice; all content is for informational purposes, and derivatives carry a substantial risk of loss. At this time, Capelj and Physik Invest, non-professional advisors, will never solicit others for capital or collect fees and disbursements. Separately, you may view this letter’s content calendar at this link.
Categories
Commentary

Daily Brief For March 17, 2023

Physik Invest’s Daily Brief is read free by thousands of subscribers. Join this community to learn about the fundamental and technical drivers of markets.

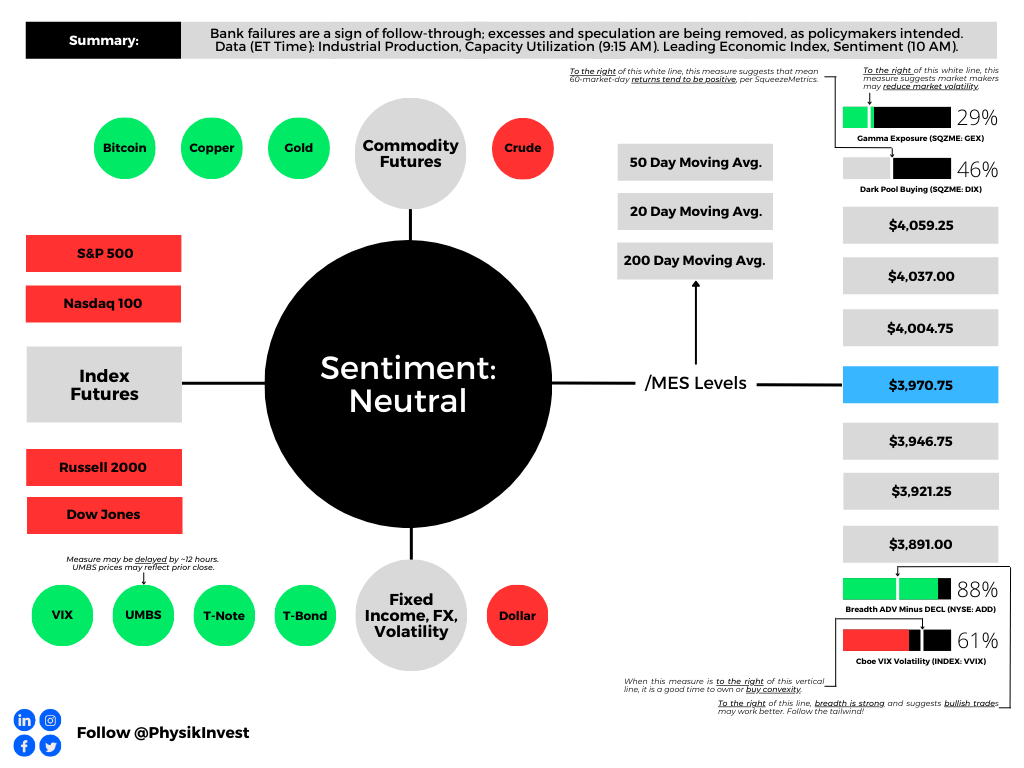
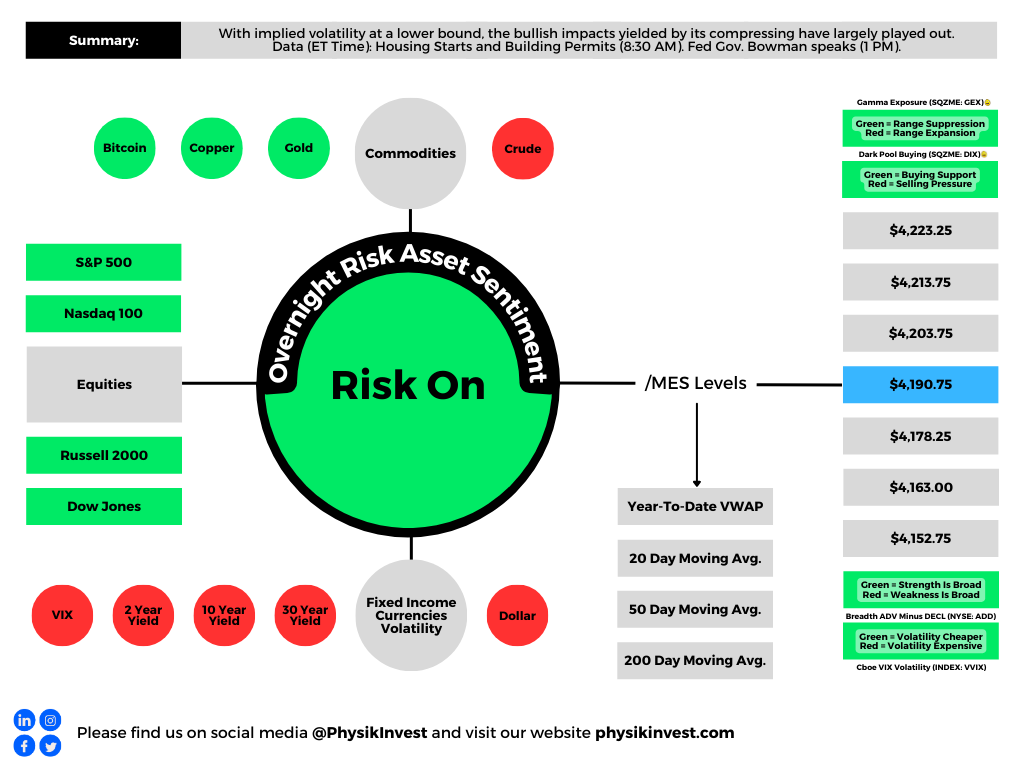
Graphic updated 8:50 AM ET. Sentiment Neutral if expected /MES open is inside of the prior day’s range. /MES levels are derived from the profile graphic at the bottom of this letter. Click here for the latest levels. SqueezeMetrics Dark Pool Index (DIX) and Gamma (GEX) with the latter calculated based on where the prior day’s reading falls with respect to the MAX and MIN of all occurrences available. A higher DIX is bullish. The lower the GEX, the more (expected) volatility. Click to learn the implications of volatility, direction, and moneyness. Breadth reflects a reading of the prior day’s NYSE Advance/Decline indicator. The CBOE VIX Volatility Index (INDEX: VVIX) reflects the attractiveness of owning volatility. UMBS prices via MNDClick here for the economic calendar.

Fundamental

Higher asset prices boosted household wealth and demand; consumers’ increased ability to spend more wealth pushed up inflation. If policymakers use their tools to lower household wealth and demand, this should cut down on inflation.

Kai Volatility’s Cem Karsan says the latter was a policy objective and recent financial institution failures are a sign of follow-through; excesses and speculation are being removed, as policymakers desired.

Policymakers don’t want liquidations, however. They want lower asset prices. Recent events put policymakers in an odd position after raising rates non-stop. In the Federal Reserve’s (Fed) case, and we paraphrase Karsan, policy/rates moved very quickly with little pause. With there being a lag, the Fed may want to pause and assess. However, they have to telegraph this carefully so that the market does not read it as a pivot. If the market rallies, that “makes things hotter,” Karsan says.

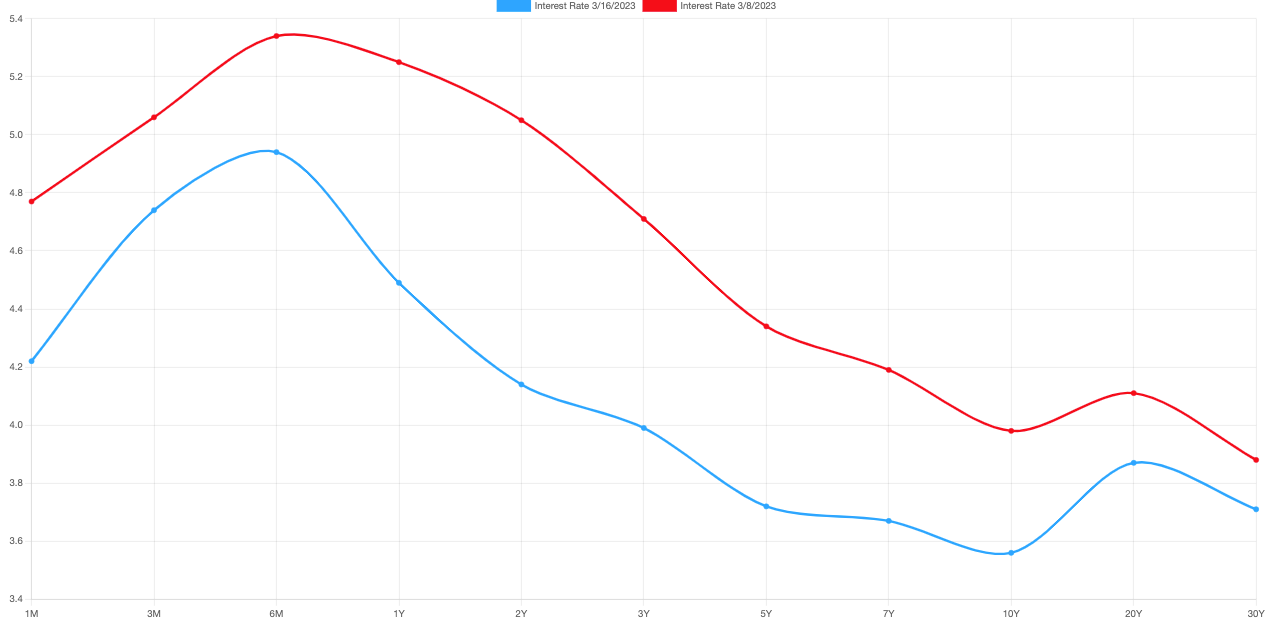
There’s already been an overreaction in the bond market, he adds, which is not ideal. The Fed does not want the long end of the yield curve to fall, as it has on the back of the turmoil and intervention, as well as data including housing starts which show more supply coming onto the market, likely a mortgage application booster in the near term.

Graphic: Retrieved from USTreasuryYieldCurve.com.

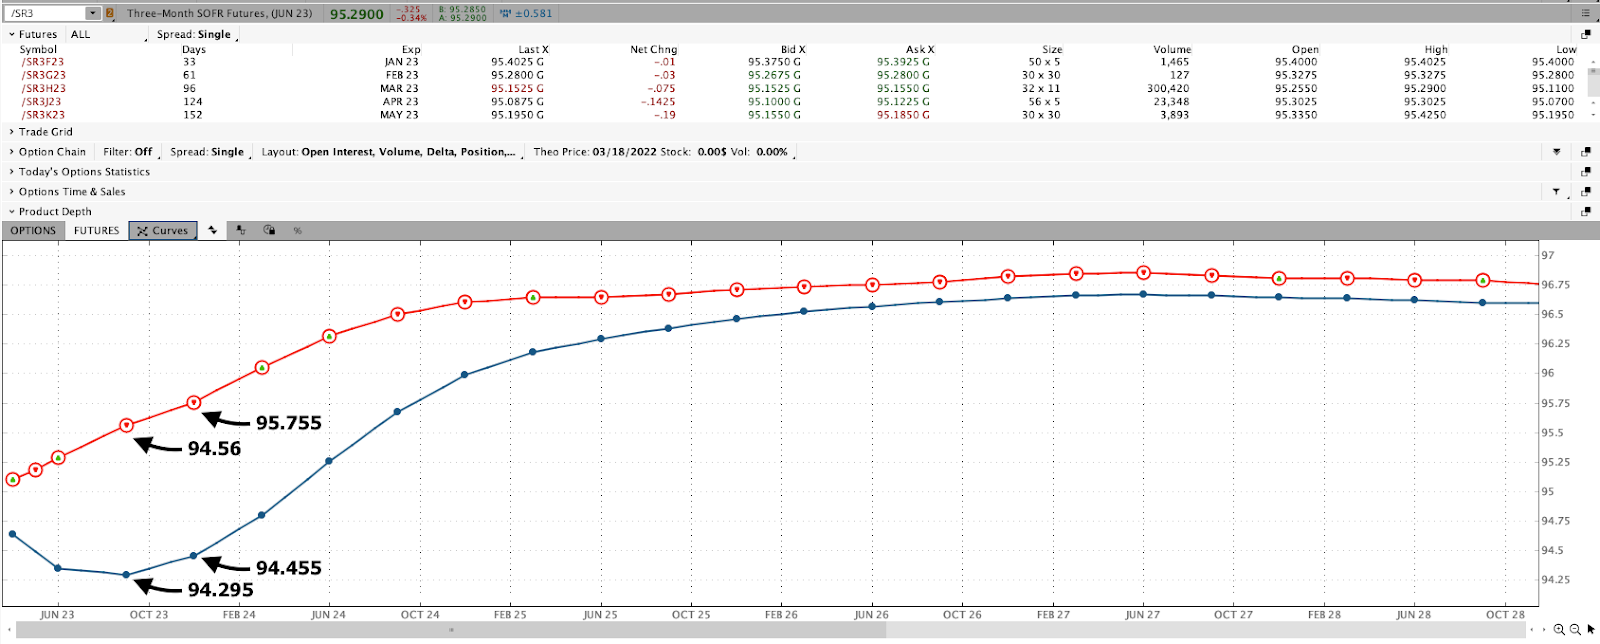
Even at the front end, there’s been lots of movement. This has “forc[ed] widespread risk liquidation,” Bloomberg says. Take a look at the Three-Month SOFR (FUTURE: /SR3), a tool used to hedge USD short-term interest rates.

Graphic: Retrieved from Charles Schwab Corporation-owned (NYSE: SCHW) TD Ameritrade’s thinkorswim platform.

The consensus, which Karsan agrees with, is that the Fed moves forward with a 25 basis point hike while telegraphing it wants the long end of the curve to rise or higher for longer as it is colloquially referred to.

Graphic: Retrieved from CME Group Inc’s (NASDAQ: CME) FedWatch Tool.

It is possible for the US policymakers to adopt a meeting-by-meeting stance, as their counterparts have in Europe, letting uncertainties regarding the likes of Credit Suisse Group AG (which just received a ~$54 billion or so liquidity backstop and is mulling a combination with other lenders), SVB Financial Group (NASDAQ: SVB) and First Republic Bank (NYSE: FRC) pan out.

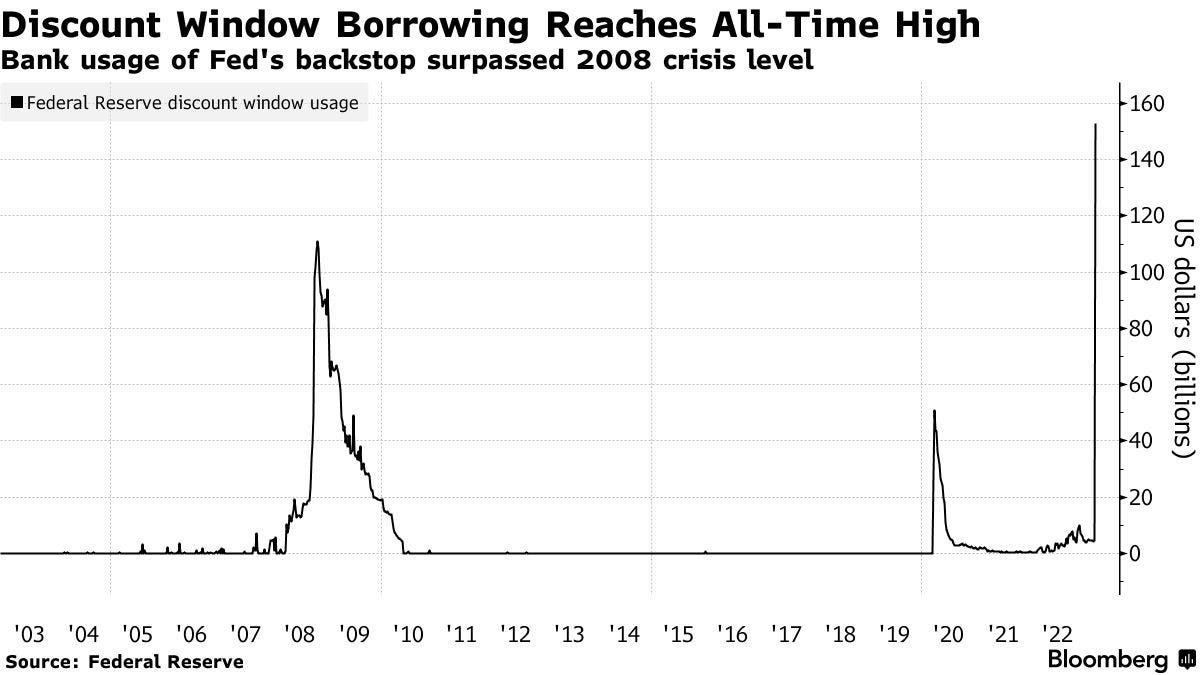
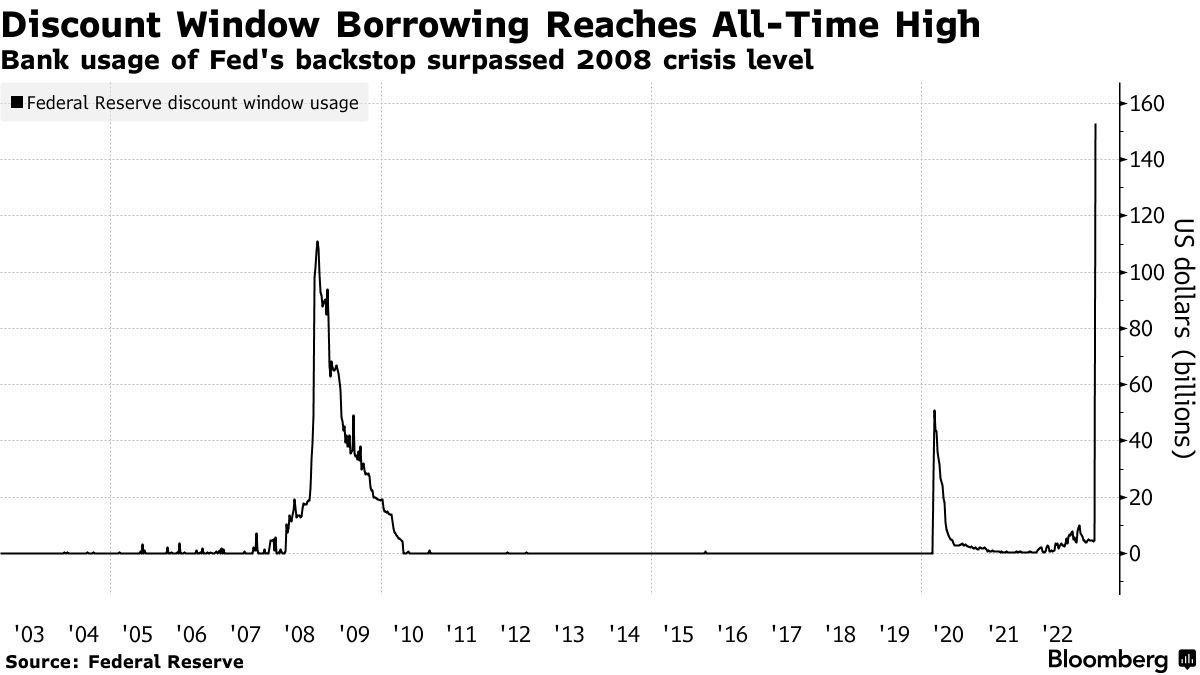
Graphic: Retrieved from Bloomberg. “[T]he credit extended through the two backstops show a banking system that is still fragile and dealing with deposit migration in the wake of the failure of Silicon Valley Bank of California and Signature Bank of New York last week.” Per John Authers: the phenomenal borrowing from the Fed’s discount window suggests that if these are just liquidity problems, they are widespread and serious. Further, the point of the exercise is to slow down the economy, which will in time tend to put pressure on banks’ solvency.”

Pausing, or intending to pause explicitly, could raise inflation expectations or “boost the odds of a recession by spooking consumers and companies into believing that the economy is worse off than they thought,” Bloomberg explainsnoting: “All told, the emergency loans reversed around half of the balance-sheet shrinkage that the Fed has achieved since it began so-called quantitative tightening — allowing its portfolio of assets to run down — in June last year.”

Graphic: Compiled by Physik Invest. Per Jefferies Financial Group Inc’s (NYSE: JEF) Christopher Wood: “2022 was the year when US equities suffered multiple contraction from monetary tightening. This year will be the year when earnings downgrades hit the stock market if the US recession forecast proves to be accurate. This is now the key issue in world financial markets. Then 2024 will be the year when markets will have to deal with the emerging credit problems in the private space.”

Positioning

Heading into this most recent market decline, investors foresaw increased volatility and were positioned for it as indicated by the pricing of tail risk and performance of implied volatility or IVOL (as investors continued to demand protection during this window of non-strength), said Laya Royer of Citadel Securities.

Recall that Kris Sidial warned us of this. Options, colloquially referred to as volatility, would serve as the only hedge in an environment wherein commodities, stocks, and bonds don’t combine or balance each other as well as they did in 2022.

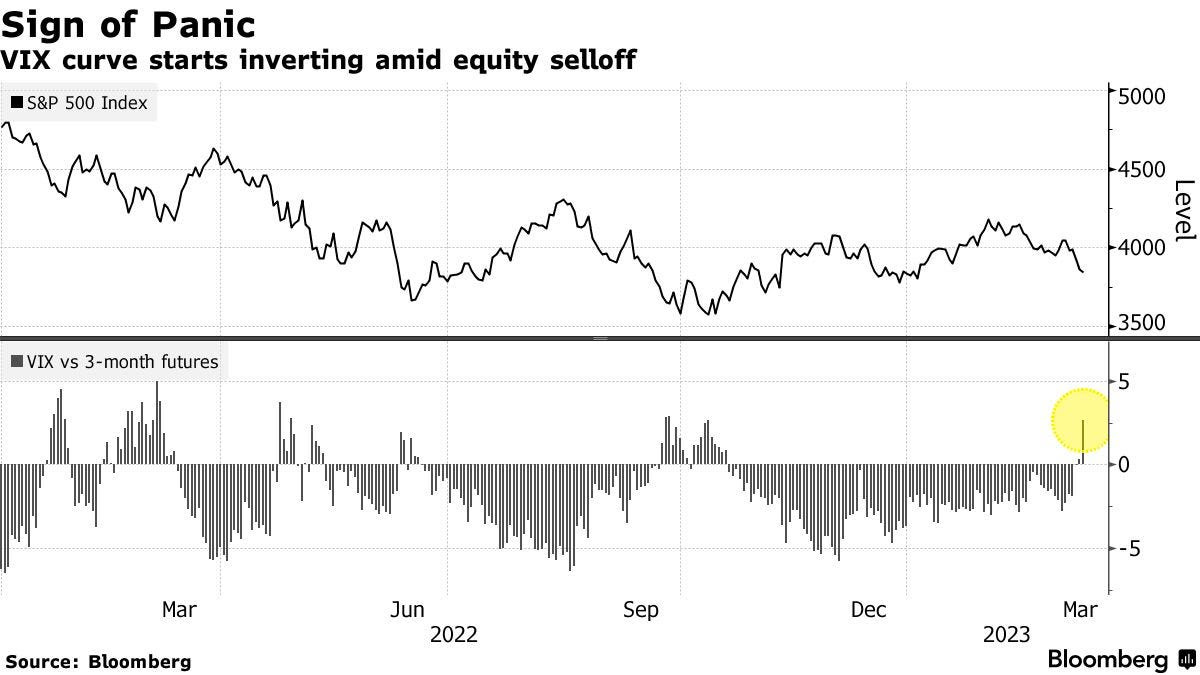
Graphic: Retrieved from Bloomberg.

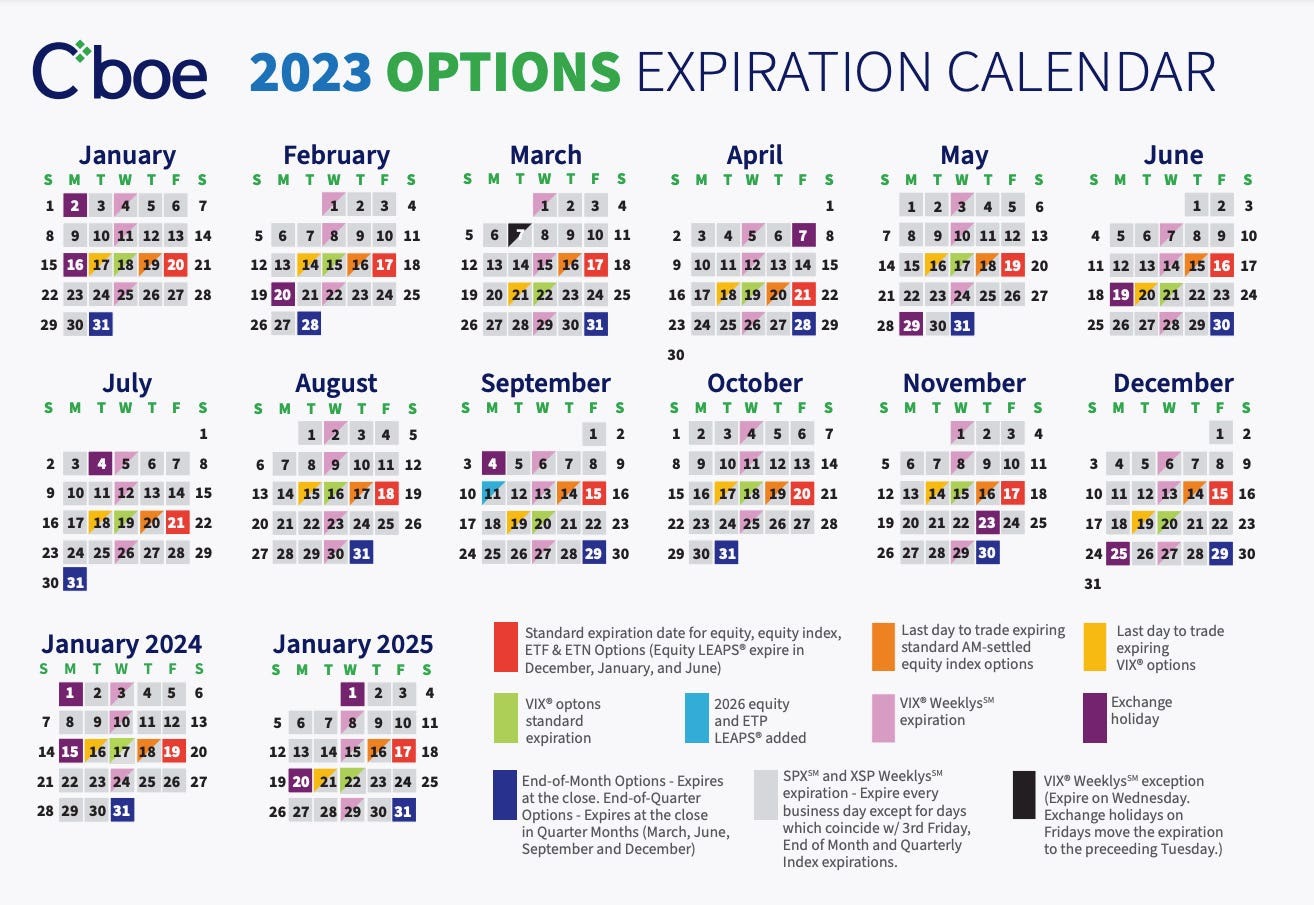
Now, there are options expirations (OpEx) nearing (March 16 and 31); monetization of profitable options structures, as well as volatility compression and options decay, have counterparties buying back their short stock and/or futures hedges (to the short put positions they have on), boosting the market (particularly the depressed and rate-sensitive Nasdaq 100) through this OpEx/triple witching window.

Graphic: Retrieved from Cboe Global Markets (BATS: CBOE).

Following this period, the “rollover” of existing positions may result in “price swings” that last, Bloomberg puts forth. “This quarterly expiry may help unpin the market.”

Structures proposed in the Daily Brief for March 14 may work in reducing portfolio downside while allowing you to participate directionally at less cost.

Technical

As of 8:50 AM ET, Friday’s regular session (9:30 AM – 4:00 PM ET), in the S&P 500, is likely to open in the lower part of a negatively skewed overnight inventory, inside of the prior day’s range, suggesting a limited potential for immediate directional opportunity.

The S&P 500 pivot for today is $3,970.75. 

Key levels to the upside include $4,004.75, $4,037.00, and $4,059.25.

Key levels to the downside include $3,946.75, $3,921.25, and $3,891.00.

Disclaimer: Click here to load the updated key levels via the web-based TradingView platform. New links are produced daily. Quoted levels likely hold barring an exogenous development.

Graphic: 65-minute profile chart of the Micro E-mini S&P 500 (FUTURE: /MES) at the middle bottom.

Definitions

Volume Areas: Markets will build on areas of high-volume (HVNodes). Should the market trend for a period of time, this will be identified by a low-volume area (LVNodes). The LVNodes denote directional conviction and ought to offer support on any test.

If participants auction and find acceptance in an area of a prior LVNode, then future discovery ought to be volatile and quick as participants look to the nearest HVNodes for more favorable entry or exit.

POCs: Areas where two-sided trade was most prevalent in a prior day session. Participants will respond to future tests of value as they offer favorable entry and exit.


About

The author, Renato Leonard Capelj, spends the bulk of his time at Physik Invest, an entity through which he invests and publishes free daily analyses to thousands of subscribers. The analyses offer him and his subscribers a way to stay on the right side of the market. 

Separately, Capelj is an accredited journalist with past works including interviews with investor Kevin O’Leary, ARK Invest’s Catherine Wood, FTX’s Sam Bankman-Fried, North Dakota Governor Doug Burgum, Lithuania’s Minister of Economy and Innovation Aušrinė Armonaitė, former Cisco chairman and CEO John Chambers, and persons at the Clinton Global Initiative.

Connect

Direct queries to renato@physikinvest.com. Find Physik Invest on TwitterLinkedInFacebook, and Instagram. Find Capelj on TwitterLinkedIn, and Instagram. Only follow the verified profiles.

Calendar

You may view this letter’s content calendar at this link.
Disclaimer

Do not construe this newsletter as advice. All content is for informational purposes. Capelj and Physik Invest manage their own capital and will not solicit others for it.

Categories
Commentary

Daily Brief For August 18, 2022

The daily brief is a free glimpse into the prevailing fundamental and technical drivers of U.S. equity market products. Join the 800+ that read this report daily, below!

Graphic updated 7:20 AM ET. Sentiment Neutral if expected /ES open is inside of the prior day’s range. /ES levels are derived from the profile graphic at the bottom of the following section. Levels may have changed since initially quoted; click here for the latest levels. SqueezeMetrics Dark Pool Index (DIX) and Gamma (GEX) calculations are based on where the prior day’s reading falls with respect to the MAX and MIN of all occurrences available. A higher DIX is bullish. At the same time, the lower the GEX, the more (expected) volatility. Learn the implications of volatility, direction, and moneyness. Breadth reflects a reading of the prior day’s NYSE Advance/Decline indicator. VIX reflects a current reading of the CBOE Volatility Index (INDEX: VIX) from 0-100.
Hey team – the Daily Brief will be paused until August 29, at least, due to Renato’s travel commitments. 

Apologies and thank you for the support!

Positioning

As of 7:20 AM ET, Thursday’s expected volatility, via the Cboe Volatility Index (INDEX: VIX), sits at ~1.05%. Net Gamma exposures (generally) rising may promote tighter trading ranges.

Graphic: Via Physik Invest. Data retrieved from SqueezeMetrics.

As an aside, real quick, in a rising market, characterized by demand for call options, those who are on the other side of options trades, hedge in a manner that may bolster the upside (i.e., the naive theory is that if customers buy calls, then counterparties sell calls + buy stock to hedge).

That said, if IVOL drops, liquidity providers’ out-of-the-money (in-the-money) Delta exposures drop (rise) and, thus, they will sell (buy) underlying hedges which may pressure (support) the advance or play into pinning action, as seen over the past week or so at the $4,300.00 options strike, at which there is a lot of open interest and volume, in the S&P 500.

Read: The Implied Order Book by SqueezeMetrics for a sort-of detailed primer on this.

Graphic: Updated 8/15/2022. Retrieved from SqueezeMetrics.

Given realized (RVOL) and implied (IVOL) volatility measures, as well as skew, it is beneficial to be a buyer of options structures to protect against (potential) downside (e.g., S&P 500 [INDEX: SPX] +1 x -2 Short Ratio Put Spread | 200+ Points Wide | 15-30 DTE | @ $0.00 or better).

This is not to say that call options, which we said could “outperform” their Delta (i.e., exposure to direction) weeks ago, are out of favor (note: this is the case for something such as an SPX, not a Bed Bath & Beyond Inc [NASDAQ: BBBY]).

Graphic: Retrieved from Corey Hoffstein. Via Goldman Sachs Group Inc (NYSE: GS).

No! On the contrary, Goldman Sachs Group Inc (NYSE: GS) strategists say “call premiums are attractive.” This is “evidenced by [their] GS-EQMOVE model which estimates 33% probability of a 1-month 5% up-move versus only 13% implied by the options market.”

A quick check of implied volatility skew, which is a plot of the implied volatility levels for options across different strike prices, shows a smile in the shortest of tenors, rather than a usual smirk.

Graphic: Retrieved from Cboe Global Markets Inc (BATS: CBOE).

Given this, the options with strike prices above current market prices are seemingly more pricey than those that have more time to expiration. One could think about structuring something like a Short Ratio Call Spread or, even, a Long Call Calendar Spread at or above current prices. 

In the latter, any sideways-to-higher movement would allow for that spread to expand for profit.

Graphic: Via Banco Santander SA (NYSE: SAN) research, the return profile, at expiry, of a classic 1×2 (long 1, short 2 further away) ratio spread.

Context: Participants’ proactive hedging of positive Delta equity exposure, via negative Delta put option exposures, as well as the monetization of those hedges into the decline, resulted in poor performance in IVOL metrics like the Cboe Volatility Index (INDEX: VIX).

Therefore, per the Cboe, it’s the case that “since the launch of the VIX Index, the past six-month period has been the weakest for volatility in 29 years, relative to similar [SPX] price moves.”

Accordingly, its structures we thought would work best, given the potential for measured selling, which others thought would carry a lot of risks, such as Short Ratio Put Spreads, that performed best, seen below.

Graphic: Via Pat Hennessy. “[T]he performance of short-dated 1×2 put ratios in SPX this year. Despite being short the tail, the grind lower has been well captured by this trade structure.”

Moreover, it’s the case that after a nearly 20% multi-month run, higher, markets are stretched. 

To continue this pace would require, per JPMorgan Chase & Co (NYSE: JPM) strategists, a continued interest in demand for positive Delta exposure via equity or options, lower prints of consumer price data, as well as a dovish Federal Reserve (Fed) inflection.

The former we see now via call option volumes. The latter, not so much as the Federal Open Market Committee (FOMC) minutes “left the door open to another ‘unusually large’ increase at the next meeting in September,” in spite of a commitment to dial back if the data supported.

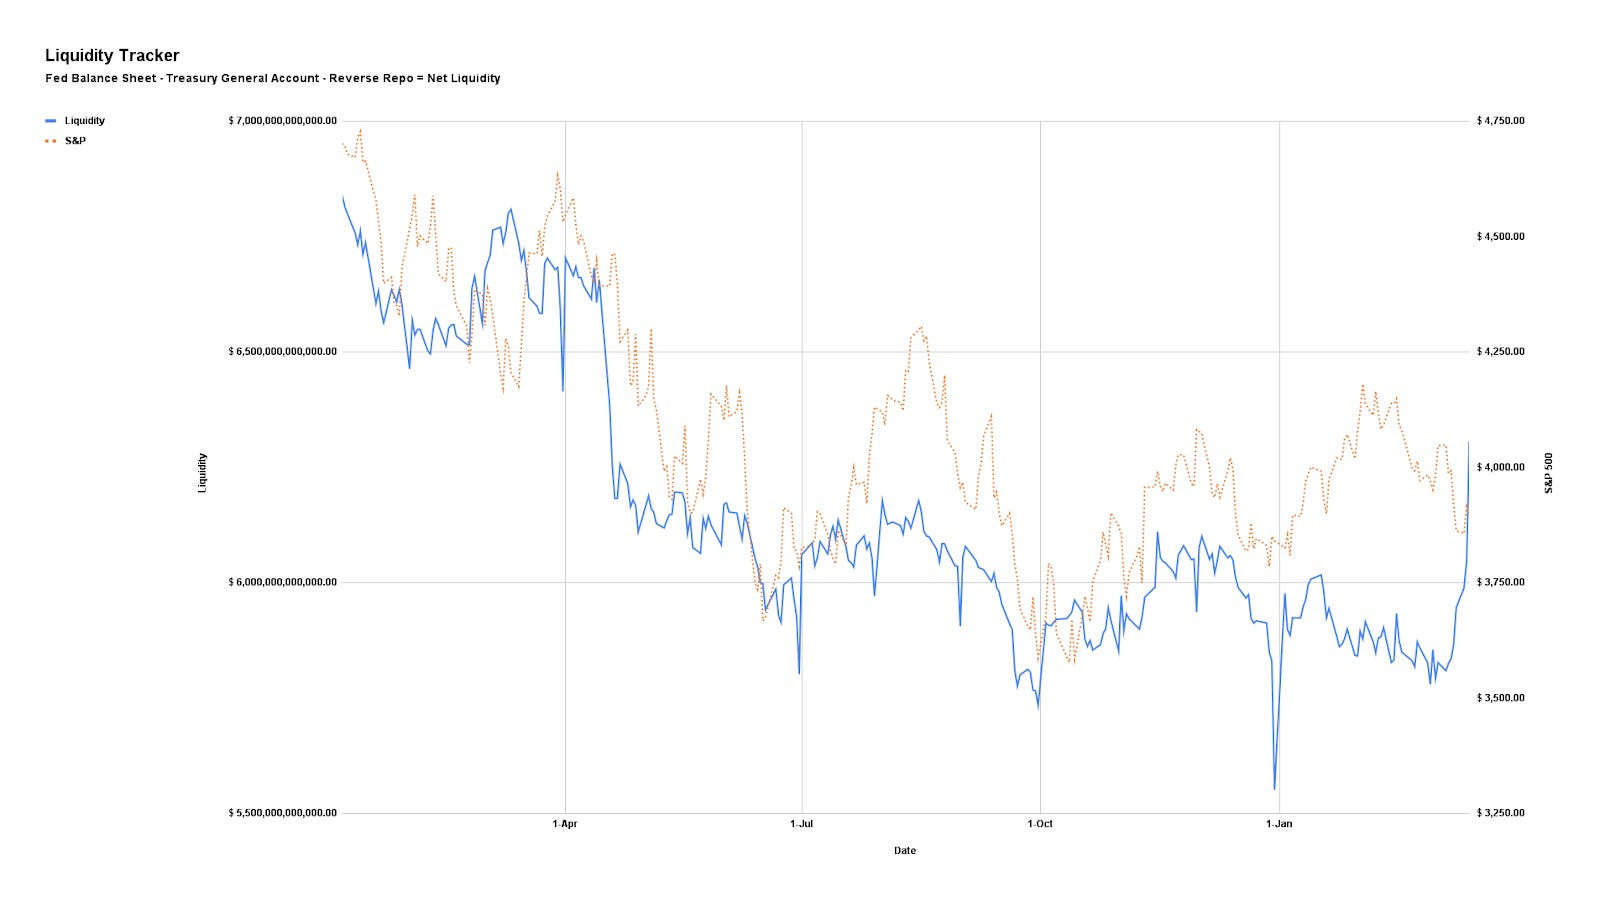
Graphic: Via Physik Invest. Data compiled by @jkonopas623. Fed Balance Sheet data, here. Treasury General Account Data, here. Reverse Repo data, here. NL = BS – TGA – RRP.

Presently, retail sales are steady, and supply pressures, though starting to ease, remain, bolstering inflation which the Fed is ultimately trying to stop from becoming entrenched.

Graphic: Retrieved from Bloomberg.

Though there are fundamental contexts we are leaving out (e.g., negative earnings revisions, Chinese retail, industrial output, and investment data missing which prompted an easing, the use of tools like Treasury buybacks to ease disruptions via Fed-action, as well as increasing recession odds), in short, the focus should be on the technicals which actually make us money.

Graphic: Retrieved from The Market Ear. Via Bank of America Corporation (NYSE: BAC).

And, presently, on the heels of macro- and volatility-type re-leveraging, per Deutsche Bank AG (NYSE: DB) the technical contexts are bullish. 

Keith Lerner, the co-chief investment officer and chief market strategist at Truist Financial Corporation’s (NYSE: TFC) Advisory Services puts it all well:

“Even if the Fed does pivot, they are less likely to support the markets as quickly as they have in the past given the scar tissue left behind as a result of the inflation challenges of the past year… The market rally over the past four weeks has been nothing short of impressive. Such strong buying pressure following indiscriminate selling has historically been a very positive sign for the market, often following important market bottoms. This is a welcome sign. Still, other factors in our work are less supportive. Indeed, markets are not only fighting the Fed, but the most aggressive global monetary tightening cycle in decades.”

Graphic: Retrieved from Bloomberg. Via Truist Financial Corporation (NYSE: TFC).

Beyond this, from a volatility perspective, we’d look for the VIX to sink below 15 to increase our optimism over a “sustained [and] better-than-typical” rally, per Jefferies Financial Group Inc (NYSE: JEF). Look at this last remark through the lens of participation on the part of traders who employ volatility-targeting strategies, for instance.

Graphic: Retrieved from The Market Ear. Via Jefferies Financial Group Inc (NYSE: JEF).

Technical

As of 7:20 AM ET, Thursday’s regular session (9:30 AM – 4:00 PM ET), in the S&P 500, is likely to open in the middle part of a balanced overnight inventory, inside of prior-range and -value, suggesting a limited potential for immediate directional opportunity.

In the best case, the S&P 500 trades higher.

Any activity above the $4,273.00 VPOC puts into play the $4,294.25 HVNode. Initiative trade beyond the HVNode could reach as high as the $4,337.00 VPOC and $4,393.75 HVNode, or higher.

In the worst case, the S&P 500 trades lower.

Any activity below the $4,273.00 VPOC puts into play the $4,253.25 HVNode. Initiative trade beyond the HVNode could reach as low as the $4,231.00 VPOC and $4,202.75 RTH Low, or lower.

Click here to load today’s key levels into the web-based TradingView charting platform. Note that all levels are derived using the 65-minute timeframe. New links are produced, daily.
Graphic: 65-minute profile chart of the Micro E-mini S&P 500 Futures.

Considerations: Responsiveness near key-technical areas (that are discernable visually on a chart), suggests technically-driven traders with short time horizons are very active. 

Such traders often lack the wherewithal to defend retests and, additionally, the type of trade may be indicative of the other time frame participants waiting for more information to initiate trades.

Definitions

Volume Areas: A structurally sound market will build on areas of high volume (HVNodes). Should the market trend for long periods of time, it will lack sound structure, identified as low volume areas (LVNodes). LVNodes denote directional conviction and ought to offer support on any test. 

If participants were to auction and find acceptance into areas of prior low volume (LVNodes), then future discovery ought to be volatile and quick as participants look to HVNodes for favorable entry or exit.

POCs: POCs are valuable as they denote areas where two-sided trade was most prevalent in a prior day session. Participants will respond to future tests of value as they offer favorable entry and exit.

Gamma: Gamma is the sensitivity of an option to changes in the underlying price. Dealers that take the other side of options trades hedge their exposure to risk by buying and selling the underlying. When dealers are short-gamma, they hedge by buying into strength and selling into weakness. When dealers are long-gamma, they hedge by selling into strength and buying into weakness. The former exacerbates volatility. The latter calms volatility.

Vanna: The rate at which the delta of an option changes with respect to volatility.

Charm: The rate at which the delta of an option changes with respect to time.

About

After years of self-education, strategy development, mentorship, and trial-and-error, Renato Leonard Capelj began trading full-time and founded Physik Invest to detail his methods, research, and performance in the markets.

Capelj also develops insights around impactful options market dynamics at SpotGamma and is a Benzinga reporter.

Some of his works include conversations with ARK Invest’s Catherine Wood, investors Kevin O’Leary and John Chambers, FTX’s Sam Bankman-Fried, ex-Bridgewater Associate Andy Constan, Kai Volatility’s Cem Karsan, The Ambrus Group’s Kris Sidial, among many others.

Disclaimer

In no way should the materials herein be construed as advice. Derivatives carry a substantial risk of loss. All content is for informational purposes only.