Categories
Commentary

The Mar-a-Lago Accords

“Good investing doesn’t come from buying good things, but from buying things well.” – Howard Marks

There is a lot of noise—it’s exhausting. Today, we will sift through the noise and focus on how we can protect and potentially grow our portfolios this year. This is a follow-up to our Market Tremors letter. But first, let’s clarify the context for our approach. This is a long newsletter, so you may have to view it in another window.


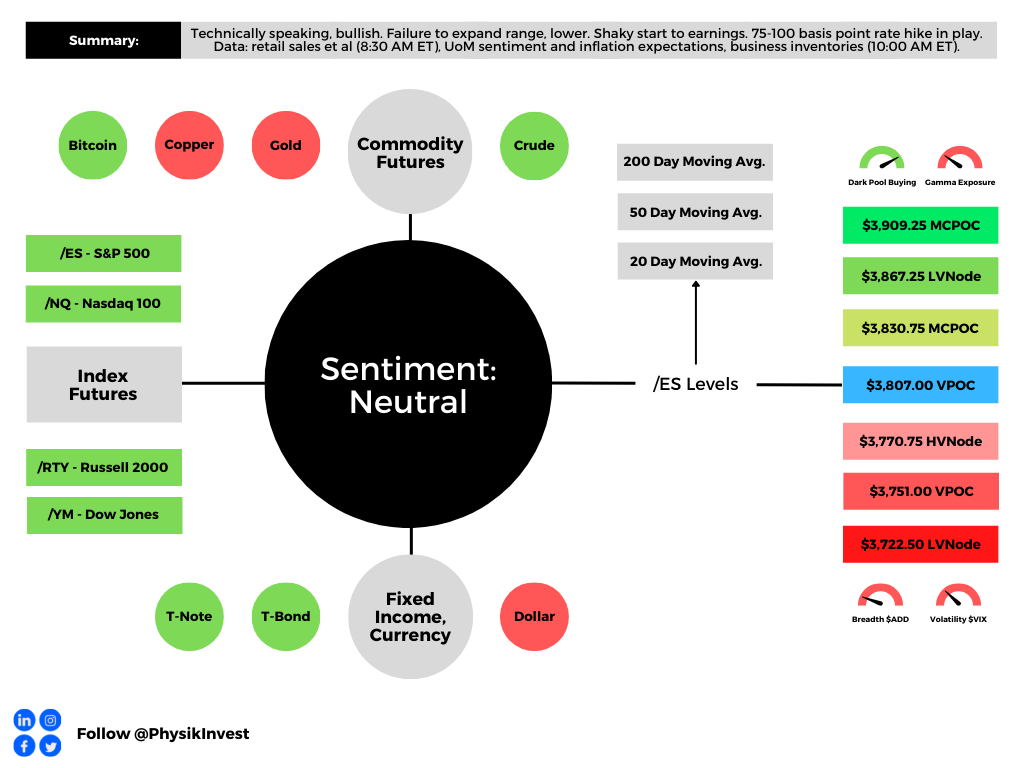
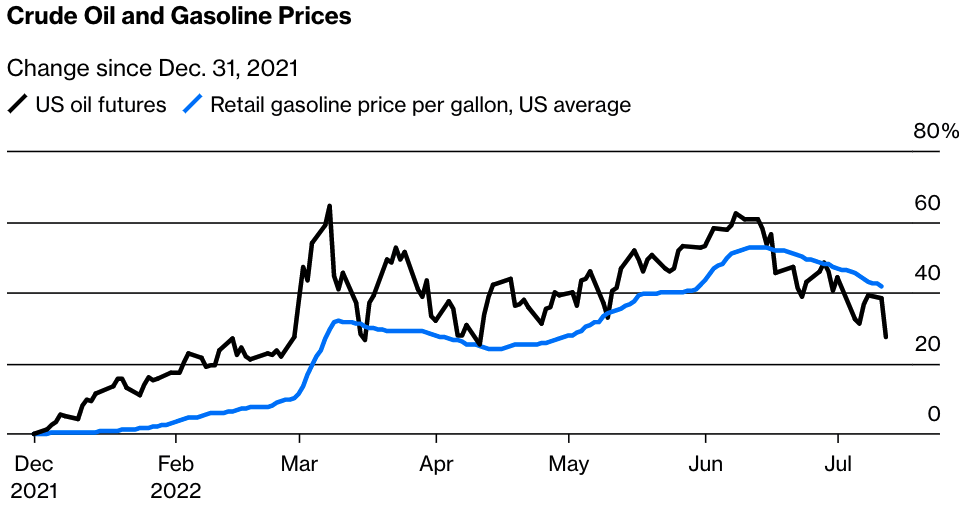
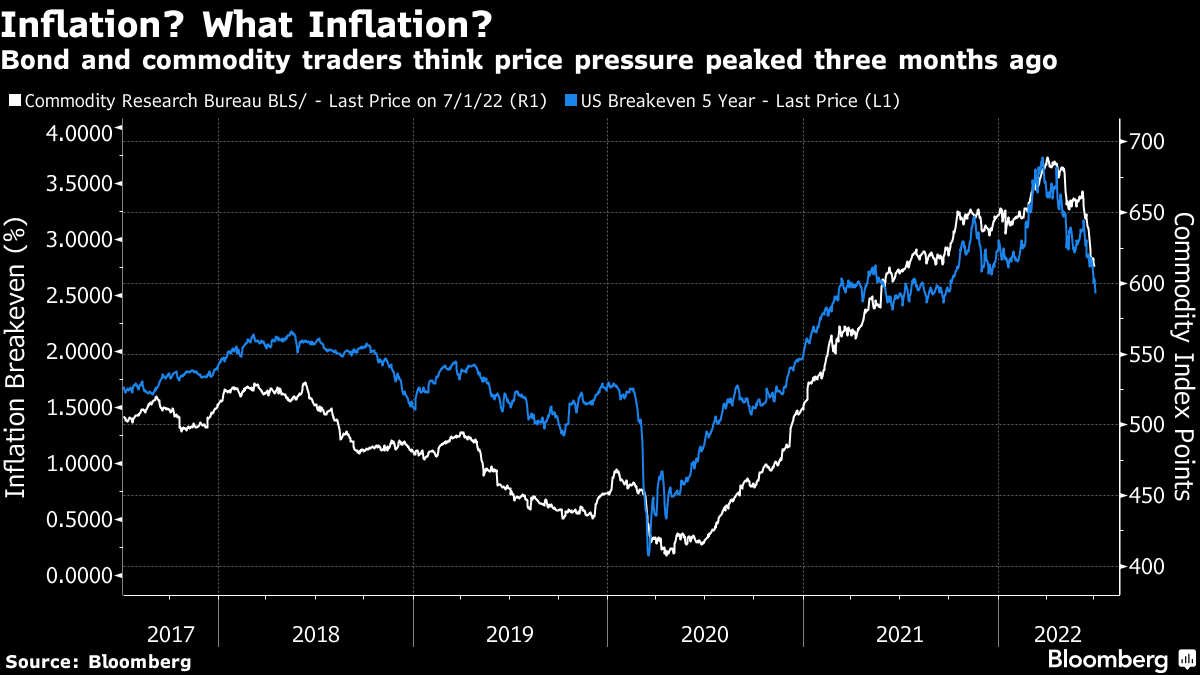
Inflation is back in focus, gold is soaring, and investors are optimistic about stocks. Correlations remain low, dispersion is high, and the market’s volatility pricing/positioning obscures potential risks lurking beneath the surface. The macro landscape is shifting rapidly, yet when we zoom out, we’re confronted with something we’ve discussed before: inflation is here to stay!

For a long time, the expectation was that inflation would take a particular shape—a transitory spike and a manageable trend. Instead, structurally, we’re dealing with a world that is moving away from the low-inflation paradigms of the past. The pillars supporting cheap capital and abundant liquidity—globalization and dovish monetary policy—are shifting.

These shifts are neither sudden nor unexpected. In 2023, we wrote much about the narrative of the ideological struggle between the West and East, particularly with the Russia-Ukraine conflict sparking. Historically, whenever Eastern economies prosper, the West adjusts the rules. Now, it’s more about who controls what. Control over assets, inflation, and interest rates define economic power. Folks like Zoltan Pozsar have warned that the fundamental drivers of the low-inflation era—globalization and financialization—are unraveling, leaving policymakers with little choice.

The well-respected Kai Volatility’s Cem Karsan, a mentor to many, has pointed out in excruciating, albeit digestible detail that the trends favoring high-beta portfolios over the past four decades are reversing. Monetary authorities, particularly the Federal Reserve, have been constrained in their ability to address the widening wealth divide. Their response to inflation in the early 2020s—from creating demand to absorb surplus supplies of low-priced items to structurally restricting demand in response to shortages—was intended to guide the economy along a path of managed declines in activity while maneuvering interest rates to prevent another inflationary flare. Rising populism is a byproduct manifesting as shifts in public demand and political sentiment.

Thus, today’s Mar-a-Lago Accords and the broader economic overhaul signify a significant trade, monetary policy, and financial stability restructuring. Tariffs, a U.S. sovereign wealth fund, and global security restructuring are the key issues at this forefront. The implications of this shift are profound, and markets have yet to adjust. A portfolio for this new environment could creatively layer exposure to stocks, bonds, commodities, and volatility. Understanding the pieces herein will be critical for structuring trades and managing risk. Let’s dive in.


Macro Context: A New Economic Framework

#1 – Tariffs

One significant component of this broader economic overhaul is tariffs. Economist Stephen Miran, nominated by the U.S. President to be Chairman of the Council of Economic Advisers, has outlined how tariffs, historically used to influence trade flows, are being retooled as protectionist instruments and an alternative revenue source.

According to Miran’s A User’s Guide to Restructuring the Global Trading System and fantastic explanations by Bianco Research founder Jim Bianco, a core issue is a persistently strong dollar distorting global trade balances. If paired with currency adjustments, tariffs could redistribute the costs away from U.S. consumers, “present[ing] minimal inflationary or otherwise adverse side effects, consistent with the [U.S.-China trade war] experience in 2018-2019.” However, this approach risks retaliation or distancing from key trading partners, further fracturing global supply chains.

To mitigate these risks, policymakers consider implementing tariffs in phases, gradually increasing rates to address inflationary pressures and market volatility. Even during the 2018-2019 trade war, tariff rate increases were implemented over time. Additionally, tariffs will be driven by national security concerns, targeting industries essential to defense and technological innovation. From this perspective, policymakers view access to the U.S. market as a privilege.

#2 – Sovereign Wealth Fund

A significant consideration is a U.S. sovereign wealth fund leaning on undervalued national assets to restore fiscal stability. Unlike traditional sovereign wealth funds built on surpluses, this fund would operate by revaluing and monetizing domestic reserves.

Key assets under consideration include undervalued gold reserves and billions in government-possessed bitcoin, which could be integrated into this fund. Bianco says these could total nearly $1 trillion.

This strategy introduces volatility concerns. Those concerned say government exposure and potential speculation on financial assets could lead to instability. Should we invest now for later?

#3 – Global Security Agreements

Beyond trade and monetary policy, a core element of the broader economic overhaul is linking military alliances to economic policy. The longstanding framework in which the U.S. provided security to allies without direct compensation is being rethought. The warnings are explicit; note the President’s Davos remarks and the Vice President’s Munich Security Conference speech.

Under a new paradigm, Bianco summarizes that NATO members may be required to contribute more to defense (say ~5% of GDP), foreign-held U.S. Treasury bonds may be converted into 100-year zero-coupon bonds, reducing short-term debt burdens, and tariff structures may be adjusted based on a country’s alignment with U.S. security interests.

“What Miran said in his paper is: you owe us so much for the last 80 years that what we want to do is a debt swap,” Bianco explains how the U.S. can be paid for being the world’s protector. “Those NATO countries have trillions of dollars of debt. [You’ll] swap it for 100-year or perpetual zero coupon non-marketable Treasury securit[ies]. So, you’re going to swap $10 billion worth of Treasuries for a $10 billion coupon century bond [that] won’t mature for 100 years, [and] won’t get any interest.”

In short, this is a fundamental shift that requires allies to bear a more significant share of security and costs. It’s the Mar-a-Lago Accords, a new financial order and policy framework akin to past agreements that reshaped the global economy, such as the Bretton Woods Agreement of 1944, which established the U.S. dollar as the international reserve currency, and the Plaza Accord of 1985, which coordinated currency adjustments to correct trade imbalances.

The proposed Mar-a-Lago Accords aim to reprice U.S. debt through asset monetization, weaken the dollar to improve U.S. export competitiveness and enforce tariff structures to rebalance global trade.


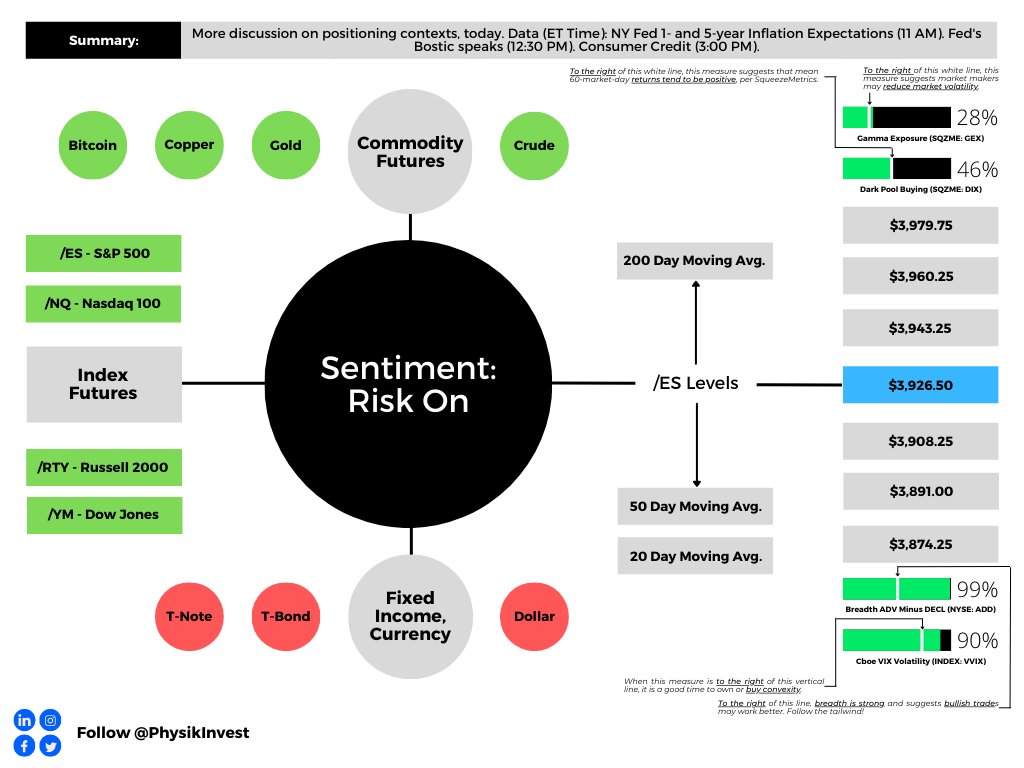
Positioning Context: Market Positioning Obscures

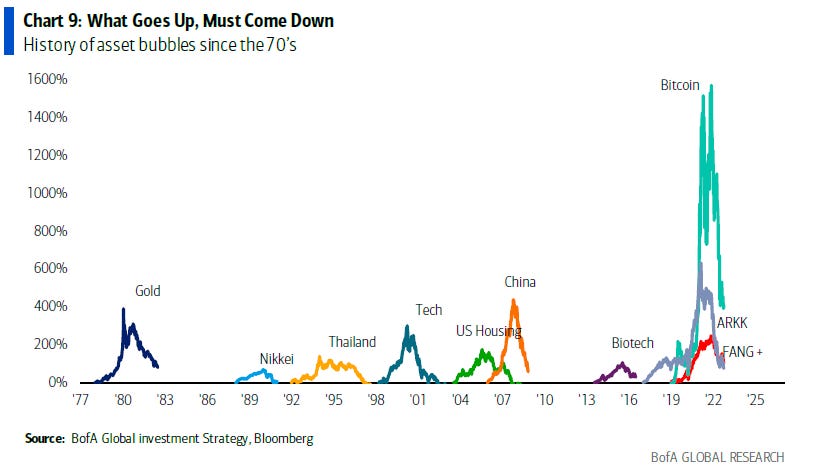
Tariff-driven price pressures, a weaker dollar, and a floor under interest rates raise bond yields, corporate borrowing costs, and strain leveraged players. This backdrop favors debasement plays and perceived safe havens like bitcoin and gold, which have been climbing for reasons discussed in the past and present.

Graphic: Retrieved from Bloomberg via @convertbond.

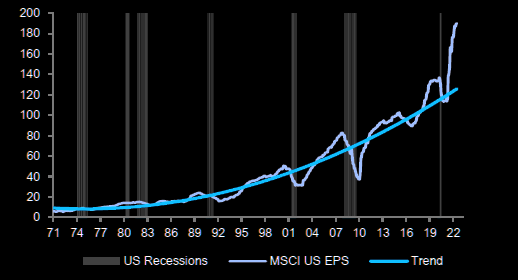
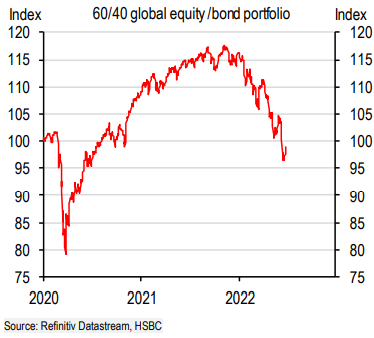
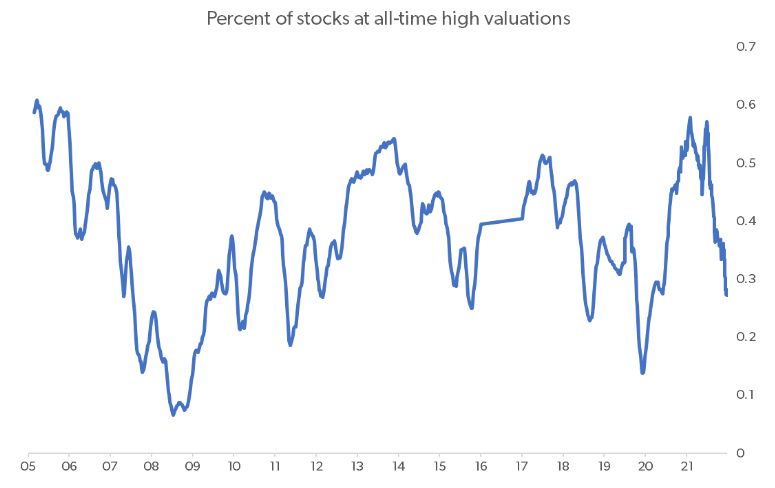
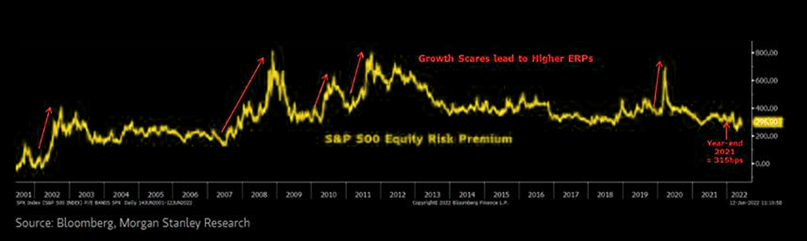
Equities face a less promising outlook. Oaktree Capital highlights that decade-long returns have historically been lackluster when investors bought the S&P 500 at today’s multiples. As Howard Marks puts it, earning +/-2% annually isn’t disastrous—but the real risk lies in a sharp valuation reset, compressed into just a few years, much like the brutal selloffs of the 1970s and 2000s.

Graphic: Retrieved from Bloomberg via Bob Elliott.

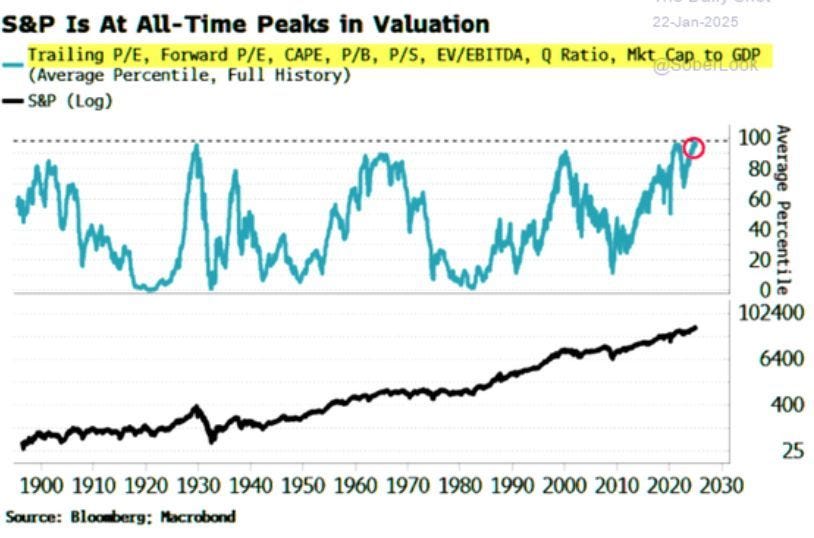
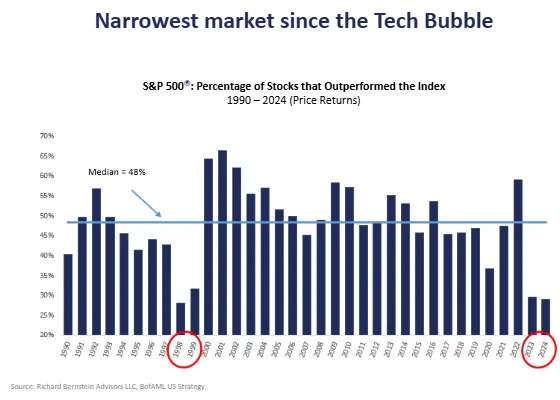
While the current market environment may feel frothy, with stretched valuations and narrow leadership, we’re not in an imbalanced 1970s scenario. Also, the possibility of a dollar devaluation serves as a tailwind for S&P 500 earnings, potentially boosting stock prices, Fallacy Alarm explains. Markets are not irrational; instead, they could face modest returns of around 5-6% annually for stocks and bonds over the next decade. Such sanguine sentiment is evident in the options/volatility market, reflecting the distribution of future possible outcomes; the trading and hedging of options make them a robust gauge of future outcomes—offering a view of where markets stand and where they might be headed.

Graphic: Retrieved from Bank of America via Bloomberg.

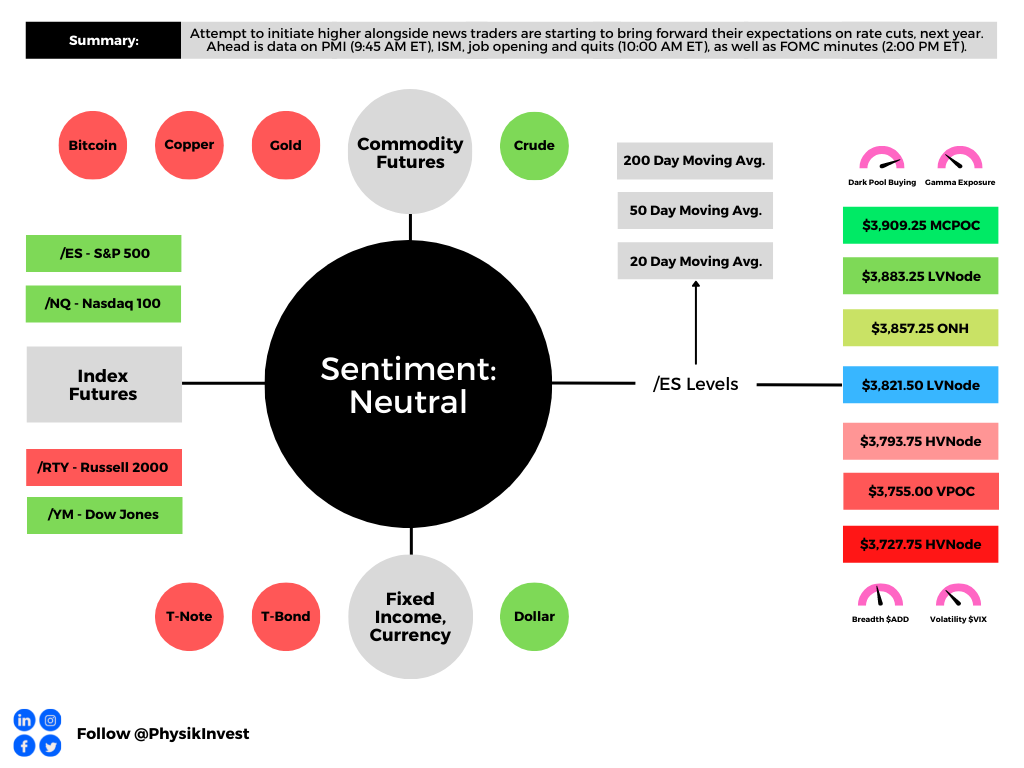
We observe several key happenings:

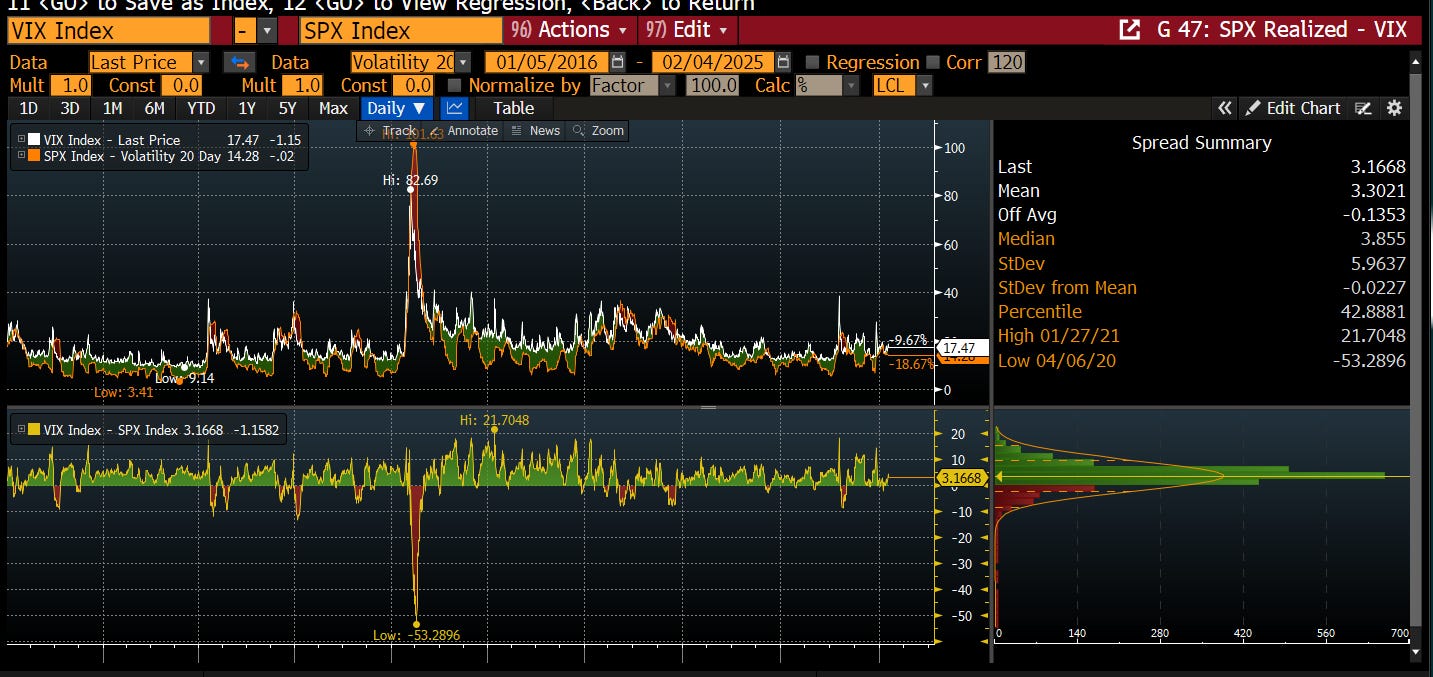
#1 – Hedging Volatility Spikes, Not Market Crashes

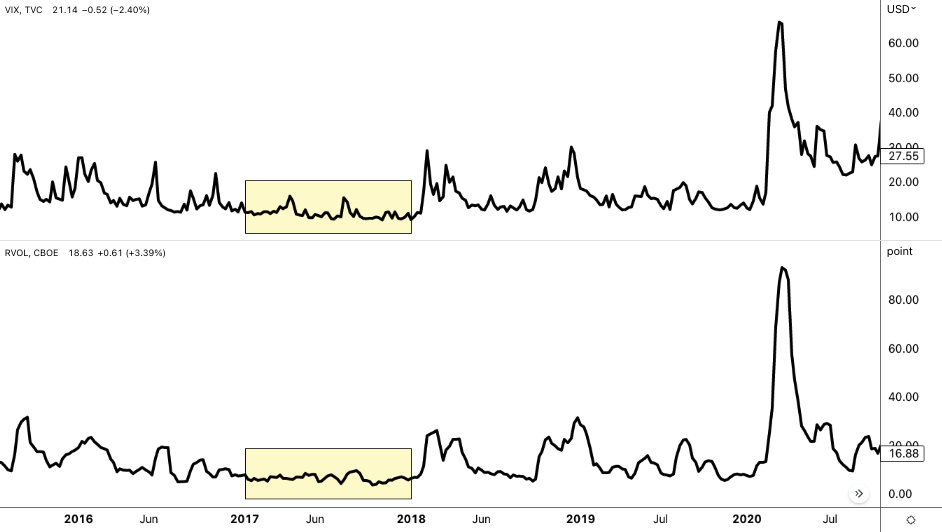
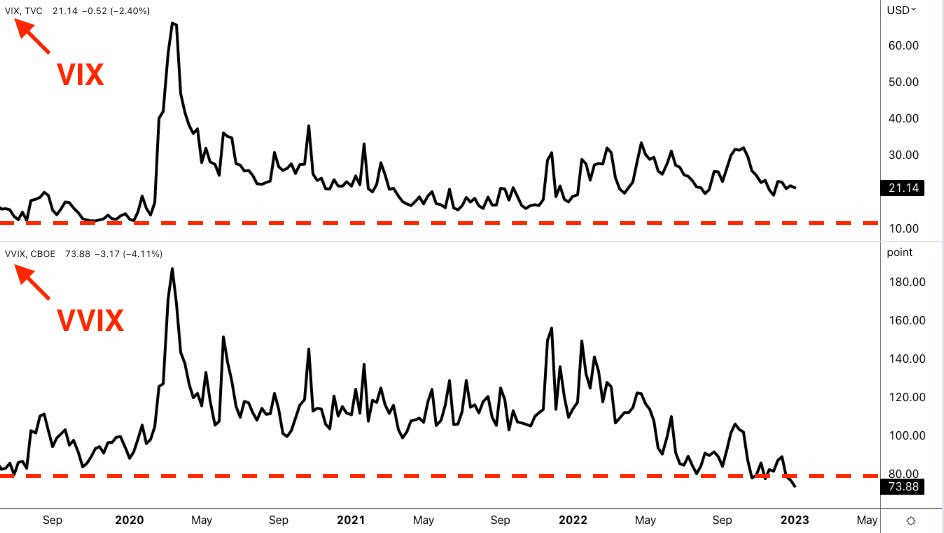
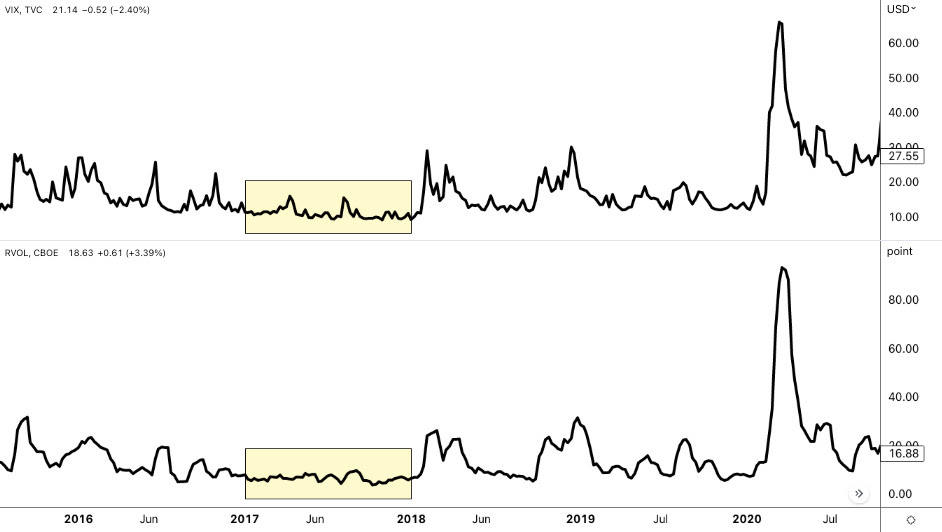
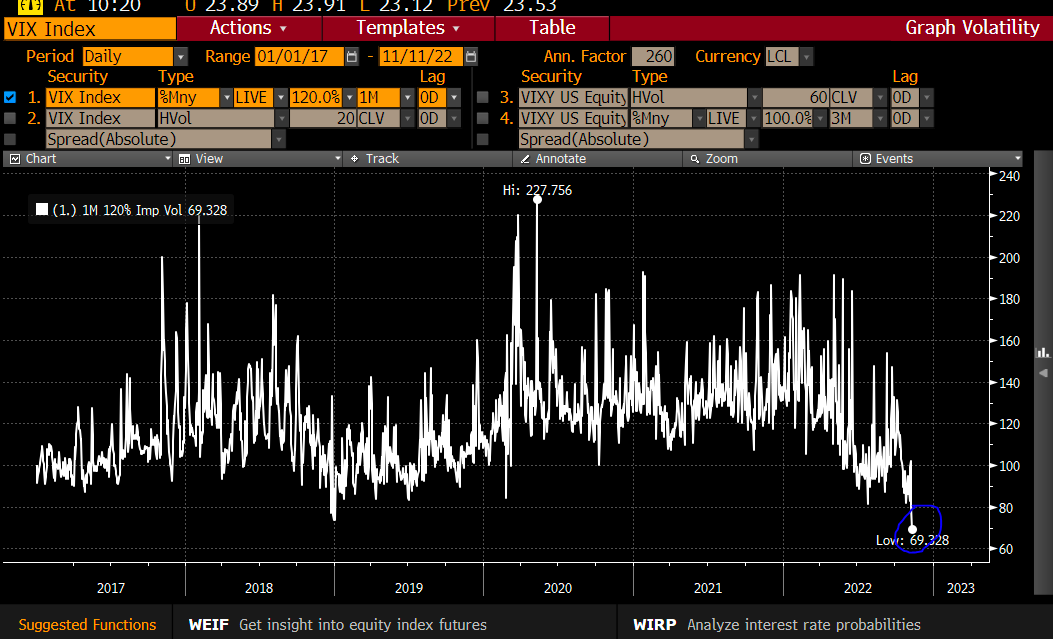
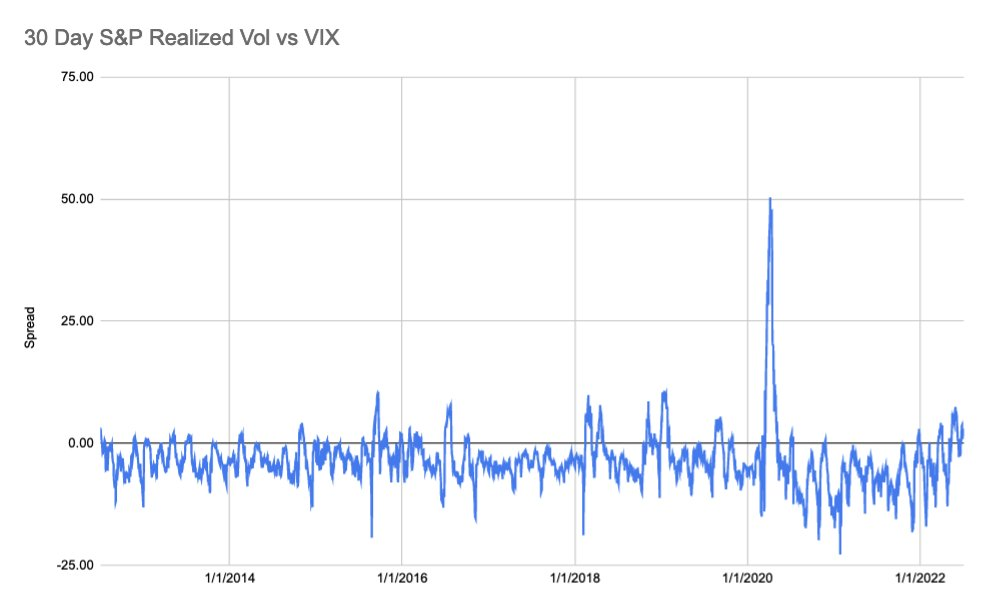
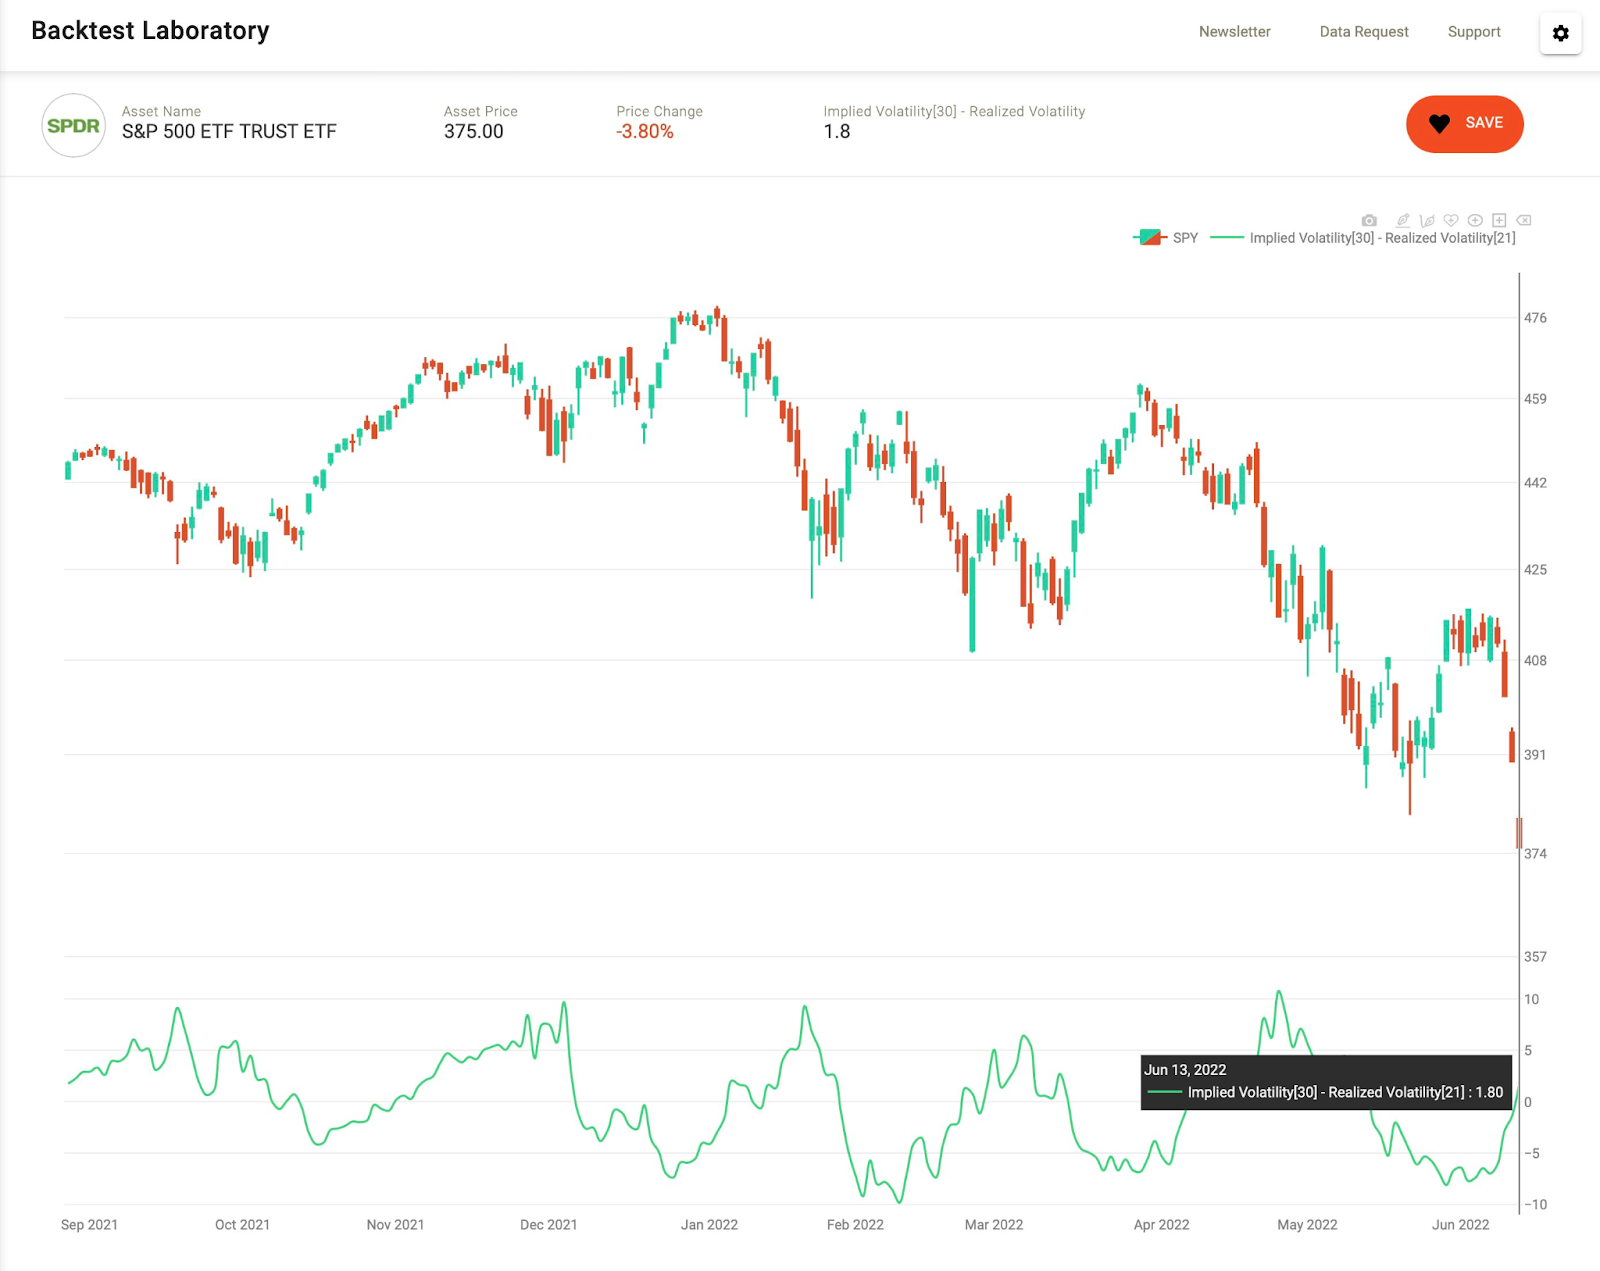
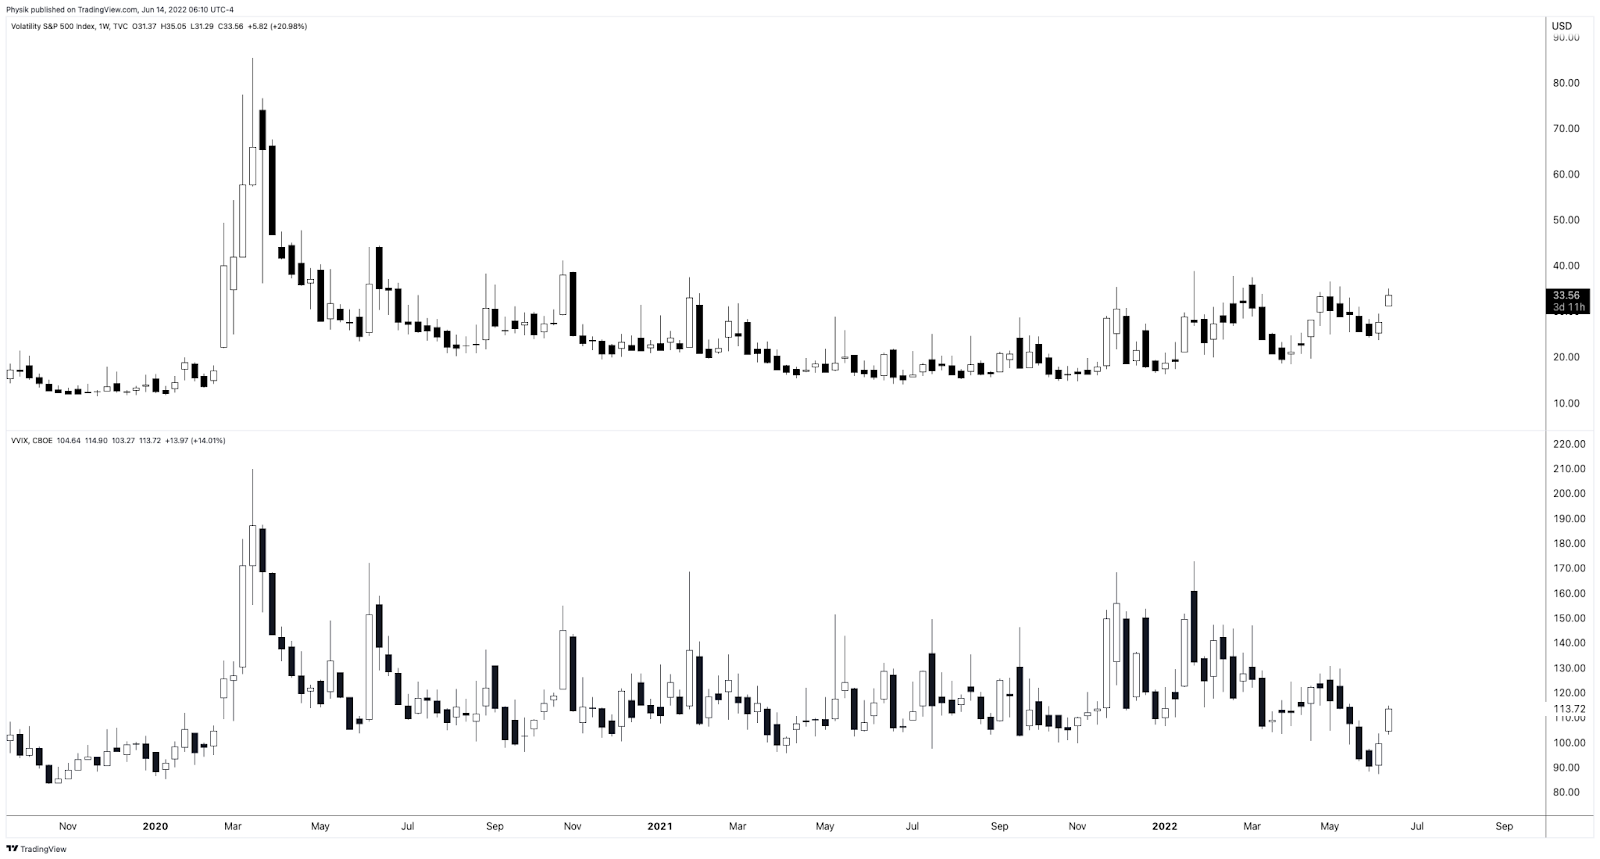
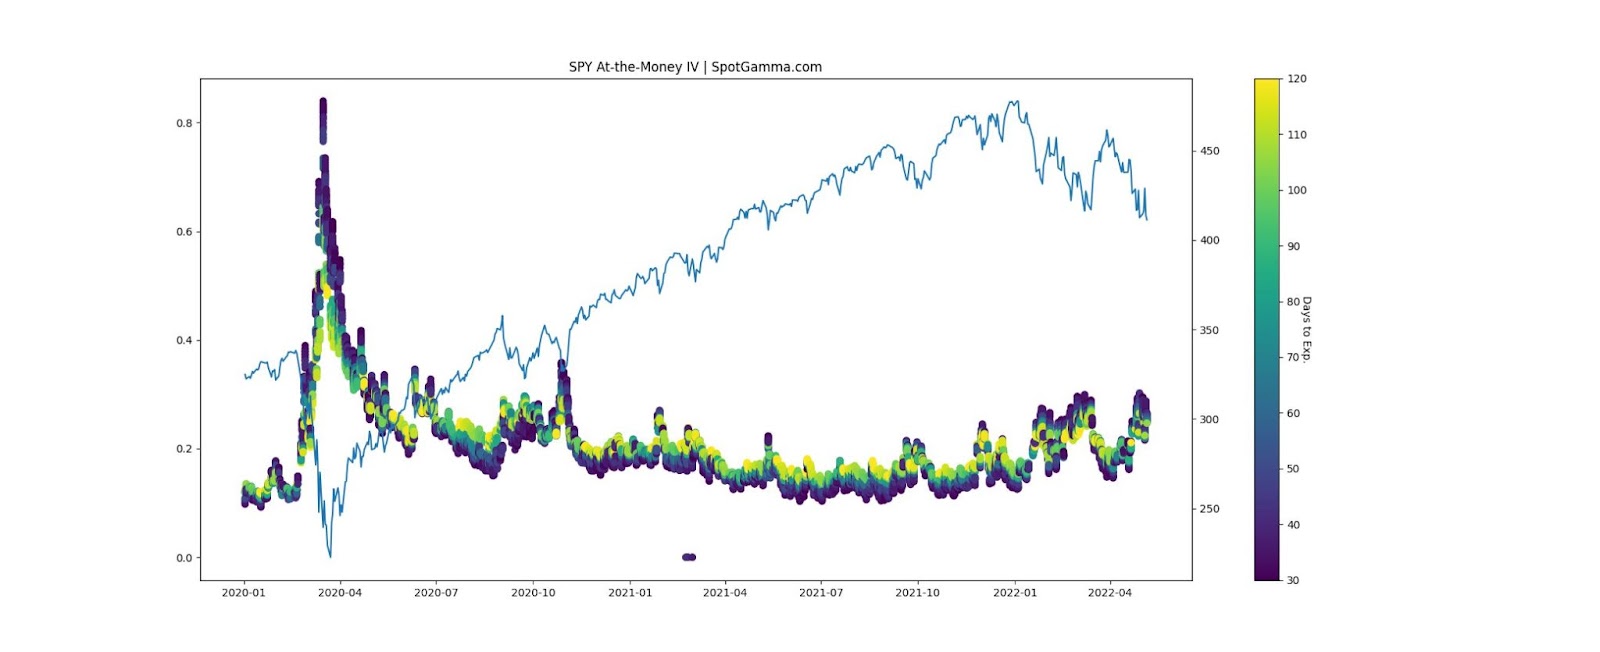
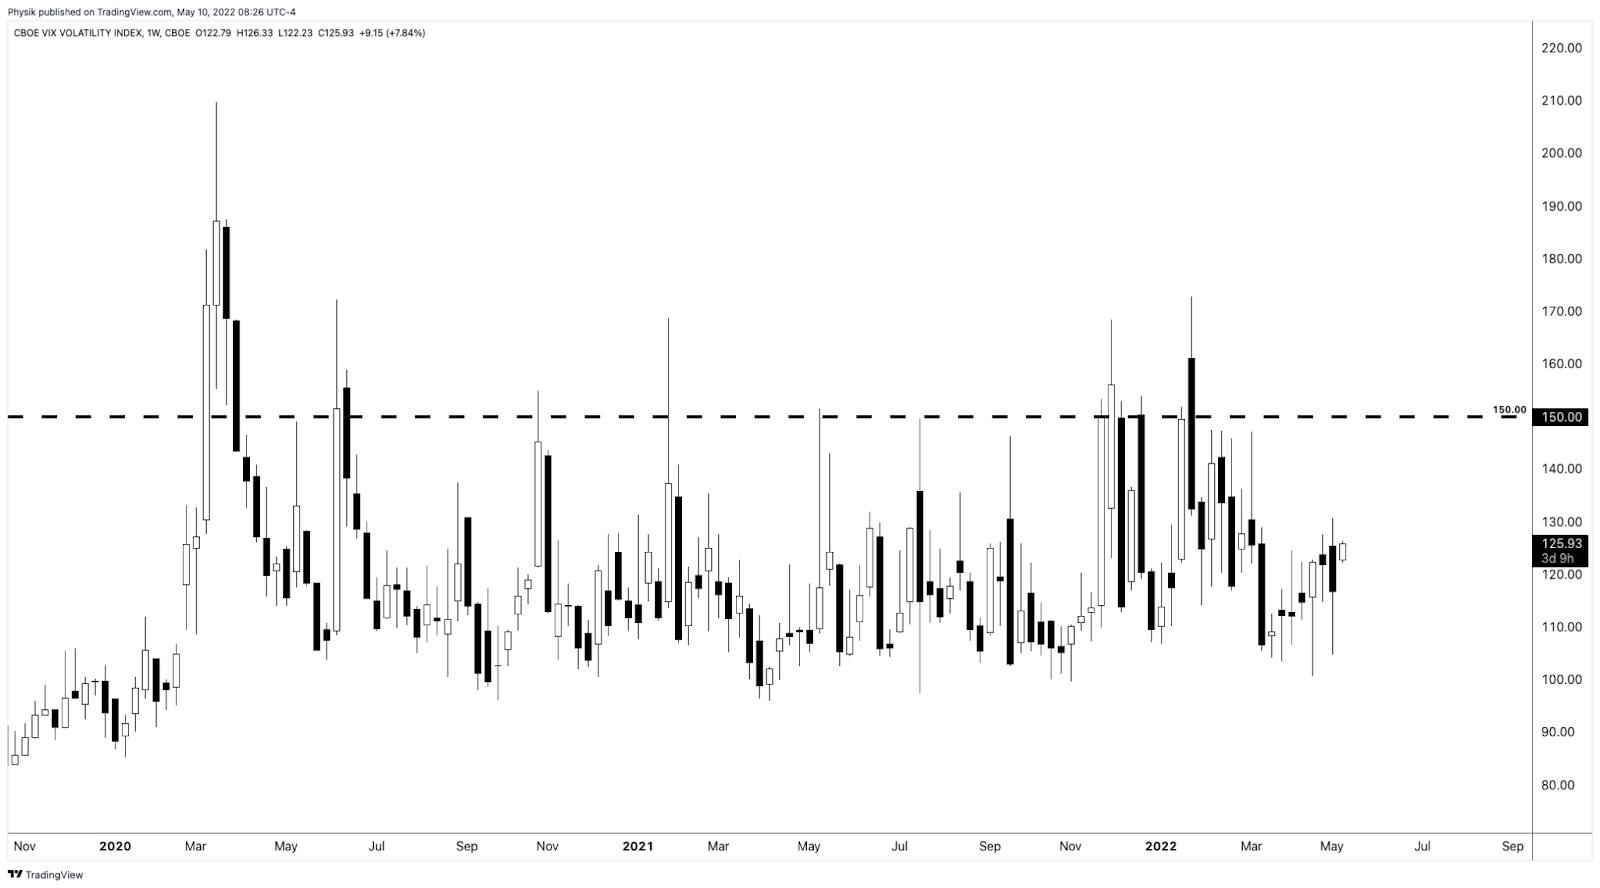
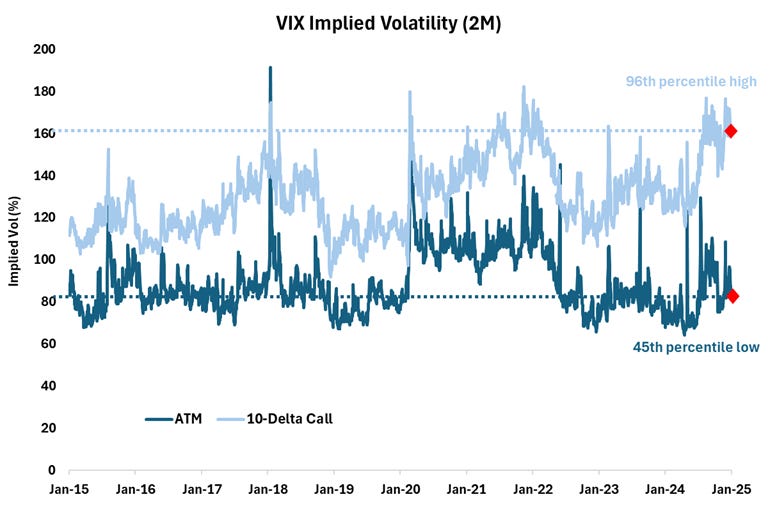
Investors are hedging against potential volatility spikes like those seen on August 5, 2024, when the VIX exploded higher. While the S&P 500 grinds upward and the VIX drifts lower and appears cheap (<16), the VVIX—“VIX of the VIX”—remains elevated. This unusual divergence manifests from demand for VIX calls, suggesting the market worries sharp repricings of risk are more likely than broad equity selloffs. The dynamic boils down to supply and demand; SPX options remain underappreciated—why protect when the market seems stable—meanwhile, VIX options are in demand, bolstering VVIX.

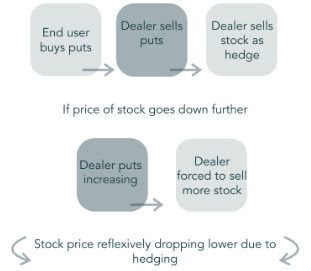
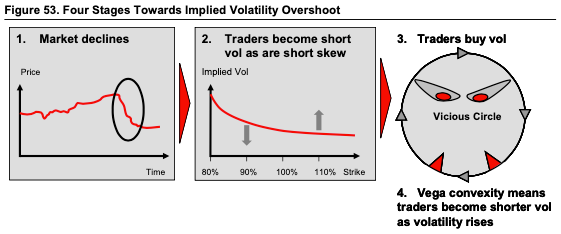
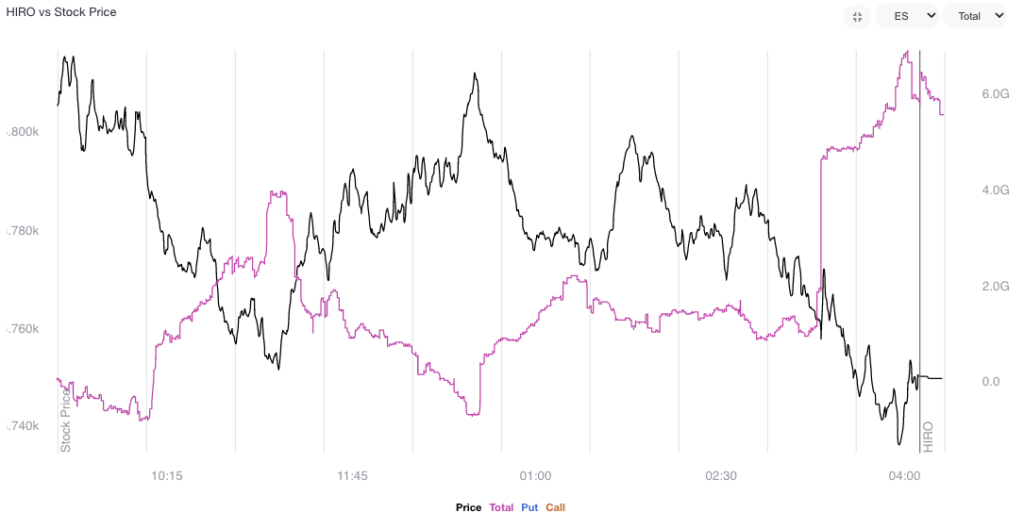
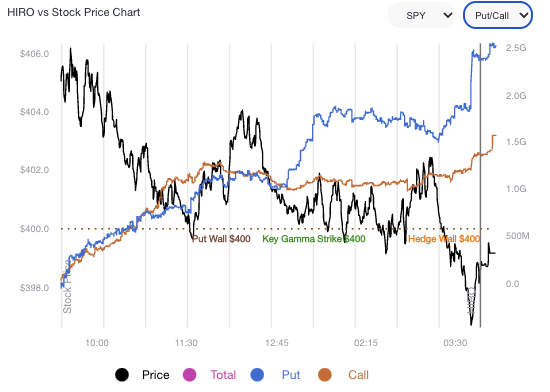
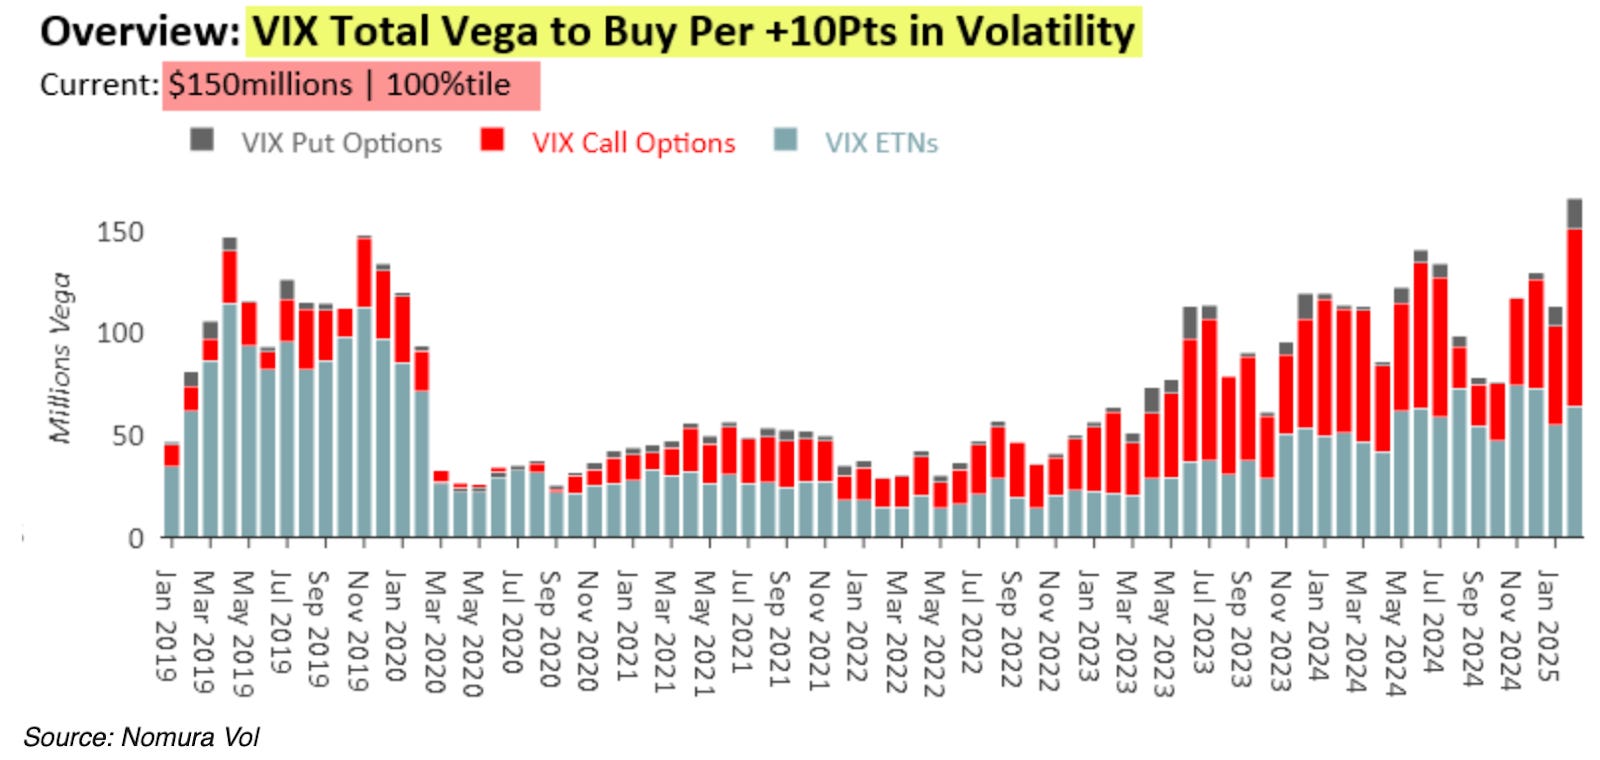
SpotGamma highlights this massive VIX call buying, noting dealer short convexity positioning suggests that, should volatility “wake up,” there could be significant downside pressure on equities and upside pressure on volatility, reinforcing the view that the VVIX’s elevated levels could signal a potential volatility spike, rather than a broad market crash.

Graphic: Retrieved from Cboe Global Markets.

“The aforementioned vega supply is indeed large, but it is innocuous unless provoked,” SpotGamma’s founder Brent Kochuba explains. Still, “with correlation stretched and IVs at lows, there is the potential for an SPX index short vol cover/single stock spasm to push into this upside vega convexity – something that we think a sharp NVDA [earnings] miss could spark.”

Graphic: Retrieved from Nomura via SpotGamma.

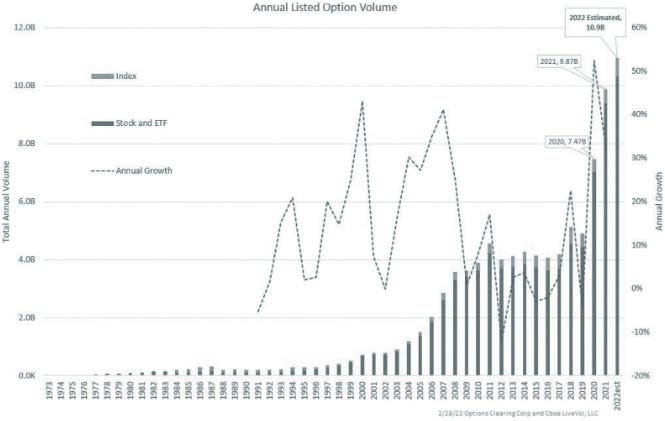
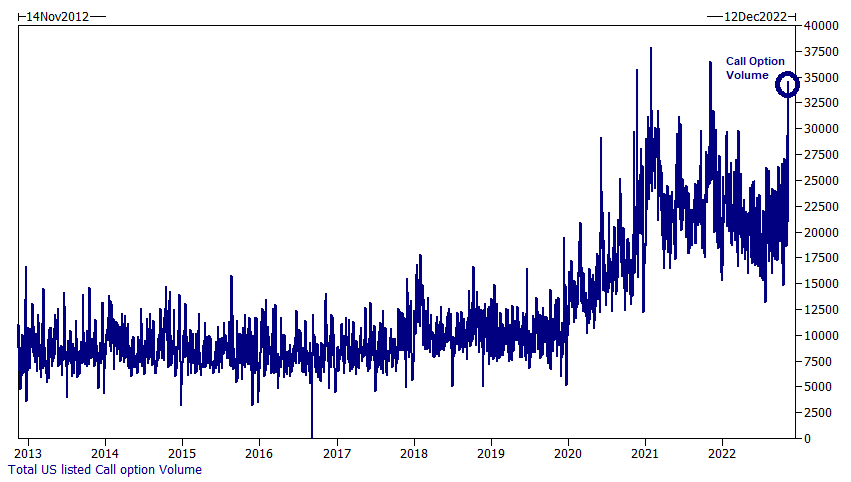
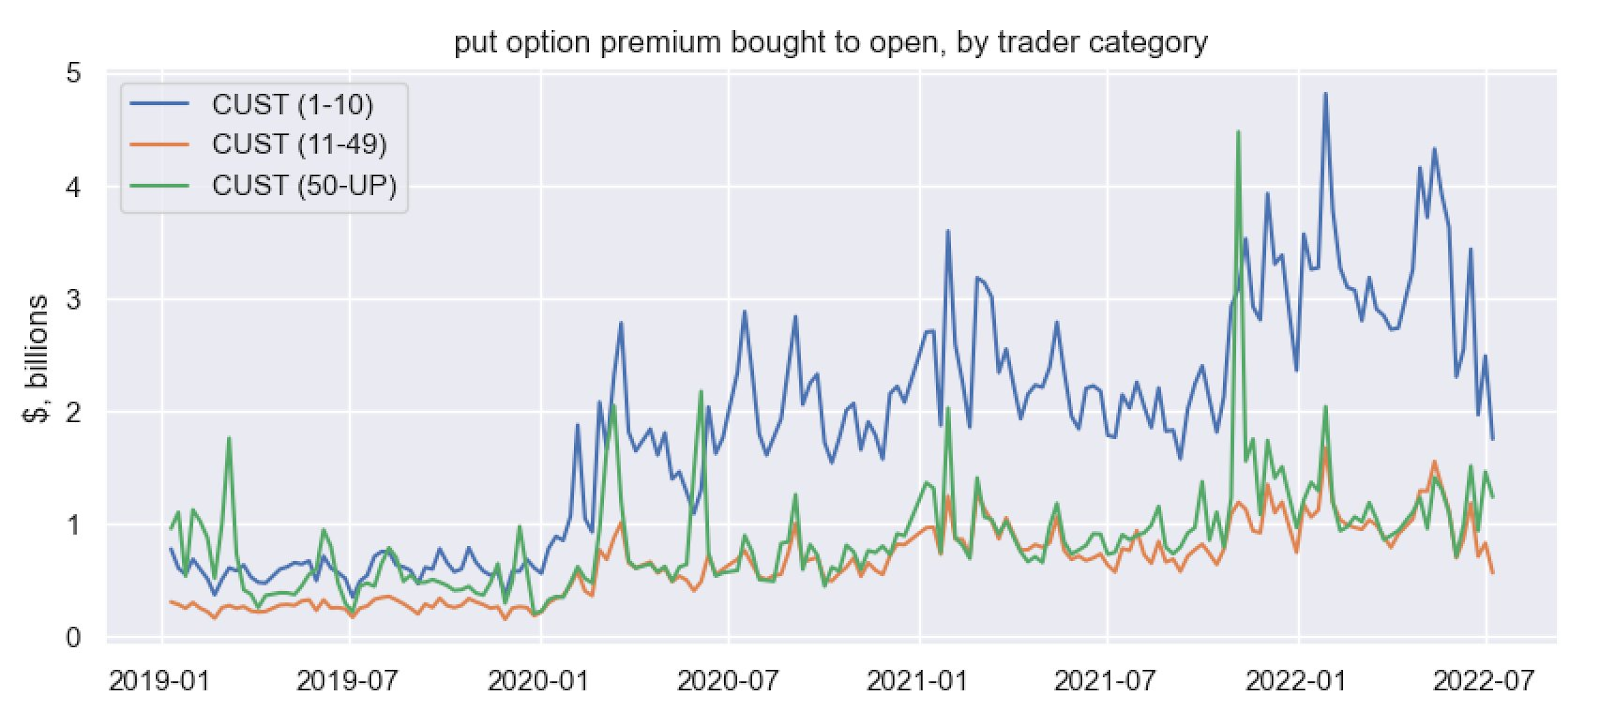
#2 – Options Selling and the ‘Buy My Course’ Gurus

Investors are leaning toward short-dated options selling (sometimes packaged within an ETF structure, without regard for price and thoroughly assessing broader market positioning) and structured products.

Graphic: Retrieved from JPMorgan via @jaredhstocks.

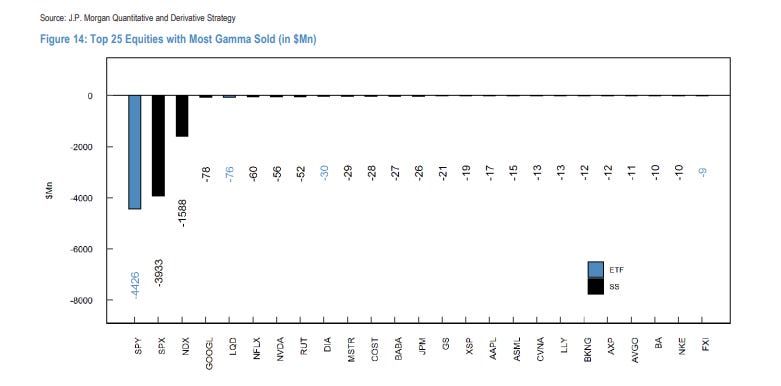
As QVR Advisors’ Benn Eifert explains, dynamic creates opportunity: deep out-of-the-money, long-dated volatility in single stocks looks attractive for tail-risk hedging. But there’s a catch—the persistence of this activity reinforces spot-vol covariance (i.e., the relationship between the underlying movements or spot and its volatility or vol). If the market shifts and volatility rises as the underlying asset moves up/down (the usual pattern flips), long volatility positions could become highly profitable, as it is then they would benefit from this reversal in spot-vol dynamics (e.g., 2020).

Graphic: Retrieved from Bloomberg via Kris Sidial. Volatility is fair in indexes; “much better opportunities in singles right now.”

As SpotGamma elaborated, if strength through earnings persists, “it will supply a final equity vol and correlation drop (a ‘final vol squeeze’), ushering in a blow-off equity top. At the same time, these metrics are low enough to justify owning 3-6 month downside protection, as bad things usually happen from these vol levels.”

Graphic: Correlation via TradingView. Stocks are expected to move more independently. Peep the pre-2018 Volmageddon levels.

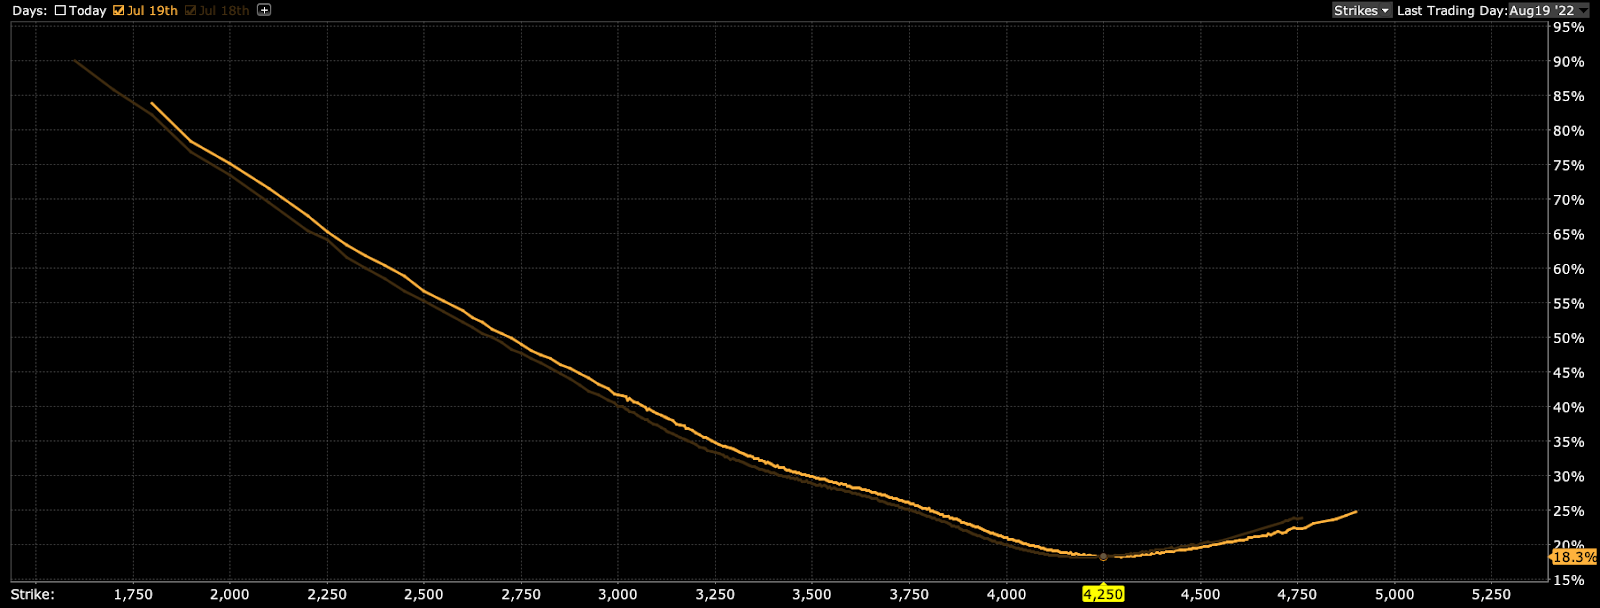
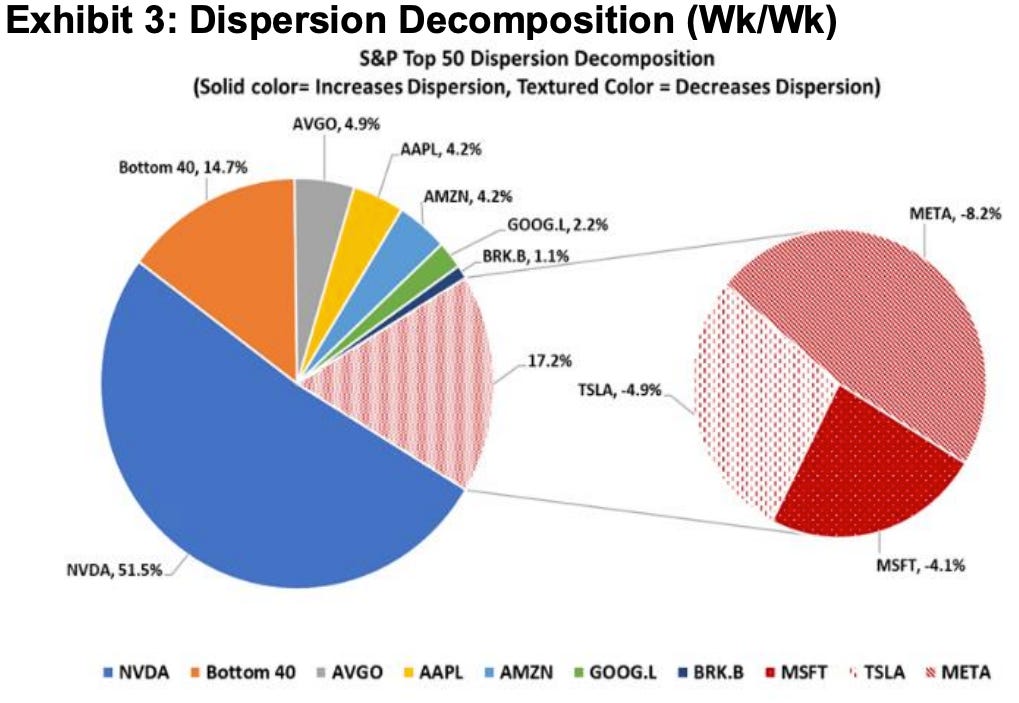
As an aside, implied correlation measures the degree to which the prices of the assets in the basket are expected to move together (positively correlated) or in opposite directions (negatively correlated). Low correlation, in this case, indicates that the stocks are expected to move independently or in opposite directions; hence, dispersion trades betting on this have performed well.

Graphic: Retrieved from Cboe Global Markets.

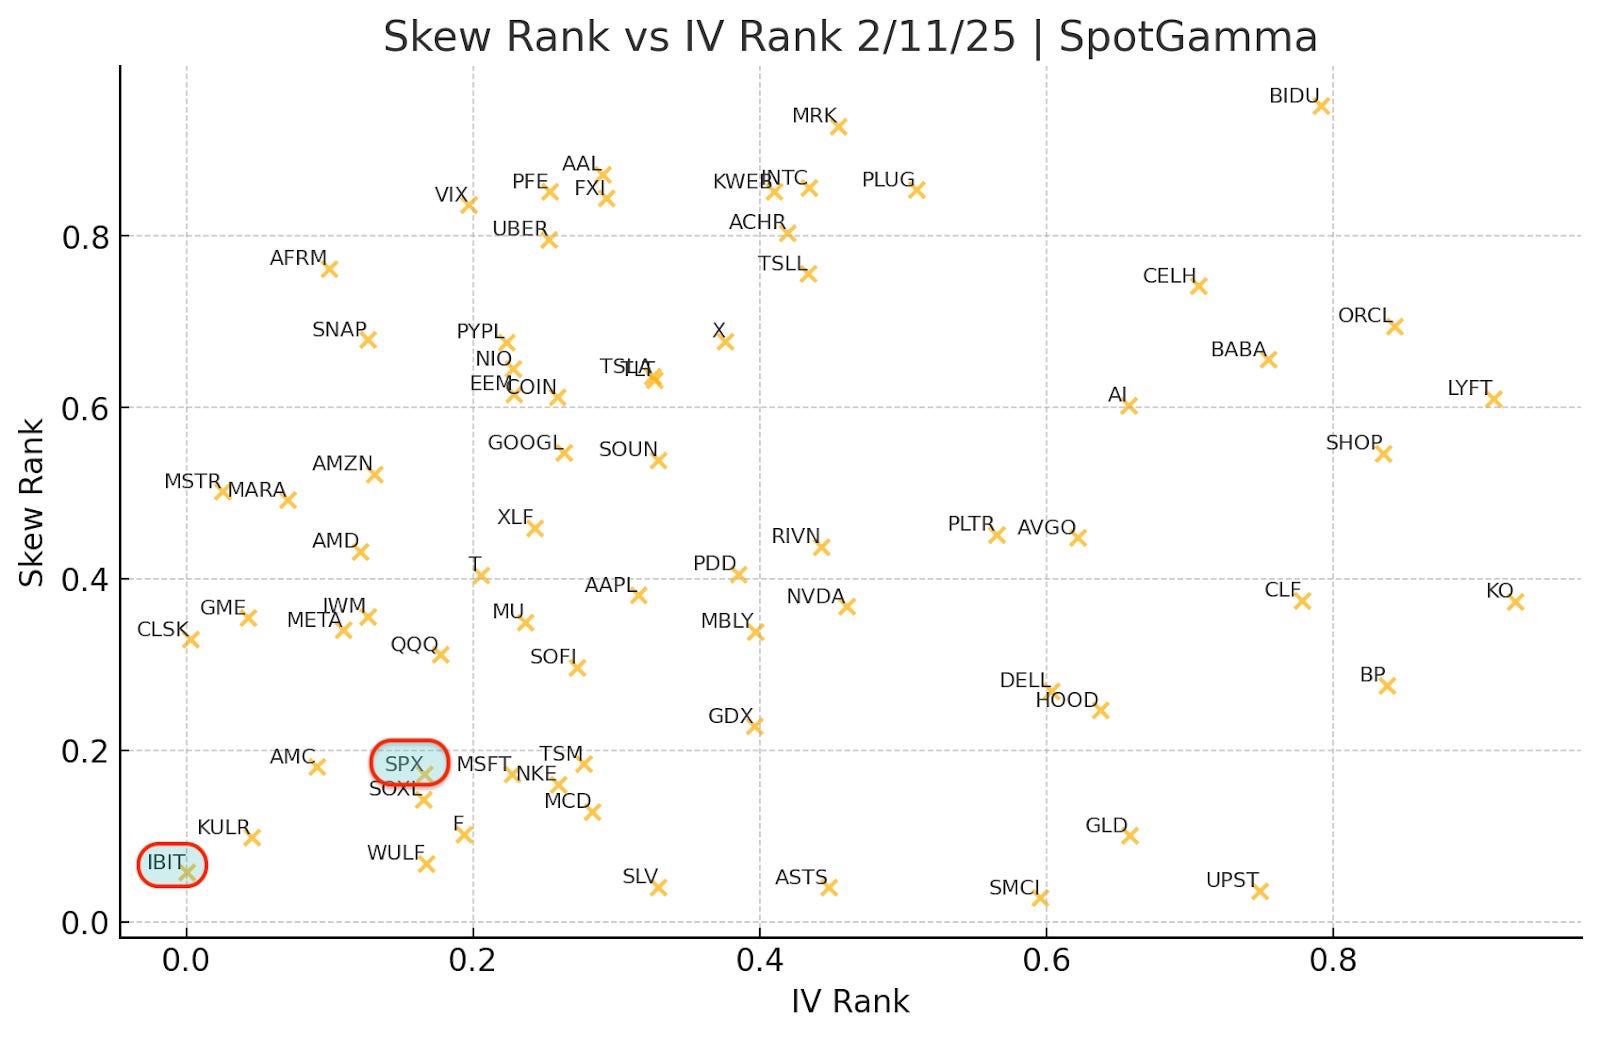
#4 – The Changing Narrative of Bitcoin and Its Maximalists

Similar patterns emerge in bitcoin. As countries face currency debasement and economic stresses, bitcoin stands out as a hedge to some. Like equities, bitcoin options are underappreciated.

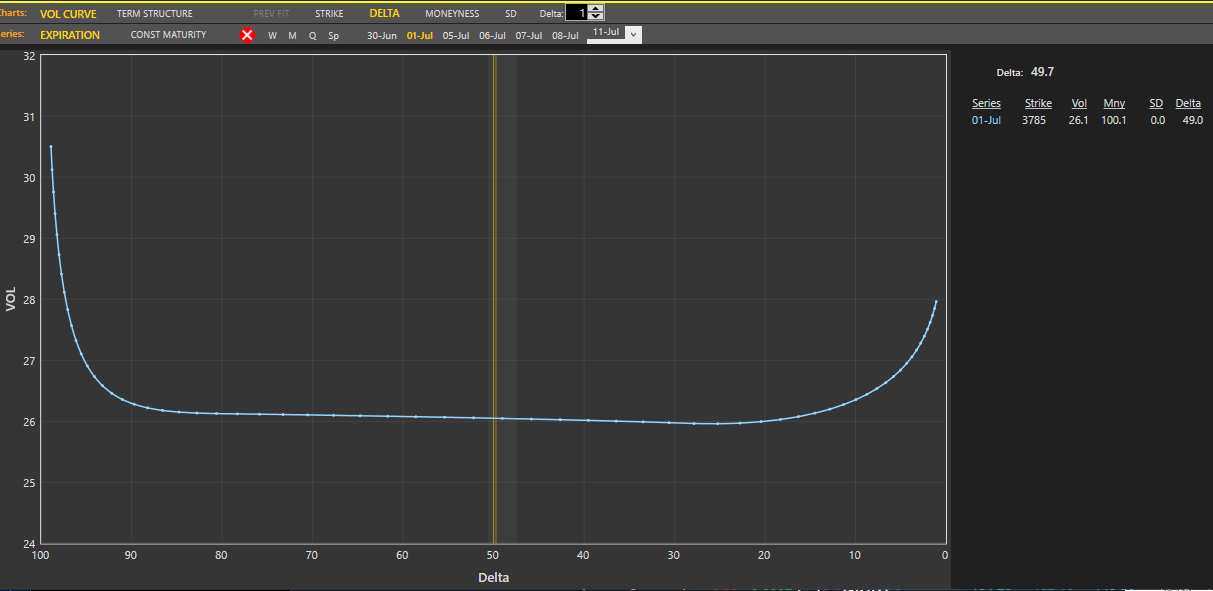
For example, implied volatility has traded under 50% for one-month options, representing an attractive entry point for those looking to position themselves for a surge. This low volatility environment in Bitcoin mirrors the opportunities in equities. Here, bitcoin benefits from any volatility reversal, presenting a compelling case for those looking to participate in a big market move.

Graphic: Retrieved from SpotGamma. Higher skew and IV rank suggest calls are expensive and moves are stretched.

Context Applied: Trade Structuring

Trade structuring this year is all about creativity. We’ve added the following to our portfolios.

#1 – Rates

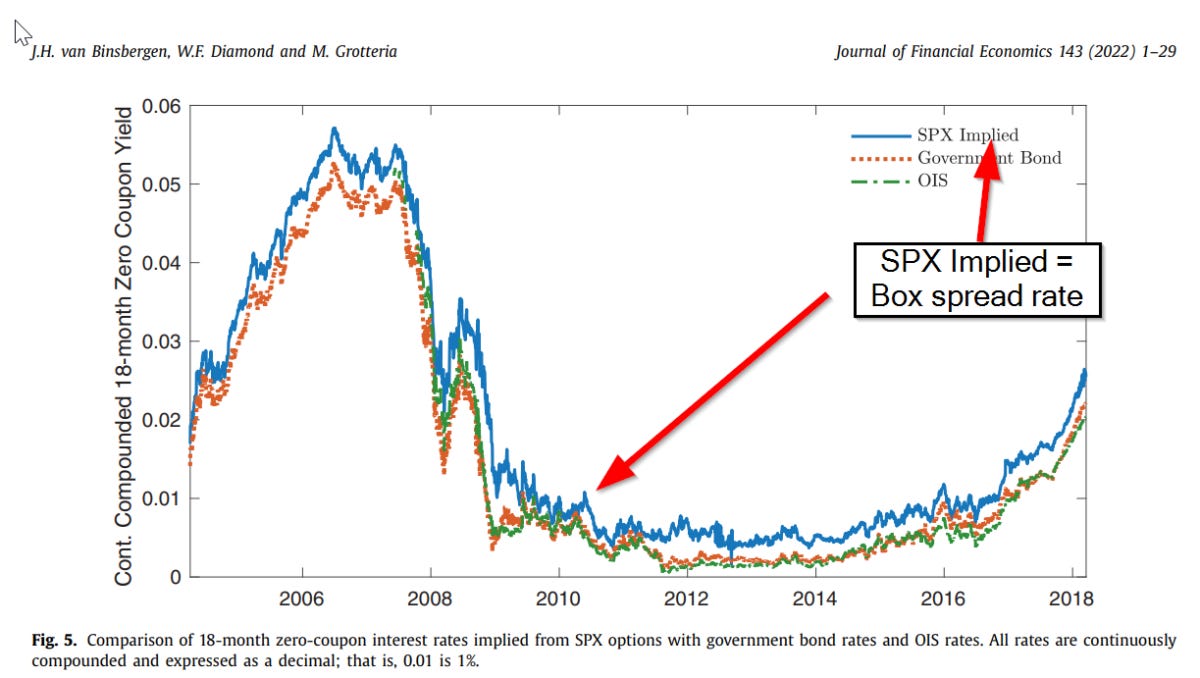
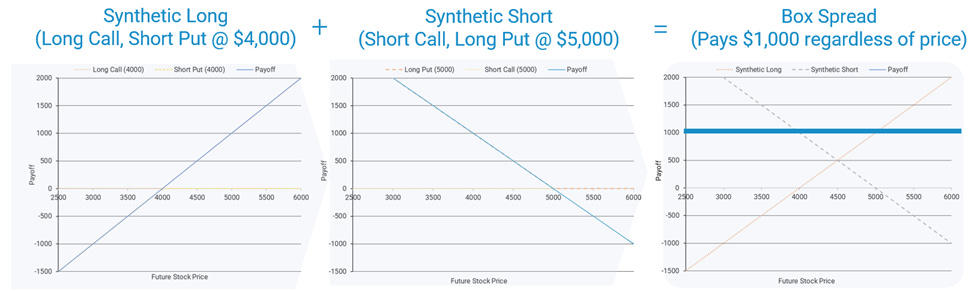
One efficient structure for safeguarding cash is the box spread, which offers several key benefits: a convenience yield, capital efficiency (especially for users of portfolio margin), easy execution via most retail brokers, and favorable tax treatment—60% long-term and 40% short-term if executed using cash-settled index options (e.g., SPX). This strategy combines a bull call spread and a bear put spread, matching lower and higher strikes and the same expiration date.

We frequently trade such structures. For instance, here’s one we purchased at the beginning of this year: BOT +1 IRON CONDOR SPX 100 (Quarterlys) 31 DEC 25 4000/7100/7100/4000 CALL/PUT @2964.25 CBOE

In this case, we invest $296,425 now to receive $310,000 in a year. This represents an implied interest rate of 5.32% or ((3100-2964.25)/2964.25)*(365/314)=0.053234. Note that there is a convenience yield, and that’s due to counterparty risk, as box spreads depend on the Options Clearing Corporation (OCC) to guarantee the transaction.

Tools like boxtrades.com help with tracking yields and finding attractive box structures.

Graphic: Retrieved via Alpha Architect.

Box trades unlock the power of yield stacking, enhancing returns by layering multiple exposures without increasing capital outlay. They preserve full buying power with portfolio margin for margin-intensive trades like synthetic longs.

For non-portfolio margin traders, yield stacking is less applicable. Instead, you can allocate ~95% of cash to box spreads, locking in your principal at maturity while risking only ~5% (the interest you stand to make), with limited downside.

Graphic: Retrieved from Cboe Global Markets.

#2 – Upside

Low correlation and subdued implied volatility signal stability, but any disruption could spark sharp moves.

As we explained better in Reality Is Path-Dependent, Cem Karsan notes that a slow grind higher cheapens options, fueled by continued volatility selling. Eventually, realized upside volatility will surpass implied, prompting smart money to buy options at these discounts. If the VIX holds steady or rises, it suggests fixed-strike volatility is creeping up, potentially forcing options counterparties to cut exposure or hedge, boosting markets higher; increased call demand could push counterparties to hedge by buying the underlying asset, reinforcing stability and giving a floor to options prices and the market by that token.

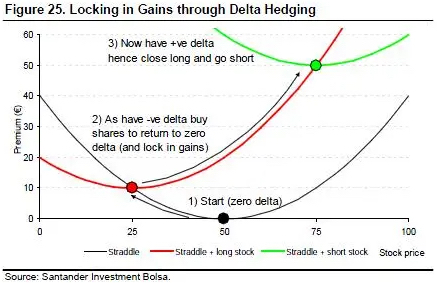
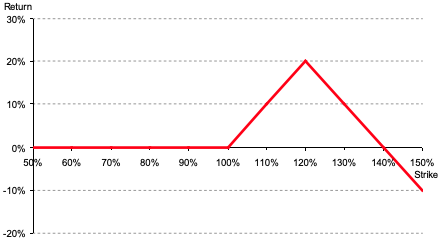
The play here? Replace stock exposure with options. You can buy calls outright and hedge them by selling stock—gains on the calls should outpace hedge losses. Karsan has talked about this a lot. One of our moves is to structure broken-wing butterflies or similar: buy an option near the money, sell a larger number of options further out, and cap risk with an even farther out option. In this environment, you can often put on these trades for little cost and exit at multiples higher if the market drifts sideways or up. Please see our website for case studies and example trades.

Don’t overlook crypto, either. Implied volatility remains underappreciated in bitcoin, making synthetic exposures compelling. Swapping spot for synthetic alternatives is a play on these opportunities. Though we haven’t touched them, check out Cboe’s cash-settled options on spot bitcoin: the Cboe Bitcoin US ETF Index (CBTX) and Cboe Mini Bitcoin US ETF Index (MBTX).

#3 – Hedging

Though less attractive now, VIX calls and call spreads remain a powerful tool for hedging tail risks. In our Reality Is Path-Dependent letter, we explore this topic further.

There are more compelling structures within the S&P 500 complex, particularly back spreads. For example, a put back spread involves selling a higher strike put option and buying a larger number of lower strike put options, positioning you to profit from substantial volatility shifts—similar to what we saw on August 5, 2024.

Although this structure takes advantage of the market’s unappealing volatility skew, drift presents challenges; if volatility fails to perform well during a downturn, you risk losing more money than you initially invested in the spread. Caution!

Graphic: Retrieved from Bloomberg via Goldman Sachs.

Bonus: From the White House to Wall Street

We had the opportunity to catch up with Steven Orr, founder of Quasar Markets. We discussed his career and the future of fintech and trading technology. Before Quasar Markets, Orr worked as an executive at Money.net and Benzinga. He also serves on the board of the American Blockchain and Cryptocurrency Association. His diverse background includes positions with the White House, the U.S. State Department, the PGA Tour, the NBA, and various professional sports leagues. Orr frequently shares his insights on TV and appears at events like the World Economic Forum. Check it out, and thank you, Steven!


Disclaimer

By viewing our content, you agree to be bound by the terms and conditions outlined in this disclaimer. Consume our content only if you agree to the terms and conditions below.

Physik Invest is not registered with the US Securities and Exchange Commission or any other securities regulatory authority. Our content is for informational purposes only and should not be considered investment advice or a recommendation to buy or sell any security or other investment. The information provided is not tailored to your financial situation or investment objectives.

We do not guarantee the accuracy, completeness, or timeliness of any information. Please do not rely solely on our content to make investment decisions or undertake any investment strategy. Trading is risky, and investors can lose all or more than their initial investment. Hypothetical performance results have limitations and may not reflect actual trading results. Other factors related to the markets and specific trading programs can adversely affect actual trading results. We recommend seeking independent financial advice from a licensed professional before making investment decisions.

We don’t make any claims, representations, or warranties about the accuracy, completeness, timeliness, or reliability of any information we provide. We are not liable for any loss or damage caused by reliance on any information we provide. We are not liable for direct, indirect, incidental, consequential, or damages from the information provided. We do not have a professional relationship with you and are not your financial advisor. We do not provide personalized investment advice.

Our content is provided without warranties, is the property of our company, and is protected by copyright and other intellectual property laws. You may not be able to reproduce, distribute, or use any content provided through our services without our prior written consent. Please email renato@physikinvest for consent.

We reserve the right to modify these terms and conditions at any time. Following any such modification, your continued consumption of our content means you accept the modified terms. This disclaimer is governed by the laws of the jurisdiction in which our company is located.

Categories
Commentary

Daily Brief For January 9, 2023

Physik Invest’s Daily Brief is read by thousands of subscribers. You, too, can join this community to learn about the fundamental and technical drivers of markets.

Graphic updated 7:50 AM ET. Sentiment Risk-On if expected /ES open is above the prior day’s range. /ES levels are derived from the profile graphic at the bottom of this letter. Levels may have changed since initially quoted; click here for the latest levels. SqueezeMetrics Dark Pool Index (DIX) and Gamma (GEX) with the latter calculated based on where the prior day’s reading falls with respect to the MAX and MIN of all occurrences available. A higher DIX is bullish. At the same time, the lower the GEX, the more (expected) volatility. Click to learn the implications of volatility, direction, and moneyness. Breadth reflects a reading of the prior day’s NYSE Advance/Decline indicator. The CBOE VIX Volatility Index (INDEX: VVIX) measure reflects the attractiveness of owning volatility. Green means that owning volatility is attractive.

Administrative

In last week’s letters, we discussed, mainly, fundamental and positioning contexts. Today’s letter will add to the discussion on the positioning.

Positioning

Last week, for an article published on Benzinga.com over the weekend, your letter writer spoke with The Ambrus Group’s co-chief investment officer Kris Sidial. Shared were the things to look out for in 2023 and tips for newer traders. The article can be viewed here, at this link.

In short, there are four big takeaways. 

First, though options prices could stay under pressure, naive measures like the VVIX, which is the volatility of the VIX, or the volatility of the S&P 500’s volatility, are printing at levels last seen in 2017. This means “we can get cheap exposure to convexity while a lot of people are worried.”

Graphic: Retrieved from TradingView. Cboe Volatility Index (INDEX: VIX) is on the top. The volatility of the VIX itself (INDEX: VVIX) is at the bottom.

Second, on the other side of the growing S&P 500 and VIX complexes is a small concentrated group of market makers taking on far more exposure to risk. 

Graphic: Retrieved from Ambrus’ publicly available research.

During moments of stress, these market makers may be “unable to keep up with the demands of frenetic investors,” Sidial said, pointing to GameStop Corporation (NYSE: GME) where “there was this reflexive dynamic” that helped push the stock higher in 2021.

“That same dynamic can happen on the way down”; market makers will mark up options prices during intense selling. As the options prices rise, options deltas (i.e., their exposure to direction) rise and this prompts so-called bearish vanna hedging flows.

Graphic: Retrieved from Ambrus’ publicly available research.

“Imagine a scenario where [some disaster happens] and everybody starts buying 0 DTE puts. That’s going to reflexively drive the S&P lower,” Sidial said. “Take, for example, the JPMorgan collar position that clearly has an effect on the market, and people are starting to understand that effect. That’s just one fund. Imagine the whole derivative ecosystem” leaning one way.

Graphic: Retrieved from Ambrus’ publicly available research.

The third is in reference to liquidity. As private market investors’ “deals are getting marked down, [t]o source liquidity, they may have to sell some of their holdings in the public equity markets.” Benn Eifert, the CIO at QVR Advisors, recently put forth that “late-stage technology is a great example where public comps are down 80-90% but privates marked down 20% or not at all. It is possible to imagine large institutions engaging in forced selling of liquid public equities to meet capital calls in private fund investments.”

And, lastly, investors often go “back and forth” and do not stick to a strict process. In trying to pick what will work at one specific time, investors can “miss what is going to work in the future.” Consequently, Sidial says investors should have an outlook and process to express that outlook. “It’s not as easy as saying: ‘Buy volatility because it’s cheap or sell it because it is expensive.’” 

As a validation, in the Benzinga article, your letter writer wrote about 2017 when volatility was at some of its lowest levels. Back then, the correct trade was to sell volatility, in some cases, due to volatility’s bimodality; if you sold volatility back then, you made money due to its clustering.

Graphic: Retrieved from TradingView. Cboe Volatility Index (INDEX: VIX) is on the top. Cboe Realized Volatility (INDEX: RVOL) is at the bottom.

So, “if you’re trading volatility, let there be an underlying catalyst for doing so.” That said, from a “risk-to-reward perspective, … it’s a better bet to be on the long volatility side,” given “that there are so many things that … keep popping up” from a macro perspective.

For Ambrus’ publicly available research, click here. Also, follow Sidial on Twitter, here. Consider reading your letter writer’s past two conversations with Sidial, as well. Here is an article on 2021 and the meme stock debacle. Here is another article talking more about Ambrus’ processes.

Technical

As of 7:50 AM ET, Monday’s regular session (9:30 AM – 4:00 PM ET), in the S&P 500, is likely to open in the upper part of a positively skewed overnight inventory, outside of prior-range and -value, suggesting a potential for immediate directional opportunity.

Our S&P 500 pivot for today is $3,926.50. 

Key levels to the upside include $3,943.25, $3,960.25, and $3,979.75.

Key levels to the downside include $3,908.25, $3,891.00, and $3,874.25.

Click here to load today’s key levels into the web-based TradingView platform. All levels are derived using the 65-minute timeframe. New links are produced, daily. 

As a disclaimer, note the S&P 500 could trade beyond the levels quoted in the letter. Therefore, you should load the key levels on your browser.

Graphic: 65-minute profile chart of the Micro E-mini S&P 500 Futures.

Definitions

Volume Areas: Markets will build on areas of high-volume (HVNodes). Should the market trend for long periods of time, it will be identified by low-volume areas (LVNodes). LVNodes denote directional conviction and ought to offer support on any test.

If participants auction and find acceptance in an area of a prior LVNode, then future discovery ought to be volatile and quick as participants look to HVNodes for favorable entry or exit.

Vanna: The rate at which the Delta of an option changes with respect to implied volatility.

POCs: Denote areas where two-sided trade was most prevalent in a prior day session. Participants will respond to future tests of value as they offer favorable entry and exit.

MCPOCs: Denote areas where two-sided trade was most prevalent over numerous sessions. Participants will respond to future tests of value as they offer favorable entry and exit.


About

In short, an economics graduate working in finance and journalism.

Capelj spends most of his time as the founder of Physik Invest through which he invests and publishes daily analyses to subscribers, some of whom represent well-known institutions.

Separately, Capelj is an equity options analyst at SpotGamma and an accredited journalist interviewing global leaders in business, government, and finance.

Past works include conversations with investor Kevin O’Leary, ARK Invest’s Catherine Wood, FTX’s Sam Bankman-Fried, Lithuania’s Minister of Economy and Innovation Aušrinė Armonaitė, former Cisco chairman and CEO John Chambers, and persons at the Clinton Global Initiative.

Contact

Direct queries to renato@physikinvest.com or Renato Capelj#8625 on Discord.

Calendar

You may view this letter’s content calendar at this link.

Disclaimer

Do not construe this newsletter as advice. All content is for informational purposes.

Categories
Commentary

Daily Brief For November 15, 2022

Physik Invest’s Daily Brief is read by over 1,200 people. To join this community and learn about the fundamental and technical drivers of markets, subscribe below.

Graphic updated 9:00 AM ET. Sentiment Risk-On if expected /ES open is above the prior day’s range. /ES levels are derived from the profile graphic at the bottom of this letter. Levels may have changed since initially quoted; click here for the latest levels. SqueezeMetrics Dark Pool Index (DIX) and Gamma (GEX) with the latter calculated based on where the prior day’s reading falls with respect to the MAX and MIN of all occurrences available. A higher DIX is bullish. At the same time, the lower the GEX, the more (expected) volatility. Click to learn the implications of volatility, direction, and moneyness. Breadth reflects a reading of the prior day’s NYSE Advance/Decline indicator. VIX reflects a current reading of the CBOE Volatility Index (INDEX: VIX) from 0-100.

Fundamental

S&P Global Inc (NYSE: SPGI) put it really well in a recent update comparing today to the events of the mid-to-late 1630s. Dutch tulip bulbs traded as high as $750,000 per bulb (today’s money) before collapsing to near-zero.

That’s akin to what happened with the non-fungible token (NFT) craze of the late 2010s and early 2020s. Pictures of rocks sold for millions as recently as last year. Those pictures are worthless, now, and this has done a bit to dent the ecosystem’s apparent value, as well.

Graphic: Retrieved from Bank of America Corporation (NYSE: BAC) via @LanceRoberts.

What’s going on to cause this:

It’s basically the case that easy money policies enabled market participants to borrow and fund longer-duration bets on ideas with (potential) promise in the future.

Financial asset investments, too, were far more attractive, and that’s why we saw the asset inflation accelerate, followed by goods and services inflation that was bolstered by chokepoints and trends (e.g., deglobalization via supply chain security and geopolitics) and, ultimately, prompted policymakers to pivot.

FTX (CRYPTO: FTT) is among the victims of this pivot. It’s apparent that the events surrounding the collapse of crypto ecosystems months back prompted a so-called “credit crunch,” an insider close to FTX’s leadership explained.

“Many loaners suddenly recalled all of their loans just to see who was still liquid. Alameda lost a lot from giving out loans to firms [that] defaulted. Alameda was now, also, on the hook for money they didn’t have since they had given a lot of the loan money to FTX or had lost it loaning to now bankrupt counterparties. [Founder and CEO Sam Bankman-Fried] had two choices at this point, let Alameda get liquidated or send user money from FTX to ensure Alameda’s survival.”

Bankman-Fried, a massive risk taker at heart, chose the latter.

The repercussions include the following:

Apart from “strong governance and transparency [to] grow in importance as the cryptocurrency industry attempts to reassure investors and customers, … regulation of cryptocurrency markets, which was already a matter of serious debate, could accelerate,” SPGI explained, noting that some “other areas of the decentralized finance [or DeFi] market may be affected. And lastly, these contagion effects are unlikely to ripple into traditional finance [or TradFi].”

Check out Reuters (FTX bankruptcy filings in, French central bank wants quick regulation) and The Information (Startups should prepare for ‘second order fallout’ from FTX collapse).

Simplify Asset Management’s Michael W. Green (who we quoted in the past for his perspective and belief that we are in “a dot-com type collapse” that’s happened “underneath the surface of the indices which is [a result of] … passive flows supporting the largest stocks within the index, whereas the smaller stocks can be influenced to a greater extent by [] discretionary managers”) said a likely result is a Central Bank Digital Currency (CBDC) and an “almost certain … change in the monetary system,” echoing what Kai Volatility’s Cem Karsan said a long-time ago: “I don’t see … a clear window where cryptocurrency is not subject to constraints and I think it’s highly likely that we move towards a digital dollar.”

CBDCs are highly controversial per my chats with the likes of Edge & Node’s Tegan Kline. She said they could “be used as a mass surveillance tool. Leaders have done little to invalidate her beliefs given their recent discussions on, for example, using CBDCs to derive “carbon footprint.” 

That means having a read on where people are “traveling, how are they traveling, what are they eating, what are they consuming … This is something we’re working on,” leaders have put forth.

The point of this all is as follows:

As many may know, “there’s no ultimate buyer” in spaces like crypto and DeFi, as ex-Goldman Sachs Group Inc (NYSE: GS) emerging market FX and yield trader Seraphim Czecker, who is now heading risk and product management at Euler Labs, said

It’s that and the persistent interest in illiquid products that leave the door open to manipulation. Barring illiquidity, “if there’s a 10 or 15 standard deviation move, the liquidity will allow for … you [to] offload those assets quickly.

However, that’s not the widespread case.

“For example, look at what happened in the UK with the pension funds and margin calls. That is a classic DeFi strategy. You take your bonds and borrow cash against them. Then, you put it back into bonds and loop it a couple of times. That way, you have a leveraged interest rate exposure. That’s the same principle of lending staked Ethereum (CRYPTO: ETH), borrowing ETH, and doing it a couple of times.”

So, there may be “second order fallout” amid all this tightening. Markets, everywhere, are to de-rate. Ultimately, there’s probably a pivot to happen, in the future, with many leaders and strategists in finance unable to agree whether that (pivot) is the result of a recession.

“To take the foot off the brake right now and not finish the job, I think it’s the absolute worst mistake that the Fed could possibly make,” Citadel’s Ken Griffin said at the Bloomberg New Economy Forum in Singapore. In spite of Citadel seeing a recession averted, Griffin said: “I am finding it a bit hard to believe we are not going to have a recession at that point of time, sometime in the middle to back half of 2023,” adding this year finishes with “modest growth.”

Those in agreement include Stanley Druckenmiller, who once managed George Soros’ funds. “You don’t even need to talk about Black Swans to be worried here. To me, the risk-reward of owning assets doesn’t make a lot of sense,” Druckenmiller said

“When you make a mistake, you got to admit you’re wrong and move on that nine or 10 months, that [policymakers] just sat there and bought $120 billion in bonds,” he added. The “repercussions of that are going to be with us for a long, long time.”

Positioning

From a positioning perspective, much of what we’ve discussed in past notes is still true. Among others, Goldman Sachs Group Inc calculates up to $40 billion in buying over the next weeks with more than $80 billion of buying in an up market.

Graphic: Retrieved from @LanceRoberts. “Goldman calculates a whopping $38 billion to buy over the next week and substantially more (green line) if the market is up big. The chart below shows that the bank expects more than +$79 billion of net buying over the month.”

This is pursuant to our statements on the compression of implied volatility (evidenced by a shift lower in the term structure, particularly at the front end where options are most sensitive) compounding macro-type repositioning, with follow-on support coming from the reach for “Deltas and leverage” to the upside (call options)

Graphic: Retrieved from Goldman Sachs Group Inc (NYSE: GS).

As Alfonso Peccatiello of The Macro Compass puts it well: “incentive schemes drive people to be much more willing to pay and chase upside.” 

Preferred are “convex structures” that would benefit from rallies. 

However, in traders’ monetization of put protection they owned, as well as reach for upside calls (to not miss out on a potential reversal), skew is at its lows.

Graphic: Retrieved from The Ambrus Group’s Kris Sidial. “2017 is a year that is notorious for extremely low implied and realized vol. It is fascinating to see how insanely low the call-side volatility has been this year. There is low vol and then there is, in the gutter low vol.”

If the assumption is that “further tightening monetary policy and draining liquidity off the market might cause some problems down the road,” per Fabian Wintersberger, downside convexity (bets that trade non-linearly to changes in underlying price and volatility) are attractive.

Graphic: Retrieved from Banco Santander SA (NYSE: SAN).

Trades that may be attractive include collars, as well explained in a recent thread by IPS Strategic Capital’s Pat Hennessy. 

“[T]he combination of historically flat skew [and] the highest rates we’ve seen in 15 years makes longer dated collars an attractive trade for those who are worried about the performance of stocks over the next year but do not want to sell or try timing the market.”

Technical

As of 9:00 AM ET, Tuesday’s regular session (9:30 AM – 4:00 PM ET), in the S&P 500, is likely to open in the upper part of a positively skewed overnight inventory, outside of prior-range and -value, suggesting a potential for immediate directional opportunity.

Our S&P 500 pivot for today is $4,000.25. 

Key levels to the upside include $4,069.25, $4,136.75, and $4,231.00. 

Key levels to the downside include $3,965.25, $3,913.00, and $3,871.25.

Click here to load today’s key levels into the web-based TradingView platform. All levels are derived using the 65-minute timeframe. New links are produced, daily.

Graphic: 65-minute profile chart of the Micro E-mini S&P 500 Futures.

Definitions

Volume Areas: A structurally sound market will build on areas of high volume (HVNodes). Should the market trend for long periods of time, it will lack sound structure, identified as low volume areas (LVNodes). LVNodes denote directional conviction and ought to offer support on any test. 

If participants were to auction and find acceptance into areas of prior low volume (LVNodes), then future discovery ought to be volatile and quick as participants look to HVNodes for favorable entry or exit.

POCs: POCs are valuable as they denote areas where two-sided trade was most prevalent in a prior day session. Participants will respond to future tests of value as they offer favorable entry and exit.

MCPOCs: POCs are valuable as they denote areas where two-sided trade was most prevalent over numerous day sessions. Participants will respond to future tests of value as they offer favorable entry and exit.

About

After years of self-education, strategy development, mentorship, and trial-and-error, Renato Leonard Capelj began trading full-time and founded Physik Invest to detail his methods, research, and performance in the markets. 

Capelj also develops insights around impactful options market dynamics at SpotGamma and is a Benzinga journalist.

His works include private discussions with ARK Invest’s Catherine Wood, investors Kevin O’Leary and John Chambers, the infamous Sam Bankman-Fried of FTX, ex-Bridgewater Associate Andy Constan, Kai Volatility’s Cem Karsan, The Ambrus Group’s Kris Sidial, the Lithuanian Delegation’s Aušrinė Armonaitė, among many others.

Contact

Direct queries to renato@physikinvest.com or Renato Capelj#8625 on Discord.

Disclaimer

Do not construe this newsletter as advice. All content is for informational purposes.

Categories
Commentary

Daily Brief For July 27, 2022

The daily brief is a free glimpse into the prevailing fundamental and technical drivers of U.S. equity market products. Join the 600+ that read this report daily, below!

Graphic updated 6:55 AM ET. Sentiment Risk-On if expected /ES open is above the prior day’s range. /ES levels are derived from the profile graphic at the bottom of the following section. Levels may have changed since initially quoted; click here for the latest levels. SqueezeMetrics Dark Pool Index (DIX) and Gamma (GEX) calculations are based on where the prior day’s reading falls with respect to the MAX and MIN of all occurrences available. A higher DIX is bullish. At the same time, the lower the GEX, the more (expected) volatility. Learn the implications of volatility, direction, and moneyness. Breadth reflects a reading of the prior day’s NYSE Advance/Decline indicator. VIX reflects a current reading of the CBOE Volatility Index (INDEX: VIX) from 0-100.

Fundamental

We shall unpack details from the Federal Open Market Committee (FOMC) event in the coming sessions, stay tuned.

Positioning

As of 6:40 AM ET, Wednesday’s expected volatility, via the Cboe Volatility Index (INDEX: VIX), sits at ~1.27%. Net gamma exposures lightly decreasing may promote larger trading ranges.

Graphic: Via Physik Invest. Data retrieved from SqueezeMetrics.

Should fears with respect to the Federal Open Market Committee (FOMC) announcement be assuaged, then compression in volatility may do more to support current equity price levels.

Graphic: Updated July 26, 2022. Retrieved from Interactive Brokers Group Inc’s (NASDAQ: IBKR) Trader Workstation. Posted by SpotGamma. Short-dated, pre-FOMC, volatility is sold. Longer-dated, post-FOMC volatility is bid. “Traders have likely shorting implied volatility for pre-FOMC expirations which has been supportive of equities.”

Notwithstanding, let’s unpack some trends and how they may feed into a volatility “untethering.”

In the Daily Brief for March 31, 2022, we discussed participants’ aversion to selling short-term variance. This, which did more to assuage our fear of crash risk, as well explained in the Daily Brief for March 30, 2022, was, in part, the result of COVID-era volatility that forced participants, out on the risk curve, to deleverage en masse.

As stated in March, per Banco Santander SA’s (NYSE: SAN) research, the “supply of volatility remains very subdued in a trend that has continued since the pandemic.”

“We did observe some activity in 4Q21 and 1Q this year, but almost all of that was unwinding of existing positions from earlier, and these were not new trades.”

Graphic: Via Goldman Sachs Group Inc (NYSE: GS).

However, despite all of the “uncertainty from geopolitics and central banks,” we still saw broad equity implied volatility (IVOL) measures subdued, relative to those in rates and FX.

Graphic: Retrieved from QVR Advisors’ Benn Eifert.

Let’s unpack that muted response, further.

Well, as explained in the Daily Brief for July 21, 2022, heading into the 2022 decline, institutions repositioned and hedged, even allocating to “commodity trend following,” per our Daily Brief for July 15, 2022, which worked well the first two quarters.

The monetization and counterparty hedging of existing customer hedges, as well as the sale of short-dated volatility, particularly in some of the single names where there was “rich” volatility, into the fall, lent to lackluster performance in implied volatility and index mean reversion.

Graphic: Retrieved from Rob Emrich III. Via Goldman Sachs Group Inc (NYSE: GS).

This trend is set to come to an end as entities are squeezed out of trades that aren’t working (i.e., participants rotate out of volatility and commodities).

Graphic: Retrieved from SpotGamma. S&P 500 $3,500.00 put option values. “Like with the Boy Who Cried Wolf, people grew tired of false alarms. This year put buyers have been waiting for the wolf, but after June OPEX the villagers stopped listening.”

Per Kai Volatility’s Cem Karsan, as “volatility itself, on the equity side, becomes less and less hedged on the customer level, … [the] market can really begin to respond to the core macro factors.”

Should markets experience a shock, or trade substantially lower, the demand for hedges may result in an “untethering” in implied volatility, which was “one of the most supportive things into the decline,” Karsan said, adding that now is the best time to rotate into call options which are outperforming “their delta to the upside.”

Graphic: Time-lapse skew on the S&P 500 (INDEX: SPX) for July 25 and July 26, 2022. Retrieved from Interactive Brokers Group Inc’s (NASDAQ: IBKR) Trader Workstation.

Accordingly, given the macro risk, IVOL is likely at a lower bound and, per The Ambrus Group’s Kris Sidial, “if you wanted to go out and hedge, the opportunity is still there in the equity space.”

Technical

As of 6:30 AM ET, Wednesday’s regular session (9:30 AM – 4:00 PM ET), in the S&P 500, is likely to open in the upper part of a positively skewed overnight inventory, just outside of prior-range and -value, suggesting a potential for immediate directional opportunity.

In the best case, the S&P 500 trades higher.

Any activity above the $3,961.25 MCPOC puts into play the $3,997.00 VPOC. Initiative trade beyond the VPOC could reach as high as the $4,016.25 HVNode and $4,055.25 LVNode, or higher.

In the worst case, the S&P 500 trades lower.

Any activity below the $3,961.25 MCPOC puts into play the $3,921.00 VPOC. Initiative trade beyond the VPOC could reach as low as the $3,909.25 MCPOC and $3,867.25 LVNode, or lower.

Click here to load today’s key levels into the web-based TradingView charting platform. Note that all levels are derived using the 65-minute timeframe. New links are produced, daily.
Graphic: 65-minute profile chart of the Micro E-mini S&P 500 Futures.

Definitions

Volume Areas: A structurally sound market will build on areas of high volume (HVNodes). Should the market trend for long periods of time, it will lack sound structure, identified as low volume areas (LVNodes). LVNodes denote directional conviction and ought to offer support on any test. 

If participants were to auction and find acceptance into areas of prior low volume (LVNodes), then future discovery ought to be volatile and quick as participants look to HVNodes for favorable entry or exit.

POCs: POCs are valuable as they denote areas where two-sided trade was most prevalent in a prior day session. Participants will respond to future tests of value as they offer favorable entry and exit.

MCPOCs: POCs are valuable as they denote areas where two-sided trade was most prevalent over numerous day sessions. Participants will respond to future tests of value as they offer favorable entry and exit.

Volume-Weighted Average Prices (VWAPs): A metric highly regarded by chief investment officers, among other participants, for quality of trade. Additionally, liquidity algorithms are benchmarked and programmed to buy and sell around VWAPs.

About

After years of self-education, strategy development, mentorship, and trial-and-error, Renato Leonard Capelj began trading full-time and founded Physik Invest to detail his methods, research, and performance in the markets.

Capelj also develops insights around impactful options market dynamics at SpotGamma and is a Benzinga reporter.

Some of his works include conversations with ARK Invest’s Catherine Wood, investors Kevin O’Leary and John Chambers, FTX’s Sam Bankman-Fried, ex-Bridgewater Associate Andy Constan, Kai Volatility’s Cem Karsan, The Ambrus Group’s Kris Sidial, among many others. 

Disclaimer

In no way should the materials herein be construed as advice. Derivatives carry a substantial risk of loss. All content is for informational purposes only.

Categories
Commentary

Daily Brief For July 21, 2022

The daily brief is a free glimpse into the prevailing fundamental and technical drivers of U.S. equity market products. Join the 300+ that read this report daily, below!

Graphic updated 6:30 AM ET. Sentiment Neutral if expected /ES open is inside of the prior day’s range. /ES levels are derived from the profile graphic at the bottom of the following section. Levels may have changed since initially quoted; click here for the latest levels. SqueezeMetrics Dark Pool Index (DIX) and Gamma (GEX) calculations are based on where the prior day’s reading falls with respect to the MAX and MIN of all occurrences available. A higher DIX is bullish. At the same time, the lower the GEX, the more (expected) volatility. Learn the implications of volatility, direction, and moneyness. Breadth reflects a reading of the prior day’s NYSE Advance/Decline indicator. VIX reflects a current reading of the CBOE Volatility Index (INDEX: VIX) from 0-100.

Note: Looking back, yesterday’s letter was “eh” to put it simply.

So, here’s a discussion in the positioning section that tidies up some of the past analyses we’ve made. Also, I will be off Friday, July 22, 2022, through to Tuesday, July 26, 2022. 

Thank you for all the support and I look forward to hitting next week, hard, with you! Take care!

Positioning

As of 6:30 AM ET, Thursday’s expected volatility, via the Cboe Volatility Index (INDEX: VIX), sits at ~1.25%. Net gamma exposures increasing may help tighten equity index ranges.

Graphic: Via Physik Invest. Data retrieved from SqueezeMetrics.

Given where realized (RVOL) and implied (IVOL) volatility measures are, as well as skew, it is beneficial to be a buyer of short-dated complex options structures (e.g., low-cost call ratios) that are short those options that have the most to lose in an SPX up, VIX down environment.

Graphic: Via Physik Invest. Data retrieved from the Cboe and TradingView.

The reason why? 

Kai Volatility’s Cem Karsan explained it well in a conversation he had with the Charles Schwab Inc-owned (NYSE: SCHW) TD Ameritrade Network.

Heading into the 2022 decline, institutions were well hedged. Their monetization of hedges, as well as the demand for certain equity options structures (and the hedging of them) into the fall, lent to supply and compressed volatility on a fixed strike basis, relative to that in other markets.

Graphic: Retrieved from QVR Advisors’ Benn Eifert.

Volatility supply, coupled with the lower liquidity environment, results in hedging pressures that (matter more) and lend to index mean reversion which Karsan posits may be coming to an end.

Graphic: Retrieved from Goldman Sachs Group Inc (NYSE: GS).

In validating his thesis, Karsan pointed to fixed strike volatility jumping in spite of the equity rally.

Graphic: Time-lapse skew on the S&P 500 (INDEX: SPX) for July 18 and July 19, 2022. Retrieved from Interactive Brokers Group Inc’s (NASDAQ: IBKR) Trader Workstation.

“This is the beginning of an untethering,” he explained. “If we see a rally here, IVOL will likely increase on a fixed strike basis. If that does, that will continue to untether index volatility which has been one of the most supportive things into the decline.”

For context, on the latter remark, when volatility is supplied by the customer, the counterparty, which is on the other side, has exposure to long volatility. All else equal, on directional moves, long volatility positions will reprice for the counterparty favorably.

To re-hedge, the counterparty will buy weakness (against increased negative delta) and sell strength (against increased positive delta). Below is a naive example of the effects of delta hedging a straddle on profit and loss.

Graphic: Retrieved from Banco Santander SA (NYSE: SAN).

Moreover, these shifts are suggestive of weakening market support, in the face of a macro and geopolitical environment that’s not improving. Quantitative tightening (QT), which is “the direct input of capital to capital markets” is set to double on September 1, 2022, all the while there is likely to be compression on earnings, and a break up in risk premiums across markets.

The “tail risks are building” and no longer is volatility likely to be pinned by (1) sentiment and positioning, as well as (2) hedging on the equity volatility side, Karsan added.

Graphic: Shared by Benn Eifert of QVR Advisors.

“As you squeeze entities out on the upside of that short positioning, and volatility itself, on the equity side, becomes less and less hedged on the customer level, which we’re beginning to see, the market can really begin to respond to the core macro factors.”

With a more volatile second leg down in play, Karsan says higher prices, in spite of small blips in IVOL on a fixed strike basis, will offer participants an opportunity to “add to volatility hedges.”

Likewise, with call options outperforming “their delta to the upside,” it makes much sense to replace static equity long exposure with that which is dynamic.

“The bare minimum, if you’re long equities, is to be expressing that in calls,” Karsan ends. S&P 500 calls are at a “17.5 and 18 volatility. If we continue to slide, the VIX [likely won’t] slide below 20 in this environment, given the macro risk.”

Technical

As of 6:30 AM ET, Thursday’s regular session (9:30 AM – 4:00 PM ET), in the S&P 500, is likely to open in the middle part of a balanced overnight inventory, inside of prior-range and -value, suggesting a limited potential for immediate directional opportunity.

In the best case, the S&P 500 trades higher.

Any activity above the $3,943.25 HVNode puts into play the $3,982.75 LVNode. Initiative trade beyond the LVNode could reach as high as the $4,016.25 HVNode and $4,055.25 LVNode, or higher.

In the worst case, the S&P 500 trades lower.

Any activity below the $3,943.25 HVNode puts into play the $3,909.25 MCPOC. Initiative trade beyond the MCPOC could reach as low as the $3,867.25 LVNode and $3,829.75 MCPOC, or lower.

Click here to load today’s key levels into the web-based TradingView charting platform. Note that all levels are derived using the 65-minute timeframe. New links are produced, daily.
Graphic: Updated July 20, 2022. 65-minute profile chart of the Micro E-mini S&P 500 Futures.

Definitions

Volume Areas: A structurally sound market will build on areas of high volume (HVNodes). Should the market trend for long periods of time, it will lack sound structure, identified as low volume areas (LVNodes). LVNodes denote directional conviction and ought to offer support on any test. 

If participants were to auction and find acceptance into areas of prior low volume (LVNodes), then future discovery ought to be volatile and quick as participants look to HVNodes for favorable entry or exit.

POCs: POCs are valuable as they denote areas where two-sided trade was most prevalent in a prior day session. Participants will respond to future tests of value as they offer favorable entry and exit.

MCPOCs: POCs are valuable as they denote areas where two-sided trade was most prevalent over numerous day sessions. Participants will respond to future tests of value as they offer favorable entry and exit.

Volume-Weighted Average Prices (VWAPs): A metric highly regarded by chief investment officers, among other participants, for quality of trade. Additionally, liquidity algorithms are benchmarked and programmed to buy and sell around VWAPs.

About

After years of self-education, strategy development, mentorship, and trial-and-error, Renato Leonard Capelj began trading full-time and founded Physik Invest to detail his methods, research, and performance in the markets.

Capelj also develops insights around impactful options market dynamics at SpotGamma and is a Benzinga reporter.

Some of his works include conversations with ARK Invest’s Catherine Wood, investors Kevin O’Leary and John Chambers, FTX’s Sam Bankman-Fried, ex-Bridgewater Associate Andy Constan, Kai Volatility’s Cem Karsan, The Ambrus Group’s Kris Sidial, among many others.

Disclaimer

In no way should the materials herein be construed as advice. Derivatives carry a substantial risk of loss. All content is for informational purposes only.

Categories
Commentary

Daily Brief For July 15, 2022

The daily brief is a free glimpse into the prevailing fundamental and technical drivers of U.S. equity market products. Join the 300+ that read this report daily, below!

Graphic updated 6:35 AM ET. Sentiment Neutral if expected /ES open is inside of the prior day’s range. /ES levels are derived from the profile graphic at the bottom of the following section. Levels may have changed since initially quoted; click here for the latest levels. SqueezeMetrics Dark Pool Index (DIX) and Gamma (GEX) calculations are based on where the prior day’s reading falls with respect to the MAX and MIN of all occurrences available. A higher DIX is bullish. At the same time, the lower the GEX, the more (expected) volatility. Learn the implications of volatility, direction, and moneyness. Breadth reflects a reading of the prior day’s NYSE Advance/Decline indicator. VIX reflects a current reading of the CBOE Volatility Index (INDEX: VIX) from 0-100.

Fundamental

Note: A really interesting discussion in the below positioning section which tidies up some of the past analyses we’ve made. Read on for more!

Ahead are updates on retail sales, import prices, Empire State Manufacturing (8:30 AM ET), industrial production and capacity utilization (9:15 AM ET), as well as University of Michigan consumer sentiment and inflation expectations, and business inventories (10:00 AM ET).

This week, markets repriced after data on inflation came in hot. Participants have bet on tough action from the Federal Reserve (Fed). Now, there is a near-50% chance of a 100 basis point hike later in July.

Graphic: Via CME Group Inc’s (NASDAQ: CME) FedWatch Tool.

Per The Macro Compass, published by Alfonso Peccatiello, companies have downgraded their outlooks and job creation “is much less impressive” amid labor force shrinkage.

“[T]he number of total employed people in the US divided by its total population in the 25-54y age bracket dropped below 80%,” he explains. “Over the last 30 years, at the peak of each economic cycle, this ratio was over 80%.”

Accordingly, earnings “are nowhere near pricing the economic slowdown, … [and there still remains] way too much optimism.”

Graphic: Retrieved from The Market Ear. Via Barclays Plc (NYCE: BCS).

Additionally, commodities (even more so those that are industrial and “are the cleanest expression of global demand”) have endured selling pressure with a near 30% copper drawdown likely to precede positive total returns for long bonds, Peccatiello explains.

Graphic: Retrieved from Callum Thomas. With “[r]ecessions see[ing] oil prices fall by 20% to 70%, … being bullish on oil at this point is either betting against history or [] recession.”

Positioning

The drawdown in commodities is significant as that was, arguably, the last place that offered participants a hedge against their poorly performing bond and equity exposures. 

“A lot of people allocated to commodity trend following and that did a good job in the first two quarters,” The Ambrus Group’s Kris Sidial explained

“CTAs were performing and you had a lot of people who did not need to buy [equity] volatility because their portfolios were covered from the inflation hedges.”

Graphic: Shared by Benn Eifert of QVR Advisors.

That, coupled with the sale of ultra-short-dated volatility, particularly in some of the single names to capture “rich” volatility, as well as hedging of structured products issuances, continues to play into suppressed index volatility.

For context: Rising rates and a drive for yield have been a boon for exotic derivatives. 

Participants often seek exposure to products that are essentially short volatility a year or so out. The counterparty, here, is long volatility on these notes. To hedge risk – since “you can’t just be long volatility, … [otherwise] you’ll bleed money for long periods of time” – the bank will hedge risk in the listed market. 

However, on a one-year auto-callable, for which it would be appropriate to sell one-year volatility in the listed market, “some of these banks … create this synthetic calendar profile where they’re … sell[ing] a little bit of one-month vol because they can take in that theta a whole lot faster, or two- and three-month vol,” spreading exposure in buckets.

See, here, for a sample presentation on what is an Auto-Callable Yield Note.

This suppresses “vol in the front of the term structure, and … opens up the door to … that other move where if everybody is selling vol in the front of the term structure,” it may blow out on a large increase in demand.

“If you look back during COVID, there are articles about banks that lost a lot of money because of the[ir] hedges. This has happened previously and you’re seeing little blips of it start to” return.
Graphic: Retrieved from The Ambrus Group’s Kris Sidial. “[S]ome dealers will opportunistically look to sell vol in some buckets in the front of the term structure.”

Basically, “the macro landscape … opened up another area to hedge” which resulted in the increased movement of realized equity (RVOL) volatility, relative to that which is implied (IVOL).

Graphic: Via S&P Global Inc (NYSE: SPGI). As explained by SpotGamma, “30-day realized SPX volatility is now trading above the VIX, something that generally shows after major selloffs wherein IV “premium” needs to reset to calmer/higher equity markets.”

Now, with commodities not offering protection, one has to be concerned if “the flock move[s].”

“If commodities are not performing, they’re not going to work as a hedge for your portfolio. That opens the door … [to] markets sliding lower and [people] need[ing] to get hedges on,” which is likely to bid equity volatility where some single names “are only trading three to four vol points above where they were trading in January of 2020,” the complete dismissal of a crash.

Therefore, “if you wanted to go out and hedge, the opportunity is still there in the equity space.”

Technical

As of 6:30 AM ET, Friday’s regular session (9:30 AM – 4:00 PM ET), in the S&P 500, is likely to open in the middle part of a balanced overnight inventory, inside of prior-range and -value, suggesting a limited potential for immediate directional opportunity.

In the best case, the S&P 500 trades higher.

Any activity above the $3,807.00 VPOC puts into play the $3,830.75 MCPOC. Initiative trade beyond the MCPOC could reach as high as the $3,867.25 LVNode and $3,909.25 MCPOC, or higher.

In the worst case, the S&P 500 trades lower.

Any activity below the $3,807.00 VPOC puts into play the $3,770.75 HVNode. Initiative trade beyond the HVNode could reach as low as the $3,751.00 VPOC and $3,722.50 LVNode, or lower.

Click here to load today’s key levels into the web-based TradingView charting platform. Note that all levels are derived using the 65-minute timeframe. New links are produced, daily.
Graphic: 65-minute profile chart of the Micro E-mini S&P 500 Futures.

Considerations: Responsiveness near key-technical areas (that are discernable visually on a chart), suggests technically-driven traders with short time horizons are very active. 

Such traders often lack the wherewithal to defend retests and, additionally, the type of trade may be indicative of the other time frame participants waiting for more information to initiate trades.

Definitions

Volume Areas: A structurally sound market will build on areas of high volume (HVNodes). Should the market trend for long periods of time, it will lack sound structure, identified as low volume areas (LVNodes). LVNodes denote directional conviction and ought to offer support on any test. 

If participants were to auction and find acceptance into areas of prior low volume (LVNodes), then future discovery ought to be volatile and quick as participants look to HVNodes for favorable entry or exit.

POCs: POCs are valuable as they denote areas where two-sided trade was most prevalent in a prior day session. Participants will respond to future tests of value as they offer favorable entry and exit.

MCPOCs: POCs are valuable as they denote areas where two-sided trade was most prevalent over numerous day sessions. Participants will respond to future tests of value as they offer favorable entry and exit.

Volume-Weighted Average Prices (VWAPs): A metric highly regarded by chief investment officers, among other participants, for quality of trade. Additionally, liquidity algorithms are benchmarked and programmed to buy and sell around VWAPs.

About

After years of self-education, strategy development, mentorship, and trial-and-error, Renato Leonard Capelj began trading full-time and founded Physik Invest to detail his methods, research, and performance in the markets.

Capelj also develops insights around impactful options market dynamics at SpotGamma and is a Benzinga reporter.

Some of his works include conversations with ARK Invest’s Catherine Wood, investors Kevin O’Leary and John Chambers, FTX’s Sam Bankman-Fried, former Bridgewater Associate Andy Constan, Kai Volatility’s Cem Karsan, The Ambrus Group’s Kris Sidial, among many others.

Disclaimer

In no way should the materials herein be construed as advice. Derivatives carry a substantial risk of loss. All content is for informational purposes only.

Categories
Commentary

Daily Brief For July 13, 2022

The daily brief is a free glimpse into the prevailing fundamental and technical drivers of U.S. equity market products. Join the 300+ that read this report daily, below!

Graphic updated 6:20 AM ET. Sentiment Neutral if expected /ES open is inside of the prior day’s range. /ES levels are derived from the profile graphic at the bottom of the following section. Levels may have changed since initially quoted; click here for the latest levels. SqueezeMetrics Dark Pool Index (DIX) and Gamma (GEX) calculations are based on where the prior day’s reading falls with respect to the MAX and MIN of all occurrences available. A higher DIX is bullish. At the same time, the lower the GEX, the more (expected) volatility. Learn the implications of volatility, direction, and moneyness. Breadth reflects a reading of the prior day’s NYSE Advance/Decline indicator. VIX reflects a current reading of the CBOE Volatility Index (INDEX: VIX) from 0-100.

Fundamental

Key for Wednesday, July 13, are inflation figures – the CPI report – as this will drive perceptions regarding future Fed activity.

Expected is an 8.8% rise year-over-year (YoY) and 1.1% month-over-month (MoM). In May, these numbers were 8.6% and 1.0%, respectively. 

Graphic: Via Bloomberg. “The national average price for a gallon of gasoline retreated to $4.66 as of July 11, a decline of 7% from an all-time high of $5.02 a gallon on June 13. But that is not as large as the fall in oil prices, because fuel manufacturing is in such short supply. Refining now accounts for 26% of the cost of a gallon of gasoline, up from 14%.”

Core CPI (which excludes food and energy) is expected to rise by a rate lower than in April, 5.7% YoY and 0.5% MoM, respectively.

Mattering most is core inflation, which the Fed has more control over. If lower than expected, that may warrant some appetite for risk.

“If I’m right about June being the start of a string of lower core CPI prints, which is what the Fed wants to see, then I think comments from officials will quickly switch to a 50 basis-point hike for September and there were more calls for slowing to 25 basis points late in the year,” said Omair Sharif, founder of Inflation Insights LLC. 

On the other hand, if “higher than expected, we’ll feel this is definitely the peak,” said Tom Simons, money market economist at Jefferies Financial Group (NYSE: JEF).

Positioning

Carrying forward our July 12 narratives, here.

We can speculate as to where the market may move next, after the release of inflation figures, this week. What’s likely is that, even if the print is hot, the first move is to be structural, per Kai Volatility’s Cem Karsan.

“A function of inevitable rebalancing of dealer inventory post-event. The second move and final resolution, if you wait for it, is usually tied to the incremental effects on liquidity (QE/QT).”

Graphic: Retrieved from CrossBorder Capital. The “evidence of the huge Global liquidity squeeze. This is a major policy blunder building.”

Rising inflation probably bolsters the Fed’s backing of a 75 basis point rate hike on July 27. So, don’t fight the Fed. Rising rates and the withdrawal of liquidity prompts a continued de-rate.

Graphic: Via Bloomberg. “Money markets are betting on a three quarter-percentage-point hike by Federal Reserve officials later this month, wagering the US will need to keep the screws on policy to tame inflation.”

Knowing this, the “flattening in the downside fixed strike skew, while the upside wings [are] more smiley,” as described by JPMorgan Chase & Co (NYSE: JPM), has made for attractive low-cost spread opportunities, as talked about yesterday and in the July 8, 2022 letter.

Graphic: Shared by Benn Eifert of QVR Advisors.

The moral is as follows: own volatility where the market is likely to not expire. Sell it where the market is likely to expire. Just because implied (IVOL) volatility is at a high starting point does not mean it should be sold, blindly.

Read: Explanations and Applications – Moontower on Gamma.

Technical

As of 6:20 AM ET, Wednesday’s regular session (9:30 AM – 4:00 PM ET), in the S&P 500, is likely to open in the middle part of a positively skewed overnight inventory, inside of prior-range and -value, suggesting a limited potential for immediate directional opportunity.

In the best case, the S&P 500 trades higher.

Any activity above the $3,830.75 MCPOC puts into play the $3,867.25 LVNode. Initiative trade beyond the LVNode could reach as high as the $3,909.25 MCPOC and $3,943.25 HVNode, or higher.

In the worst case, the S&P 500 trades lower.

Any activity below the $3,830.75 MCPOC puts into play the $3,800.25 LVNode. Initiative trade beyond the LVNode could reach as low as the $3,774.75 HVNode and $3,755.00 VPOC, or lower.

Click here to load today’s key levels into the web-based TradingView charting platform. Note that all levels are derived using the 65-minute timeframe. New links are produced, daily.
Graphic: Updated 7/12/2022. 65-minute profile chart of the Micro E-mini S&P 500 Futures.

Considerations: Responsiveness near key-technical areas (that are discernable visually on a chart), suggests technically-driven traders with short time horizons are very active. 

Such traders often lack the wherewithal to defend retests and, additionally, the type of trade may be indicative of the other time frame participants waiting for more information to initiate trades.

Definitions

Volume Areas: A structurally sound market will build on areas of high volume (HVNodes). Should the market trend for long periods of time, it will lack sound structure, identified as low volume areas (LVNodes). LVNodes denote directional conviction and ought to offer support on any test. 

If participants were to auction and find acceptance into areas of prior low volume (LVNodes), then future discovery ought to be volatile and quick as participants look to HVNodes for favorable entry or exit.

POCs: POCs are valuable as they denote areas where two-sided trade was most prevalent in a prior day session. Participants will respond to future tests of value as they offer favorable entry and exit.

MCPOCs: POCs are valuable as they denote areas where two-sided trade was most prevalent over numerous day sessions. Participants will respond to future tests of value as they offer favorable entry and exit.

Volume-Weighted Average Prices (VWAPs): A metric highly regarded by chief investment officers, among other participants, for quality of trade. Additionally, liquidity algorithms are benchmarked and programmed to buy and sell around VWAPs.

About

After years of self-education, strategy development, mentorship, and trial-and-error, Renato Leonard Capelj began trading full-time and founded Physik Invest to detail his methods, research, and performance in the markets.

Capelj also develops insights around impactful options market dynamics at SpotGamma and is a Benzinga reporter.

Some of his works include conversations with ARK Invest’s Catherine Wood, investors Kevin O’Leary and John Chambers, FTX’s Sam Bankman-Fried, former Bridgewater Associate Andy Constan, Kai Volatility’s Cem Karsan, The Ambrus Group’s Kris Sidial, among many others.

Disclaimer

In no way should the materials herein be construed as advice. Derivatives carry a substantial risk of loss. All content is for informational purposes only.

Categories
Commentary

Daily Brief For July 6, 2022

The daily brief is a free glimpse into the prevailing fundamental and technical drivers of U.S. equity market products. Join the 300+ that read this report daily, below!

Graphic updated 6:25 AM ET. Sentiment Neutral if expected /ES open is inside of the prior day’s range. /ES levels are derived from the profile graphic at the bottom of the following section. Levels may have changed since initially quoted; click here for the latest levels. SqueezeMetrics Dark Pool Index (DIX) and Gamma (GEX) calculations are based on where the prior day’s reading falls with respect to the MAX and MIN of all occurrences available. A higher DIX is bullish. At the same time, the lower the GEX, the more (expected) volatility. Learn the implications of volatility, direction, and moneyness. Breadth reflects a reading of the prior day’s NYSE Advance/Decline indicator. VIX reflects a current reading of the CBOE Volatility Index (INDEX: VIX) from 0-100.

What To Expect

Fundamental: Impressive was the strength of the Nasdaq 100 (INDEX: NDX), relative to the S&P 500 (INDEX: SPX), yesterday. 

Graphic: Via Charles Schwab Corporation-owned (NYSE: SCHW) TD Ameritrade’s Thinkorswim. Retrieved by Physik Invest.

This is as traders are now paring back their bets on monetary tightening, given the deterioration in the U.S. economic outlook. The NDX, which has been most sensitive to changes in monetary policies, accordingly, responded best as that index is comprised of assets that have the most to lose in a high-rate, aggressive quantitative tightening (QT) environment.

Graphic: Via Bloomberg. “In less than two weeks, the market has dropped its prediction for a peak rate brought forward the moment of the first cut, and forecasts a far more aggressive cutting program that will start next spring.”

For context, QT is the central banking authorities’ removal of balance sheet assets via sales or the non-reinvestment of the principal sum of maturing securities. Accordingly, if bonds are sold, their values fall and yields rise. This pushes yield-hungry investors into less risky categories.

Graphic: Retrieved from @patrick_saner. “A 60/40 portfolio is now worth less than before the pandemic.”

“As you look at where to park your cash for the next six months, you could do worse than to look at a mix of oversold treasuries and stocks – offering both compelling yield and a good degree of value protection,” explains Toggle CEO Jan Szilagyi in a note.

Graphic: Via Toggle.

These are comments, however, in the face of what has been a “multiple compression,” as we talked about last week. The upcoming earnings season is likely to shed clarity with respect to corporates’ ability to weather or pass on higher costs, among other things.

In the case of a so-called “earnings compression,” some commentators suggest the market is not priced correctly and another leg lower may be initiated.

Adding, expected are the Federal Open Market Committee (FOMC) meeting minutes, today. 

They are likely to “indicate that policymakers were worried about the un-anchoring of inflation expectations, … justifying the Fed’s shift in placing more focus on headline inflation measures rather than just core measures,” according to Bloomberg’s chief U.S. economist Anna Wong.

Graphic: Via Bloomberg. “After surging consistently to hit an all-time high in the two years after the March 2020 shutdown, the [Commodity Research Bureau Raw Industrials index] turned sharply southward.”

Positioning: Data shows net gamma exposure increasing which may increasingly feed into smaller ranges if prices continue to rise.

Further, continued are gaps between volatility measures for the rates and equity markets. This is, in part, due to the supply of volatility, as we’ve talked about in past commentaries.

The Ambrus Group’s Kris Sidial adds: “Another reason why equity vol on the index level has been so well offered is due to the structured products market continuing its dominance.”

“Investors are turning to alternatives in this market & these solutions continue to gain attention which leads to index level vol selling.”

Graphic: Via The Ambrus Group’s Kris Sidial. “[S]ome dealers will opportunistically look to sell vol in some buckets in the front of the term structure.”

Given this, the relationship between realized volatility (RVOL) has crept and, at times, exceeded that which the market has implied (IVOL). This, coupled with naive metrics for skew, suggests to us that it still makes sense to be a buyer of volatility, albeit via more complex structures.

Graphic: Via Pat Hennessy. “Tomorrow’s SPX expo (Jul1) is wildin… 26 vol for any strike with a 37 or 38 handle with a ridiculous curvature in the tails. God speed to all the 1dte theta gang. Selling OTM puts/calls for the same vol as ATM seems… umm… not good.”

Technical: As of 6:30 AM ET, Wednesday’s regular session (9:30 AM – 4:00 PM ET), in the S&P 500, is likely to open in the mid-to-upper part of a balanced overnight inventory, inside of prior-range and -value, suggesting a potential for immediate directional opportunity.

In the best case, the S&P 500 trades higher.

Any activity above the $3,821.50 LVNode puts into play the $3,857.25 ONH. Initiative trade beyond the ONH could reach as high as the $3,883.25 LVNode and $3,909.25 MCPOC, or higher.

In the worst case, the S&P 500 trades lower.

Any activity below the $3,821.50 LVNode puts into play the $3,793.25 HVNode. Initiative trade beyond the HVNode could reach as low as the $3,755.00 VPOC and $3,727.75 HVNode, or lower.

Click here to load today’s key levels into the web-based TradingView charting platform. Note that all levels are derived using the 65-minute timeframe. New links are produced, daily.
Graphic: 65-minute profile chart of the Micro E-mini S&P 500 Futures.

Definitions

Overnight Rally Highs (Lows): Typically, there is a low historical probability associated with overnight rally-highs (lows) ending the upside (downside) discovery process.

Volume Areas: A structurally sound market will build on areas of high volume (HVNodes). Should the market trend for long periods of time, it will lack sound structure, identified as low volume areas (LVNodes). LVNodes denote directional conviction and ought to offer support on any test. 

If participants were to auction and find acceptance into areas of prior low volume (LVNodes), then future discovery ought to be volatile and quick as participants look to HVNodes for favorable entry or exit.

POCs: POCs are valuable as they denote areas where two-sided trade was most prevalent in a prior day session. Participants will respond to future tests of value as they offer favorable entry and exit.

About

After years of self-education, strategy development, mentorship, and trial-and-error, Renato Leonard Capelj began trading full-time and founded Physik Invest to detail his methods, research, and performance in the markets.

Capelj also develops insights around impactful options market dynamics at SpotGamma and is a Benzinga reporter.

Some of his works include conversations with ARK Invest’s Catherine Wood, investors Kevin O’Leary and John Chambers, FTX’s Sam Bankman-Fried, former Bridgewater Associate Andy Constan, Kai Volatility’s Cem Karsan, The Ambrus Group’s Kris Sidial, among many others.

Disclaimer

In no way should the materials herein be construed as advice. Derivatives carry a substantial risk of loss. All content is for informational purposes only.

Categories
Commentary

Daily Brief For June 14, 2022

The daily brief is a free glimpse into the prevailing fundamental and technical drivers of U.S. equity market products. Join the 300+ that read this report daily, below!

What Happened

Overnight, equity index futures auctioned sideways-to-higher, along with bonds, snapping the pricing in of tighter monetary policies and economic slowing.

Creeping up are expectations regarding the amount of tightening policymakers are to add. Treasury yields had their biggest jump in decades. U.S. 3-year Treasury yields, in particular, were up 25 basis points, to 3.49%, the highest since 2007, per Bloomberg.

Now, traders see nearly 200 basis points of tightening by the Federal Reserve’s (Fed) by September, as well as the possibility of a one-off 75 basis point hike. The overnight rate is expected to peak near 4% by mid-2023.

Accordingly, the U.S. and European real estate values have taken a hit amid rising rates and inflated prices, falling 5-10%. Rental demand has thinned, also. 

In other news, the U.S. sought to boost supplies of Russian fertilizer as “sanctions fears have led to a sharp drop in supplies, fueling spiraling global food costs.”

Graphic updated 6:30 AM ET. Sentiment Neutral if expected /ES open is inside of the prior day’s range. /ES levels are derived from the profile graphic at the bottom of the following section. Levels may have changed since initially quoted; click here for the latest levels. SqueezeMetrics Dark Pool Index (DIX) and Gamma (GEX) calculations are based on where the prior day’s reading falls with respect to the MAX and MIN of all occurrences available. A higher DIX is bullish. At the same time, the lower the GEX, the more (expected) volatility. Learn the implications of volatility, direction, and moneyness. SHIFT data used for S&P 500 (INDEX: SPX) options activity. Note that options flow is sorted by the call premium spent; if more positive, then more was spent on call options. Breadth reflects a reading of the prior day’s NYSE Advance/Decline indicator. VIX reflects a current reading of the CBOE Volatility Index (INDEX: VIX) from 0-100.

What To Expect

Fundamental: In what seems to be “a coordinated attempt to guide the market through trusted journalists,” recent updates on the path of inflation may push policymakers to surprise markets.

Graphic: Via Tier1Alpha. “A disappointing CPI suggested that calls for inflation peaks were premature and now markets are trying to interpret Powell’s (and Lagarde’s) true intentions.”

Markets reacted, accordingly, pricing in a near-certainty of a 75 basis point hike, later this week.

Graphic: Graphic: Via CME Group Inc’s (NASDAQ: CME) FedWatch Tool. In one session, participants priced in a near-certainty of a 75 basis point hike.

Looking into the future, Fed Funds target rates, based on the Fed Fund futures contract prices, are projected to peak into the mid-next year (Spring/Summer 2023).

Graphic: Via CME Group Inc’s FedWatch Tool

Accordingly, Treasury market turmoil continued with liquidity “worse than it was leading up to Lehman,” says Christian Hoffman, a portfolio manager for Thornburg Investment Management.

“That creates even more risk because if the market doesn’t have liquidity, it can gap down very quickly.”

Graphic: Via Bloomberg. Taken from @DonutShorts. This could “be a sign of another shortage of collateral and that another systemic risk event might come up in the future,” as Fabian Wintersberger well explained in his newsletter.

As talked about in past newsletters, pressures in the financial system, all the while the economy is slowing, are rising. This is amidst a dash for cash as fixed income and equity markets are not perceived to be as safe.

Graphic: Via Bloomberg. “Two-year US Treasury yields surged 29 basis points as bond prices tanked, … the biggest two-day increase since 2008, a sign of just how rapidly traders are adjusting where they think the Federal Reserve will take interest rates.”

“People are trying to process what’s behind these large moves,” Subadra Rajappa, head of U.S. rates strategy at Societe Generale SA (OTC: SCGLY), said. She attributes some of the volatility to poor liquidity, panic selling, and margin calls.

Ultimately, according to Bloomberg’s John Authers, this is a tantrum the Fed is likely to let “rip for a while” before, potentially, suffocating “with more easy money.”

“The relationship between central banks and bond markets is, as I’ve said before, a lot like that between a parent and an angry toddler. Indulging the bond market early last year might prove a critical mistake in losing parental authority for the Fed.”

Graphic: Via Morgan Stanley (NYSE: MS). Taken from The Market Ear. MS’s Mike Wilson says: “From our vantage point, both rates and ERP appeared to be mis-priced [and] we think the S&P 500 is headed toward 3,400 before a more tradable low is in.”

Positioning: Last night, as I wrote a report for SpotGamma’s subscribers, noteworthy is how “subdued” volatility was with, recently, “realized outpacing that which is implied by participants’ options activity.”

That dynamic resolved, Monday, as implied (IVOL) finally retook that which is realized (RVOL).

Read, also, the Daily Brief for Monday, June 13, 2022.

Graphic: Via Robson Chow.

Moreover, for much of the session, the equity markets were range-bound as most of the movement in both equity and volatility markets happened overnight. 

Graphic: SpotGamma’s Hedging Impact of Real-Time Options (HIRO) indicator for ES (SPX + SPY). Via SpotGamma, “Into weakness, participants mainly sold puts (a bullish trade). Into strength, they bought puts (a bearish trade). Throughout the session, too, there was light call buying (a bullish trade). This helps with understanding why the VIX moved much less during the day session.”

Noteworthy, was the absence of demand for protection that performs non-linearly with respect to changes in direction (delta) and volatility (vega).

“Fixed strike vols actually caught a bid, VIX futures are in backwardation,” The Ambrus Group’s Kris Sidial explains.

“However, that spot-vol relationship in the S&P still underperformed and skew was also lackluster.”

Graphic: Via TradingView. Taken by Physik Invest. The Cboe VVIX Index (INDEX: VVIX), the expected volatility of the 30-day forward price of the VIX, or the volatility of volatility (a naive but useful measure of skew), remains depressed, too, in comparison to the VIX, itself.

As said before, it is supply and demand dynamics that played into divergences between the volatility that the market realizes (RVOL) and that which is implied (IVOL). Participants are hedged and volatility remains well-supplied.

Was there to be forced selling and demand for protection en masse, we’d likely see that repricing in volatility we have been looking for.

To quote Benn Eifert of QVR Advisors: “Skew goes up if vol outperforms the skew curve a lot on a selloff.”

Graphic: Via Banco Santander SA (NYSE: SAN) research.

And so, to position for that, (although it is not as opportune as it was a week ago), it continues to make sense to own volatility structures (that, one, either sold very short-dated pre-FOMC and OPEX volatility to fund that which is farther-dated or, two, buy into implied skew convexity, non-linear with respect to delta [gamma] and vega [volga] changes).

Notwithstanding, per SpotGamma, a lower bound in the market is near $3,700.00. It is at this level options flows may shift from “inducing” to “reducing” volatility as, “beneath this level, all else equal, liquidity providers would have less and less pressure to add on further weakness.”

Ultimately, it is at higher levels of volatility that the marginal impact of further volatility compression is likely to do more to bolster equity market upside as liquidity providers buy back their negative delta hedges to positive delta (short put) exposures. 

SpotGamma’s founder, Brent Kochuba, adds: “Ultimately this expiration is clearing out a lot of equity put protection, which clears the way for lower lows in the weeks and months ahead.”

Technical: As of 6:30 AM ET, Tuesday’s regular session (9:30 AM – 4:00 PM ET), in the S&P 500, will likely open in the lower part of a positively skewed overnight inventory, inside of prior-range and -value, suggesting a limited potential for immediate directional opportunity.

In the best case, the S&P 500 trades higher; activity above the $3,768.25 HVNode puts in play the $3,808.50 HVNode. Initiative trade beyond the $3,808.50 HVNode could reach as high as the $3,836.25 LVNode and $3,863.25 LVNode, or higher.

In the worst case, the S&P 500 trades lower; activity below the $3,768.25 HVnode puts in play the $3,727.75 HVNode. Initiative trade beyond the $3,727.75 HVNode could reach as low as the $3,688.75 and $3,664.25 HVNode, or lower.

Click here to load today’s key levels into the web-based TradingView charting platform. Note that all levels are derived using the 65-minute timeframe. New links are produced, daily.
Graphic: 65-minute profile chart of the Micro E-mini S&P 500 Futures.

Definitions

Volume Areas: A structurally sound market will build on areas of high volume (HVNodes). Should the market trend for long periods of time, it will lack sound structure, identified as low volume areas (LVNodes). LVNodes denote directional conviction and ought to offer support on any test. 

If participants were to auction and find acceptance into areas of prior low volume (LVNodes), then future discovery ought to be volatile and quick as participants look to HVNodes for favorable entry or exit.

Point Of Control: POCs are valuable as they denote areas where two-sided trade was most prevalent in a prior day session. Participants will respond to future tests of value as they offer favorable entry and exit.

Micro Composite Point Of Control: POCs are valuable as they denote areas where two-sided trade was most prevalent over numerous day sessions. Participants will respond to future tests of value as they offer favorable entry and exit.

Volume-Weighted Average Prices (VWAPs): A metric highly regarded by chief investment officers, among other participants, for quality of trade. Additionally, liquidity algorithms are benchmarked and programmed to buy and sell around VWAPs.

About

After years of self-education, strategy development, mentorship, and trial-and-error, Renato Leonard Capelj began trading full-time and founded Physik Invest to detail his methods, research, and performance in the markets.

Capelj also develops insights around impactful options market dynamics at SpotGamma and is a Benzinga reporter.

Some of his works include conversations with ARK Invest’s Catherine Wood, investors Kevin O’Leary and John Chambers, FTX’s Sam Bankman-Fried, Kai Volatility’s Cem Karsan, The Ambrus Group’s Kris Sidial, among many others. 

Disclaimer

In no way should the materials herein be construed as advice. Derivatives carry a substantial risk of loss. All content is for informational purposes only.

Categories
Commentary

Daily Brief For May 10, 2022

The Daily Brief is a free glimpse into the prevailing fundamental and technical drivers of U.S. equity market products. Join the 200+ that read this report daily, below!

What Happened

Overnight, equity index futures auctioned sideways to higher, inside of the prior day’s range. Most other commodity and bond futures were bid while implied volatility metrics came in a bit.

Notable was the depth and breadth of Monday’s decline. Though the indexes were tame, some of which is attributable to suppressive hedging, single stocks expanded their ranges, greatly, to the downside, and this points to potential capitulation.

On the news front, a U.S. central bank report found that “the risk of a sudden significant deterioration [in liquidity] appears higher than normal” and stablecoin use to meet margin requirements in crypto trades makes them “vulnerable to runs.”

This is just as some algorithmic stablecoins have lost their peg (e.g., UST/USD ~$0.60).

Additionally, the report found elevated inflation, as well as the reaction to that “could negatively affect domestic economic activity, asset prices, credit quality, and financial conditions.”

Ahead is data on real household debt (11:00 AM ET).

Graphic updated 6:25 AM ET. Sentiment Neutral if expected /ES open is inside of the prior day’s range. /ES levels are derived from the profile graphic at the bottom of the following section. Levels may have changed since initially quoted; click here for the latest levels. SqueezeMetrics Dark Pool Index (DIX) and Gamma (GEX) calculations are based on where the prior day’s reading falls with respect to the MAX and MIN of all occurrences available. A higher DIX is bullish. At the same time, the lower the GEX, the more (expected) volatility. Learn the implications of volatility, direction, and moneyness. SHIFT data used for S&P 500 (INDEX: SPX) options activity. Note that options flow is sorted by the call premium spent; if more positive, then more was spent on call options. Breadth reflects a reading of the prior day’s NYSE Advance/Decline indicator. VIX reflects a current reading of the CBOE Volatility Index (INDEX: VIX) from 0-100.

What To Expect

Context: We continue to build out the narrative.

A market-wide drop, Monday, pointed to signs of capitulation as “small-time investors offloaded a net of about $1 billion in equities, the most aggressive selling in 14 months,” per JPMorgan Chase & Co (NYSE: JPM).

Graphic: Via @TaviCosta. “Nasdaq has already declined almost as much as it did during the March 2020 crash. Back then, the Fed was all about saving the stock market and the economy. Today, it’s all about how much more they are going to hike rates.

Notwithstanding, the volatility divergences this letter has pointed to, in the face of pronounced realized volatility, continue.

Graphic: Via Topdown Charts. Wednesday (FOMC) price rise (right) versus Thursday (post-FOMC) liquidation.

As Pat Hennessy of IPS Strategic Capital explains, at-the-money implied volatility is high and term structure is in backwardation, which are reflections of uncertainty and demand for hedges.

Graphic: Via SpotGamma. At-the-money implied volatility is backwardated given the heightened demand for shorter-dated protection, relative to that which is longer-dated.

“It’s just rare to see wingy short-dated puts like this so cheap relative to ATM.”

As explained in Monday’s letter (and in greater detail, Friday), a measure like the Cboe VVIX Index (INDEX: VVIX), or the volatility of volatility, has a mean below 100 and a high correlation with the Cboe Volatility Index (INDEX: VIX) during times of stress.

When realized volatility is as high as it is, today, the VVIX typically trades closer to 150.

To quote Benn Eifert of QVR Advisors: “Skew goes up if vol outperforms the skew curve a lot on  a selloff.”

Graphic: Updated May 9, 2022. The VVIX via Physik Invest.

What’s going on? 

There is really negative sentiment and emotion, both of which are playing into market weaknesses and realized volatility. However, that realized volatility is not priced in.

There are “plenty of put-buyers, but nearly as many sellers,” SqueezeMetrics explains

You “don’t have to protect what you don’t own. Some investors de-grossed. Short momo (e.g., CTA) wants to bet on a bleed (a la 2000), but not on a crash. Put underwriting! No carry trades elsewhere. Sell SPX vol!”

Graphic: Via SpotGamma’s Hedging Impact of Real-Time Options (HIRO) indicator, the SPDR S&P 500 ETF Trust (NYSE: SPY) was a recipient of heavy put selling and call buying on 5/9/22.

Why does this matter?

When you think there is to be an outsized move in the underlying, relative to what is priced, you buy options (positive exposure to gamma) so that you may have gains that are potentially amplified in case of directional movement.

When you think there is to be an outsized move in the implied volatility, relative to what is priced, you buy options (positive exposure to volga) so that you may have gains that are potentially amplified in case of implied volatility repricing.

So, in all, it is a question of whether the reward is worth the risk (see below “How To Play”).

Based on stretched positioning, equity markets are positioned for upside. Notwithstanding, the potential for large negative outliers, remains. In the case of an outlier, the consequent repricing of volatility may increase the reward, relative to the risk, for selling options, particularly puts.

As The Ambrus Group’s Kris Sidial sums well: 

With an S&P 500 below $4,000.00, “I would expect more of an aggressive reach for hedges … that spot- vol correlation break (weakness) would not be as present.”

“Spot- vol correlation has sucked recently, but vol relative strength should kick in.”

How I’m Playing: Borrowing from May 3’s letter, here.

Presently, the market is stretched to the downside and, as SpotGamma says, “traders are underpricing right-tail risk,” which opens the window for unique ways to play a returns distribution that continues to be skewed positive (albeit with large negative outliers).

This letter’s author is concentrated on zero- and low-cost bets ($0.00-$1.00 debit to open) that deliver asymmetric payouts (sometimes in excess of $10.00 credit to close) in case of violent and short-lived reversals.

This letter’s author is structured positive delta and gamma in the Nasdaq 100 (INDEX: NDX) via ratios spread (1×2) and butterfly (1x2x1) structures.

Graphic: Via Banco Santander SA (NYSE: SAN) research, the return profile, at expiry, of a classic 1×2 (long 1, short 2 further away) ratio spread.

The concern with these strategies is the width and time to expiry. Should either of those be wrong, then spreads initially positive gamma turn negative, meaning losses are amplified.

For instance, in the Nasdaq 100, to put in short, 500-1000 points wide ratio spreads (buy the closer leg, sell two of the farther legs) expiring in ten to fifteen days work well.

For those spreads that are not zero cost, debits can be offset with credit sales (on the put side) in products that have shown relative strength like the S&P 500 (INDEX: SPX). This, inherently, carries more risk, and, as explained, the risk has yet to meet the reward.

Read more about these strategies, here. The above is NOT a trade recommendation or advice.

Technical: As of 6:30 AM ET, Tuesday’s regular session (9:30 AM – 4:00 PM ET), in the S&P 500, will likely open in the middle part of a balanced overnight inventory, inside of prior-range and -value, suggesting a limited potential for immediate directional opportunity.

In the best case, the S&P 500 trades higher; activity above the $3,978.50 low volume area (LVNode/gap boundary) puts in play the $4,055.75 LVNode/gap boundary. Initiative trade beyond the $4,055.75 could reach as high as the $4,119.00 untested point of control (VPOC) and $4,153.25 regular trade high (RTH High), or higher.

In the worst case, the S&P 500 trades lower; activity below the $3,978.50 LVNode/gap boundary puts in play the $3,943.25 high volume area (HVNode). Initiative trade beyond the $3,943.25 could reach as low as the $3,907.75 HVNode and $3,862.75 LVNode, or lower.

Click here to load today’s key levels into the web-based TradingView charting platform. Note that all levels are derived using the 65-minute timeframe. New links are produced, daily.
Graphic: 65-minute profile chart of the Micro E-mini S&P 500 Futures.

Definitions

Cave-Fill Process: Widened the area deemed favorable to transact at by an increased share of participants. This is a good development.

Volume Areas: A structurally sound market will build on areas of high volume (HVNodes). Should the market trend for long periods of time, it will lack sound structure, identified as low volume areas (LVNodes). LVNodes denote directional conviction and ought to offer support on any test. 

If participants were to auction and find acceptance into areas of prior low volume (LVNodes), then future discovery ought to be volatile and quick as participants look to HVNodes for favorable entry or exit.

Gamma: Gamma is the sensitivity of an option to changes in the underlying price.

Vanna: The rate at which the delta of an option changes with respect to volatility.

Charm: The rate at which the delta of an option changes with respect to time.

Options: If an option buyer was short (long) stock, he or she would buy a call (put) to hedge upside (downside) exposure. Option buyers can also use options as an efficient way to gain directional exposure.

POCs: POCs are valuable as they denote areas where two-sided trade was most prevalent in a prior day session. Participants will respond to future tests of value as they offer favorable entry and exit.

MCPOCs: POCs are valuable as they denote areas where two-sided trade was most prevalent over numerous day sessions. Participants will respond to future tests of value as they offer favorable entry and exit.

Options Expiration (OPEX): Reduction of dealer gamma exposure.

Volume-Weighted Average Prices (VWAPs): A metric highly regarded by chief investment officers, among other participants, for quality of trade. Additionally, liquidity algorithms are benchmarked and programmed to buy and sell around VWAPs.

About

After years of self-education, strategy development, mentorship, and trial-and-error, Renato Leonard Capelj began trading full-time and founded Physik Invest to detail his methods, research, and performance in the markets.

Capelj also develops insights around impactful options market dynamics at SpotGamma and is a Benzinga reporter.

Some of his works include conversations with ARK Invest’s Catherine Wood, investors Kevin O’Leary and John Chambers, FTX’s Sam Bankman-Fried, Kai Volatility’s Cem Karsan, The Ambrus Group’s Kris Sidial, among many others.

Disclaimer

In no way should the materials herein be construed as advice. Derivatives carry a substantial risk of loss. All content is for informational purposes only.