Categories
Commentary

Daily Brief For November 29, 2022

Physik Invest’s Daily Brief is read by over 1,200 people. To join this community and learn about the fundamental and technical drivers of markets, subscribe below.

Graphic updated 6:50 AM ET. Sentiment Neutral if expected /ES open is inside of the prior day’s range. /ES levels are derived from the profile graphic at the bottom of this letter. Levels may have changed since initially quoted; click here for the latest levels. SqueezeMetrics Dark Pool Index (DIX) and Gamma (GEX) with the latter calculated based on where the prior day’s reading falls with respect to the MAX and MIN of all occurrences available. A higher DIX is bullish. At the same time, the lower the GEX, the more (expected) volatility. Click to learn the implications of volatility, direction, and moneyness. Breadth reflects a reading of the prior day’s NYSE Advance/Decline indicator. VIX reflects a current reading of the CBOE Volatility Index (INDEX: VIX) from 0-100.

Positioning

Aksel Kibar of Tech Charts said it well: There are two types of trades.

1) Trades that you take moving from low volatility to high volatility [and] 2) trades that you take in high volatility while moving to low volatility.”

Graphic: Retrieved from Aksel Kibar, CMT.

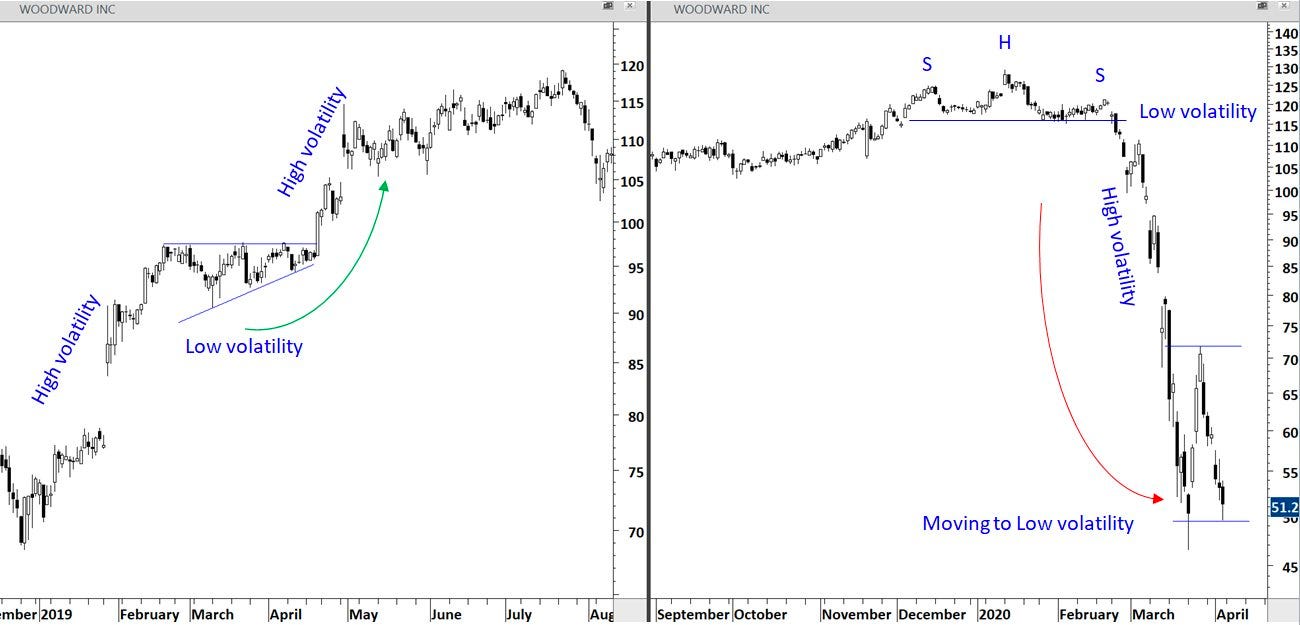
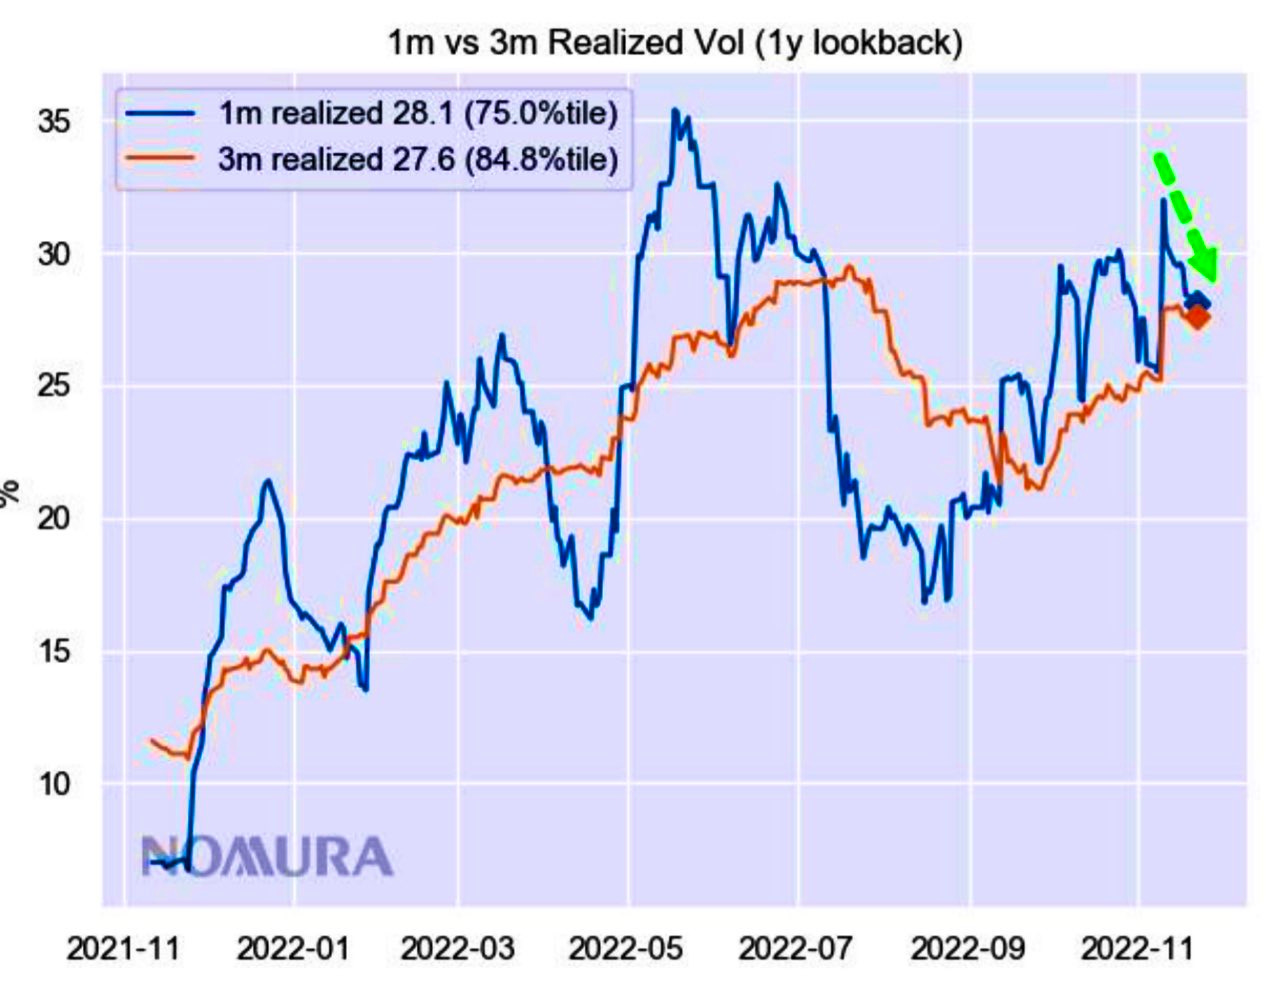
Like Kibar, we aim to be well-positioned for a move from low to high volatility. In short, that is where we are today. After an expansion of range to the upside, markets are trading sideways, in a tight range, and traders’ recent activities are likely to keep the status quo intact a bit longer.

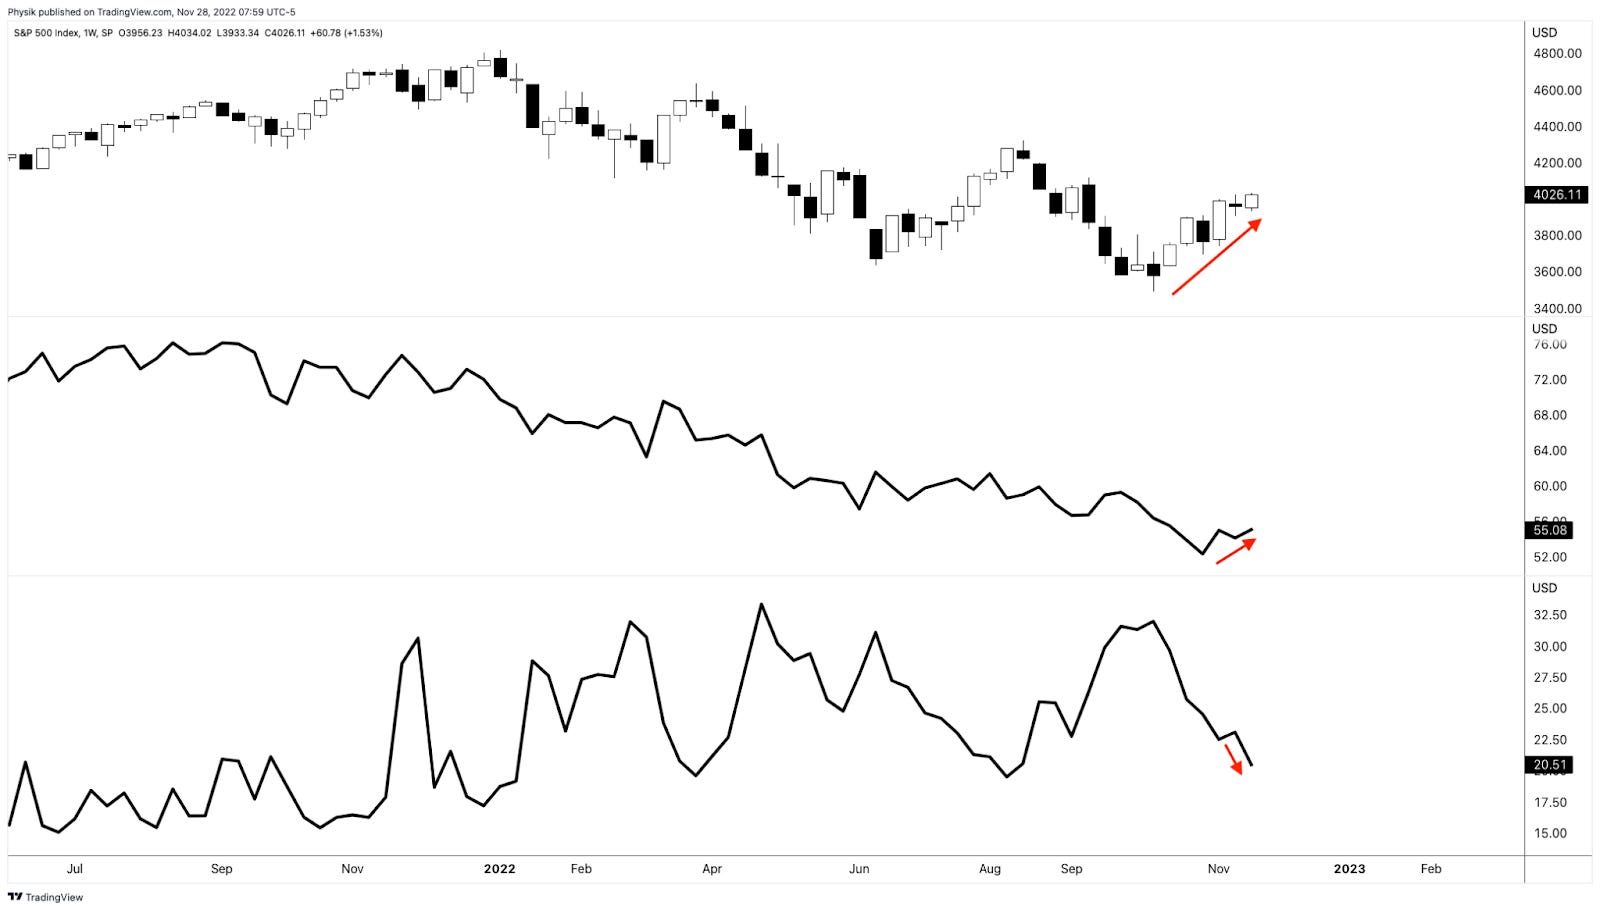
Notwithstanding, we are likely nearing an expansion of realized volatility (RVOL), per the implied volatility (IVOL) bid; on Monday, some IVOL measures, such as the Cboe Volatility Index (INDEX: VIX), shifted up, as did term structure. Markets sold a bit, too.

Quick aside:

Changes in IVOL are a byproduct of supply and demand (i.e., demand rushes in → IVOL rises → option prices adjust higher).

When protection is demanded by investors, counterparties may pressure markets (a naive take, if we will, for the purpose of breaking things down).

To explain further, say the market is in balance and trading sideways, and traders seek to protect against potential downside movement by purchasing put options.

This new demand will bid put options prices, causing counterparties to hedge in a manner that pressures the market (i.e., a trader buys put and bids IVOL → the counterparty sells that put and futures to hedge that put), as we’re seeing (i.e., IVOL higher and market lower ahead of updates to measures like the Personal Consumption Expenditures [INDEX: PCE], the Fed’s go-to inflation reading).

Back to the letter:

Upon some new information, participants will enter and reprice the market.

Counterparties’ re-hedging could add to the movement up or down (e.g., traders sell their put hedges → IVOL compresses → counterparties buy back futures hedges and support the market).

If you’re betting on lower prices, recommended is a quick reference of Physik Invest’s Daily Brief for November 28, 2022. In short, according to SpotGamma, “there’s less to be lost owning protection down below,” given the performance of skew, relative to topline measures such as the Cboe Volatility Index (INDEX: VIX).

“On the contrary, if you buy [protection] and nothing happens, that [protection] may very well hold its value better than in the past.”

Graphic: Retrieved from TradingView. Top, S&P 500 (INDEX: SPX). Middle Nations SkewDex (INDEX: SDEX). Bottom Cboe Volatility Index (INDEX: VIX). According to one paper from Nations Indexes, “SkewDex tells market participants how expensive out-of-the-money options are in relation to at-the-money options and thus, how risk-averse investors are.”

On the call side, the story is similar; selling volatility blindly is not a good trade. 

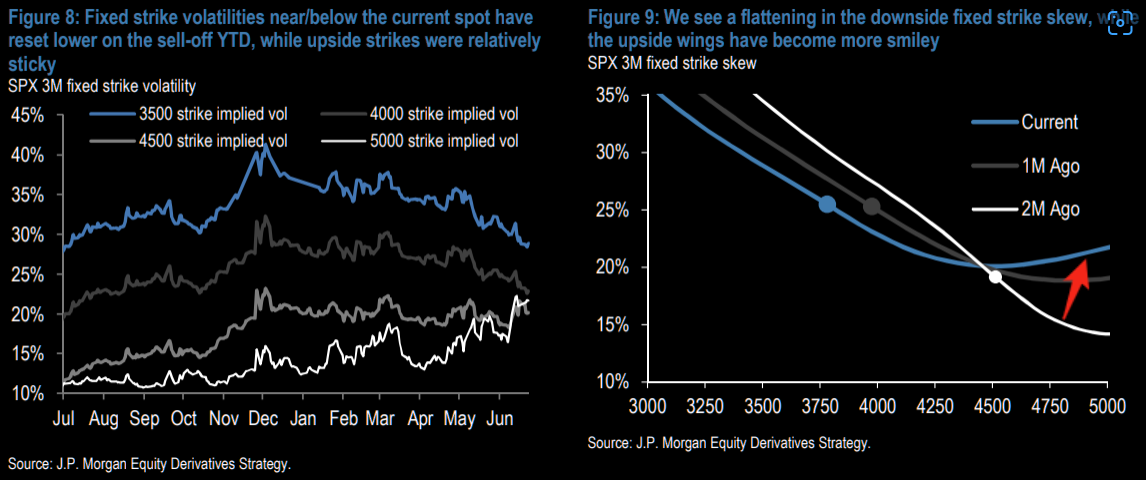
To explain, incentive schemes drove “people to be much more willing to pay and chase upside,” and this is, in part, evidenced by historically low skew. There is also stock replacement, among other things, due to the opportunity cost of buying stock being higher in the current interest rate environment (i.e., “higher call options premium when interest rates are high is the ‘opportunity cost’ of forgone interest”).

Graphic: Retrieved from Charles Schwab Corporation (NYSE: SCHW).

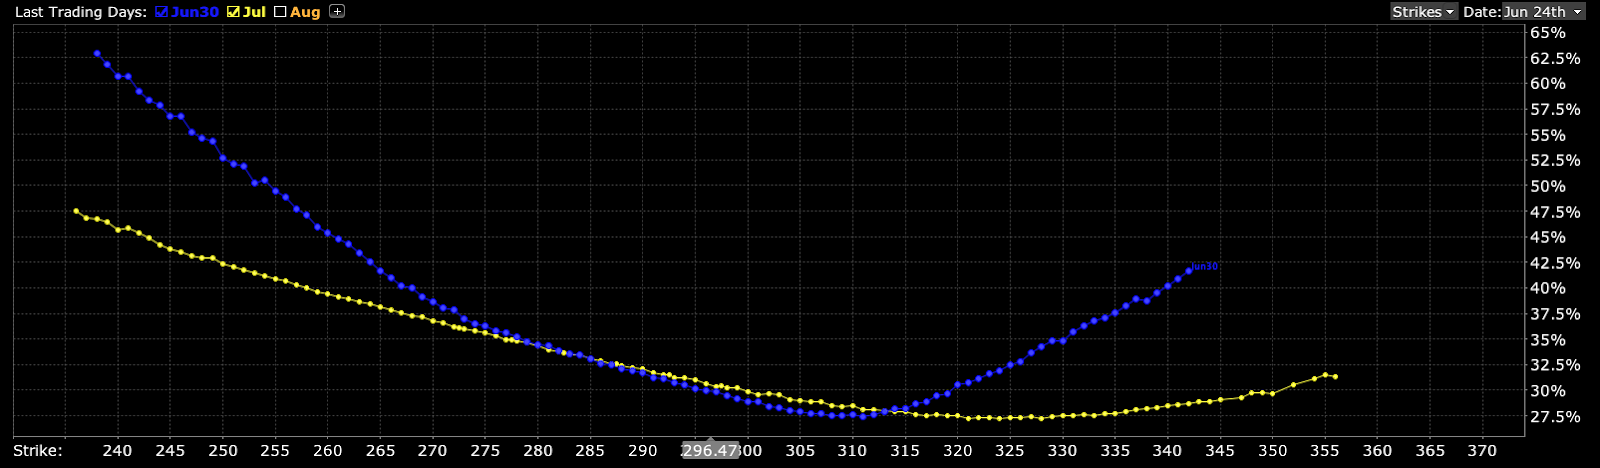
In the interest of brevity, this environment has resulted in a smile-shaped volatility skew pattern, rather than the typical smirk-shaped reverse volatility skew pattern. 

Graphic: Retrieved from Interactive Brokers (NASDAQ: IBKR). Nasdaq 100 (INDEX: NDX) volatility skew resembles the so-called smile.

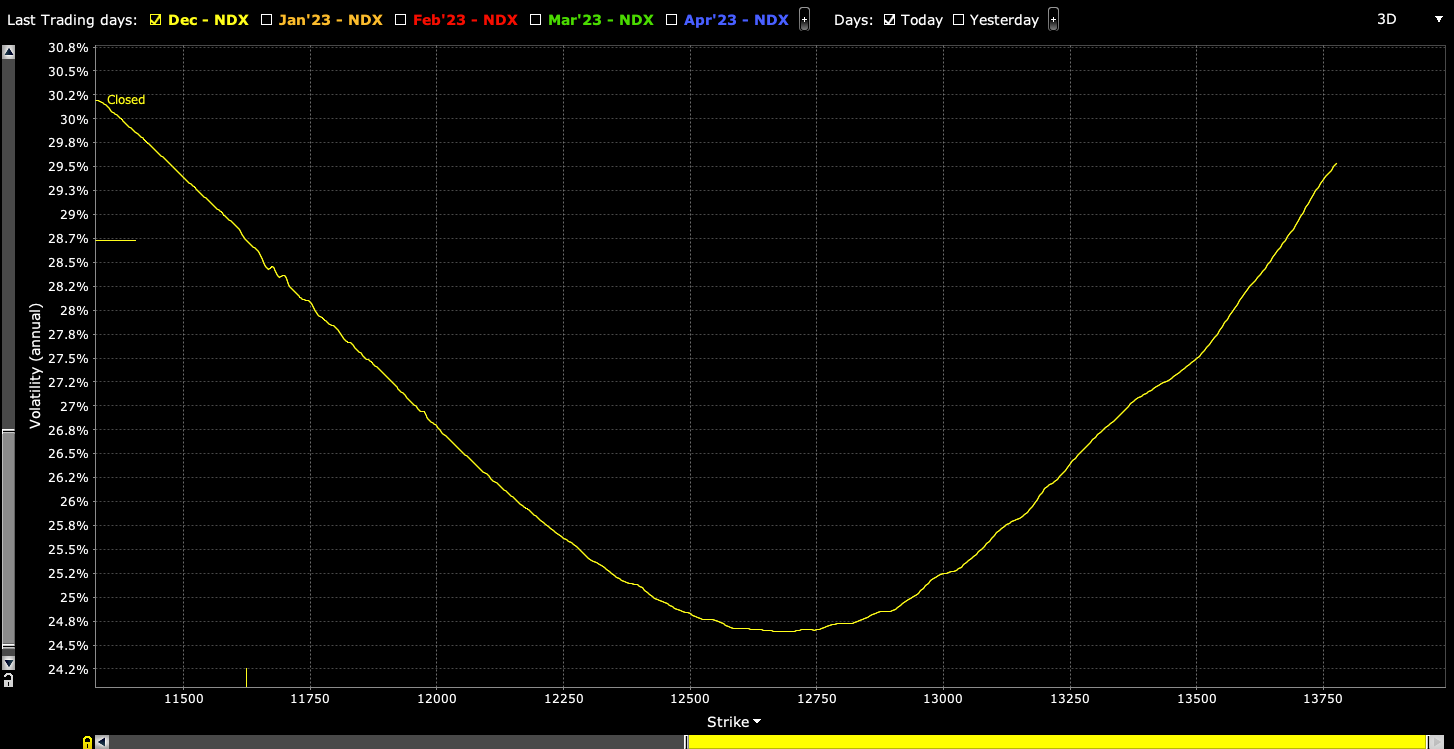
Skew has steepened on the call side – a result of traders positioning for an upside move – and we can use the richness of out-of-the-money calls to reduce the cost of our bets on the market upside.

Graphic: Retrieved from the Charles Schwab Corporation-owned (NYSE: SCHW) thinkorswim platform. Nasdaq 100 options prices.

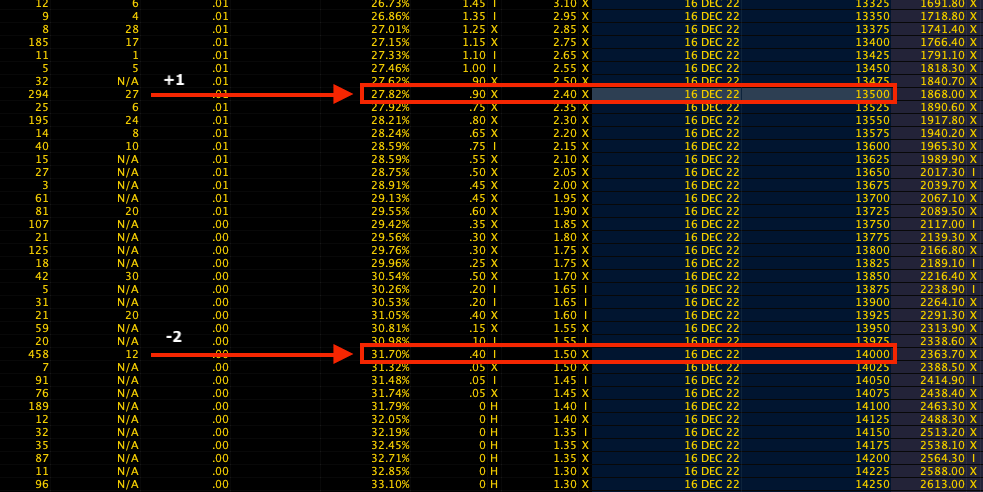
For instance, low-cost 500-1000 points wide call ratio spreads (buy the closer leg, sell two of the farther legs) expiring in fifteen days may work well.

Graphic: Via Banco Santander SA (NYSE: SAN) research. The return profile, at expiry, of a 1×2 (long 1, short 2 further away) ratio spread.

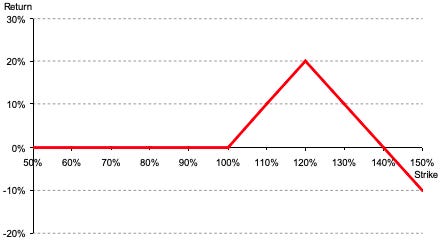
A concern with these strategies is the width and time to expiry. Should either of those be wrong, then spreads initially positive gamma turn negative, meaning upside market movement hurts the position and losses are amplified.

Technical

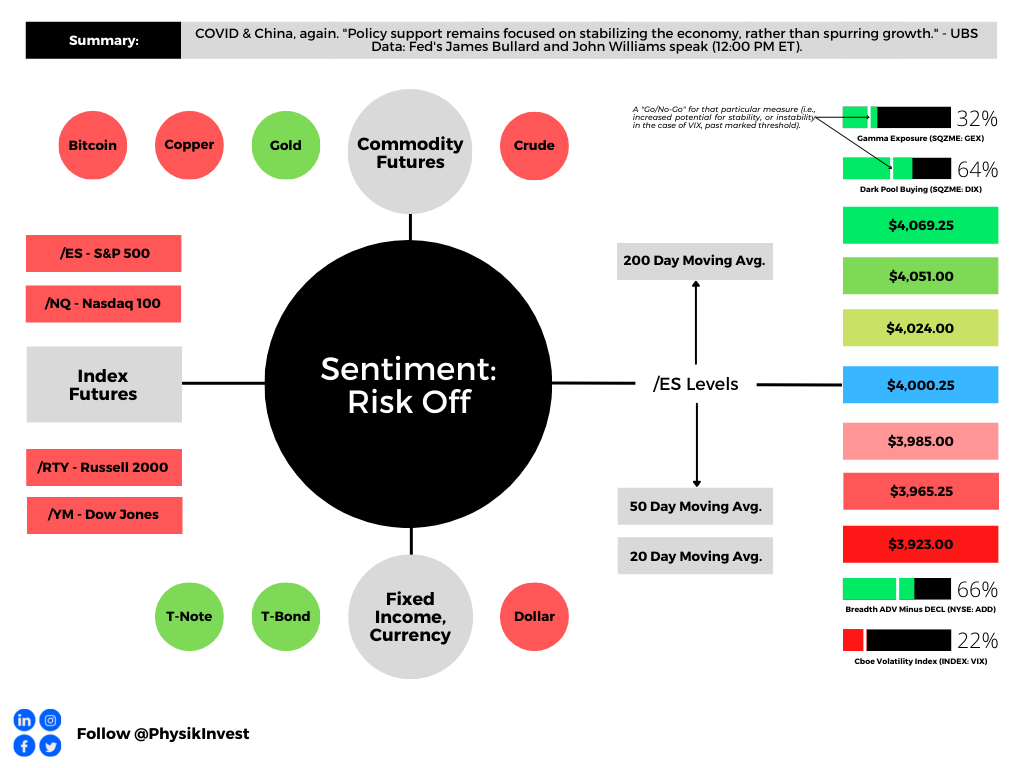
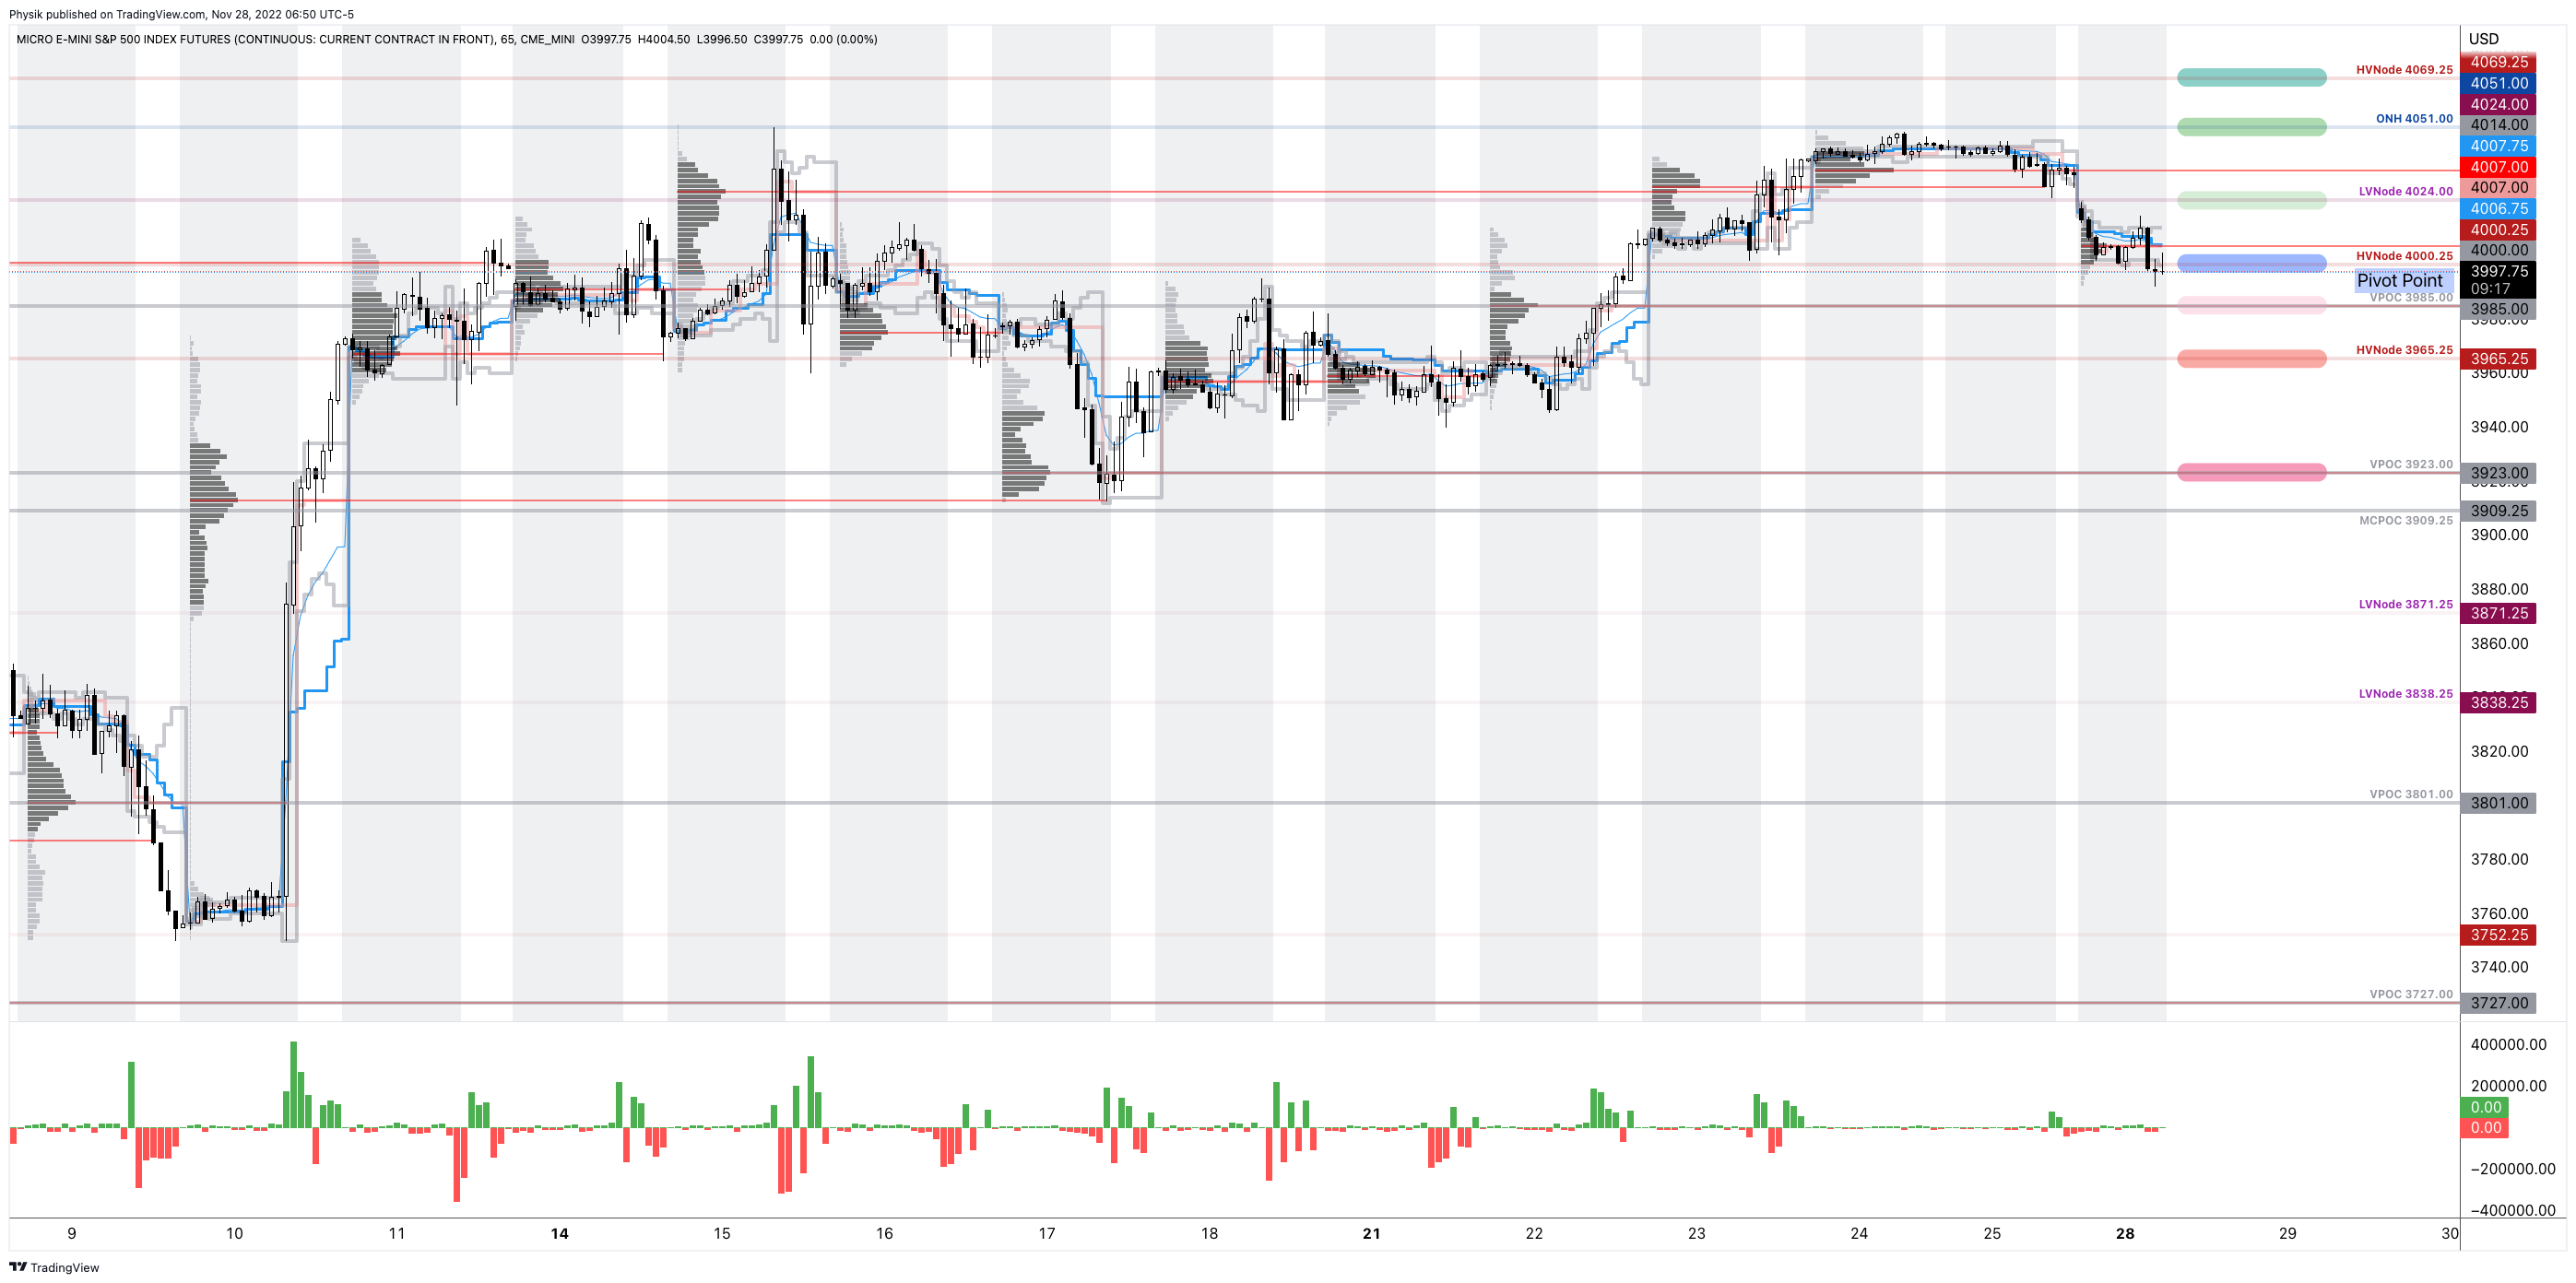
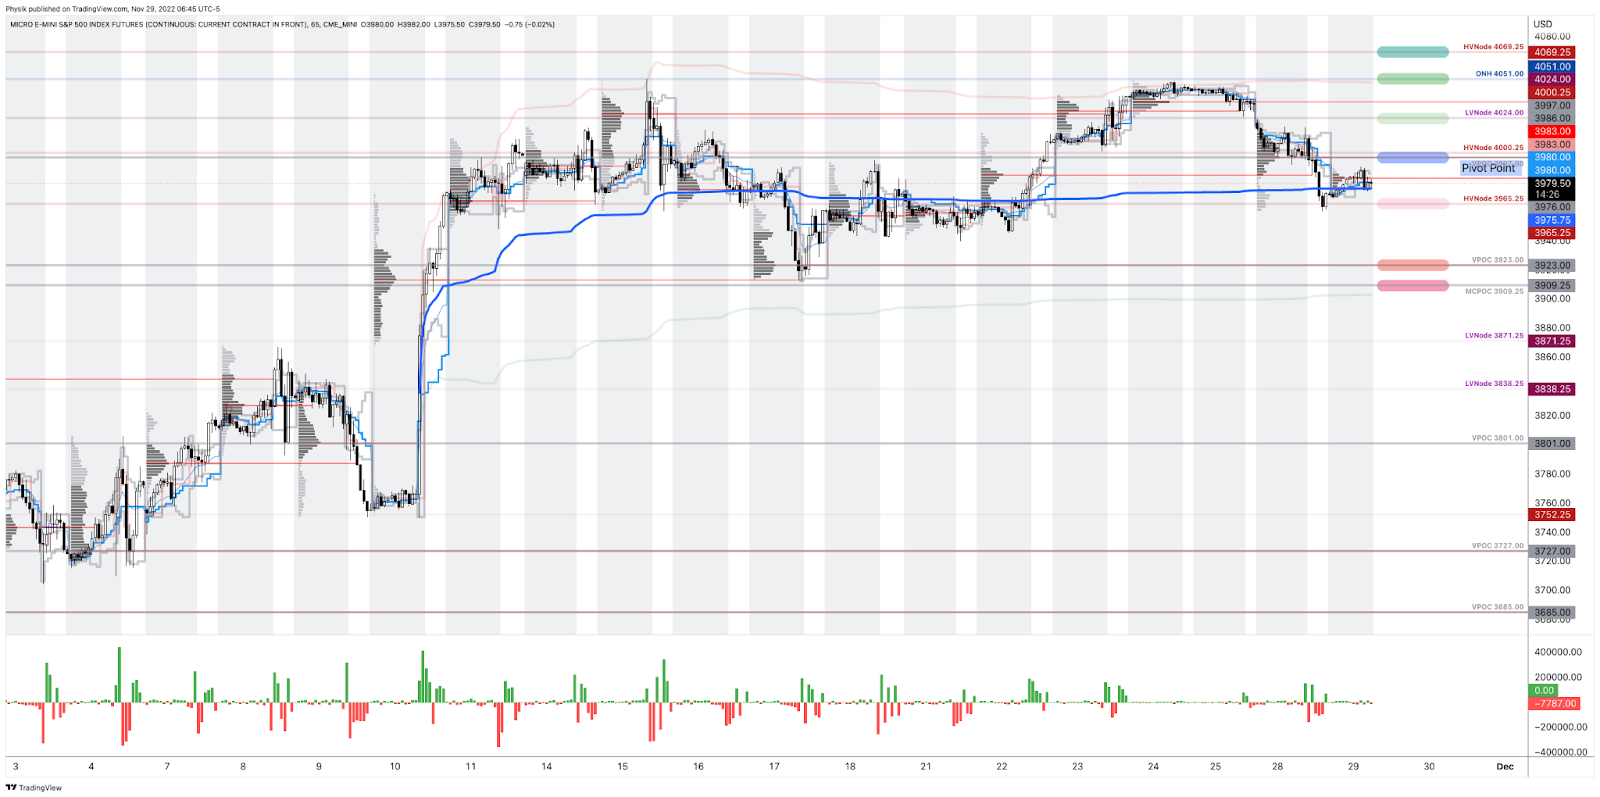
As of 6:45 AM ET, Tuesday’s regular session (9:30 AM – 4:00 PM ET), in the S&P 500, is likely to open in the middle part of a positively skewed overnight inventory, inside of prior-range and -value, suggesting a limited potential for immediate directional opportunity.

Our S&P 500 pivot for today is $4,997.00. 

Key levels to the upside include $4,024.00, $4,051.00, and $4,069.25. 

Key levels to the downside include $3,965.25, $3,923.00, and $3,909.25.

Click here to load today’s key levels into the web-based TradingView platform. All levels are derived using the 65-minute timeframe. New links are produced, daily.

Graphic: 65-minute profile chart of the Micro E-mini S&P 500 Futures.

About

After years of self-education, strategy development, mentorship, and trial-and-error, Renato Leonard Capelj began trading full-time and founded Physik Invest to detail his methods, research, and performance in the markets. 

Capelj also writes options market analyses at SpotGamma and is a Benzinga journalist. 

His past works include private discussions with ARK Invest’s Catherine Wood, investors Kevin O’Leary and John Chambers, the infamous Sam Bankman-Fried of FTX, former Bridgewater Associate Andy Constan, Kai Volatility’s Cem Karsan, The Ambrus Group’s Kris Sidial, the Lithuanian Delegation’s Aušrinė Armonaitė, among many others.

Contact

Direct queries to renato@physikinvest.com or Renato Capelj#8625 on Discord.

Disclaimer

Do not construe this newsletter as advice. All content is for informational purposes.

Categories
Commentary

Daily Brief For November 28, 2022

Physik Invest’s Daily Brief is read by over 1,200 people. To join this community and learn about the fundamental and technical drivers of markets, subscribe below.

Graphic updated 6:50 AM ET. Sentiment Risk-Off if expected /ES open is below the prior day’s range. /ES levels are derived from the profile graphic at the bottom of this letter. Levels may have changed since initially quoted; click here for the latest levels. SqueezeMetrics Dark Pool Index (DIX) and Gamma (GEX) with the latter calculated based on where the prior day’s reading falls with respect to the MAX and MIN of all occurrences available. A higher DIX is bullish. At the same time, the lower the GEX, the more (expected) volatility. Click to learn the implications of volatility, direction, and moneyness. Breadth reflects a reading of the prior day’s NYSE Advance/Decline indicator. VIX reflects a current reading of the CBOE Volatility Index (INDEX: VIX) from 0-100.

Administrative

Hope you had a great holiday with your closest!

Fundamental

Minutes from a Federal Open Market Committee (FOMC) meeting dropped last week.

As strategist Rishi Mishra summarized well, “the focus shift[ed] to the terminal rate from the pace of tightening; although the terminal rate would be higher than previously expected, the pace at which we get there will be slower because they want to take lags into account.”

Graphic: Retrieved from Rishi Mishra.

At its core, the economy has not slowed as much as the Fed was expecting, said Ellen Meade, a former Fed Board economist; “[t]hey can’t stop the rate increases until they see some measured evidence that the economy is slowing.”

So, with inflation “still at its highest since the 1980s,” according to Fabian Wintersberger, all the while financial conditions have loosened on easing inflation pressures, markets have yet to face their “most significant problems, [and] … keeping interest rates around 5% will not be a Fed pivot” (which is likely to happen near the middle of 2023, per the consensus analysis).

In short, the Fed must further raise rates and unwind liquidity injections.

To bring the “balance sheet back to [2020 levels], [the Fed] needs to reduce it by 41%.” The balance sheet has only been reduced by 1.5%. Should liquidity keep shrinking, that pulls investors out of risk.

Graphic: Via Physik Invest. Data compiled by @jkonopas623. Fed Balance Sheet data, here. Treasury General Account Data, here. Reverse Repo data, here. NL = BS – TGA – RRP.

Positioning

From a volatility perspective, it’s not a terrible time to hedge

An example demonstrates the point, well. As lightly discussed in last week’s letters, in mid-June, a trading partner and I noticed a change in tone in the non-linearity of volatility and skew with respect to linear changes in the price of the market or S&P 500 (INDEX: SPX).

The cost of certain spread structures (e.g., long/short one option near- or at-the-money and short/long two or more further out-of-the-money options) changed by hundreds of percent for only a few basis points of change in the underlying’s price.

Here’s more detail:

The market rose (boosted by a “vol crunch” and “systemic exposure reallocation,” per Nomura Holdings Inc’s [NYSE: NMR] Charlie McElligott) and, though top-line measures of IVOL have declined (e.g., INDEX: VIX), volatility skew is performing well.

Graphic: Retrieved from TradingView. Top, S&P 500 (INDEX: SPX). Middle Nations SkewDex (INDEX: SDEX). Bottom Cboe Volatility Index (INDEX: VIX). According to one paper from Nations Indexes, “SkewDex tells market participants how expensive out-of-the-money options are in relation to at-the-money options and thus, how risk-averse investors are.”

As Kai Volatility’s Cem Karsan once explained, this suggests “a potentially critical change in dealer positioning [and] the distribution of underlying outcomes”.

IVOL is at a lower bound and the bullish impacts yielded by its compressing have, largely, played out.

There is more to be gained by movement higher in IVOL. By owning protection, particularly that which is farther from current prices, you are positioned to monetize on non-linear repricings of volatility (as we saw earlier this year and may still see).

Graphic: Retrieved from Nomura Holdings Inc (NYSE: NMR).

Technical

As of 6:45 AM ET, Monday’s regular session (9:30 AM – 4:00 PM ET), in the S&P 500, is likely to open in the lower part of a negatively skewed overnight inventory, outside of prior-range and -value, suggesting a potential for immediate directional opportunity.

Our S&P 500 pivot for today is $4,000.25. 

Key levels to the upside include $4,024.00, $4,051.00, and $4,069.25. 

Key levels to the downside include $3,985.00, $3,965.25, and $3,923.00.

Click here to load today’s key levels into the web-based TradingView platform. All levels are derived using the 65-minute timeframe. New links are produced, daily.

Graphic: 65-minute profile chart of the Micro E-mini S&P 500 Futures.

Definitions

Overnight Rally Highs (Lows): Typically, there is a low historical probability associated with overnight rally-highs (lows) ending the upside (downside) discovery process.

Volume Areas: A structurally sound market will build on areas of high volume (HVNodes). Should the market trend for long periods of time, it will lack sound structure, identified as low volume areas (LVNodes). LVNodes denote directional conviction and ought to offer support on any test. 

If participants were to auction and find acceptance into areas of prior low volume (LVNodes), then future discovery ought to be volatile and quick as participants look to HVNodes for favorable entry or exit.

POCs: POCs are valuable as they denote areas where two-sided trade was most prevalent in a prior day session. Participants will respond to future tests of value as they offer favorable entry and exit.

MCPOCs: POCs are valuable as they denote areas where two-sided trade was most prevalent over numerous day sessions. Participants will respond to future tests of value as they offer favorable entry and exit.

About

After years of self-education, strategy development, mentorship, and trial-and-error, Renato Leonard Capelj began trading full-time and founded Physik Invest to detail his methods, research, and performance in the markets. 

Capelj also writes options market analyses at SpotGamma and is a Benzinga journalist. 

His past works include private discussions with ARK Invest’s Catherine Wood, investors Kevin O’Leary and John Chambers, the infamous Sam Bankman-Fried of FTX, former Bridgewater Associate Andy Constan, Kai Volatility’s Cem Karsan, The Ambrus Group’s Kris Sidial, the Lithuanian Delegation’s Aušrinė Armonaitė, among many others.

Contact

Direct queries to renato@physikinvest.com or Renato Capelj#8625 on Discord.

Disclaimer

Do not construe this newsletter as advice. All content is for informational purposes.

Categories
Commentary

Daily Brief For June 28, 2022

The daily brief is a free glimpse into the prevailing fundamental and technical drivers of U.S. equity market products. Join the 300+ that read this report daily, below!

What Happened

Overnight, equity index futures rotated higher, along with commodities. Implied volatility was bid. Bonds were lower. 

In the news were some changes to China’s COVID policies, the European Central Bank’s (ECB) intent to follow its peers and raise interest rates in July by 25 basis points, and the Group of Seven (G-7) leaders are talking about geopolitics and placing limitations on Russia. 

At home, mortgage lenders are turning “desperate” as soaring rates roil their industry. Some are bracing for a 20% reduction in business as 30-year mortgage rates level out below 5.75%.

Pursuant to some of our analyses last week, Scion Asset Management founder Michael Burry suggested a “supply gut at retail is the bullwhip effect.” More on this, later.

Ahead is data on trade in goods (8:30 AM ET), S&P Case-Shiller U.S. home price index (9:00 AM ET), consumer confidence index (10:00 AM ET), as well as updates by Federal Reserve (Fed) members (8:00 AM ET and 12:30 PM ET).

Graphic updated 6:30 AM ET. Sentiment Neutral if expected /ES open is inside of the prior day’s range. /ES levels are derived from the profile graphic at the bottom of the following section. Levels may have changed since initially quoted; click here for the latest levels. SqueezeMetrics Dark Pool Index (DIX) and Gamma (GEX) calculations are based on where the prior day’s reading falls with respect to the MAX and MIN of all occurrences available. A higher DIX is bullish. At the same time, the lower the GEX, the more (expected) volatility. Learn the implications of volatility, direction, and moneyness. SHIFT data used for S&P 500 (INDEX: SPX) options activity. Note that options flow is sorted by the call premium spent; if more positive, then more was spent on call options. Breadth reflects a reading of the prior day’s NYSE Advance/Decline indicator. VIX reflects a current reading of the CBOE Volatility Index (INDEX: VIX) from 0-100.

What To Expect

Fundamental: Though badly timed, last year ARK Invest’s Cathie Wood said inflation would be on its way out due in part to inventory build-ups and their impact on commodity prices.

Graphic: Via Societe Generale SA (OTC: SCGLY).

At the time, she asked whether the velocity of money was depressed given pent-up savings and demand for assets, putting forth disappointing GDP updates (which grew, mostly, on the back of inventories) and slightly negative retail final sales as support for her broader thesis. 

Recall happenings in real estate – the iBuying debacle – late last year. Wood said this: 

“This is unsustainable, … and I’m wondering if even the housing market inflation is going to give way, here.”

Participants were extending moneyness to nonmonetary assets, given monetary policies and an environment of debt and leverage that ultimately cuts into asset price volatility. Ultimately, these trends bolster the risks of carry when volatility does rise and the demand for money pushes deflation, particularly in asset prices.

Read: Daily brief for May 18, 2022.

Graphic: Via the Investment Company Institute. Taken from Joseph Wang. “Investors are selling everything for cash.”

With bank deposits to drain about $1 trillion or so by year-end, that volatility is happening, now, as investors “continue to lower their selling prices to compete for the cash they want.”

Scion Asset Management’s Michael Burry nods at the “supply gut” in retail. Like Wood, he thinks that it is a deflationary pulse that manifests disinflation in consumer prices, prompting the Fed to reverse itself on rates and quantitative tightening (QT).

Read: DC’s Chartbook #16 on the “fundamental evolution in the global money markets.”

Graphic: Via Societe Generale SA (OTC: SCGLY).

That’s as Credit Suisse Group AG’s (NYSE: CS) Zoltan Pozsar, who gained much attention this year on his bold market commentary, said the Fed is likely to change course as it “can only deal with nominal [and] not real chokepoints.” This is as “nominal balance sheet and liquidity trends will, at some point, clash with the realities of a garden variety of supply chain issues.”

Graphic: Via @BarnabeBearBull. “[L]ast week 18 Central Banks tightened their monetary policy (12% of all monitored CBs), including 4 of the top 9. Strongest move in a while.”

Positioning: Incredible is the still-depressed volatility skew we’ve talked about ad nauseam on.

Graphic: Via JPMorgan Chase & Co (NYSE: JPM). Taken from The Market Ear. “Overwriting longs and using the premium to buy downside protection is relatively cheaper now.”

It’s the strong supply of volatility. Participants are hedging, buying into volatility that is closer to current prices, and selling (skew) that which is farther out. 

The counterparts are long that volatility further out, which they may sell into declines, and all of this, together, “results in vol underperformance on market declines,” per Sergei Perfiliev.

Graphic: Via Physik Invest. Taken from TradingView. The top is S&P 500 (INDEX: SPX). The second, from the top, is the Nations SkewDex (INDEX: SDEX), a clearer measure of options skew. The second from the bottom is the Cboe Volatility Index (INDEX: VIX). The bottom is the Cboe VVIX index (INDEX: VVIX), a naive measure of skew.

For that reason, the volatility that the markets are realizing (RVOL) is heightened and, at times, in excess of that implied.

Graphic: Via Goldman Sachs Group Inc (NYSE: GS). Taken from The Market Ear. “SPX 6-month realized volatility is at a level rarely seen outside of major crises; current 6-month implied volatility has been exceeded in just 3 periods since 1940.”

As said, yesterday, given these dynamics, it makes sense to lean toward owning volatility, rather than selling it. A “higher starting point” in IVOL, and a still-present right-tail (from the positioning for a bear market rally), make it so we may position, for less cost, in short-dated structures with asymmetric payouts (call and put side), precisely as we’ve been talking about for half-a-year.

Graphic: Via Pat Hennessy. “[T]he performance of short-dated 1×2 put ratios in SPX this year. Despite being short the tail, the grind lower has been well captured by this trade structure.”

In the near term, from a positioning perspective, the front-running of quarter-end repositioning flow is (and is expected), in part, to add to the equity market upside.

Graphic: Taken by Physik Invest from Interactive Brokers Group Inc (NASDAQ: IBKR) on 6/24/2022. Multi-expiry skew in the Invesco QQQ Trust Series 1 (NASDAQ: QQQ). Notice the v-shape in the shorter maturity and smirk in the longer maturity. Here’s what that means.

Technical: As of 6:30 AM ET, Tuesday’s regular session (9:30 AM – 4:00 PM ET), in the S&P 500, will likely open in the mid-to-upper part of a balanced overnight inventory, inside of prior-range and -value, suggesting a limited potential for immediate directional opportunity.

In the best case, the S&P 500 trades higher; activity above the $3,909.25 MCPOC puts in play the $3,943.25 HVNode. Initiative trade beyond the HVNode could reach as high as the $3,982.75 LVNode and $4,016.25 HVNode, or higher.

In the worst case, the S&P 500 trades lower; activity below the $3,909.25 MCPOC puts in play the $3,885.75 ONL. Initiative trade beyond the ONL could reach as low as the $3,821.50 LVNode and $3,793.25 Ledge, or lower.

Click here to load today’s key levels into the web-based TradingView charting platform. Note that all levels are derived using the 65-minute timeframe. New links are produced, daily.
Graphic: 65-minute profile chart of the Micro E-mini S&P 500 Futures.

Balanced (Two-Timeframe Or Bracket) Trade The Status Quo: Rotational trade that denotes current prices offer favorable entry and exit. 

Balance areas make it easy to spot a change in the market (i.e., the transition from two-time frame trade, or balance, to one-time frame trade, or trend). 

Modus operandi is responsive trade (i.e., fade the edges), rather than initiative trade (i.e., play the break).

Definitions

Overnight Rally Highs (Lows): Typically, there is a low historical probability associated with overnight rally-highs (lows) ending the upside (downside) discovery process.

Volume Areas: A structurally sound market will build on areas of high volume (HVNodes). Should the market trend for long periods of time, it will lack sound structure, identified as low volume areas (LVNodes). LVNodes denote directional conviction and ought to offer support on any test. 

If participants were to auction and find acceptance into areas of prior low volume (LVNodes), then future discovery ought to be volatile and quick as participants look to HVNodes for favorable entry or exit.

MCPOCs: POCs are valuable as they denote areas where two-sided trade was most prevalent over numerous day sessions. Participants will respond to future tests of value as they offer favorable entry and exit.

About

After years of self-education, strategy development, mentorship, and trial-and-error, Renato Leonard Capelj began trading full-time and founded Physik Invest to detail his methods, research, and performance in the markets.

Capelj also develops insights around impactful options market dynamics at SpotGamma and is a Benzinga reporter.

Some of his works include conversations with ARK Invest’s Catherine Wood, investors Kevin O’Leary and John Chambers, FTX’s Sam Bankman-Fried, Kai Volatility’s Cem Karsan, The Ambrus Group’s Kris Sidial, among many others.

Disclaimer

In no way should the materials herein be construed as advice. Derivatives carry a substantial risk of loss. All content is for informational purposes only.