Physik Invest’s Daily Brief is read free by thousands of subscribers. Join this community to learn about the fundamental and technical drivers of markets.
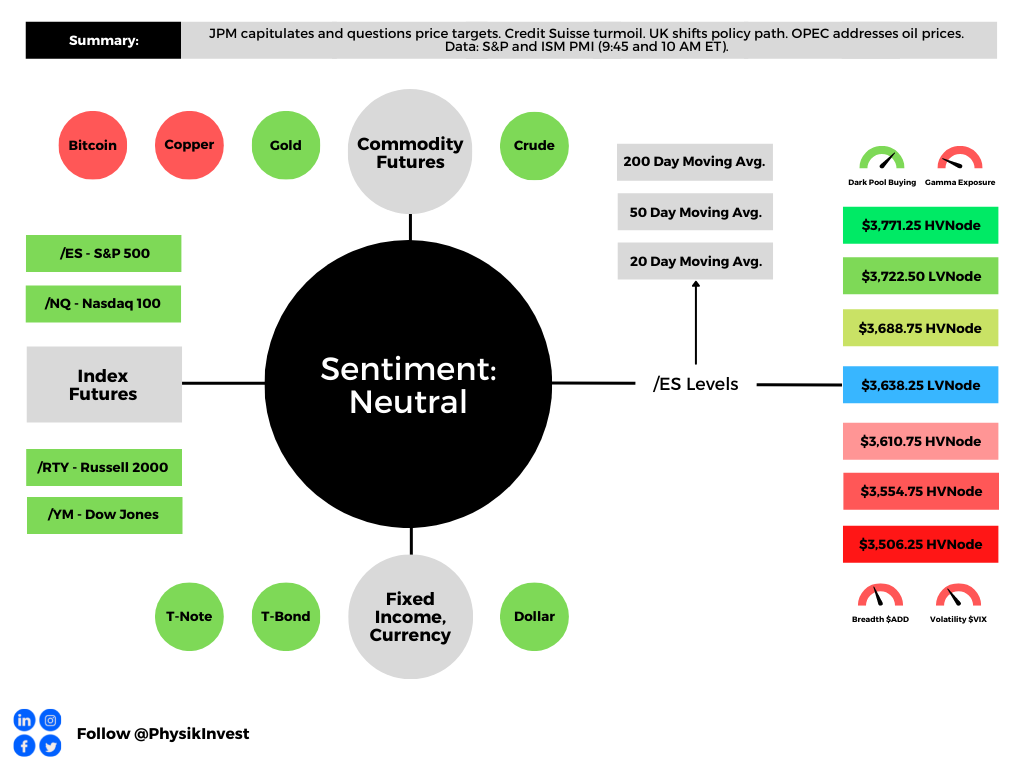
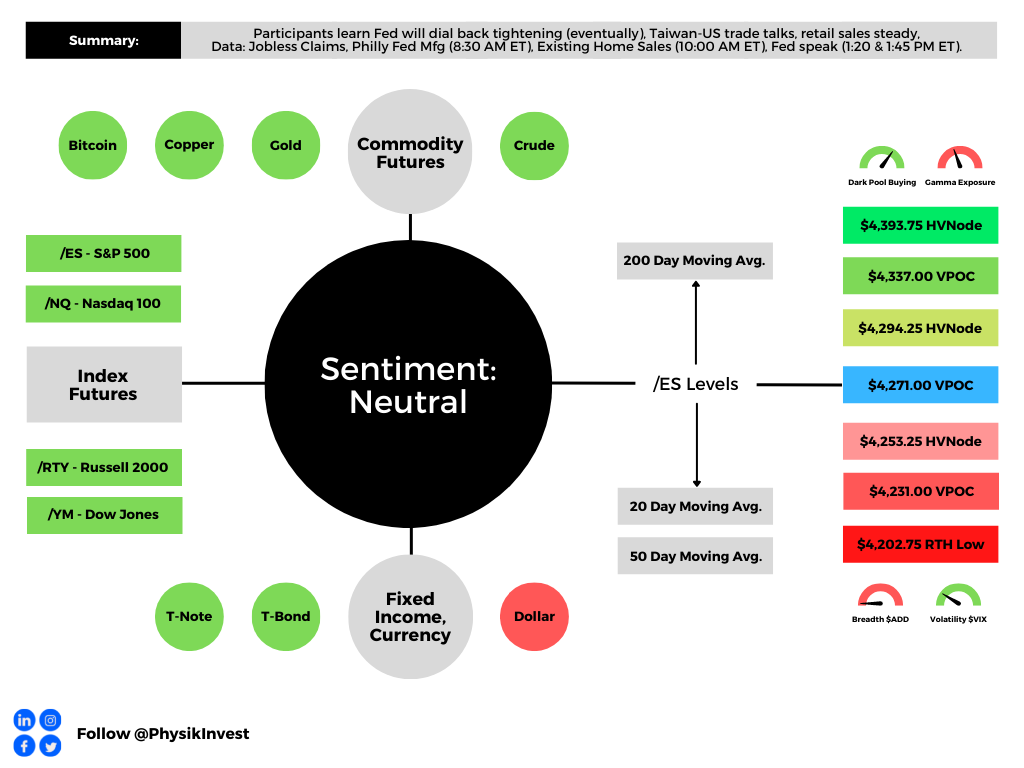
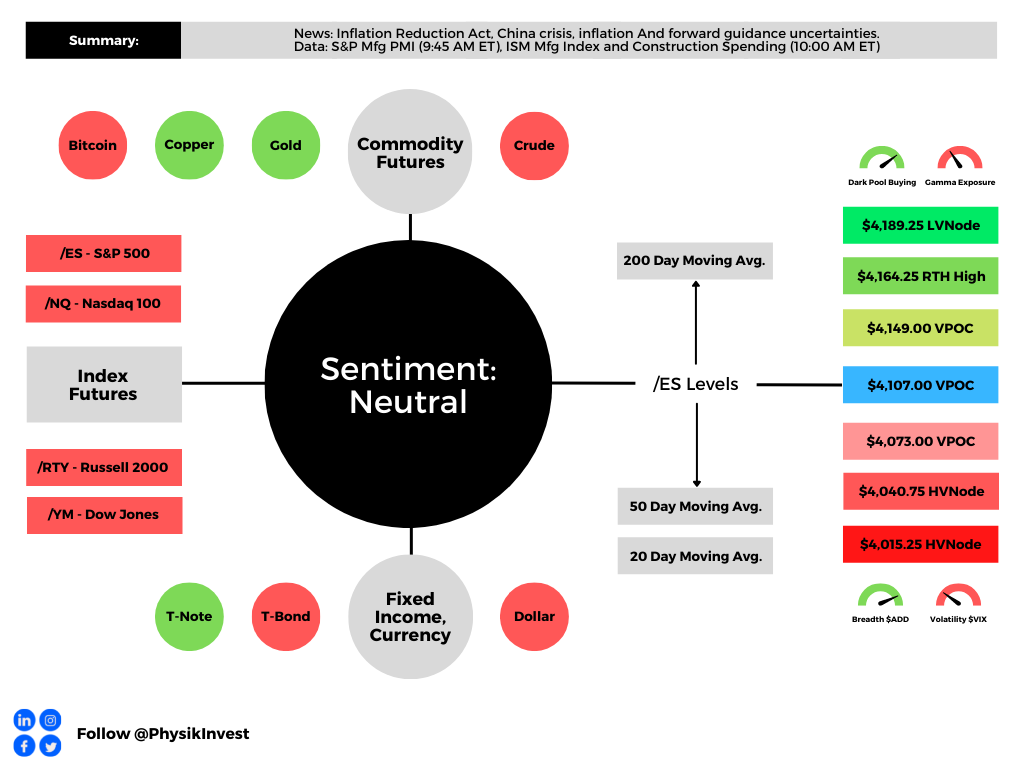
Graphic updated 5:40 AM ET. Sentiment Neutral if expected /MES open is inside of the prior day’s range. /MES levels are derived from the profile graphic at the bottom of this letter. Click here for the latest levels. SqueezeMetrics Dark Pool Index (DIX) and Gamma (GEX) with the latter calculated based on where the prior day’s reading falls with respect to the MAX and MIN of all occurrences available. A higher DIX is bullish. The lower the GEX, the more (expected) volatility. Click to learn the implications of volatility, direction, and moneyness. Breadth reflects a reading of the prior day’s NYSE Advance/Decline indicator. The CBOE VIX Volatility Index (INDEX: VVIX) reflects the attractiveness of owning volatility. UMBS prices via MND. Click here for the economic calendar.
Administrative
Morning, team. Still working on a bigger write-up for later this week. Here are some key things to know. Have a good day!
Positioning
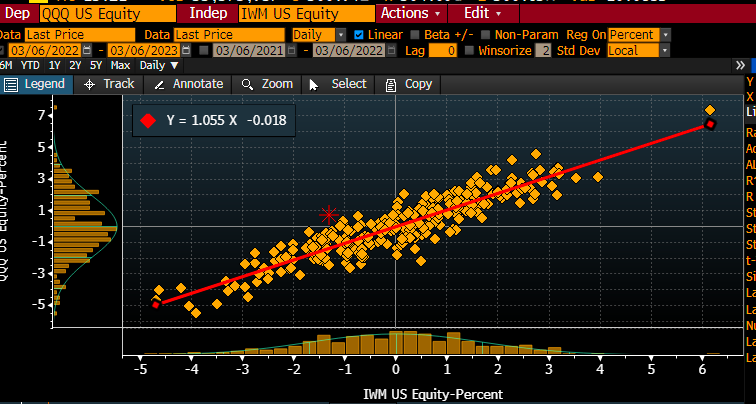
After a boost bolstered by systematic-type investors acting on changes in trend and volatility, the market is at a pivot of sorts.
Graphic: Retrieved from Danny Kirsch of Piper Sandler Companies (NYSE: PIPR). The move in [Nasdaq 100] relative to [the Russell 2000], [S&P 500 versus Russell 2000] looks similar. Ties into re-grossing theme, adding longs (QQQ+SPY) and shorts (IWM). Also fits with recent bid for credit.”
After a test of key areas of confluence, measures of the market’s strength weakened heading into the late-day equity weakness, Monday.
Graphic: Key market internals retrieved from TradingView.
Further, lots of the bullishness of the trend change and falling volatility was spent. The market is in a precarious state heading into Jerome Powell’s testimony, today.
Following Powell’s testimony, ranges likely expand.
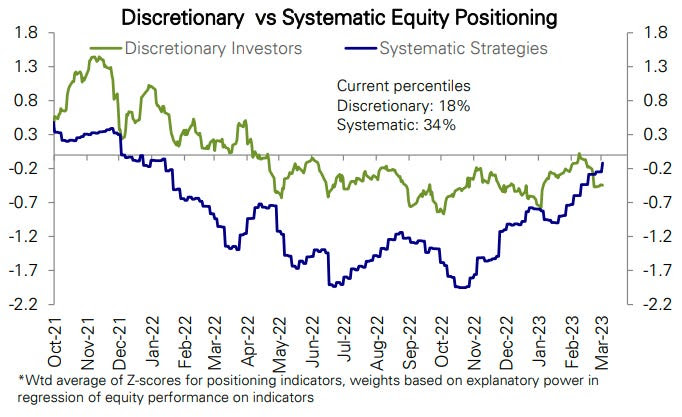
On one hand, FOMO-type demand for call options exposures, coupled with CTAs further “raising their equity exposure” on trend signals and lower volatility, may boost markets into a “more combustible” state the Daily Brief for February 17 explained.
Graphic: Retrieved from Deutsche Bank AG (NYSE: DB) via Bloomberg.
On the other hand, in the context of liquidity coming off of the table and the increased competition between equities and fixed income, should Powell disappoint, expansion of implied volatility (IVOL) on demands for protection, alone, could “draw markets lower” into the March 17 options expiration (OpEx), options data and insight provider SpotGamma says. For more on how to trade this precariousness and reduce portfolio downside, see the Daily Brief for March 3.
Technical
As of 5:30 AM ET, Tuesday’s regular session (9:30 AM – 4:00 PM ET), in the S&P 500, is likely to open in the upper part of a positively skewed overnight inventory, inside of the prior day’s range, suggesting a limited potential for immediate directional opportunity.
The S&P 500 pivot for today is $4,059.25.
Key levels to the upside include $4,071.25, $4,082.75, and $4,095.25.
Key levels to the downside include $4,045.25, $4,032.75, and $4,019.00.
Disclaimer: Click here to load the updated key levels via the web-based TradingView platform. New links are produced daily. Quoted levels likely hold barring an exogenous development.
Graphic: 65-minute profile chart of the Micro E-mini S&P 500 Futures.
Definitions
Volume Areas: Markets will build on areas of high-volume (HVNodes). Should the market trend for a period of time, this will be identified by a low-volume area (LVNodes). The LVNodes denote directional conviction and ought to offer support on any test.
If participants auction and find acceptance in an area of a prior LVNode, then future discovery ought to be volatile and quick as participants look to the nearest HVNodes for more favorable entry or exit.
POCs: Areas where two-sided trade was most prevalent in a prior day session. Participants will respond to future tests of value as they offer favorable entry and exit.
Volume-Weighted Average Prices (VWAPs): A metric highly regarded by chief investment officers, among other participants, for quality of trade. Additionally, liquidity algorithms are benchmarked and programmed to buy and sell around VWAPs.
About
The author, Renato Leonard Capelj, spends the bulk of his time at Physik Invest, an entity through which he invests and publishes free daily analyses to thousands of subscribers. The analyses offer him and his subscribers a way to stay on the right side of the market.
You may view this letter’s content calendar at this link.
Disclaimer
Do not construe this newsletter as advice. All content is for informational purposes. Capelj and Physik Invest manage their own capital and will not solicit others for it.
The daily brief is a free glimpse into the prevailing fundamental and technical drivers of U.S. equity market products. Join the 990+ that read this report daily, below!
Graphic updated 9:20 AM ET. Sentiment Risk-On if expected /ES open is above the prior day’s range. /ES levels are derived from the profile graphic at the bottom of the following section. Levels may have changed since initially quoted; click here for the latest levels. SqueezeMetrics Dark Pool Index (DIX) and Gamma (GEX) calculations are based on where the prior day’s reading falls with respect to the MAX and MIN of all occurrences available. A higher DIX is bullish. At the same time, the lower the GEX, the more (expected) volatility. Learn the implications of volatility, direction, and moneyness. Breadth reflects a reading of the prior day’s NYSE Advance/Decline indicator. VIX reflects a current reading of the CBOE Volatility Index (INDEX: VIX) from 0-100.
Fundamental
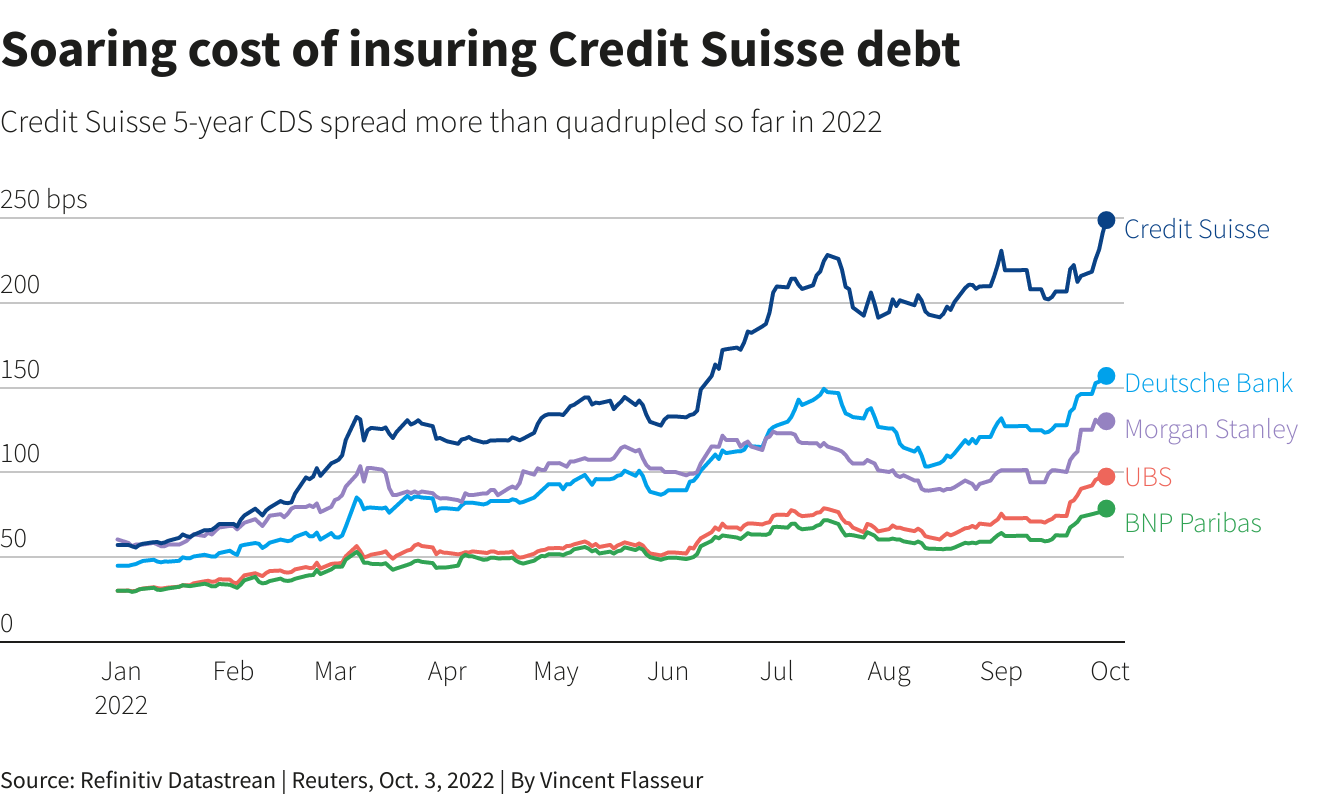
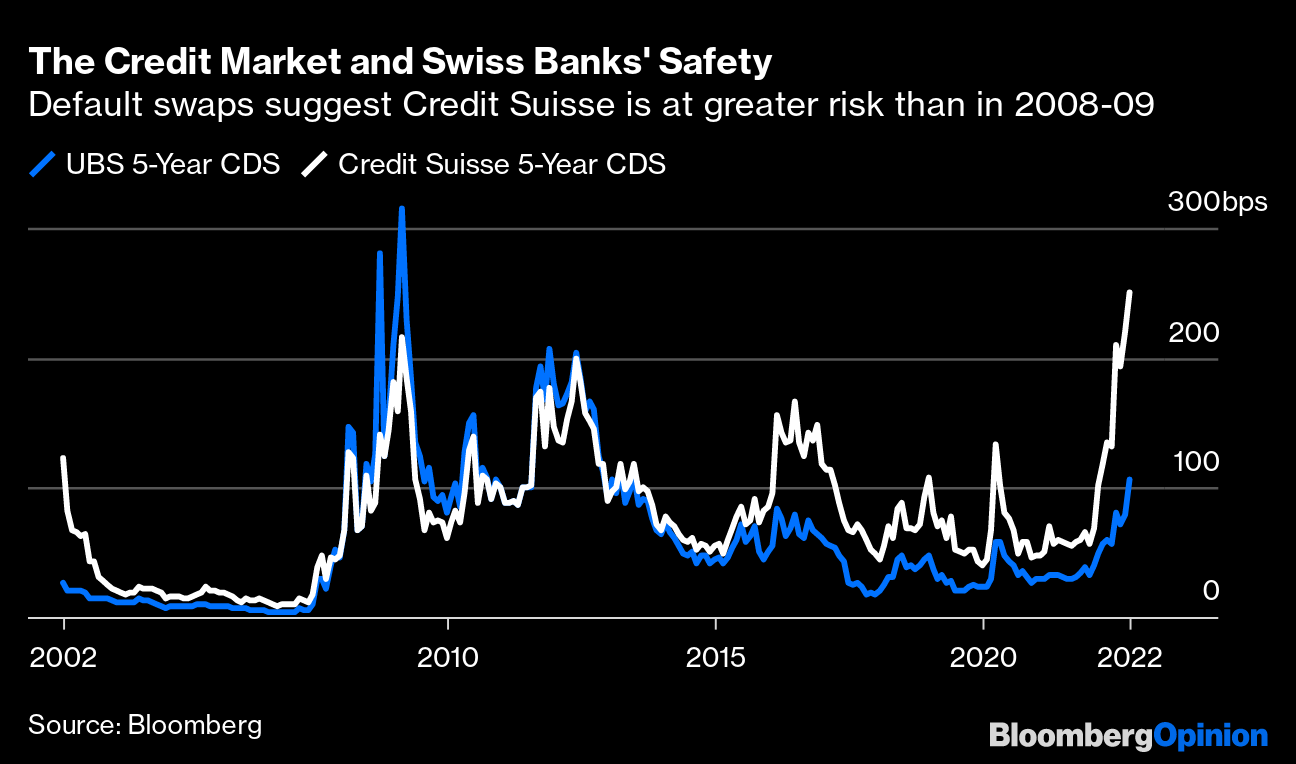
Fresh and top of mind, still, is the Credit Suisse Group AG (NYSE: CS) debacle. However, despite the bank’s “critical moment,” as discussed in yesterday’s letter, credit default swap (CDS) levels, though still rising, are “far from distressed.”
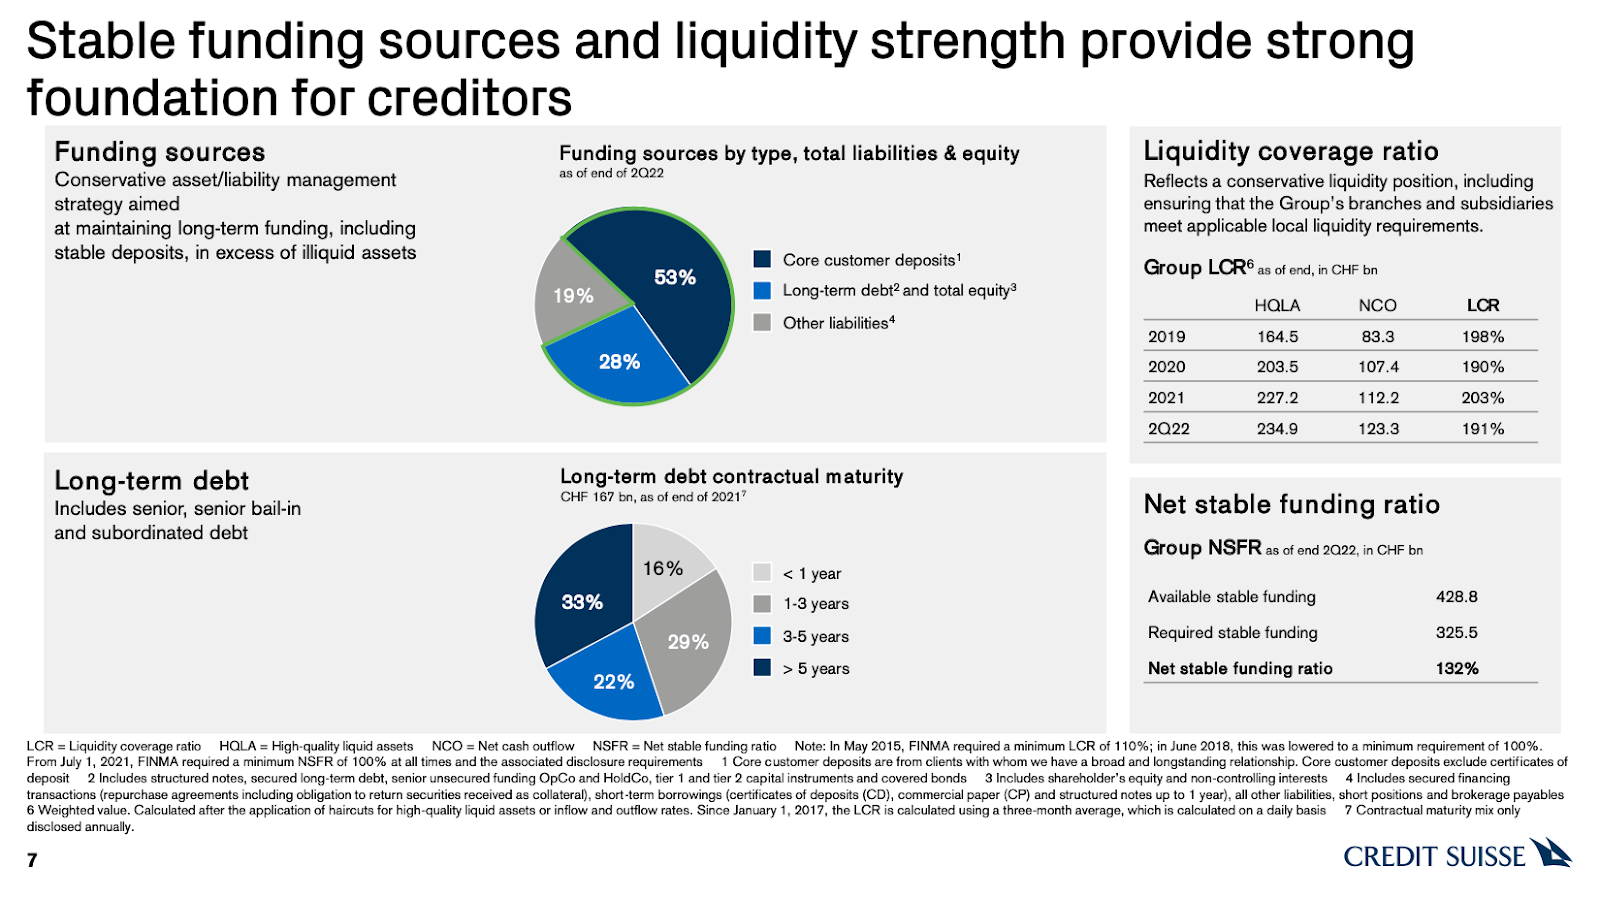
Adding, not reflected by the stock is a “strong capital base and liquidity position,” per CS.
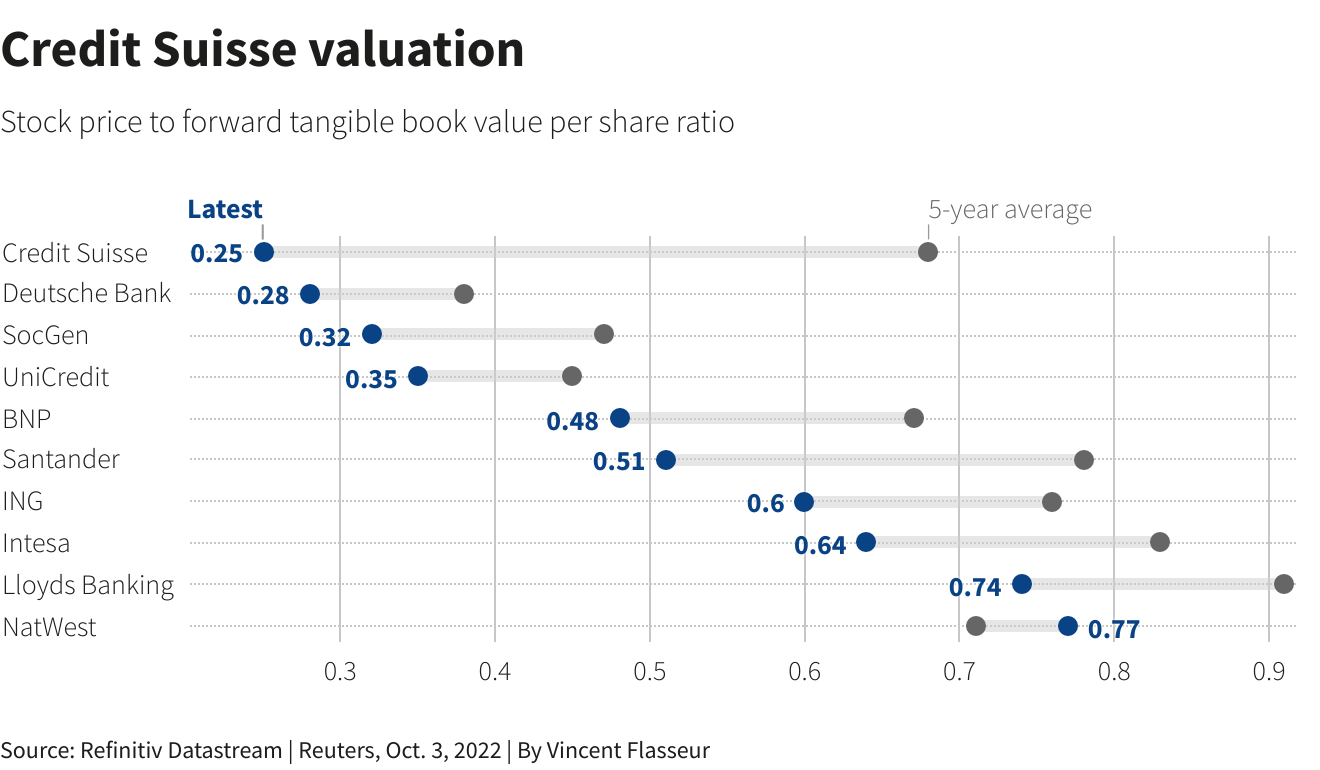
Graphic: Retrieved from Credit Suisse Group AG (NYSE: CS).
A big topic speculated on was CS’ probability of default. At its core, CDS spreads relate to the probability of default in the following way, per Deutsche Bank AG (NYSE: DB) research:
(CDS Spread) / (1 – Recovery Rate) = Implied Probability Of Default.
The recovery rate is basically the (estimated) amount of a loan that will be repaid in the case of a bankruptcy or default. Per European Central Bank research, “the standard recovery rate used by the industry in price calculations is 40%.”
Roughly speaking, below is a quick calculation:
250 basis points / (1 – 0.40) = 416.67 basis points = 4.17% Implied Probability Of Default
In CS’ case, if the spread is 250 basis points, assuming a 40% recovery, that’s a 4.17% default probability implied. If the spread was at 150 basis points, then, assuming a 40% recovery, that’s a 2.5% chance of default.
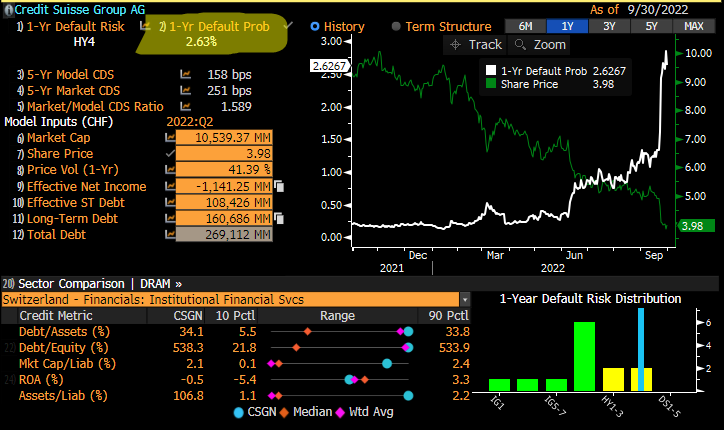
Graphic: Taken from @EffMktHype who retrieved from Bloomberg. “So many [Bloomberg] screenshots of CS CDS levels and talking about massive default prob numbers. Zero people actually using [the] same terminal to look at default risk screen.”
Taken together, in short, similar to as we put forth, yesterday, “[t]his is not 2008,” per Citigroup Inc’s (NYSE: C) Andrew Coombs. Bloomberg adds that Morgan Stanley (NYSE: MS) faced its own credit spread debacle during 2011 European debt exposure rumors; “it took months for the price of the default swaps to fall as the feared losses never materialized.”
Ahead of an October 27 CS review covering topics including “a large-scale investment banking retreat, … [i]nvestors are worried about how much the bank will [have to] cover” a restructuring.
Bloomberg adds: “A sale of Credit Suisse’s structured-products group, which trades securitized debt, has attracted interest from potential buyers, … [amid] rising interest rates.”
Per UBS Group AG (NYSE: UBS) research, a sale of such businesses, which may be worth more than the market is currently implying, “could help to avoid a dilutive capital increase.”
Positioning
“Month-end portfolio rebalances and [the] expiration of quarterly option strategies [acted] in support of the market,” JPMorgan Chase & Co’s (NYSE: JPM) Marko Kolanovic stated in a September 30, 2022 commentary titled “Throwing rocks in glass houses.”
In that same commentary, Kolanovic eased support for his 2022 price targets on economic volatility led by central banks, the war in Europe, and beyond.
As stated last week, per Kai Volatility’s Cem Karsan, it’s the case that the removal of options strategies and potential supply of protection (as investors further come to the realization that options protection has done little to protect against downside) may provide markets a boost.
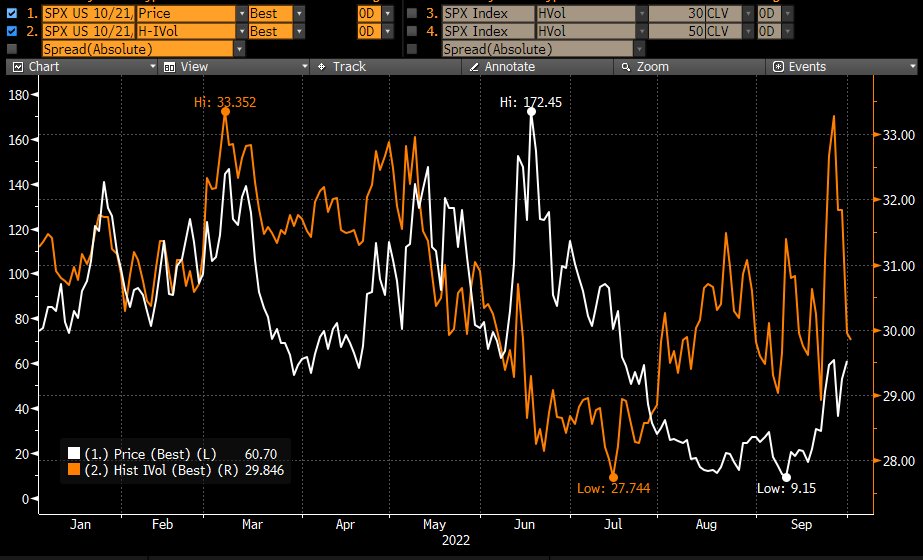
Graphic: Taken from @Alpha_Ex_LLC who retrieved from Bloomberg. S&P 500 (INDEX: SPX) October put option lower in price and volatility.
Ultimately, though, a final resolution would be “tied to the incremental effects on liquidity,” (e.g., QT manifesting itself as “$4.5 billion less in demand for assets per day,” and buyback blackout) while options repositioning may make the case for increased fragility, as traders’ falling demand for put protection opens the door to less supportive hedging flows with respect to time (Charm) and volatility (Vanna) changes.
Therefore, trades such as the Short Ratio Put Spread, particularly if narrower, may be far riskier to employ into the end of this year and the middle half of next year. For context, this was a trade to have on this year.
As participants continue to make the aforementioned realizations and supply to the market put (downside protection), tails may “continue to be cheap,” and discount “crash risk,” according to The Ambrus Group’s Kris Sidial.
A lot more to resolve this jumbled mess of a newsletter in the coming days.
Technical
As of 9:10 AM ET, Tuesday’s regular session (9:30 AM – 4:00 PM ET), in the S&P 500, is likely to open in the upper part of a positively skewed overnight inventory, outside of prior-range and -value, suggesting a potential for immediate directional opportunity.
In the best case, the S&P 500 trades higher.
Any activity above the $3,771.25 HVNode puts into play the $3,826.25 HVNode. Initiative trade beyond the last-mentioned could reach as high as the $3,862.25 HVNode and $3,893.00 VPOC, or higher.
In the worst case, the S&P 500 trades lower.
Any activity below the $3,771.25 HVNode puts into play the $3,722.50 LVNode. Initiative trade beyond the LVNode could reach as low as the $3,671.00 VPOC and $3,610.75 HVNode, or lower.
Click here to load today’s key levels into the web-based TradingView charting platform. Note that all levels are derived using the 65-minute timeframe. New links are produced, daily.
Graphic: 65-minute profile chart of the Micro E-mini S&P 500 Futures.
Definitions
Volume Areas: A structurally sound market will build on areas of high volume (HVNodes). Should the market trend for long periods of time, it will lack sound structure, identified as low volume areas (LVNodes). LVNodes denote directional conviction and ought to offer support on any test.
If participants were to auction and find acceptance into areas of prior low volume (LVNodes), then future discovery ought to be volatile and quick as participants look to HVNodes for favorable entry or exit.
POCs: POCs are valuable as they denote areas where two-sided trade was most prevalent in a prior day session. Participants will respond to future tests of value as they offer favorable entry and exit.
Vanna: The rate at which the delta of an option changes with respect to volatility.
Charm: The rate at which the delta of an option changes with respect to time.
About
After years of self-education, strategy development, mentorship, and trial-and-error, Renato Leonard Capelj began trading full-time and founded Physik Invest to detail his methods, research, and performance in the markets.
Capelj also develops insights around impactful options market dynamics at SpotGamma and is a Benzinga reporter.
In no way should the materials herein be construed as advice. Derivatives carry a substantial risk of loss. All content is for informational purposes only.
The daily brief is a free glimpse into the prevailing fundamental and technical drivers of U.S. equity market products. Join the 980+ that read this report daily, below!
Graphic updated 8:30 AM ET. Sentiment Neutral if expected /ES open is inside of the prior day’s range. /ES levels are derived from the profile graphic at the bottom of the following section. Levels may have changed since initially quoted; click here for the latest levels. SqueezeMetrics Dark Pool Index (DIX) and Gamma (GEX) calculations are based on where the prior day’s reading falls with respect to the MAX and MIN of all occurrences available. A higher DIX is bullish. At the same time, the lower the GEX, the more (expected) volatility. Learn the implications of volatility, direction, and moneyness. Breadth reflects a reading of the prior day’s NYSE Advance/Decline indicator. VIX reflects a current reading of the CBOE Volatility Index (INDEX: VIX) from 0-100.
Administrative
Ended last week on a strong note and started this week on a lighter, less impactful note.
Separately, due to travel commitments, there may be inconsistency in the frequency of posts in the coming weeks, particularly October 10-21, 2022.
Fundamental
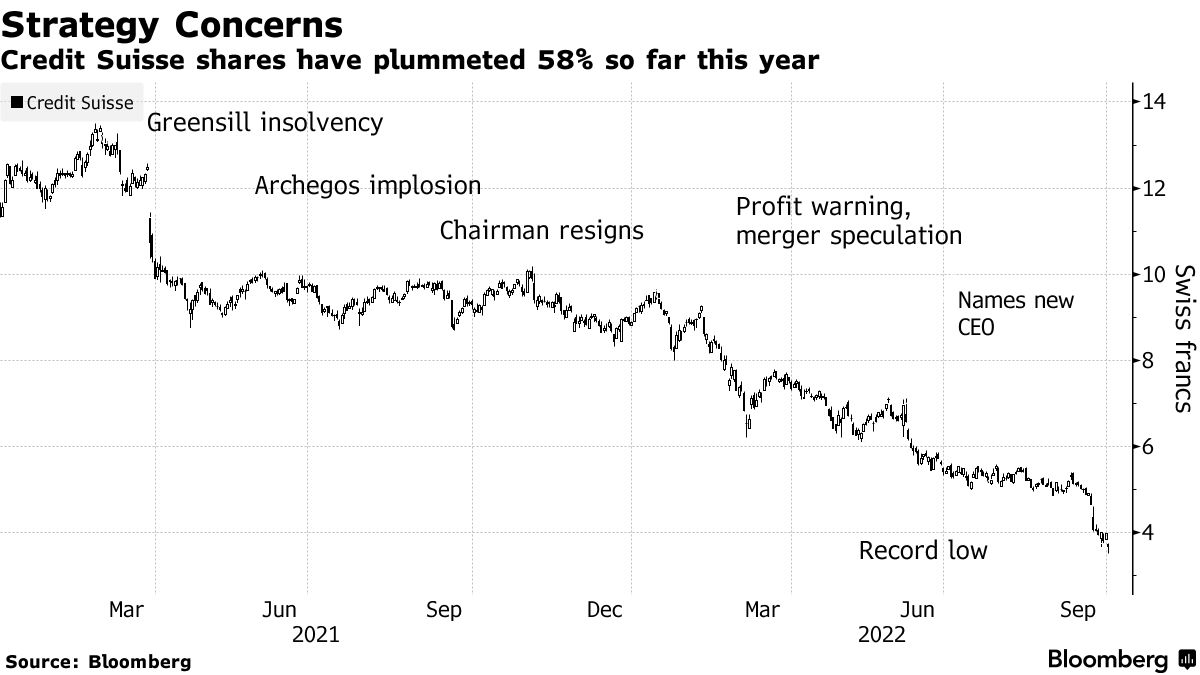
A lot of noise this weekend. Top headlines and posts on social media concerned the stability of Credit Suisse Group AG (NYSE: CS), for one, which is slated to open about 5% lower today.
CEO Ulrich Koerner said the bank is at a “critical moment” while stressing stock prices did not reflect its “strong capital base and liquidity position.” The bank’s key capital ratio sits at 13.5%, higher than what Deutsche Bank AG (NYSE: DB) had in 2016 when it was in trouble.
Graphic: Retrieved from Bloomberg. “Credit Suisse Group AG shares are now a “buy for the brave,” said Citigroup Inc. analysts on Monday.”
A hot topic, too, is the bank’s credit default swap (CDS) levels which “are still far from distressed and are part of a broad market selloff,” Bloomberg concludes.
For context, a CDS is a tool to hedge against the risk of some credit event (e.g., bankruptcy, a failure to pay, restructuring of debt, repudiation/moratorium, and obligation acceleration or an obligation default). The settlement of a CDS involves the exchanging of bonds for their par value or a cash payment equal to the difference between par and the bond’s market value.
Graphic: Retrieved from Bloomberg. “There is now a roughly 23% chance the bank defaults on its bonds within 5 years.” A CDS spread at – say 250 bps – “assuming a recovery of zero,” implies an annual default probability of 2.5%.
Moreover, in spite of all the discussion and debate online, “Credit Suisse is not creating anything like the angst we experienced [in 2008],” said columnist John Authers.
If no bailout is needed, “as the CEO’s memo endeavors to show, then all the talk has left it very much oversold.”
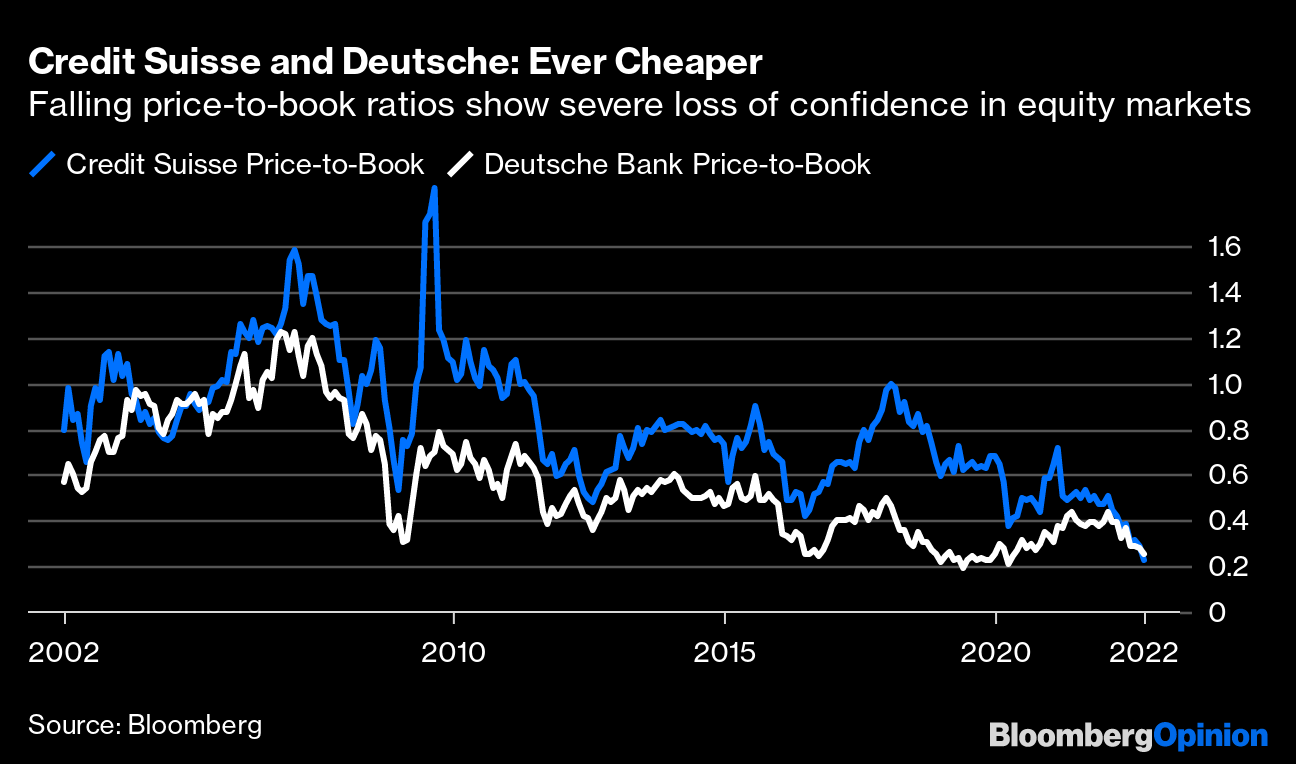
Graphic: Retrieved from Bloomberg. CS trades at less than book value (assets less liabilities).
In other news, Liz Truss, the Prime Minister of the UK, shifted her focus from some fiscal stimuli which “bec[ame] a distraction from [the] mission to get Britain moving.”
“Our focus now is on building a high growth economy that funds world-class public services, boosts wages, and creates opportunities across the country.”
For context, the last week was filled with excitement overseas, we explained in detail Monday through Friday.
In short, the announcement of new fiscal policies coincided with market volatility that prompted reflexive feedback loops and the risk of default among some pension schemes.
Some of those announcements were walked back and UK volatility eased.
Moving on.
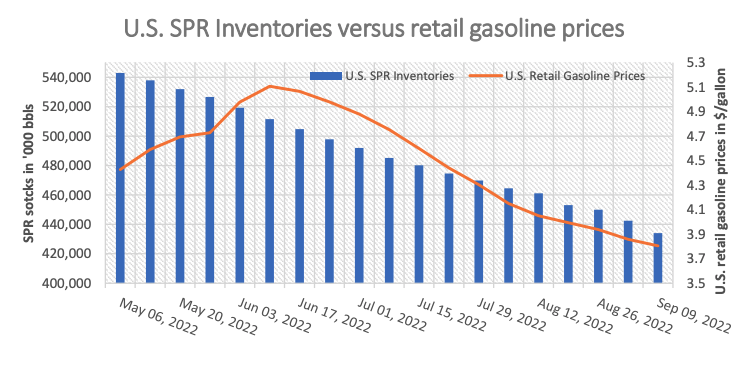
Oil was bid on news that OPEC+ is considering a cut to production in excess of a million barrels per day. This is as they look to “pre-empt” potential surpluses amid waning demand and the sale of oil from the US’s Strategic Petroleum Reserves (SPR) into November.
Graphic: Retrieved from CME Group Inc (NASDAQ: CME). “SPR release has helped tame oil prices.”
Waning demand is showing up in other areas; factor activity is falling on a slowdown, globally, as policymakers tighten and clamp down on excesses. Just yesterday, the Wall Street Journal reported that cargo shipowners were canceling sailings as shipping rates, discussed last week, plunged ~75%.
Positioning
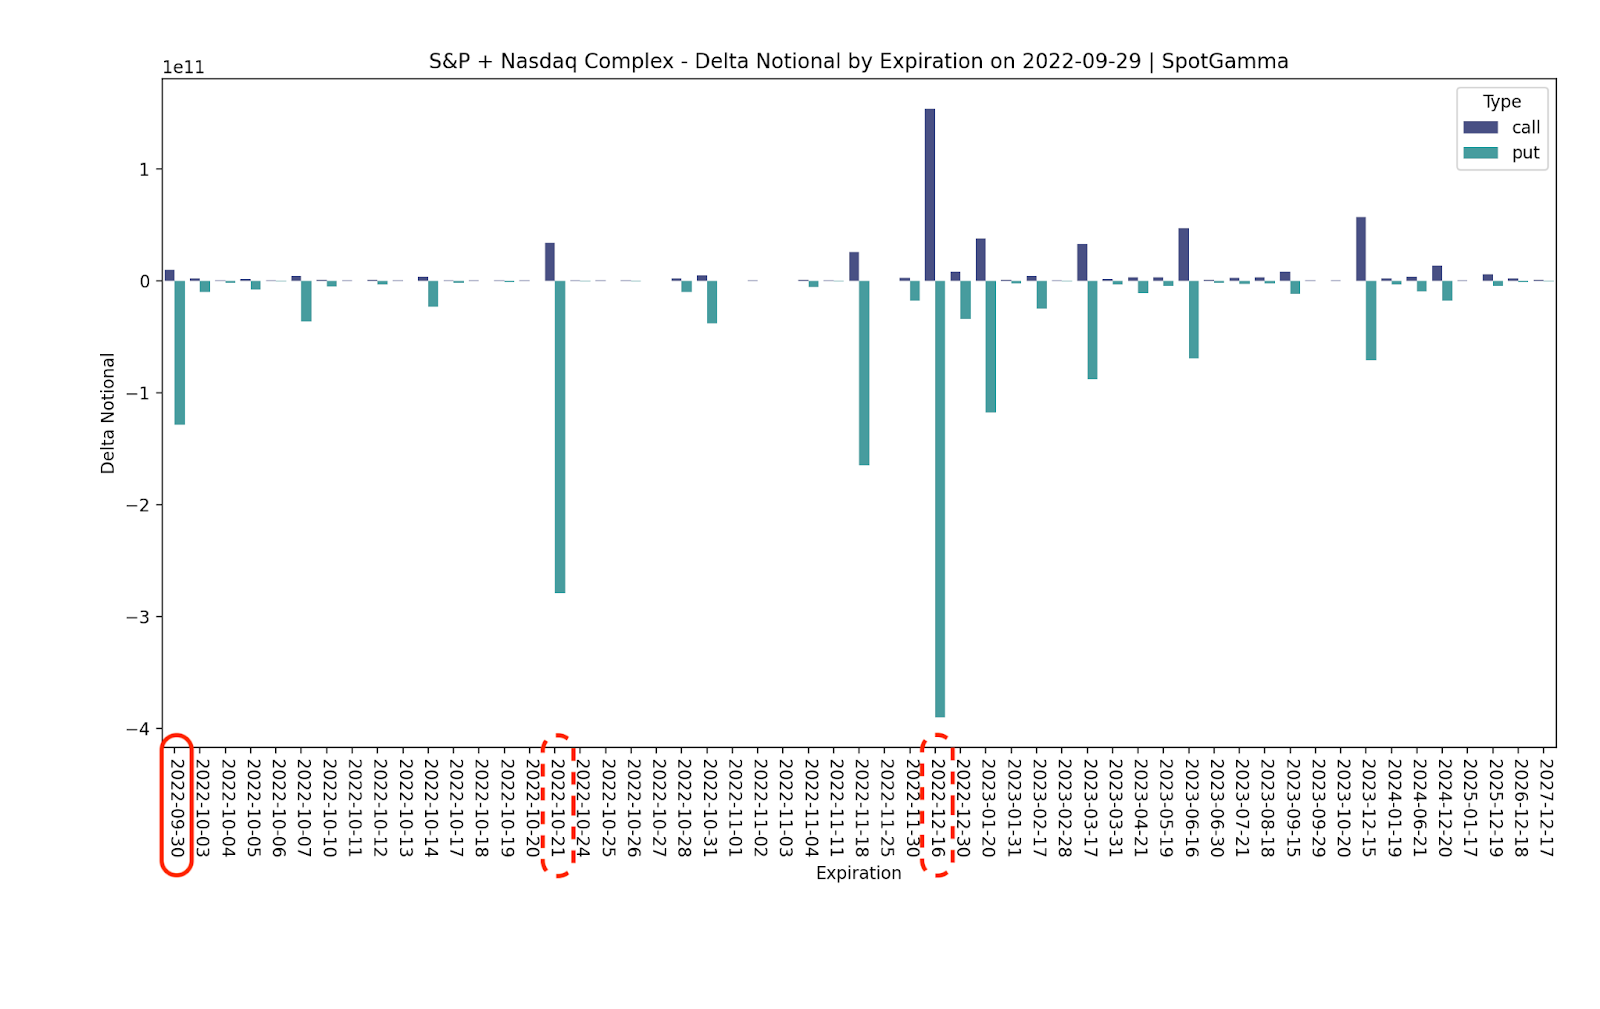
Top of mind, for many, last week was the trade, repositioning, and/or removal of large options positions coinciding with the September Quarterly Options Expiration (OPEX).
Notwithstanding, per SpotGamma data, the “expiration isn’t particularly impressive” as there is likely far “more potential market impact” expected in October and December.
Graphic: Retrieved from SpotGamma.
Still, there was a removal of a lot of put Delta. SpotGamma sees counterparties as having positive Delta (directional) exposure via short put (i.e., meaning the trade loses money if the underlying trades lower). This opens the door to relief as counterparties reposition and trim exposure to their negative Delta (offsetting) hedges via futures and/or stock.
“We believe that the expiration of large put positions can be turning points for market rallies.”
Technical
As of 7:00 AM ET, Monday’s regular session (9:30 AM – 4:00 PM ET), in the S&P 500, is likely to open in the upper part of a balanced overnight inventory, inside of prior-range and -value, suggesting a limited potential for immediate directional opportunity.
In the best case, the S&P 500 trades higher.
Any activity above the $3,610.75 HVNode puts into play the $3,653.00 VPOC. Initiative trade beyond the VPOC could reach as high as the $3,688.75 HVNode and $3,722.50 LVNode, or higher.
In the worst case, the S&P 500 trades lower.
Any activity below the $3,610.75 HVNode puts into play the $3,554.75 HVNode. Initiative trade beyond the last-mentioned could reach as low as the $3,506.25 and $3,444.75 HVNode, or lower.
Click here to load today’s key levels into the web-based TradingView charting platform. Note that all levels are derived using the 65-minute timeframe. New links are produced, daily.
Graphic: 65-minute profile chart of the Micro E-mini S&P 500 Futures.
Definitions
Volume Areas: A structurally sound market will build on areas of high volume (HVNodes). Should the market trend for long periods of time, it will lack sound structure, identified as low volume areas (LVNodes). LVNodes denote directional conviction and ought to offer support on any test.
If participants were to auction and find acceptance into areas of prior low volume (LVNodes), then future discovery ought to be volatile and quick as participants look to HVNodes for favorable entry or exit.
About
After years of self-education, strategy development, mentorship, and trial-and-error, Renato Leonard Capelj began trading full-time and founded Physik Invest to detail his methods, research, and performance in the markets.
Capelj also develops insights around impactful options market dynamics at SpotGamma and is a Benzinga reporter.
In no way should the materials herein be construed as advice. Derivatives carry a substantial risk of loss. All content is for informational purposes only.
The daily brief is a free glimpse into the prevailing fundamental and technical drivers of U.S. equity market products. Join the 800+ that read this report daily, below!
Graphic updated 7:20 AM ET. Sentiment Neutral if expected /ES open is inside of the prior day’s range. /ES levels are derived from the profile graphic at the bottom of the following section. Levels may have changed since initially quoted; click here for the latest levels. SqueezeMetrics Dark Pool Index (DIX) and Gamma (GEX) calculations are based on where the prior day’s reading falls with respect to the MAX and MIN of all occurrences available. A higher DIX is bullish. At the same time, the lower the GEX, the more (expected) volatility. Learn the implications of volatility, direction, and moneyness. Breadth reflects a reading of the prior day’s NYSE Advance/Decline indicator. VIX reflects a current reading of the CBOE Volatility Index (INDEX: VIX) from 0-100.
Hey team – the Daily Briefwill bepaused until August 29, at least, due to Renato’s travel commitments.
Apologies and thank you for the support!
Positioning
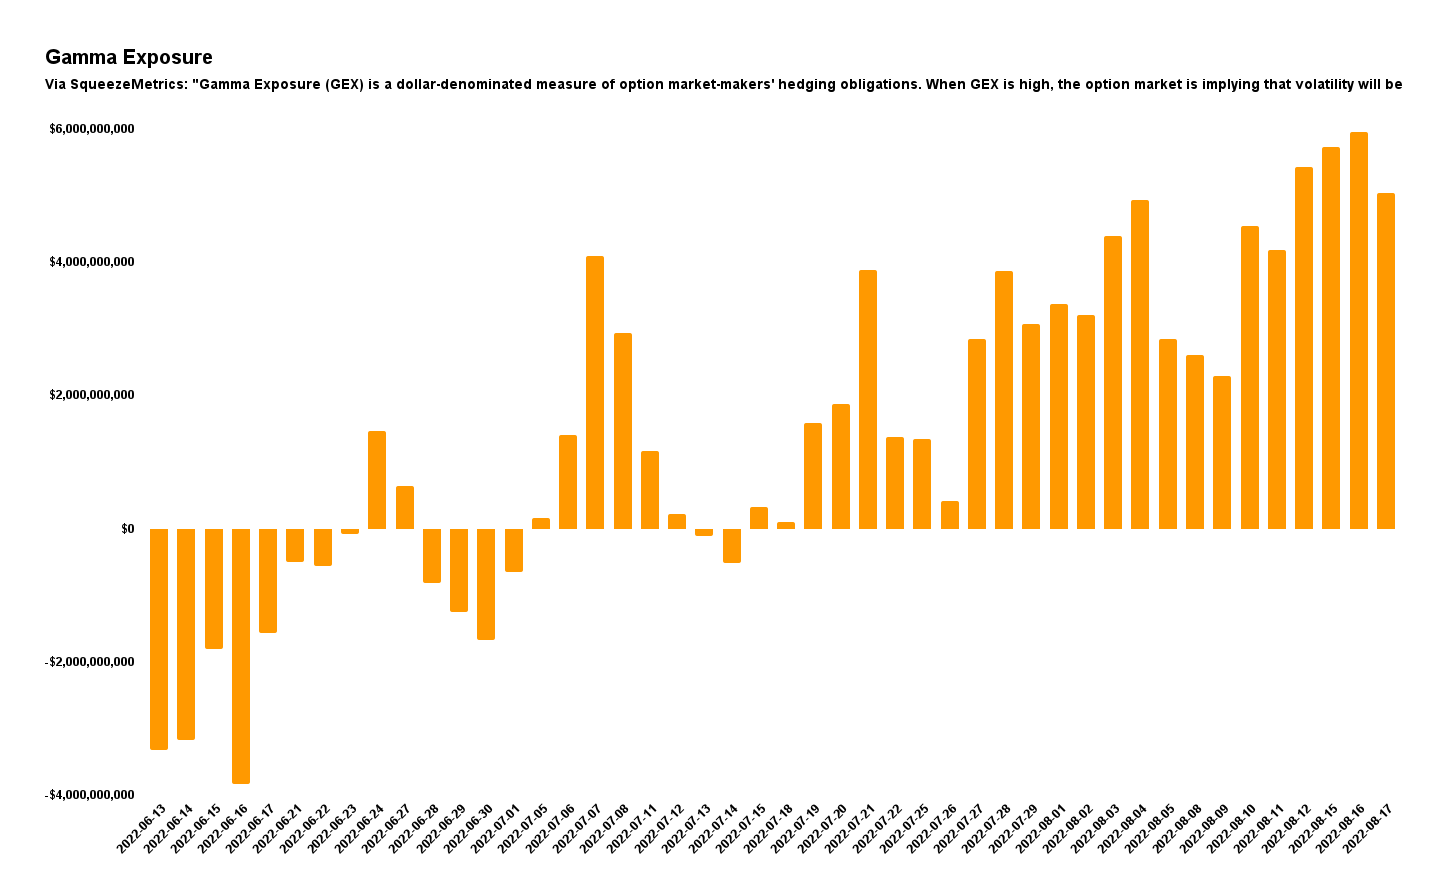
As of 7:20 AM ET, Thursday’s expected volatility, via the Cboe Volatility Index (INDEX: VIX), sits at ~1.05%. Net Gamma exposures (generally) rising may promote tighter trading ranges.
Graphic: Via Physik Invest. Data retrieved from SqueezeMetrics.
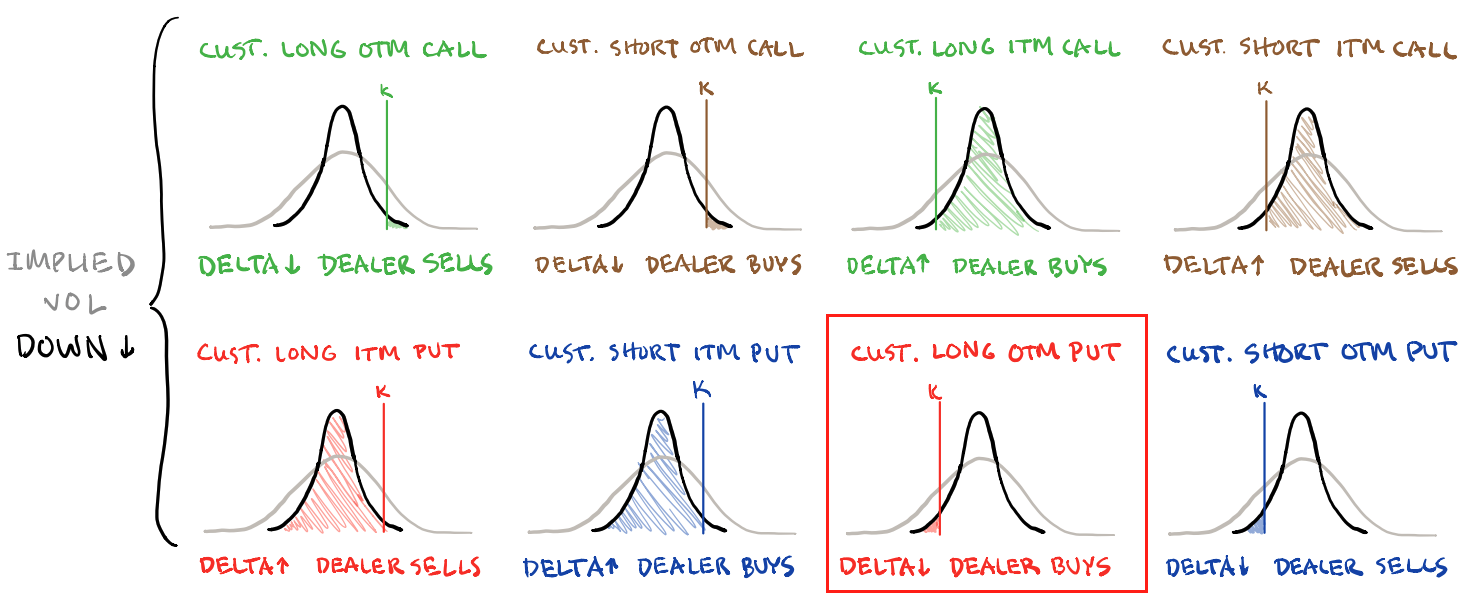
As an aside, real quick, in a rising market, characterized by demand for call options, those who are on the other side of options trades, hedge in a manner that may bolster the upside (i.e., the naive theory is that if customers buy calls, then counterparties sell calls + buy stock to hedge).
That said, if IVOL drops, liquidity providers’ out-of-the-money (in-the-money) Delta exposures drop (rise) and, thus, they will sell (buy) underlying hedges which may pressure (support) the advance or play into pinning action, as seen over the past week or so at the $4,300.00 options strike, at which there is a lot of open interest and volume, in the S&P 500.
Read: The Implied Order Book by SqueezeMetrics for a sort-of detailed primer on this.
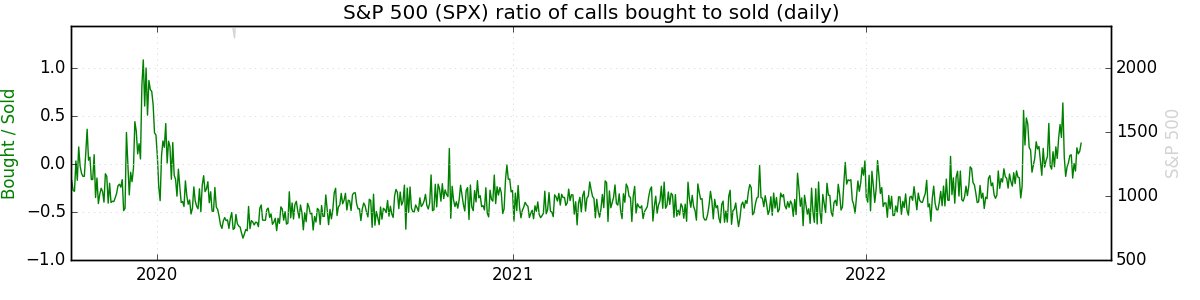
Graphic: Updated 8/15/2022. Retrieved from SqueezeMetrics.
Given realized (RVOL) and implied (IVOL) volatility measures, as well as skew, it is beneficial to be a buyer of options structures to protect against (potential) downside (e.g., S&P 500 [INDEX: SPX] +1 x -2 Short Ratio Put Spread | 200+ Points Wide | 15-30 DTE | @ $0.00 or better).
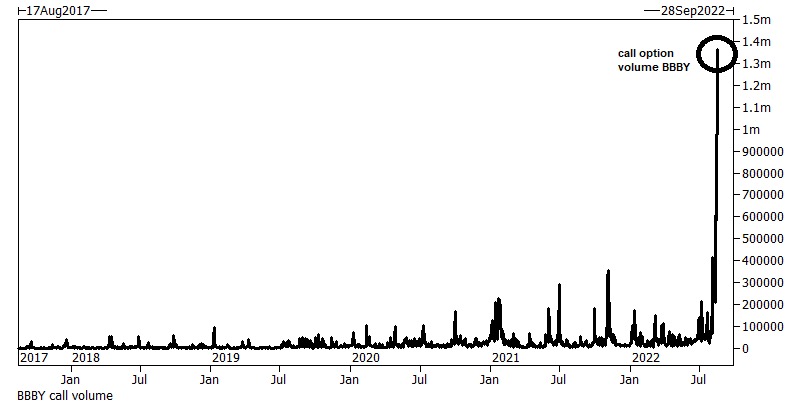
This is not to say that call options, which we said could “outperform” their Delta (i.e., exposure to direction) weeks ago, are out of favor (note: this is the case for something such as an SPX, not a Bed Bath & Beyond Inc [NASDAQ: BBBY]).
Graphic: Retrieved from Corey Hoffstein. Via Goldman Sachs Group Inc (NYSE: GS).
No! On the contrary, Goldman Sachs Group Inc (NYSE: GS) strategists say “call premiums are attractive.” This is “evidenced by [their] GS-EQMOVE model which estimates 33% probability of a 1-month 5% up-move versus only 13% implied by the options market.”
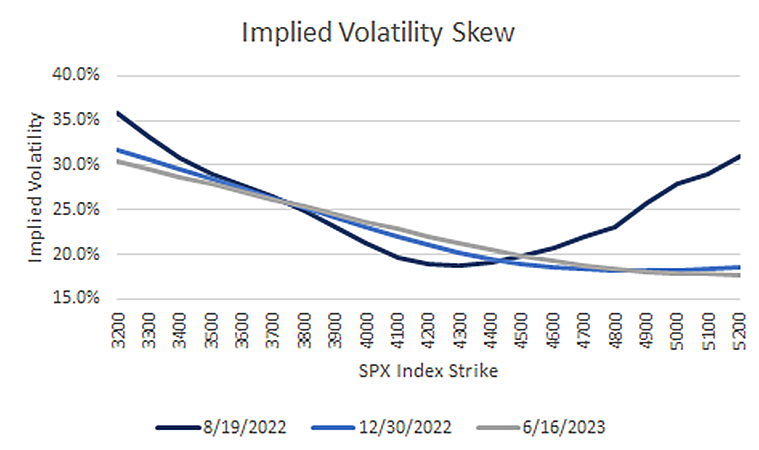
A quick check of implied volatility skew, which is a plot of the implied volatility levels for options across different strike prices, shows a smile in the shortest of tenors, rather than a usual smirk.
Graphic: Retrieved from Cboe Global Markets Inc (BATS: CBOE).
Given this, the options with strike prices above current market prices are seemingly more pricey than those that have more time to expiration. One could think about structuring something like a Short Ratio Call Spread or, even, a Long Call Calendar Spread at or above current prices.
In the latter, any sideways-to-higher movement would allow for that spread to expand for profit.
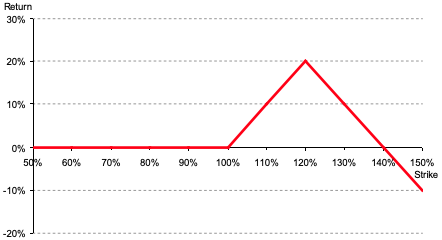
Graphic: Via Banco Santander SA (NYSE: SAN) research, the return profile, at expiry, of a classic 1×2 (long 1, short 2 further away) ratio spread.
Context: Participants’ proactive hedging of positive Delta equity exposure, via negative Delta put option exposures, as well as the monetization of those hedges into the decline, resulted in poor performance in IVOL metrics like the Cboe Volatility Index (INDEX: VIX).
Therefore, per the Cboe, it’s the case that “since the launch of the VIX Index, the past six-month period has been the weakest for volatility in 29 years, relative to similar [SPX] price moves.”
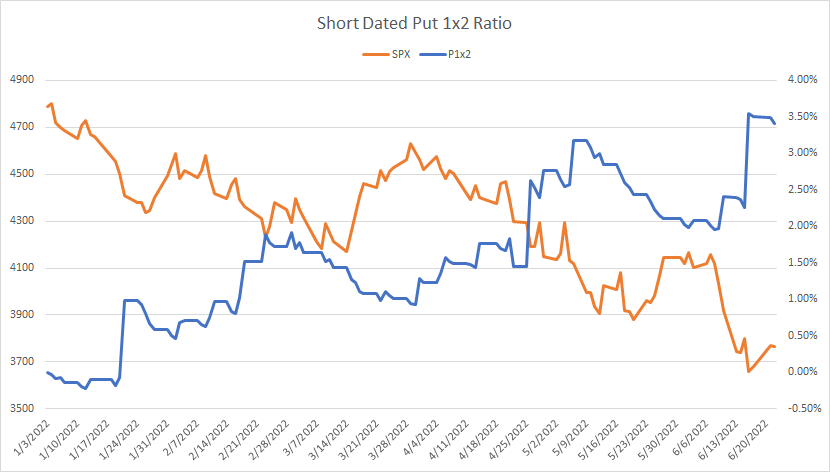
Accordingly, its structures we thought would work best, given the potential for measured selling, which others thought would carry a lot of risks, such as Short Ratio Put Spreads, that performed best, seen below.
Graphic: Via Pat Hennessy. “[T]he performance of short-dated 1×2 put ratios in SPX this year. Despite being short the tail, the grind lower has been well captured by this trade structure.”
Moreover, it’s the case that after a nearly 20% multi-month run, higher, markets are stretched.
To continue this pace would require, per JPMorgan Chase & Co (NYSE: JPM) strategists, a continued interest in demand for positive Delta exposure via equity or options, lower prints of consumer price data, as well as a dovish Federal Reserve (Fed) inflection.
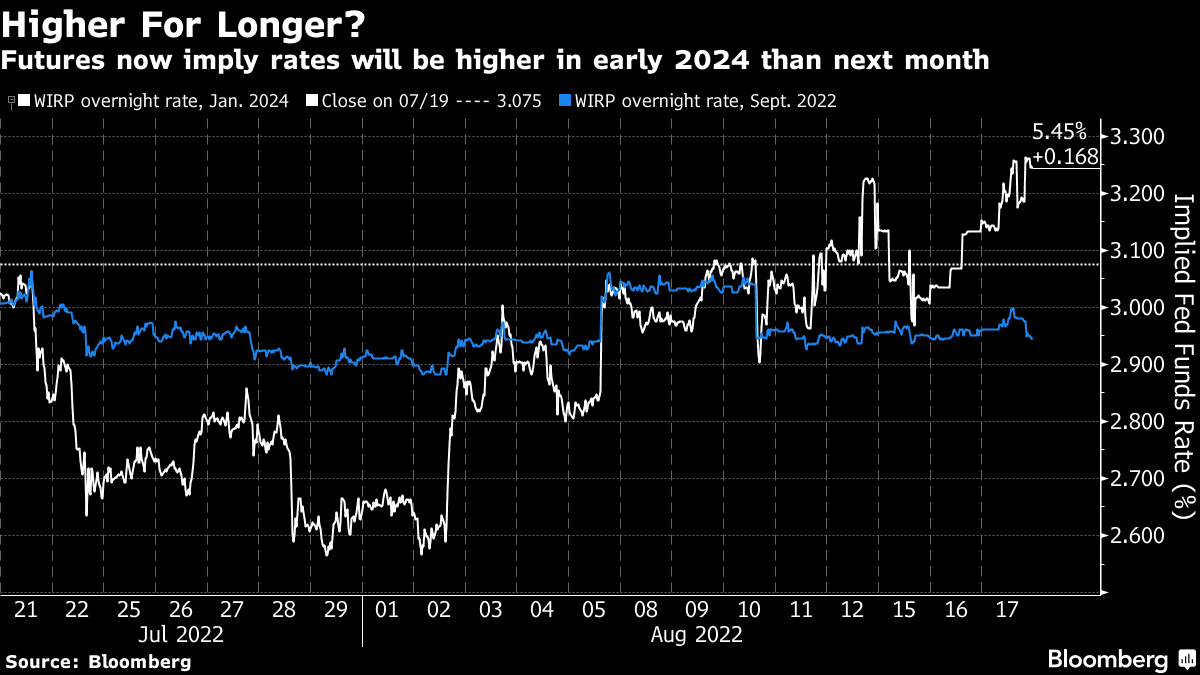
The former we see now via call option volumes. The latter, not so much as the Federal Open Market Committee (FOMC) minutes “left the door open to another ‘unusually large’ increase at the next meeting in September,” in spite of a commitment to dial back if the data supported.
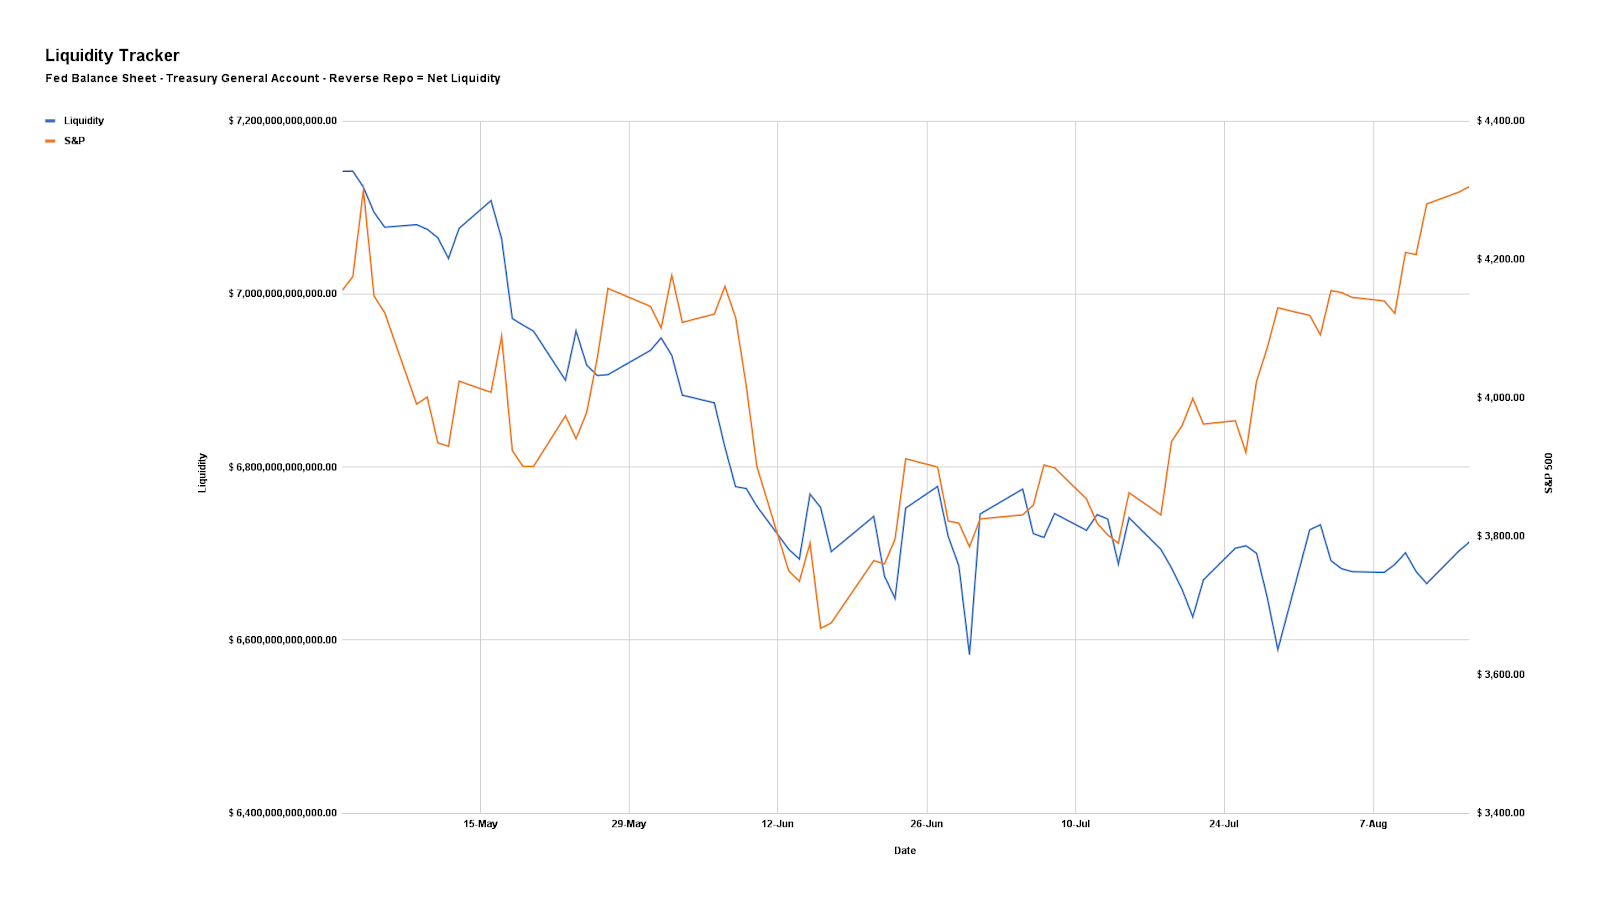
Graphic: Via Physik Invest. Data compiled by @jkonopas623. Fed Balance Sheet data, here. Treasury General Account Data, here. Reverse Repo data, here. NL = BS – TGA – RRP.
Presently, retail sales are steady, and supply pressures, though starting to ease, remain, bolstering inflation which the Fed is ultimately trying to stop from becoming entrenched.
Though there are fundamental contexts we are leaving out (e.g., negative earnings revisions, Chinese retail, industrial output, and investment data missing which prompted an easing, the use of tools like Treasury buybacks to ease disruptions via Fed-action, as well as increasing recession odds), in short, the focus should be on the technicals which actually make us money.
Graphic: Retrieved from The Market Ear. Via Bank of America Corporation (NYSE: BAC).
And, presently, on the heels of macro- and volatility-type re-leveraging, per Deutsche Bank AG (NYSE: DB) the technical contexts are bullish.
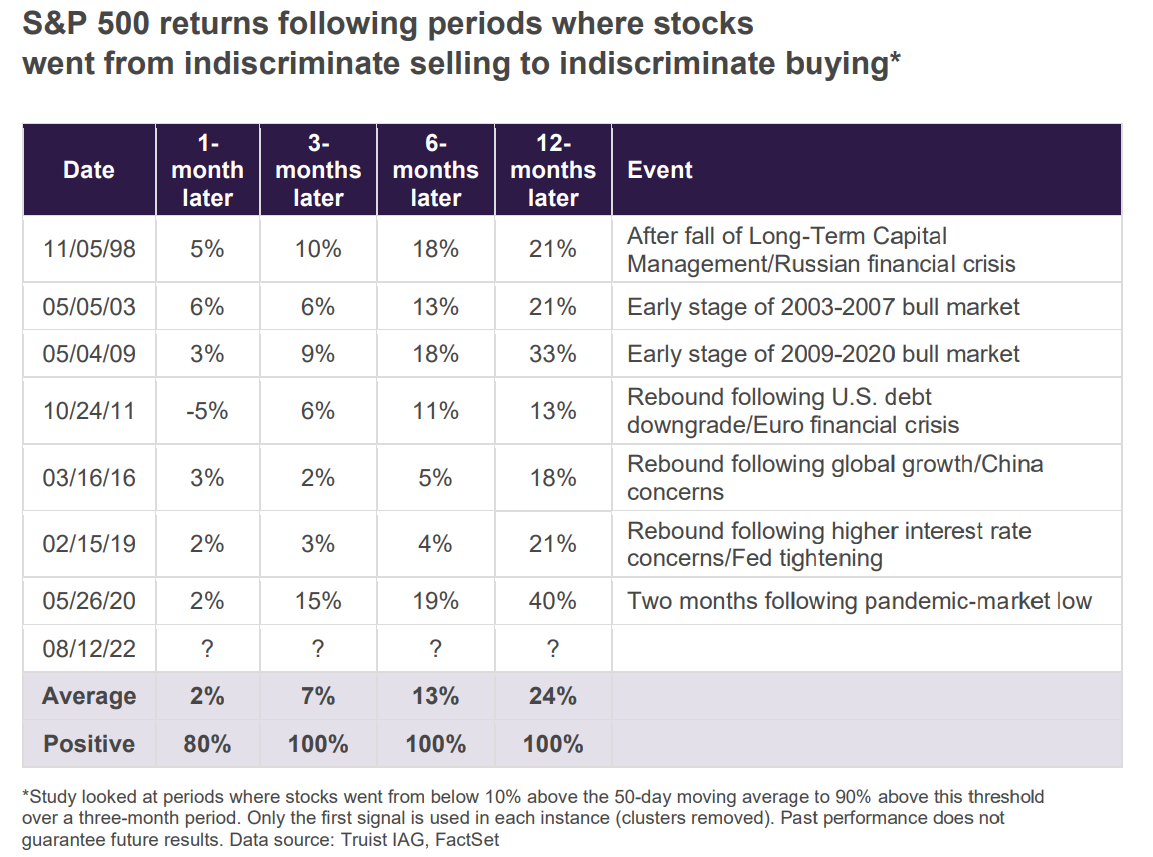
Keith Lerner, the co-chief investment officer and chief market strategist at Truist Financial Corporation’s (NYSE: TFC) Advisory Services puts it all well:
“Even if the Fed does pivot, they are less likely to support the markets as quickly as they have in the past given the scar tissue left behind as a result of the inflation challenges of the past year… The market rally over the past four weeks has been nothing short of impressive. Such strong buying pressure following indiscriminate selling has historically been a very positive sign for the market, often following important market bottoms. This is a welcome sign. Still, other factors in our work are less supportive. Indeed, markets are not only fighting the Fed, but the most aggressive global monetary tightening cycle in decades.”
Graphic: Retrieved from Bloomberg. Via Truist Financial Corporation (NYSE: TFC).
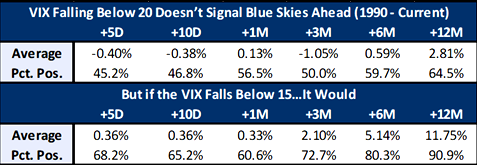
Beyond this, from a volatility perspective, we’d look for the VIX to sink below 15 to increase our optimism over a “sustained [and] better-than-typical” rally, per Jefferies Financial Group Inc (NYSE: JEF). Look at this last remark through the lens of participation on the part of traders who employ volatility-targeting strategies, for instance.
Graphic: Retrieved from The Market Ear. Via Jefferies Financial Group Inc (NYSE: JEF).
Technical
As of 7:20 AM ET, Thursday’s regular session (9:30 AM – 4:00 PM ET), in the S&P 500, is likely to open in the middle part of a balanced overnight inventory, inside of prior-range and -value, suggesting a limited potential for immediate directional opportunity.
In the best case, the S&P 500 trades higher.
Any activity above the $4,273.00 VPOC puts into play the $4,294.25 HVNode. Initiative trade beyond the HVNode could reach as high as the $4,337.00 VPOC and $4,393.75 HVNode, or higher.
In the worst case, the S&P 500 trades lower.
Any activity below the $4,273.00 VPOC puts into play the $4,253.25 HVNode. Initiative trade beyond the HVNode could reach as low as the $4,231.00 VPOC and $4,202.75 RTH Low, or lower.
Click here to load today’s key levels into the web-based TradingView charting platform. Note that all levels are derived using the 65-minute timeframe. New links are produced, daily.
Graphic: 65-minute profile chart of the Micro E-mini S&P 500 Futures.
Considerations: Responsiveness near key-technical areas (that are discernable visually on a chart), suggests technically-driven traders with short time horizons are very active.
Such traders often lack the wherewithal to defend retests and, additionally, the type of trade may be indicative of the other time frame participants waiting for more information to initiate trades.
Definitions
Volume Areas: A structurally sound market will build on areas of high volume (HVNodes). Should the market trend for long periods of time, it will lack sound structure, identified as low volume areas (LVNodes). LVNodes denote directional conviction and ought to offer support on any test.
If participants were to auction and find acceptance into areas of prior low volume (LVNodes), then future discovery ought to be volatile and quick as participants look to HVNodes for favorable entry or exit.
POCs: POCs are valuable as they denote areas where two-sided trade was most prevalent in a prior day session. Participants will respond to future tests of value as they offer favorable entry and exit.
Gamma: Gamma is the sensitivity of an option to changes in the underlying price. Dealers that take the other side of options trades hedge their exposure to risk by buying and selling the underlying. When dealers are short-gamma, they hedge by buying into strength and selling into weakness. When dealers are long-gamma, they hedge by selling into strength and buying into weakness. The former exacerbates volatility. The latter calms volatility.
Vanna: The rate at which the delta of an option changes with respect to volatility.
Charm: The rate at which the delta of an option changes with respect to time.
About
After years of self-education, strategy development, mentorship, and trial-and-error, Renato Leonard Capelj began trading full-time and founded Physik Invest to detail his methods, research, and performance in the markets.
Capelj also develops insights around impactful options market dynamics at SpotGamma and is a Benzinga reporter.
In no way should the materials herein be construed as advice. Derivatives carry a substantial risk of loss. All content is for informational purposes only.
The daily brief is a free glimpse into the prevailing fundamental and technical drivers of U.S. equity market products. Join the 700+ that read this report daily, below!
Graphic updated 6:30 AM ET. Sentiment Neutral if expected /ES open is inside of the prior day’s range. /ES levels are derived from the profile graphic at the bottom of the following section. Levels may have changed since initially quoted; click here for the latest levels. SqueezeMetrics Dark Pool Index (DIX) and Gamma (GEX) calculations are based on where the prior day’s reading falls with respect to the MAX and MIN of all occurrences available. A higher DIX is bullish. At the same time, the lower the GEX, the more (expected) volatility. Learn the implications of volatility, direction, and moneyness. Breadth reflects a reading of the prior day’s NYSE Advance/Decline indicator. VIX reflects a current reading of the CBOE Volatility Index (INDEX: VIX) from 0-100.
Fundamental
Today, we add to our narrative updates with respect to the Inflation Reduction Act, China crises, implications of earnings growth that’s down below the surface, the Federal Reserve’s pivot from forward guidance, how uncertainties boost risk premia, and geopolitics. Then, in the coming days, we’ll hone in on measuring the impact.
Let’s get into it.
Inflation Reduction Act Disinflationary
The bill, which reforms the tax code, cuts health-care costs, and helps with climate change, per Noah Smith’s letter, is disinflationary.
The reason being?
It works to shrink the deficit by $288 billion, over a decade. Additionally, though government investments are “inflationary in the short-term, and deflationary in the medium term,” embedded tax hikes “should more than cancel out the short-term inflationary piece.”
China Crisis Contained
Next, is the crisis in China.
After Evergrande fears “peaked in September, … people stopped paying their mortgages,” in protest, per Marc Rubinstein’s Net Interest letter.
Why is this problematic?
Typically, purchasers place “down payments into developer’s escrow accounts some 18-24 months before taking delivery of their home which are then topped up via mortgage loans.”
Though these funds would “cover the remaining cost of construction,” developers mismanaged and, “when the market turned – and traditional credit channels turned off their supply of new credit – many developers ran out of funds to complete projects.”
Despite “unfinished residential projects across China representing only 1.7% of total outstanding mortgage loans, … [they’re] a lot riskier,” now. Homes are a big chunk of household wealth and damage to this area of the market has major implications.
For context, home prices are to China what stock markets are to the Federal Reserve and peripheral bond spreads are to the European Central Bank.
Notwithstanding, despite “excessive leverage, regulatory arbitrage, and irresponsible risk-taking, … [China] banks are able to pursue a borrower’s other assets if they default on their mortgage, … [so] strategic defaults are less likely.”
Here Comes The Earnings De-rate?
As well explained in last Friday’s morning letter, essentially, the 2022 decline was mainly about higher inflation and interest rates.
“The second half will be about earnings,” Blockworks puts well. Here’s why.
Despite, “S&P 500 earnings [] on track to rise by a robust 9.4% in aggregate,” per statements by Deutsche Bank AG’s (NYSE: DB) Binky Chadha, growth “is down sharply below the surface.”
If the massive increase in energy earnings, the return to profitability for pandemic-impacted businesses, and the drag on banks from loan loss provisioning are excluded, the “earnings adjusted for seasonality are on track to fall sharply by -4.5% quarter-on-quarter, one of the steepest declines.”
This is among the factors prompting the likes of Meta Platforms Inc (NASDAQ: META) and Amazon Inc (NASDAQ: AMZN) to trim resources like labor.
Uncertainties Boost Risk Premia
Alfonso Peccatiello, in his letter The Macro Compass, explains that the Federal Reserve ditching forward guidance gave “markets the green light to freely design their probability distributions across all asset classes, without any anchor.”
This explains the big rally in risk assets like equities.
Notwithstanding, the Fed no longer being on autopilot promotes uncertainty and higher volatility in bonds, which is an “enemy for risk assets,” over longer time horizons.
“While ditching forward guidance might be the right monetary policy strategy, … when there is no anchor for bond markets, implied volatility will have a hard time coming down. And a higher volatility in one of the biggest, most liquid markets in the world generally requires higher (not lower) risk premia everywhere else.”
This does more to support our recent positioning analyses and the case for an “untethering” in equity implied volatility, “one of the most supportive things into the decline,” per statements by Kai Volatility’s Cem Karsan.
Tensions Flare, Elsewhere
While, on one hand, the pressures from the Russia and Ukraine conflict are beginning to ebb as the first ship carrying Ukrainian grains left for Lebanon, tensions elsewhere are flaring.
To be specific, news regarding the unrest in the Balkans, between Kosovo and Serbia, hit the wire, yesterday. Per Washington Post coverage, “Ethnic Serbs in northern municipalities of Kosovo bordering Serbia blocked roads and skirmished with police on the eve of the implementation of a law requiring them to replace their license plates with Kosovo plates.”
Per Newsweek coverage, in response, a NATO mission called KFOR would “take whatever measures are necessary to keep a safe and secure environment in Kosovo at all times, in line with its U.N. mandate.”
Adding, “Observers fear Moscow might see an opportunity in the current tensions between the two countries to push the U.S. and the NATO mission out of Kosovo.”
This is as a Chinese invasion of Taiwan may come sooner than expected, Axios reports.
Technical
As of 6:30 AM ET, Monday’s regular session (9:30 AM – 4:00 PM ET), in the S&P 500, is likely to open in the middle part of a negatively skewed overnight inventory, inside of prior-range and -value, suggesting a limited potential for immediate directional opportunity.
In the best case, the S&P 500 trades higher.
Any activity above the $4,107.00 VPOC puts into play the $4,149.00 VPOC. Initiative trade beyond the VPOCs could reach as high as the $4,164.25 RTH High and $4,189.25 LVNode, or higher.
In the worst case, the S&P 500 trades lower.
Any activity below the $4,107.00 VPOC puts into play the $4,073.00 VPOC. Initiative trade beyond the $4,073.00 VPOC could reach as low as the $4,040.75 and $4,015.25 HVNodes, or lower.
Click here to load today’s key levels into the web-based TradingView charting platform. Note that all levels are derived using the 65-minute timeframe. New links are produced, daily.
Graphic: 65-minute profile chart of the Micro E-mini S&P 500 Futures.
Definitions
Volume Areas: A structurally sound market will build on areas of high volume (HVNodes). Should the market trend for long periods of time, it will lack sound structure, identified as low volume areas (LVNodes). LVNodes denote directional conviction and ought to offer support on any test.
If participants were to auction and find acceptance into areas of prior low volume (LVNodes), then future discovery ought to be volatile and quick as participants look to HVNodes for favorable entry or exit.
POCs: POCs are valuable as they denote areas where two-sided trade was most prevalent in a prior day session. Participants will respond to future tests of value as they offer favorable entry and exit.
MCPOCs: POCs are valuable as they denote areas where two-sided trade was most prevalent over numerous day sessions. Participants will respond to future tests of value as they offer favorable entry and exit.
Volume-Weighted Average Prices (VWAPs): A metric highly regarded by chief investment officers, among other participants, for quality of trade. Additionally, liquidity algorithms are benchmarked and programmed to buy and sell around VWAPs.
About
After years of self-education, strategy development, mentorship, and trial-and-error, Renato Leonard Capelj began trading full-time and founded Physik Invest to detail his methods, research, and performance in the markets.
Capelj also develops insights around impactful options market dynamics at SpotGamma and is a Benzinga reporter.
In no way should the materials herein be construed as advice. Derivatives carry a substantial risk of loss. All content is for informational purposes only.
The daily brief is a free glimpse into the prevailing fundamental and technical drivers of U.S. equity market products. Join the 300+ that read this report daily, below!
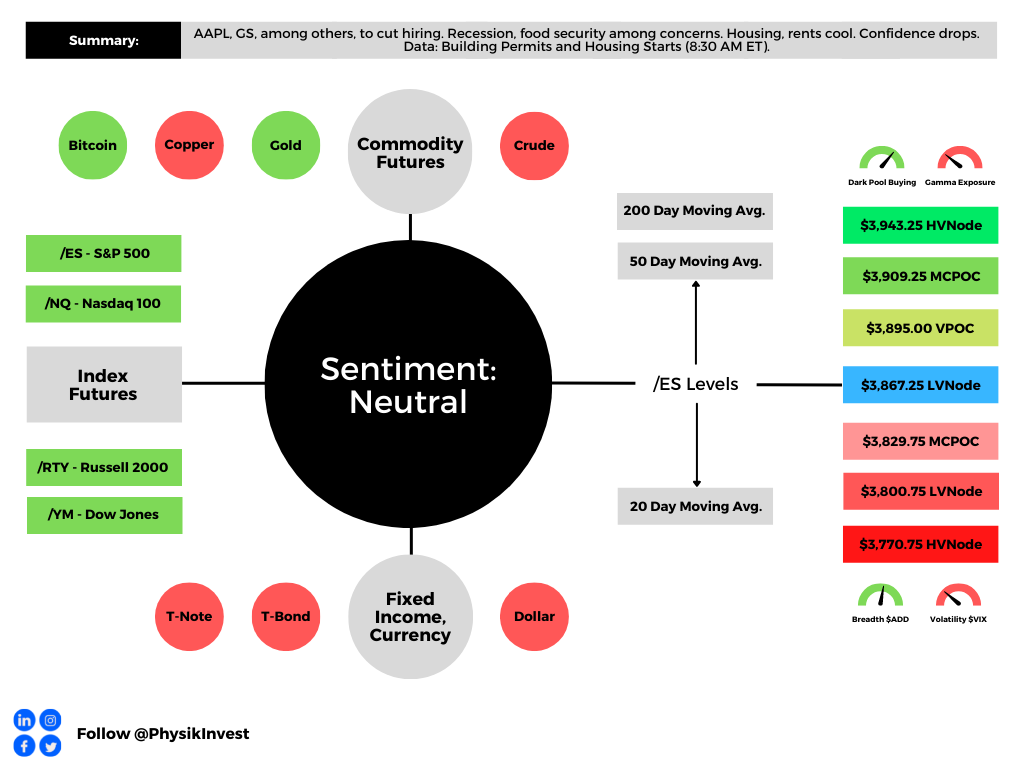
Graphic updated 6:50 AM ET. Sentiment Neutral if expected /ES open is inside of the prior day’s range. /ES levels are derived from the profile graphic at the bottom of the following section. Levels may have changed since initially quoted; click here for the latest levels. SqueezeMetrics Dark Pool Index (DIX) and Gamma (GEX) calculations are based on where the prior day’s reading falls with respect to the MAX and MIN of all occurrences available. A higher DIX is bullish. At the same time, the lower the GEX, the more (expected) volatility. Learn the implications of volatility, direction, and moneyness. Breadth reflects a reading of the prior day’s NYSE Advance/Decline indicator. VIX reflects a current reading of the CBOE Volatility Index (INDEX: VIX) from 0-100.
Fundamental
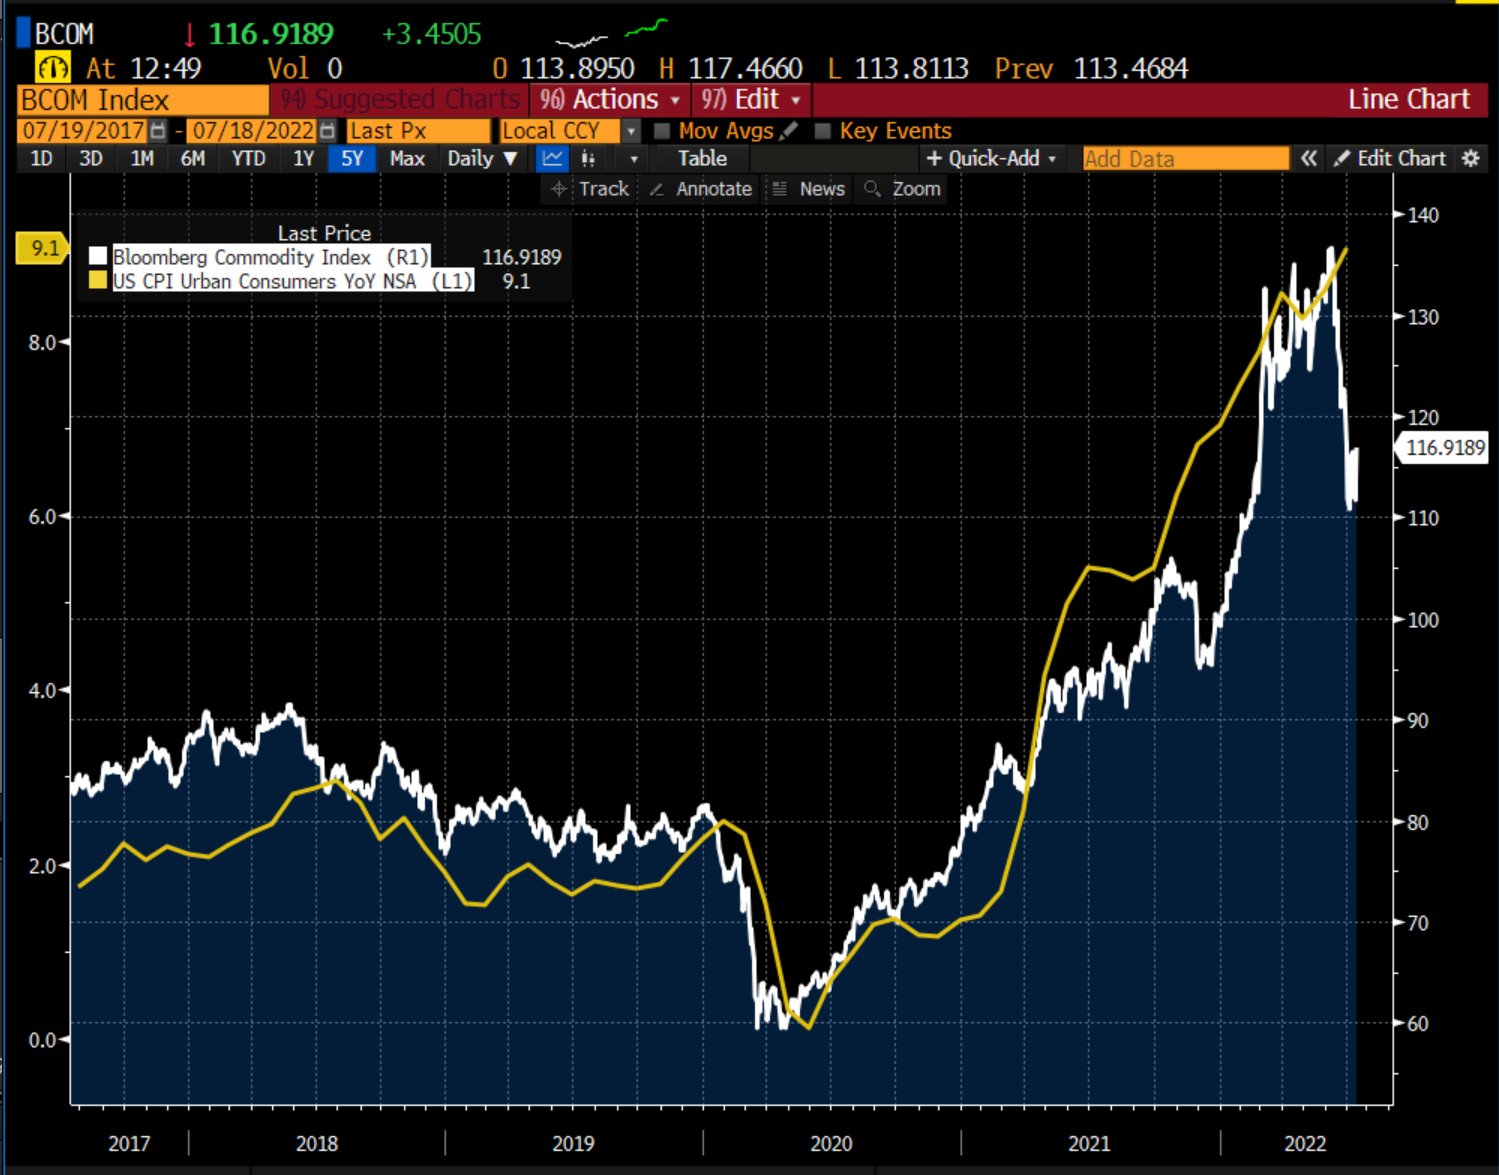
After the release of data on consumer prices, earlier this month, the belief was that a de-rate, on inflation, was, potentially, nearing an end, although it was likely to remain at a “higher level than we’ve seen historically,” per the likes of Chevron Corporation’s (NYSE: CVX) CEO Mike Wirth.
Graphic: Retrieved from Randy Woodward. “Bloomberg commodities index vs. headline CPI.”
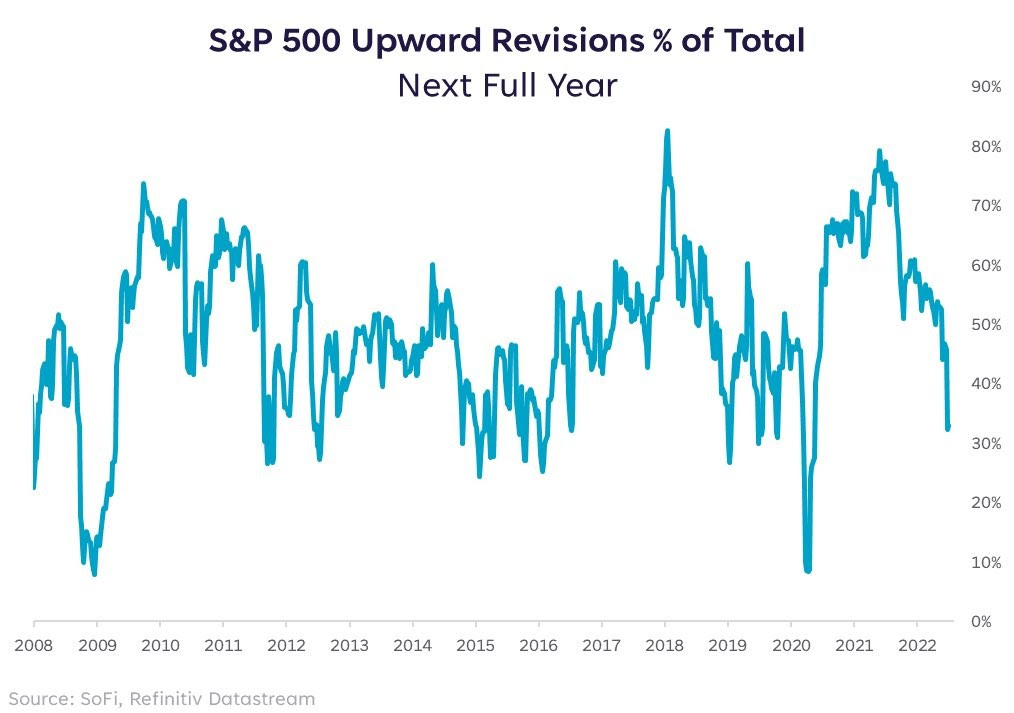
Now comes an even deeper compression on earnings?
Graphic: Retrieved from Callum Thomas. “Clear downward momentum in earnings revisions, only 33% of analyst earnings estimates have been revised upward (i.e. the rest downward) — matches the worsening macro.”
Well, maybe. Based on executives’ perspectives, we’re probably “talking ourselves into a recession,” precisely what the likes of Robert Shiller have expressed worry on.
Accordingly, participants are now pricing in shaky earnings, selling the stock of Goldman Sachs Group Inc (NYSE: GS), Apple Inc (NASDAQ: AAPL), and beyond, on those firms’ preparations for an increased potential for an economic downturn.
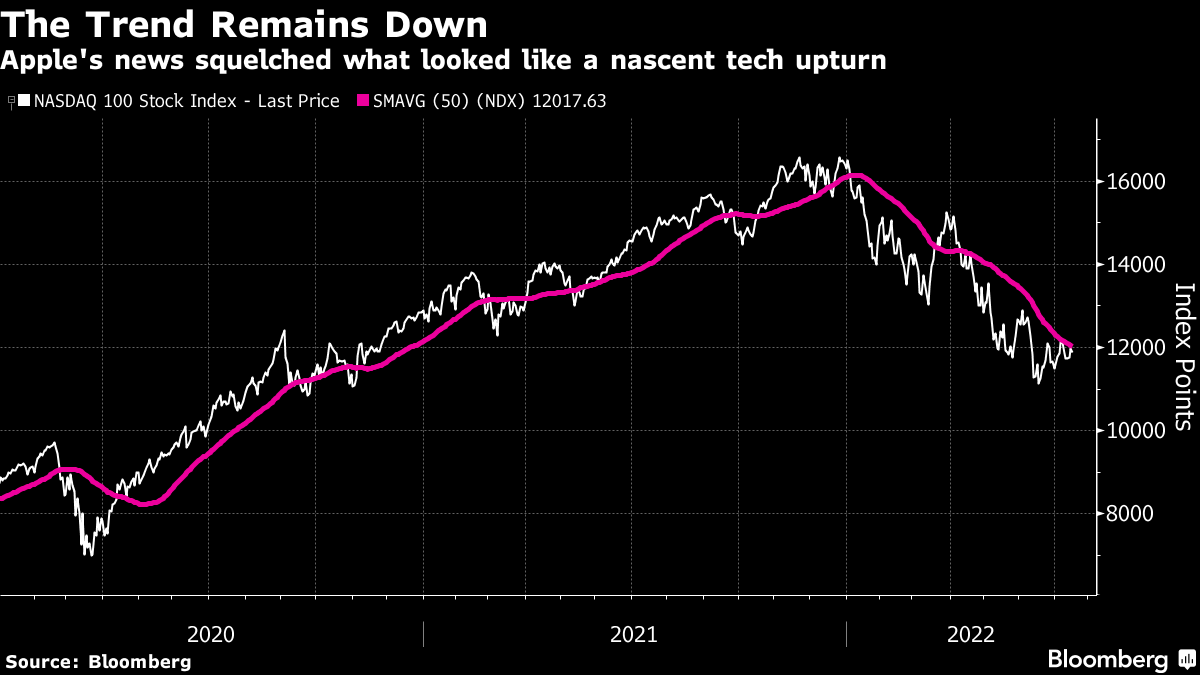
Up until this week, the Nasdaq 100 (INDEX: NDX) was doing better, consolidating for a potential break above a key response area, like the S&P 500 (INDEX: SPX), highlighted in a section further below.
It failed after the release of earnings from some index heavyweights.
Graphic: Retrieved from Bloomberg. “The Nasdaq 100, down 27% for the year so far, had briefly managed to get above its 50-day moving average on Monday, suggesting that the relentless downward trend was over — but the index failed to stay there, thanks in large part to Apple.”
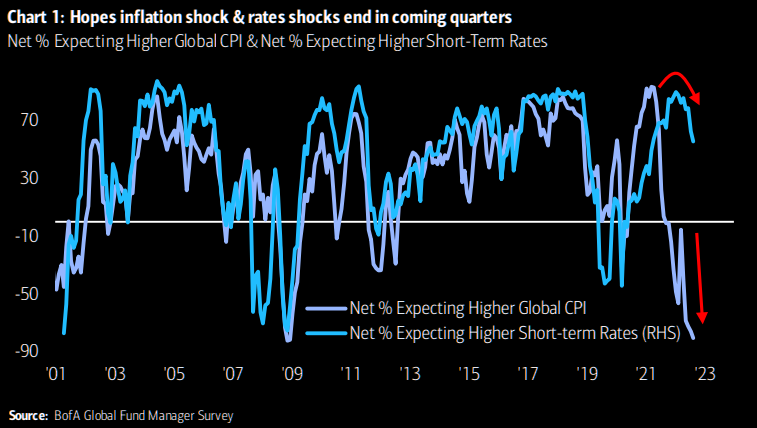
Pessimism is incredibly strong among investors, however, a sort-of contrarian signal.
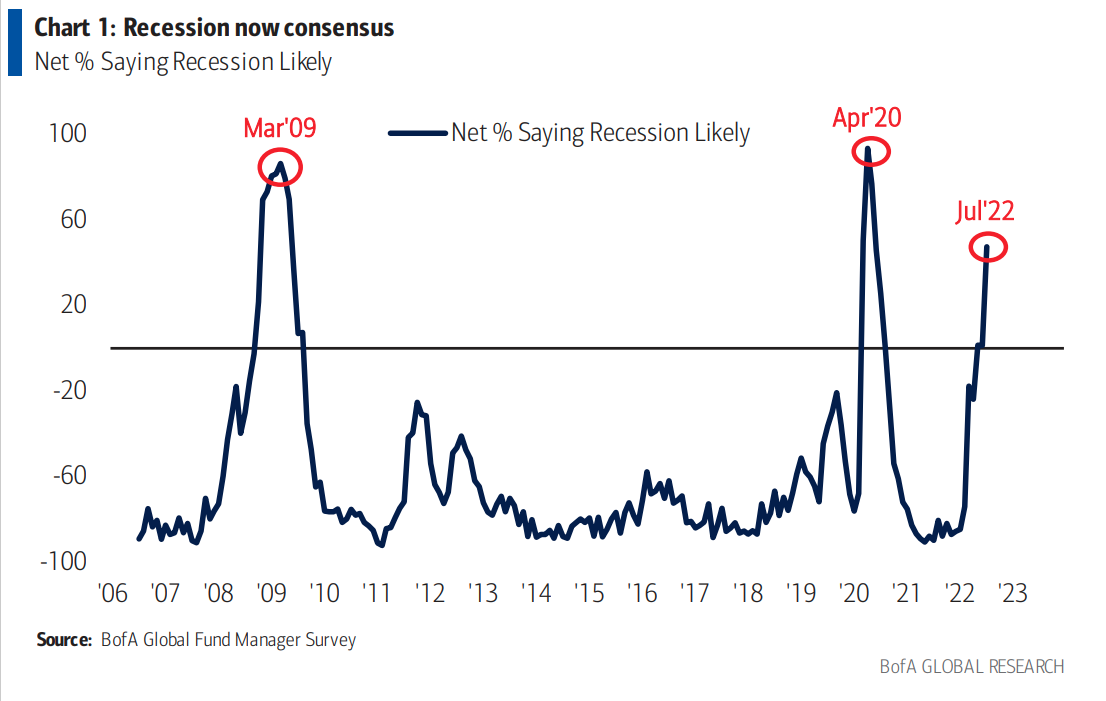
In spite of some Bank of America Corporation (NYSE: BAC) indicators pointing to poor fundamentals, sentiment is suggestive of a looming “stocks/credit rally in coming weeks.”
Graphic: Retrieved from Bloomberg. “Investors slashed their exposure to risk assets to levels not seen even during the global financial crisis in a sign of full capitulation amid a “dire” economic outlook, according to Bank of America Corp.’s monthly fund manager survey.”
Positioning
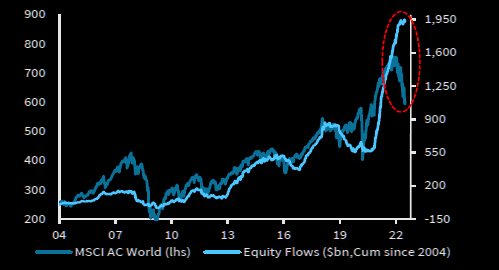
Though we’re far more than halfway through a dot-com type collapse that’s happened “underneath the surface of the indices,” per Simplify Asset Management’s Mike Green, still-strong passive flows continue to support the largest stocks within the indexes.
Graphic: Retrieved from The Market Ear. Via Barclays PLC (NYSE: BCS).
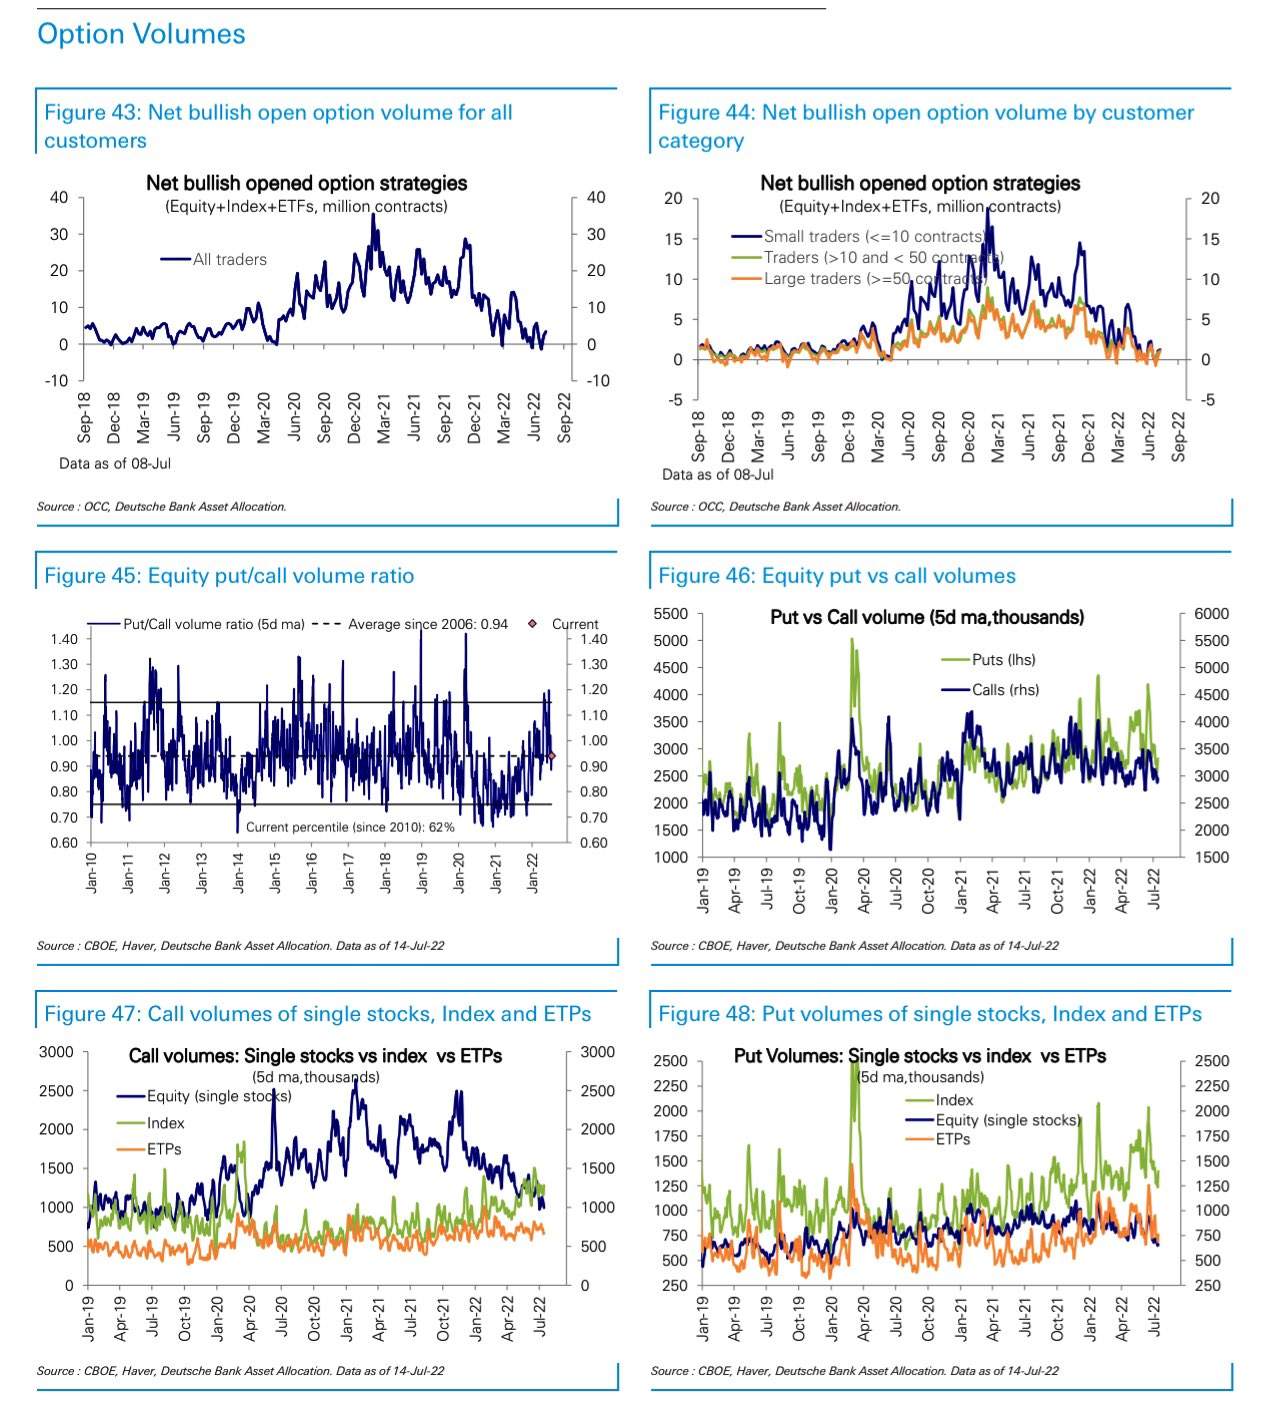
At the same time, options volumes show traders concentrating less on bullish strategies in the single stocks, while the index flows remain steady.
Graphic: Via Deutsche Bank AG (NYSE: DB).
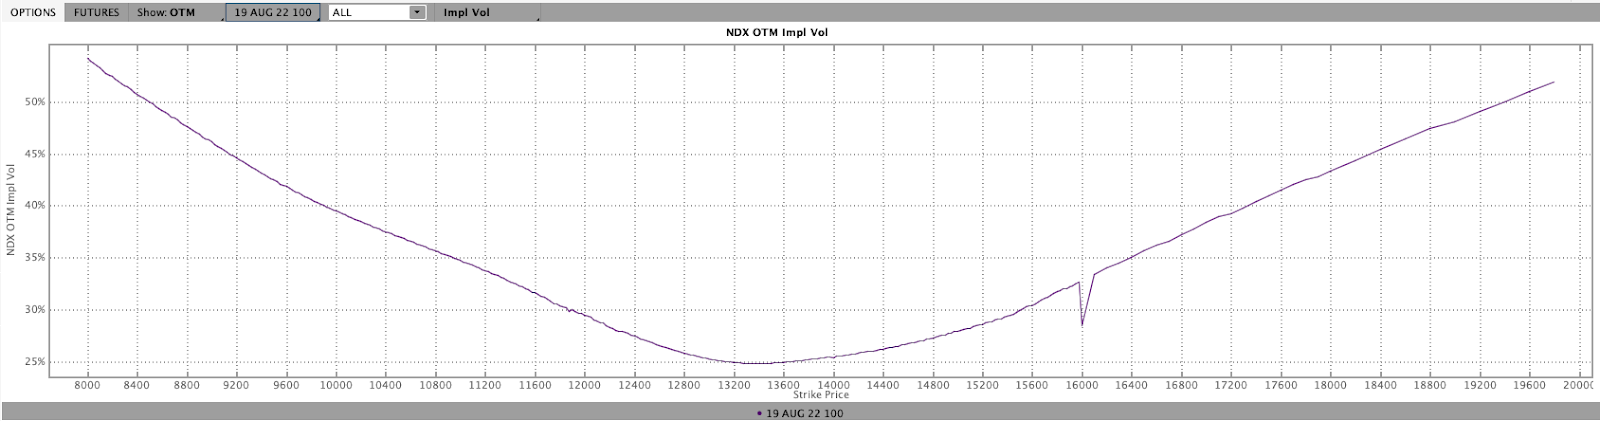
Looking at skew on something like the tech- and growth-heavy Nasdaq 100 (INDEX: NDX), our comments in prior letters (regarding volatility supply from the re-hedging of defensive structures on the put side and volatility demand on the call side from the positioning for a reversal) appear still valid.
As of 6:45 AM ET, Tuesday’s regular session (9:30 AM – 4:00 PM ET), in the S&P 500, is likely to open in the upper part of a positively skewed overnight inventory, inside of prior-range and -value, suggesting a limited potential for immediate directional opportunity.
In the best case, the S&P 500 trades higher.
Any activity above the $3,867.25 LVNode puts into play the $3,895.00 VPOC. Initiative trade beyond the VPOC could reach as high as the $3,909.25 MCPOC and $3,943.25 HVNode, or higher.
In the worst case, the S&P 500 trades lower.
Any activity below the $3,867.25 LVNode puts into play the $3,829.75 MCPOC. Initiative trade beyond the MCPOC could reach as low as the $3,800.75 LVNode and $3,770.75 HVNode, or lower.
Click here to load today’s key levels into the web-based TradingView charting platform. Note that all levels are derived using the 65-minute timeframe. New links are produced, daily.
Graphic: 65-minute profile chart of the Micro E-mini S&P 500 Futures.
Considerations: Responsiveness near key-technical areas (that are discernable visually on a chart), suggests technically-driven traders with short time horizons are very active.
Such traders often lack the wherewithal to defend retests and, additionally, the type of trade may be indicative of the other time frame participants waiting for more information to initiate trades.
Definitions
Volume Areas: A structurally sound market will build on areas of high volume (HVNodes). Should the market trend for long periods of time, it will lack sound structure, identified as low volume areas (LVNodes). LVNodes denote directional conviction and ought to offer support on any test.
If participants were to auction and find acceptance into areas of prior low volume (LVNodes), then future discovery ought to be volatile and quick as participants look to HVNodes for favorable entry or exit.
POCs: POCs are valuable as they denote areas where two-sided trade was most prevalent in a prior day session. Participants will respond to future tests of value as they offer favorable entry and exit.
MCPOCs: POCs are valuable as they denote areas where two-sided trade was most prevalent over numerous day sessions. Participants will respond to future tests of value as they offer favorable entry and exit.
Volume-Weighted Average Prices (VWAPs): A metric highly regarded by chief investment officers, among other participants, for quality of trade. Additionally, liquidity algorithms are benchmarked and programmed to buy and sell around VWAPs.
About
After years of self-education, strategy development, mentorship, and trial-and-error, Renato Leonard Capelj began trading full-time and founded Physik Invest to detail his methods, research, and performance in the markets.
Capelj also develops insights around impactful options market dynamics at SpotGamma and is a Benzinga reporter.
In no way should the materials herein be construed as advice. Derivatives carry a substantial risk of loss. All content is for informational purposes only.
The daily brief is a free glimpse into the prevailing fundamental and technical drivers of U.S. equity market products. Join the 300+ that read this report daily, below!
Graphic updated 6:30 AM ET. Sentiment Neutral if expected /ES open is inside of the prior day’s range. /ES levels are derived from the profile graphic at the bottom of the following section. Levels may have changed since initially quoted; click here for the latest levels. SqueezeMetrics Dark Pool Index (DIX) and Gamma (GEX) calculations are based on where the prior day’s reading falls with respect to the MAX and MIN of all occurrences available. A higher DIX is bullish. At the same time, the lower the GEX, the more (expected) volatility. Learn the implications of volatility, direction, and moneyness. SHIFT data used for S&P 500 (INDEX: SPX) options activity. Note that options flow is sorted by the call premium spent; if more positive, then more was spent on call options. Breadth reflects a reading of the prior day’s NYSE Advance/Decline indicator. VIX reflects a current reading of the CBOE Volatility Index (INDEX: VIX) from 0-100.
What To Expect
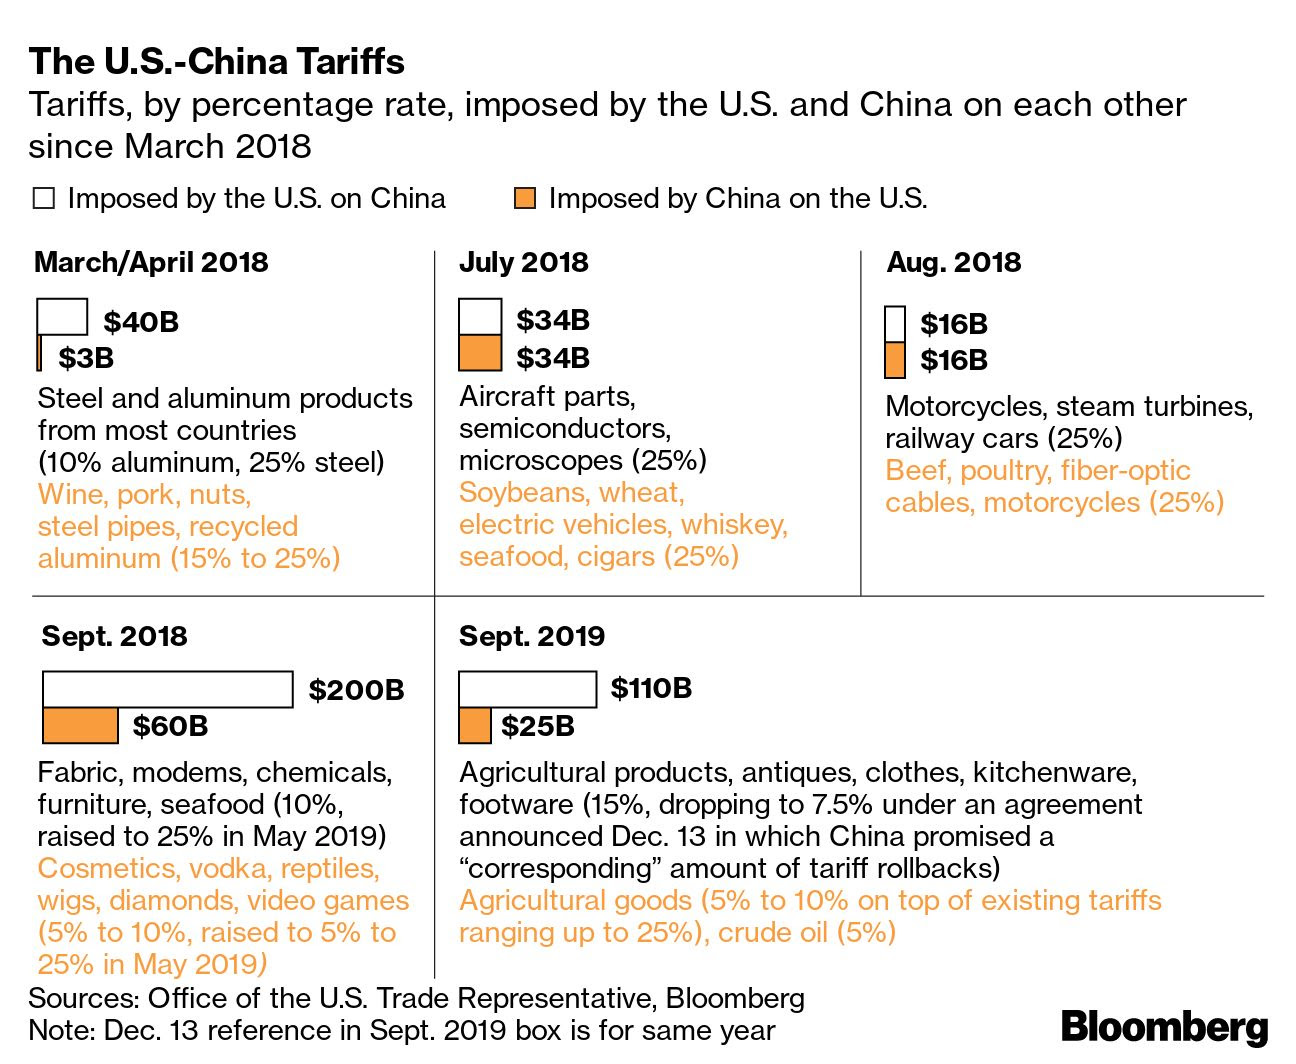
Fundamental: In the headlines were the chip boom’s loss of steam, the Bank of England’s consideration of 50-year mortgages, the potential collapse or rise in oil by year-end, NATO’s resumption of expansion processes, slowing car sales, China tariffs reduction, Germany’s first monthly trade deficit since 1991 on inflation, and more.
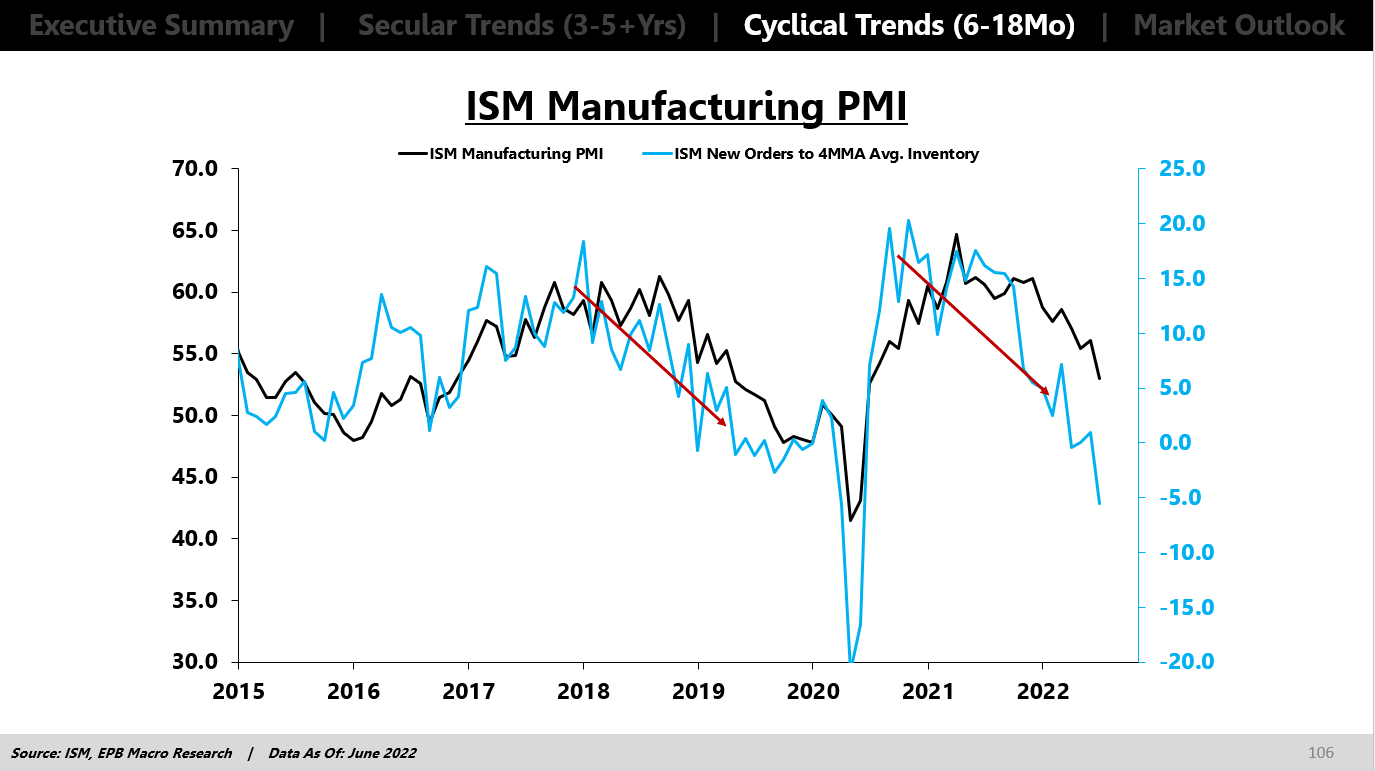
Key in last week’s narratives was U.S. manufacturing’s decline as new orders were below that of inventories.
Bloomberg’s John Authers explains that “[t]he signal grows even more discomforting if the new orders number is below the recessionary cutoff at 50.”
Graphic: Via Eric Basmajian. “Given that the ISM Manufacturing PMI holds a very strong correlation to earnings estimates, credit spreads, and more, the probability that we see further declines should be a warning sign that more turbulence is ahead in cyclical risk assets.”
“If the new story of imminent slowdown and a limited monetary tightening campaign turns out to be true, then the narrative on earnings will have to change. That positivity about earnings is what is keeping stocks from selling off far more,” Authers adds.
“The next couple of weeks will bring critical macro data on inflation and employment; but immediately after that, the earnings numbers will start to flow. It might not be pretty.”
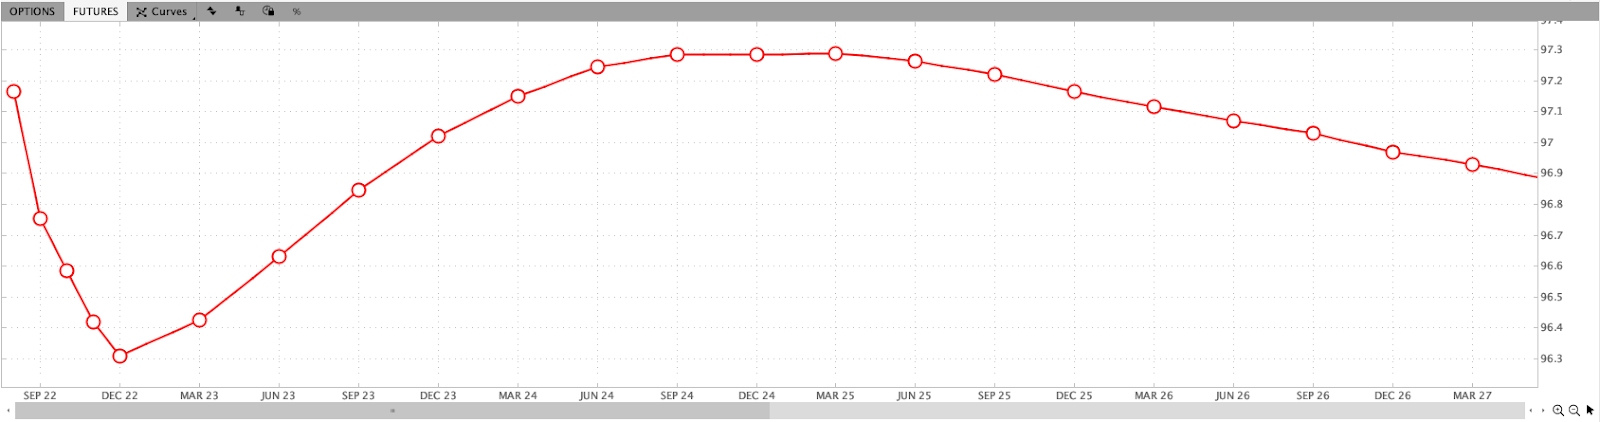
Graphic: Via Charles Schwab Corporation-owned (NYSE: SCHW) TD Ameritrade’s Thinkorswim. The Eurodollar (FUTURE: /GE) futures curve is a reflection of participants’ outlook on interest rates. The peak of the Fed-rate-hike cycle – terminal rate – is around DEC 2022.
Positioning: Data on net gamma exposures points to more volatile ranges.
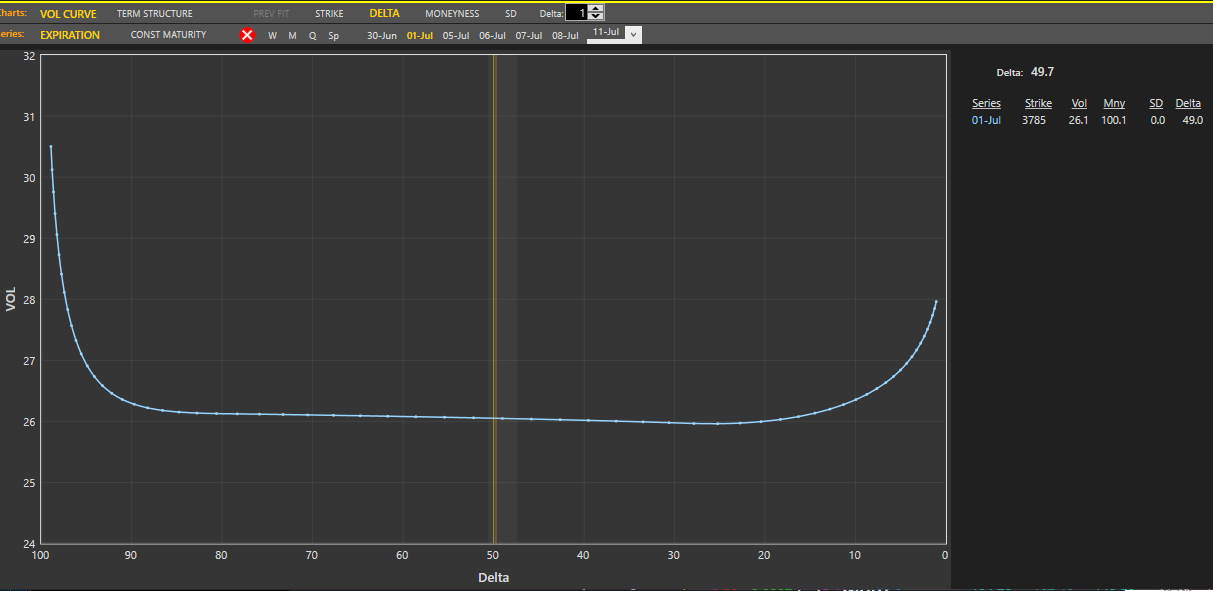
Given the relationship between realized (RVOL) and implied (IVOL) volatility, as well as naive metrics for skew, it makes sense to not be a seller of volatility, especially in options that are short-dated and farther out.
Graphic: Via Pat Hennessy. “Tomorrow’s SPX expo (Jul1) is wildin… 26 vol for any strike with a 37 or 38 handle with a ridiculous curvature in the tails. God speed to all the 1dte theta gang. Selling OTM puts/calls for the same vol as ATM seems… umm… not good.”
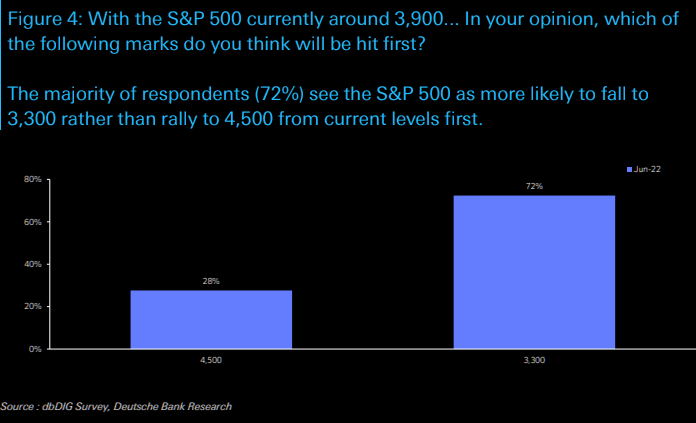
Moreover, participants’ combined view is that markets are likely to head lower, via Deutsche Bank AG (NYSE: DB).
Graphic: Via Deutsche Bank AG (NYSE: DB). Taken from The Market Ear.
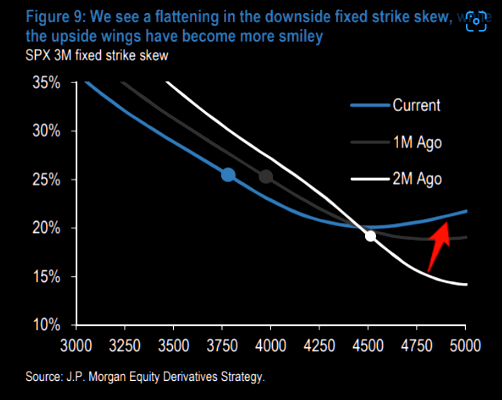
However, as we discussed in sessions prior, their demand for exposure to the upside resulted in “a flattening in the downside strike skew, while the upside wings have become more smiley.”
Graphic: Via JPMorgan Chase & Co (NYSE: JPM). Taken from The Market Ear.
A “higher starting point” in implied volatility (IVOL), and a still-present right-tail (from the positioning for a bear market rally), make it so we may position, for less cost, in short-dated structures with asymmetric payouts, on both sides of the market.
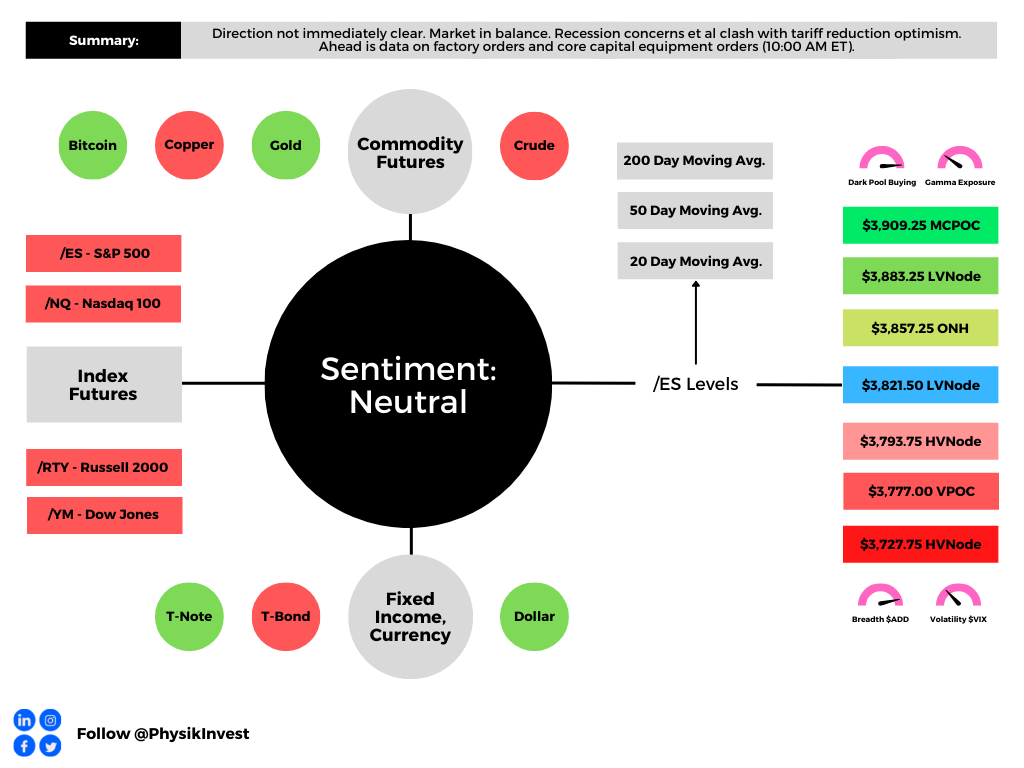
Technical: As of 6:30 AM ET, Tuesday’s regular session (9:30 AM – 4:00 PM ET), in the S&P 500, is likely to open in the middle part of a balanced overnight inventory, inside of prior-range and -value, suggesting a limited potential for immediate directional opportunity.
In the best case, the S&P 500 trades higher.
Any activity above the $3,821.50 LVNode puts into play the $3,857.25 ONH. Initiative trade beyond the ONH could reach as high as the $3,883.25 LVNode and $3,909.25 MCPOC, or higher.
In the worst case, the S&P 500 trades lower.
Any activity below the $3,821.50 LVNode puts into play the $3,793.75 HVNode. Initiative trade beyond the HVNode could reach as low as the $3,777.00 VPOC and $3,727.75 HVNode, or lower.
Click here to load today’s key levels into the web-based TradingView charting platform. Note that all levels are derived using the 65-minute timeframe. New links are produced, daily.
Graphic: 65-minute profile chart of the Micro E-mini S&P 500 Futures.
Definitions
Overnight Rally Highs (Lows): Typically, there is a low historical probability associated with overnight rally-highs (lows) ending the upside (downside) discovery process.
Volume Areas: A structurally sound market will build on areas of high volume (HVNodes). Should the market trend for long periods of time, it will lack sound structure, identified as low volume areas (LVNodes). LVNodes denote directional conviction and ought to offer support on any test.
If participants were to auction and find acceptance into areas of prior low volume (LVNodes), then future discovery ought to be volatile and quick as participants look to HVNodes for favorable entry or exit.
POCs: POCs are valuable as they denote areas where two-sided trade was most prevalent in a prior day session. Participants will respond to future tests of value as they offer favorable entry and exit.
About
After years of self-education, strategy development, mentorship, and trial-and-error, Renato Leonard Capelj began trading full-time and founded Physik Invest to detail his methods, research, and performance in the markets.
Capelj also develops insights around impactful options market dynamics at SpotGamma and is a Benzinga reporter.
In no way should the materials herein be construed as advice. Derivatives carry a substantial risk of loss. All content is for informational purposes only.
The Daily Brief is a free glimpse into the prevailing fundamental and technical drivers of U.S. equity market products. Join the 200+ that read this report daily, below!
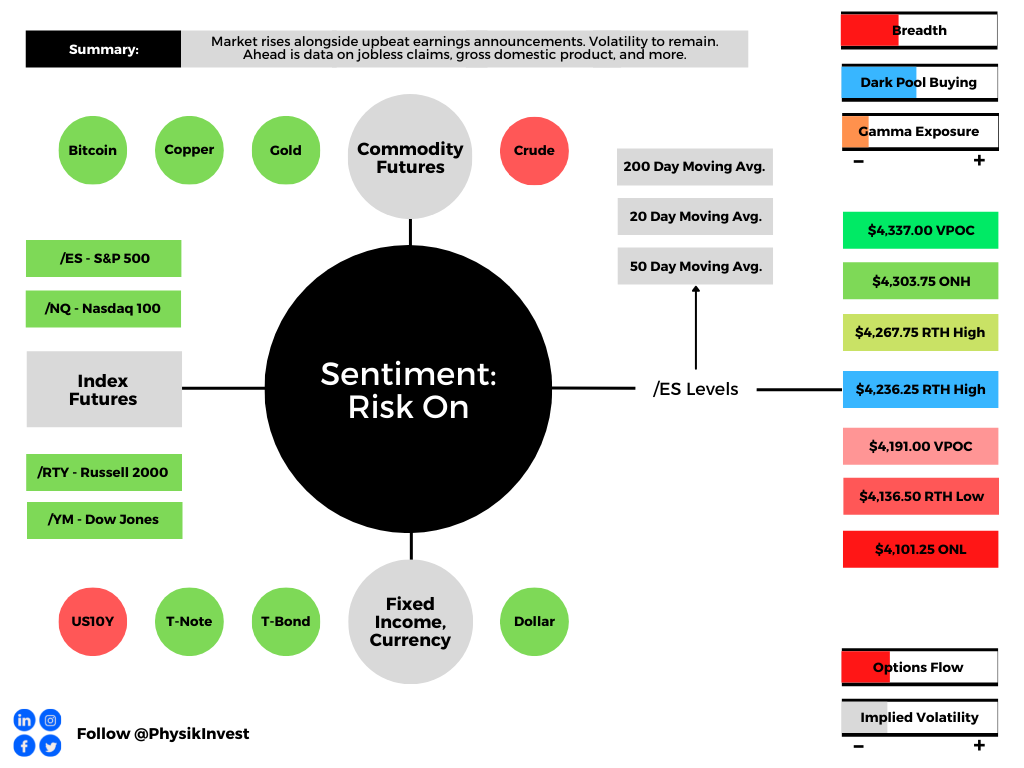
Overnight, equity index futures auctioned sideways-to-higher alongside some upbeat earnings announcements.
Meta Platforms Inc (NASDAQ: FB) surged post-market, yesterday, after its main social network Facebook added more users than expected.
PayPal Holdings Inc (NYSE: PYPL) vowed to rein in costs and boost profits while Qualcomm Inc (NASDAQ: QCOM) rose on an upbeat forecast.
There’s a strong push-and-pull between what’s good and bad. File Deutsche Bank’s (NYSE: DB) recent comments on a pending recession under what’s bad.
The bank sees the Fed Target Rate reaching up to 6% which “will push the economy into a significant recession by late next year.”
Graphic updated 7:00 AM ET. Sentiment Risk-On if expected /ES open is above the prior day’s range. Sentiment Risk-Off if expected /ES open is below the prior day’s range. /ES levels are derived from the profile graphic at the bottom of the following section. Levels may have changed since initially quoted; click here for the latest levels. SqueezeMetrics Dark Pool Index (DIX) and Gamma (GEX) calculations are based on where the prior day’s reading falls with respect to the MAX and MIN of all occurrences available. A higher DIX is bullish. At the same time, the lower the GEX, the more (expected) volatility. Learn the implications of volatility, direction, and moneyness. SHIFT data used for S&P 500 (INDEX: SPX) options activity. Note that options flow is sorted by the call premium spent; if more positive, then more was spent on call options. Breadth reflects a reading of the prior day’s NYSE Advance/Decline indicator. VIX reflects a current reading of the CBOE Volatility Index (INDEX: VIX) from 0-100.
What To Expect
Fundamental: Divergences across different assets and markets continue.
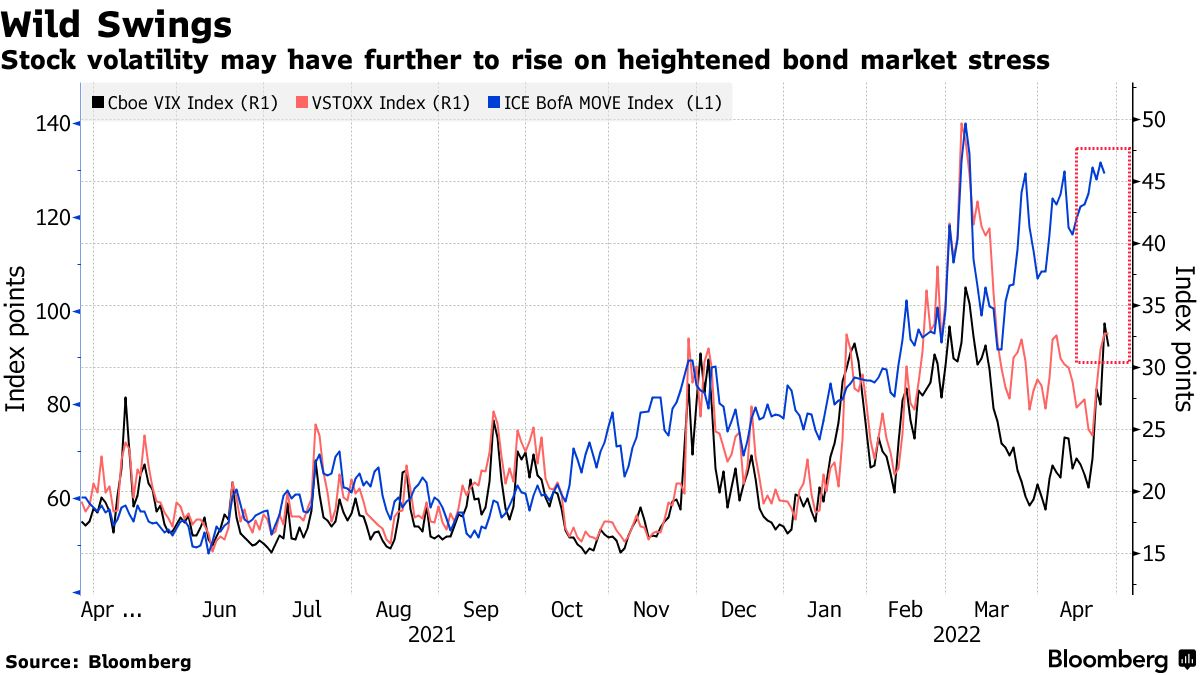
For instance, the equity market’s pricing of risk which we can take as being reflected by the CBOE Volatility Index [INDEX: VIX]) is not moving lock-step with that of measures elsewhere.
The fear in one market tends to spread to others. Regardless of the cause, it seems that equity and bond market participants are not on the same page.
Is that really true, though? Not necessarily.
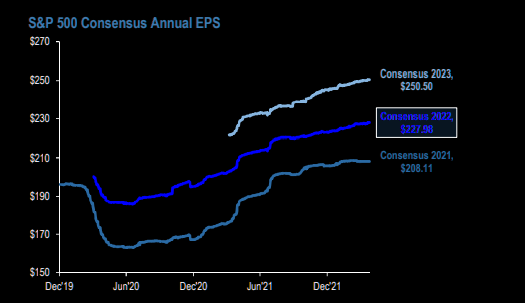
If we look at some single stocks, Netflix Inc (NASDAQ: NFLX), among others (all the while S&P 500 earnings have been revised up) has suffered through a substantial de-rate and volatility as participants priced the implications of policy evolution, slower economic growth, and beyond.
Graphic: Via JPMorgan Chase & Co (NYSE: JPM). Taken from The Market Ear.
That has us returning to pinning at the index level, relative to what the constituents are doing.
As well explained in Physik Invest’s March 3, 2022 commentary, this is more so a function of positioning and structural flows, or supply of liquidity.
Absent some exogenous event, participants are well-hedged for what is known (e.g., rate hikes and quantitative tightening (QT), COVID resurgences, Russia and Ukraine, among other things).
The caveat is that the Federal Reserve is far more aggressive than expected, ramping up QT, “a direct flow of capital to capital markets or flow out of,” per Kai Volatility’s Cem Karsan.
For context, it is the intention to take from the max liquidity (which pushed participants out of the risk curve and promoted a divergence from fundamentals) markets were supplied with, and this has the effect of removing market excesses, some of which have fed into volatility markets.
In part, some of the QT has been reflected in bond prices, JPMorgan Chase & Co (NYSE: JPM) explains. However, should there be far more aggressive monetary action, as Deutsche research suggests, coupled with a worsening of the geopolitical and/or economic situation abroad (e.g., Russian default), markets are likely to succumb.
“Using the balance sheet as a tightening tool represents a large change in the Fed’s attitude, and IS NOT priced into the market,” MacroTourist’s Kevin Muir adds.
“An increase in the pace of tightening of QT should mean lower stocks, wider credit spreads, and a slight reduction in the need for front-end hikes.”
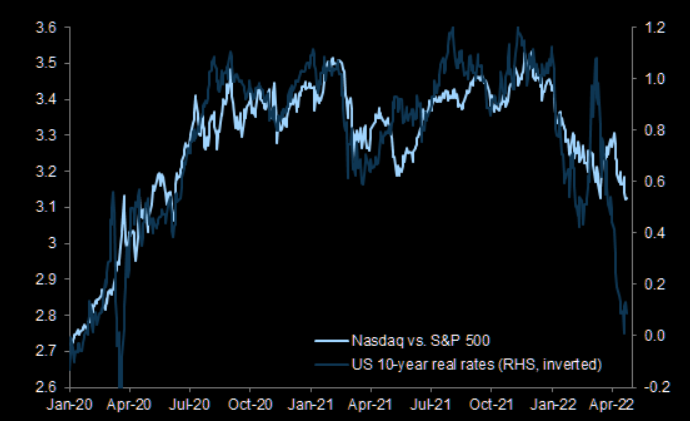
Graphic: Via Goldman Sachs Group Inc (NYSE: GS). Taken from The Market Ear. The “Nasdaq has underperformed the S&P 500 but by less than what the move in real yields would suggest.”
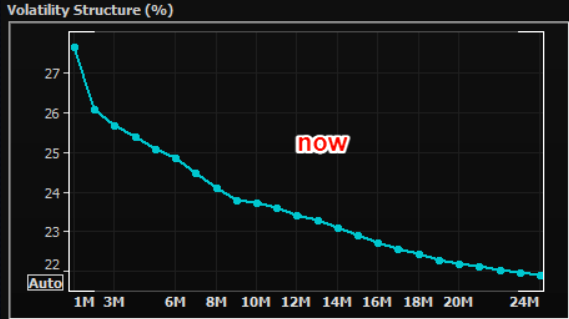
Positioning: Volatility to continue as markets have traded lower and participants have priced up the cost of insurance – particularly at the short-end – on underlying equity exposure.
Graphic: SPX volatility term structure via Refinitiv. Taken from The Market Ear.
This is due to options delta (exposure to direction) being far more sensitive (gamma) across shorter time horizons (i.e., the range across which options deltas shift from “near-zero to near-100% becomes very narrow.”)
Yesterday, markets were pinned after exploring lower in the days prior. The activity was concentrated in short-dated bets at those levels, and that’s in part a result of some of the hedging that went on.
Graphic: Via SpotGamma’s Hedging Impact of Real-Time Options Indicator.
If markets do not perform to the downside (i.e., do not trade lower), those short-dated bets on direction will quickly decay, and hedging flows with respect to time (charm) and volatility (vanna) may bolster sharp rallies.
Whether those price rises have legs depends on what the fundamental situation is, then. Regardless, the returns distribution, based on implied volatility metrics alone, is skewed positive, albeit there are some large negative outliers.
Graphic: Via @HalfersPower. “In backwardation via $VIX: $VIX3M next month [realized volatility] is highest amongst the deciles (d10 >1) ~43% subsequent realized volatility.”
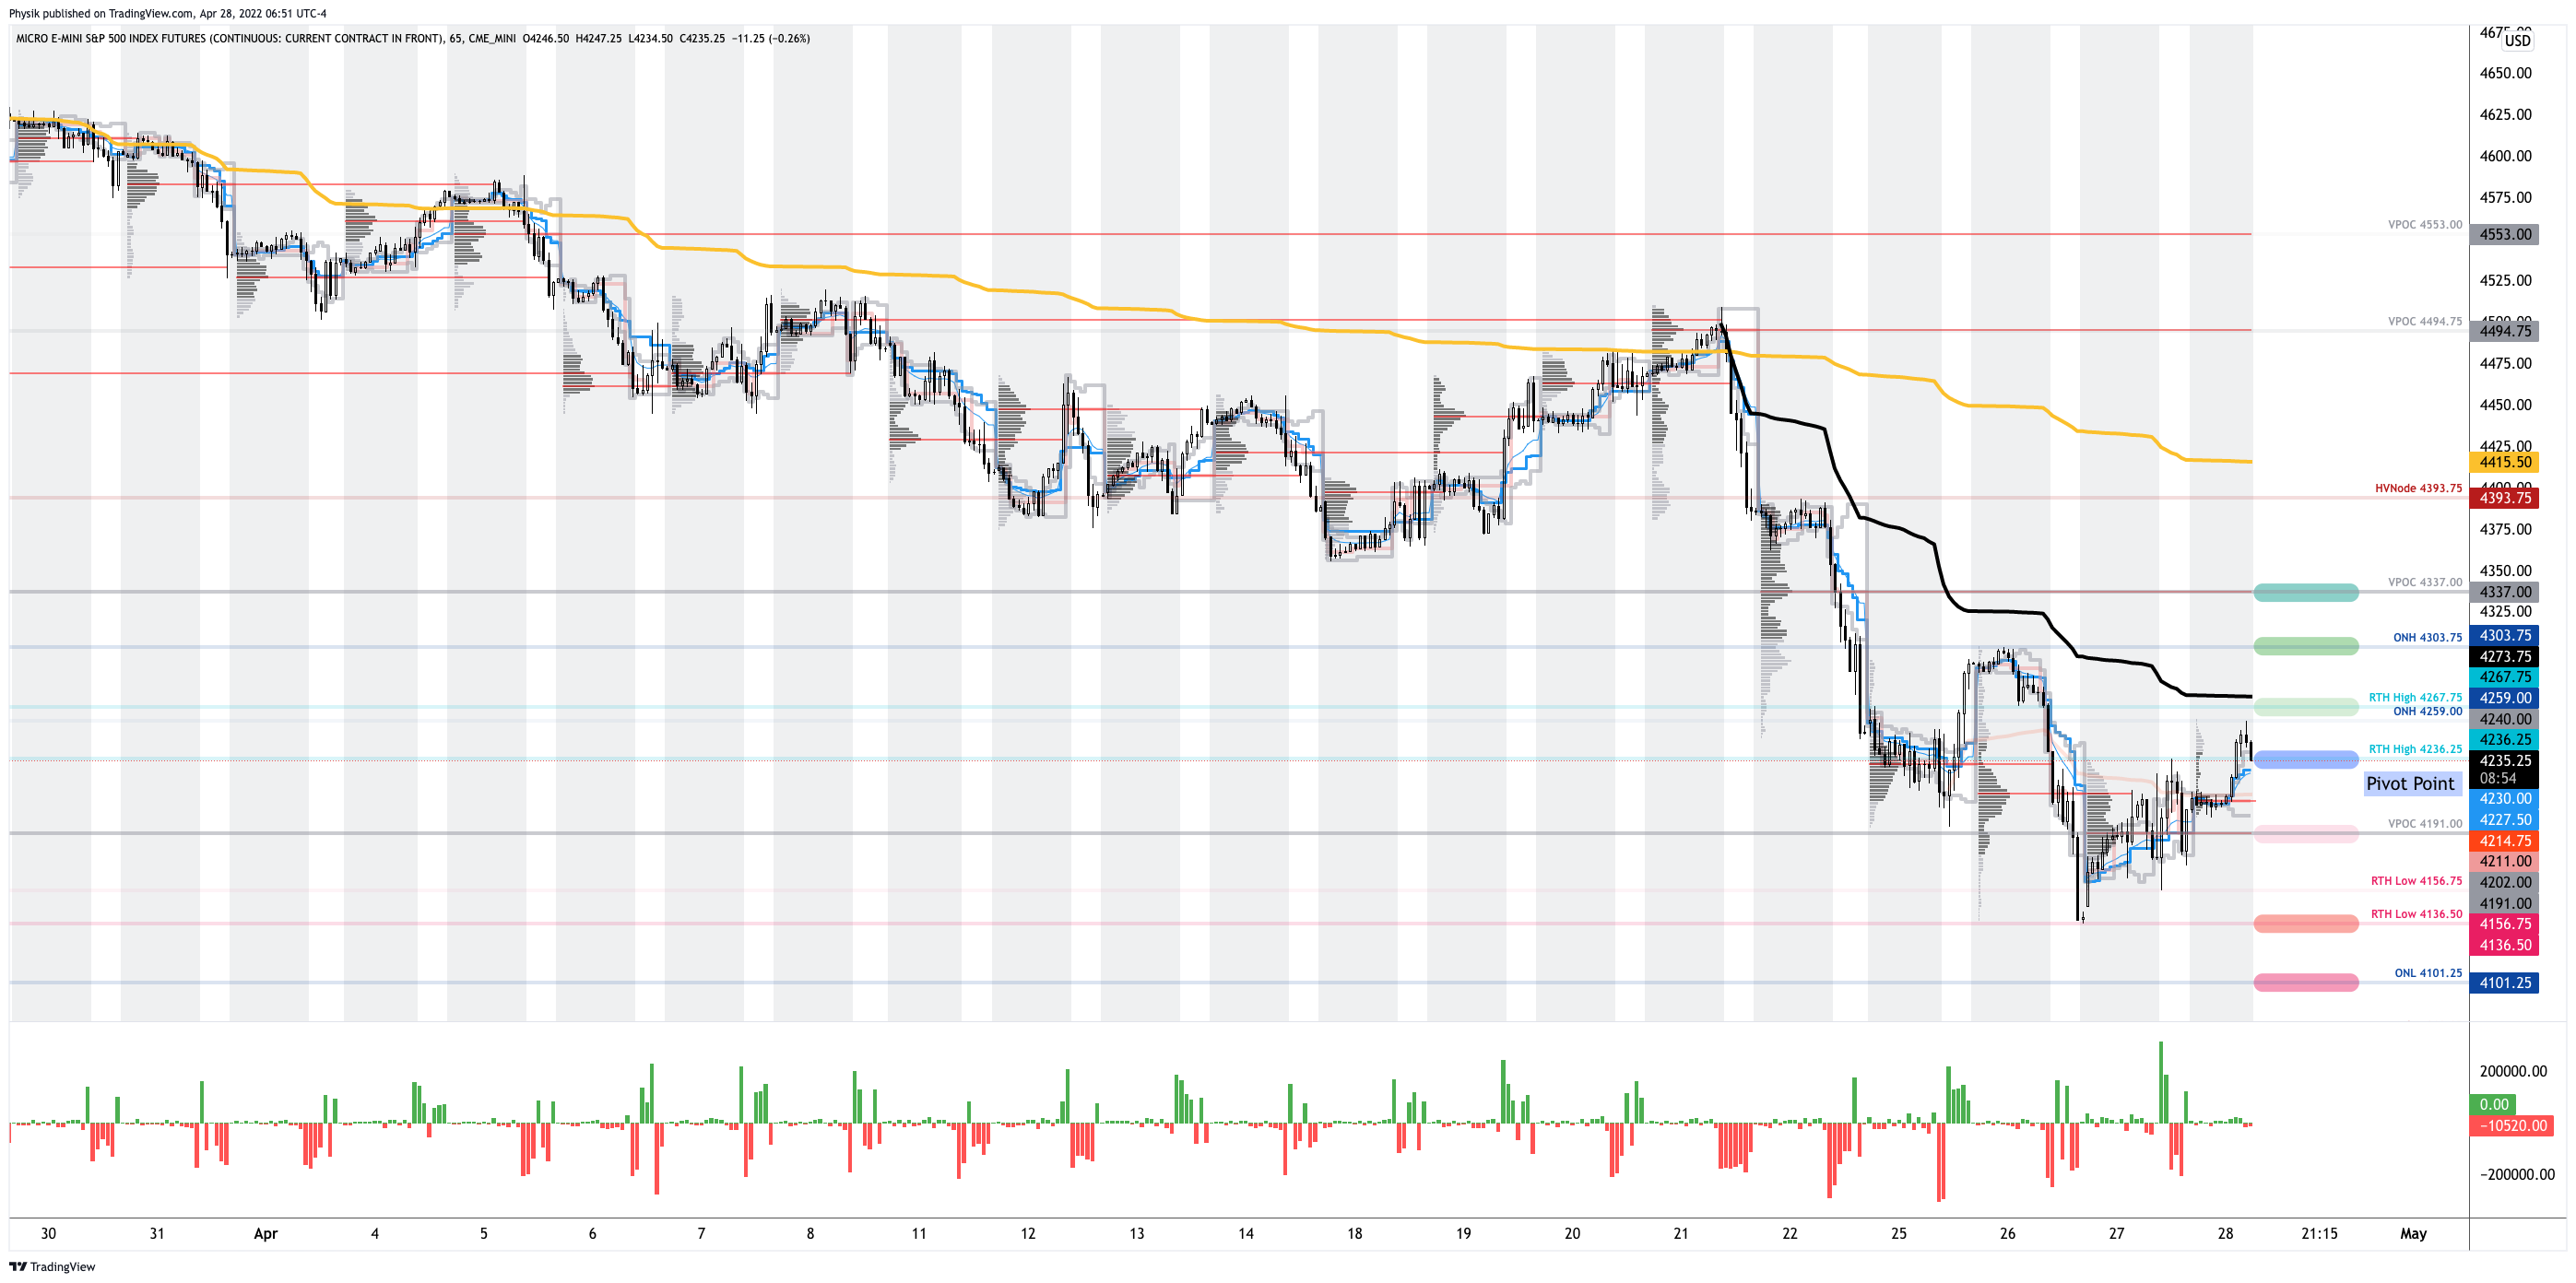
Technical: As of 7:00 AM ET, Thursday’s regular session (9:30 AM – 4:00 PM ET), in the S&P 500, will likely open in the middle part of a positively skewed overnight inventory, just inside of prior-range and -value, suggesting a limited potential for immediate directional opportunity.
In the best case, the S&P 500 trades higher; activity above the $4,236.25 regular trade high (RTH High) puts in play the $4,267.75 RTH High. Initiative trade beyond the $4,267.75 RTH High could reach as high as the $4,303.75 overnight high (ONH) and $4,337.00 untested point of control (VPOC), or higher.
In the worst case, the S&P 500 trades lower; activity below the $4,236.25 RTH High puts in play the $4,191.00 VPOC. Initiative trade beyond the VPOC could reach as low as the $4,136.00 regular trade low (RTH Low) and $4,101.25 overnight low (ONL), or lower.
Click here to load today’s key levels into the web-based TradingView charting platform. Note that all levels are derived using the 65-minute timeframe. New links are produced, daily.
Graphic: 65-minute profile chart of the Micro E-mini S&P 500 Futures.
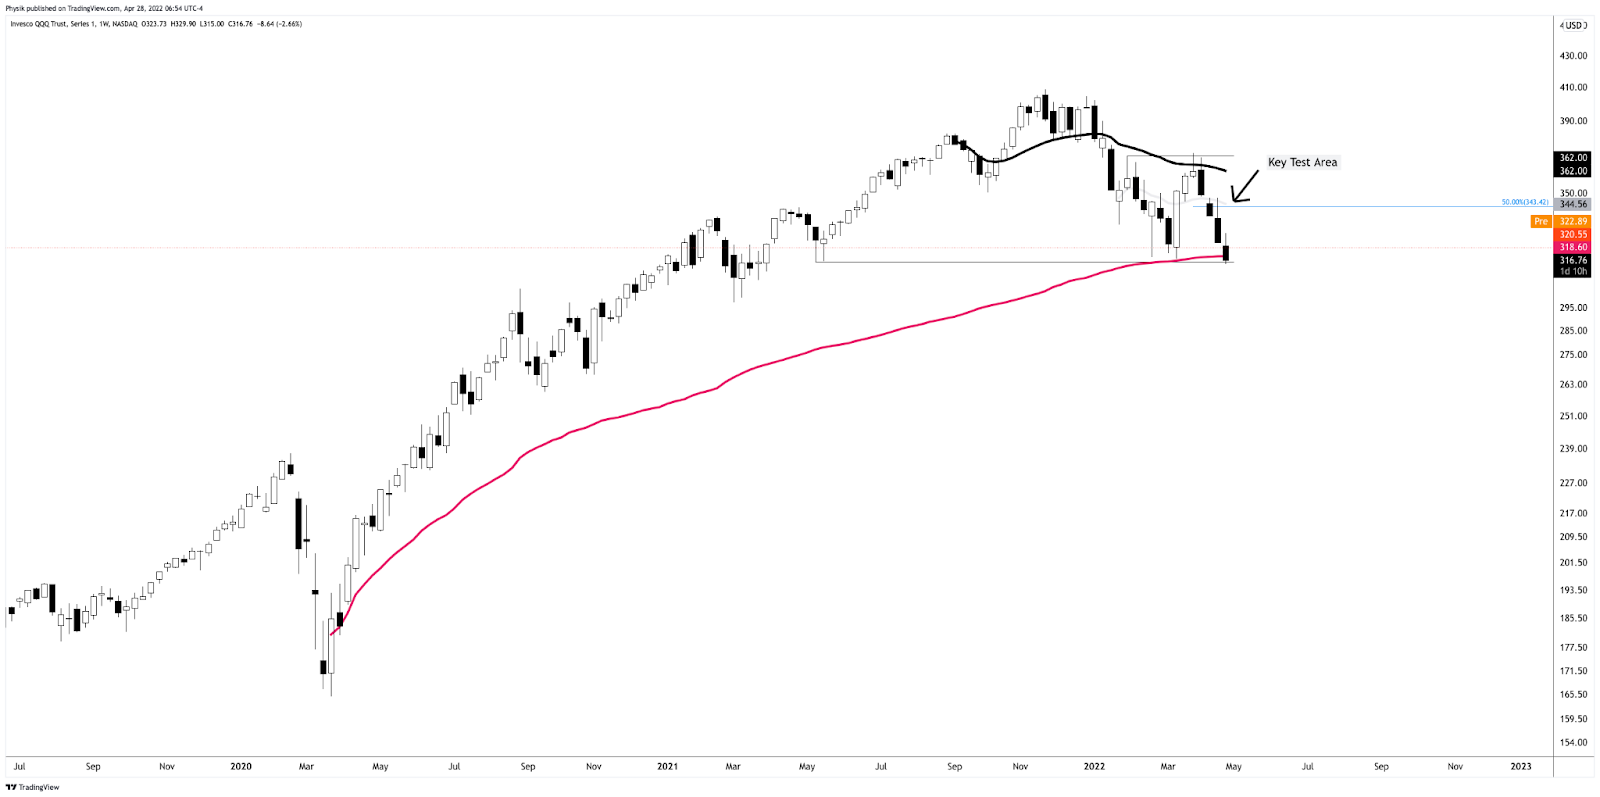
Considerations: Markets are higher after testing some key levels outlined in prior letters.
The Invesco QQQ Trust Series 1 (NASDAQ: QQQ), one of the weakest products this letter monitors, just tested a major VWAP, yesterday, anchored from the lows of March 2020.
Graphic: Invesco QQQ Trust Series 1 (NASDAQ: QQQ) with anchored VWAPs.
The Nasdaq has led the market down. It may lead the market higher on reversals. We’ll continue to monitor market breadth, among other metrics, for signs of strength.
Definitions
Overnight Rally Highs (Lows): Typically, there is a low historical probability associated with overnight rally-highs (lows) ending the upside (downside) discovery process.
Volume Areas: A structurally sound market will build on areas of high volume (HVNodes). Should the market trend for long periods of time, it will lack sound structure, identified as low volume areas (LVNodes). LVNodes denote directional conviction and ought to offer support on any test.
If participants were to auction and find acceptance into areas of prior low volume (LVNodes), then future discovery ought to be volatile and quick as participants look to HVNodes for favorable entry or exit.
Gamma: Gamma is the sensitivity of an option to changes in the underlying price. Dealers that take the other side of options trades hedge their exposure to risk by buying and selling the underlying. When dealers are short-gamma, they hedge by buying into strength and selling into weakness. When dealers are long-gamma, they hedge by selling into strength and buying into weakness. The former exacerbates volatility. The latter calms volatility.
Vanna: The rate at which the delta of an option changes with respect to volatility.
Charm: The rate at which the delta of an option changes with respect to time.
POCs: POCs are valuable as they denote areas where two-sided trade was most prevalent in a prior day session. Participants will respond to future tests of value as they offer favorable entry and exit.
Volume-Weighted Average Prices (VWAPs): A metric highly regarded by chief investment officers, among other participants, for quality of trade. Additionally, liquidity algorithms are benchmarked and programmed to buy and sell around VWAPs.
About
After years of self-education, strategy development, mentorship, and trial-and-error, Renato Leonard Capelj began trading full-time and founded Physik Invest to detail his methods, research, and performance in the markets.
Capelj also develops insights around impactful options market dynamics at SpotGamma and is a Benzinga reporter.
In no way should the materials herein be construed as advice. Derivatives carry a substantial risk of loss. All content is for informational purposes only.
The Daily Brief is a free glimpse into the prevailing fundamental and technical drivers of U.S. equity market products. Join the 200+ that read this report daily, below!
Editor’s Note: Hey team, thanks again for your reading of this daily newsletter. Due to travel commitments, I will not be writing reports consistently for the rest of this month.
Don’t expect any updates until Monday, April 11, 2022. Thereafter, coverage may be sporadic for the rest of the month.
What Happened
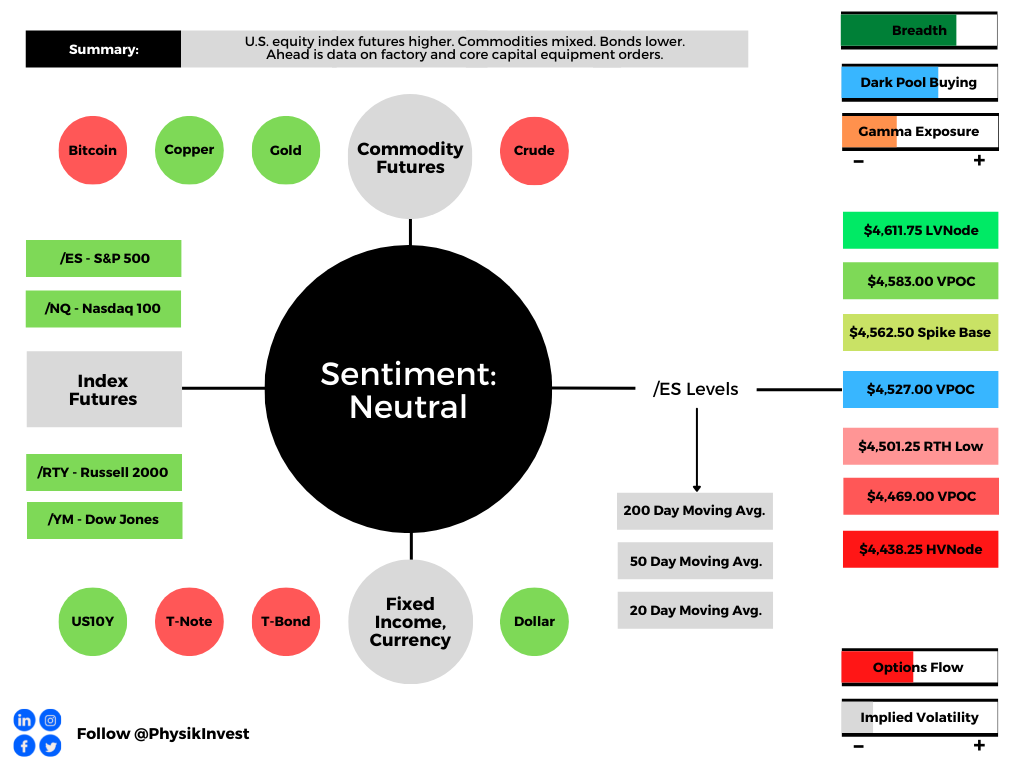
Overnight, equity index futures were higher after exploring lower, briefly. Commodities were mixed while bonds were lower and implied volatility measures were bid.
In terms of news, the European Union said it was interested in penalizing Russia, further, for its actions in Ukraine. This is as China battles new COVID-19 sub-strains.
Ahead is data on factory and core capital equipment orders (10:00 AM ET).
Graphic updated 5:45 AM ET. Sentiment Neutral if expected /ES open is inside of the prior day’s range. /ES levels are derived from the profile graphic at the bottom of the following section. Levels may have changed since initially quoted; click here for the latest levels. SqueezeMetrics Dark Pool Index (DIX) and Gamma (GEX) calculations are based on where the prior day’s reading falls with respect to the MAX and MIN of all occurrences available. A higher DIX is bullish. At the same time, the lower the GEX, the more (expected) volatility. Learn the implications of volatility, direction, and moneyness. SHIFT data used for S&P 500 (INDEX: SPX) options activity. Note that options flow is sorted by the call premium spent; if more positive, then more was spent on call options. Breadth reflects a reading of the prior day’s NYSE Advance/Decline indicator. VIX reflects a current reading of the CBOE Volatility Index (INDEX: VIX) from 0-100.
What To Expect
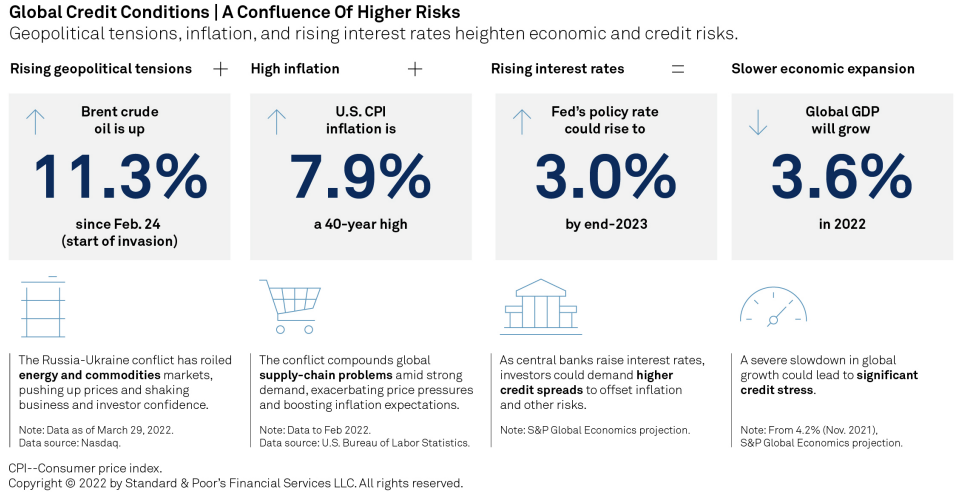
Fundamental: In the face of geopolitical tension, supply pressures, and inflation, consumer sentiment is at or below pandemic levels, prompting the Federal Reserve (Fed) to destimulate.
Graphic: Via S&P Global Inc (NYSE: SPGI) research. “Confluence Of Risks Halts Positive Credit Momentum.
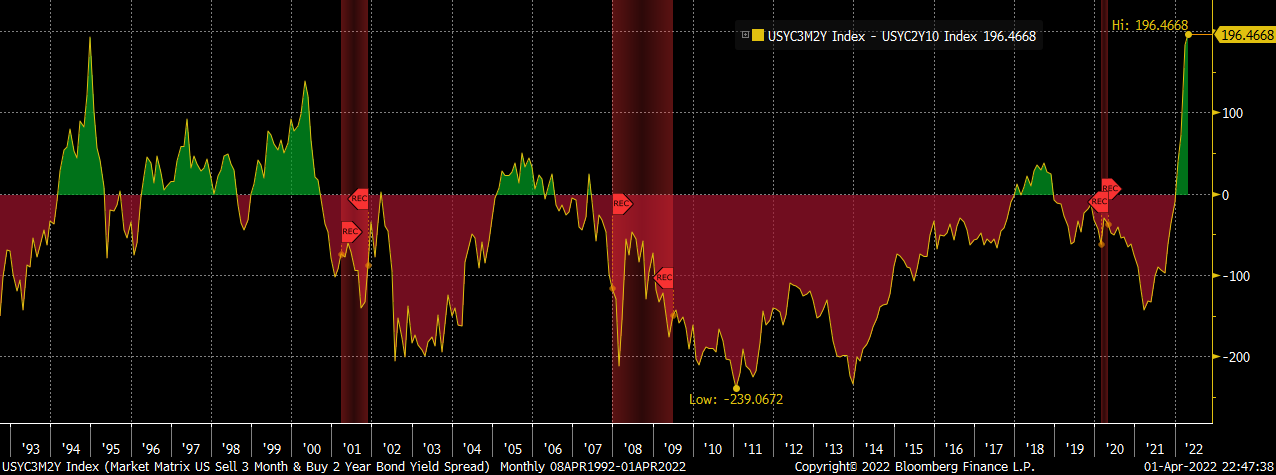
“It has entered 2008-09 territory and is not far from all-time lows in the ‘80s when inflation and interest rates hit double digits,” ARK Invest’s Catherine Wood explained in a Twitter discussion on yield-curve inversions and aggressive action by the Federal Reserve, as well as inflation.
“The economy succumbed to recession in each of those periods. Europe and China are also in difficult straits. The Fed seems to be playing with fire.”
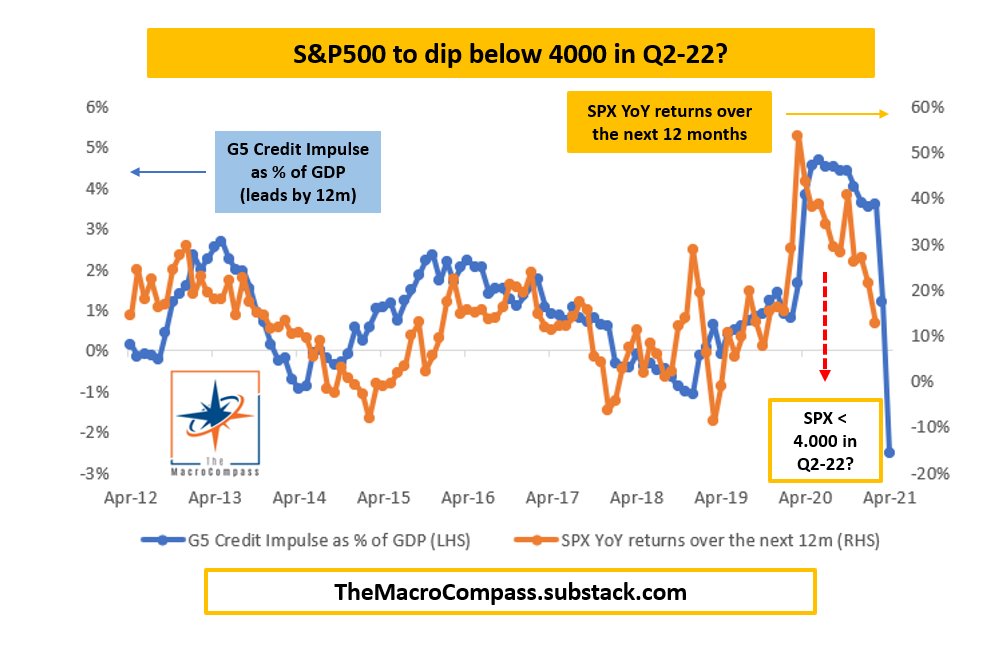
In accordance, the Macro Compass’ Alfonso Peccatiello explains that his credit impulse metrics, which lead economic activity and risk asset performance, imply a slowdown in earnings.
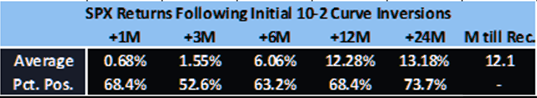
Still, in spite of these metrics, on average, recessions happen 12 to 24 months after the first yield curve inversions, according to Jefferies Financial Group Inc (NYSE: JEF).
Post-inversion S&P 500 performance, actually, is often positive.
Bolstering the call for positive equity market performance are strong seasonality trends during Fed-rate-hike episodes, a contraction in equity risk premia, and “still accommodative” monetary policy, per explanations by rates strategist Rishi Mishra.
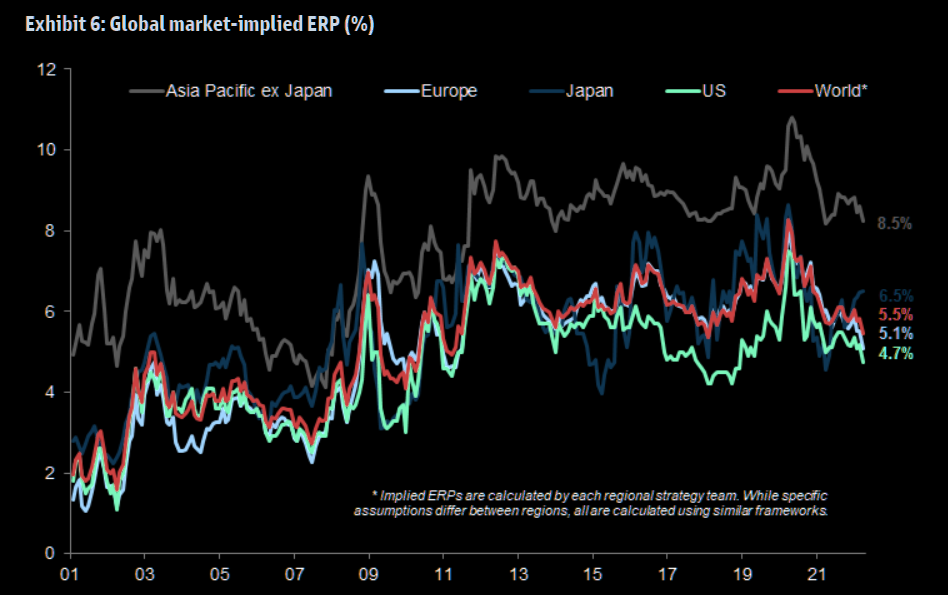
Graphic: Via Goldman Sachs Group Inc (NYSE: GS). Taken from The Market Ear. “Equities are a real asset as they make a claim on nominal GDP. In the post-financial crisis era, weak economic activity and lower inflation pushed down nominal GDP, raising the equity risk premium and reducing the bond term premium. So as long as economies grow, revenues and dividends should also grow. The dividend yield can be thought of as a real yield. Equity risk premia have started to decline in the post COVID cycle but remain higher than in the pre-financial crisis era.”
“[T]he 3ms2s vs 2s10s spread (or the 3m2s10s fly) is the widest it has been since the end of 1994. The widening of this fly is indicative of the fact that while the Fed shifted its guidance from dovish to extremely hawkish, the policy is still accommodative.”
Positioning: The equity market’s ferocious end-of-March rally, which placed the S&P 500 back above a key go/no-go level – the 200-period simple moving average – may have been in part the result of institutional investors purchasing equities ahead of quarterly reporting.
“Remember that stocks settle T+2, meaning that shares are actually owned by buyers two business days after they are purchased in the market,” says Interactive Brokers’ Group Inc (NASDAQ: IBKR) Steve Sosnick.
“That means that institutions who wanted to show stock positions on their quarterly reports would have needed to purchase those shares no later than Tuesday the 29th. The sharp end-of-day runups that we saw on Monday and Tuesday had the hallmarks of aggressive institutional buying.”
According to Deutsche Bank AG (NYSE: DB) analyses, “[a]ggregate equity positioning has now risen off the lows but only to the 22nd percentile and is still well below neutral.”
That said, quarter-end rebalances and options expirations (OPEX) likely do little to upset the balance of trade. Based on a lot of the insights shared in this letter, barring some exogenous event, the market is in a position to drift or balance.
This, as a result, may solicit a “stronger impulse to chase the rally,” at which point JPMorgan Chase & Co (NYSE: JPM) strategists say they would “generally be more concerned.”
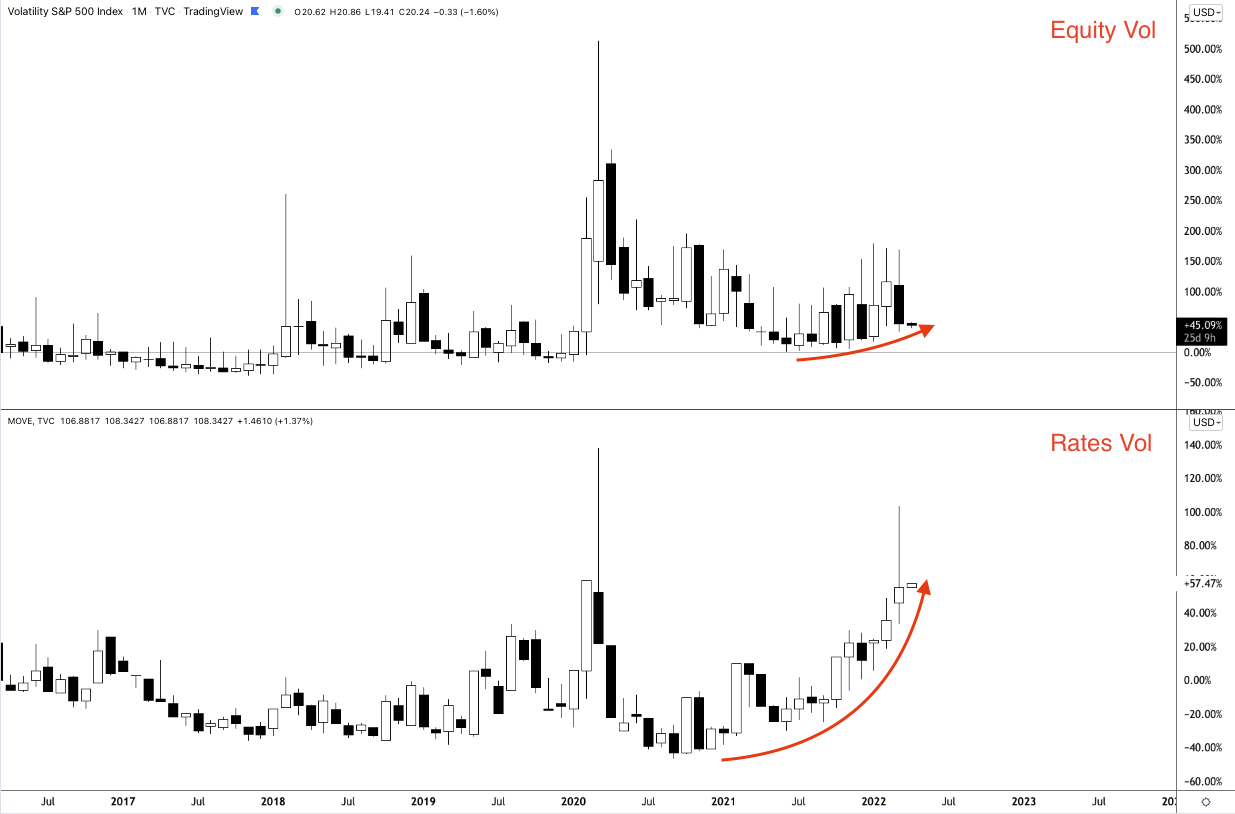
A collapse (or convergence) in volatility metrics for different asset classes (like the Merrill Lynch Options Volatility Estimate [INDEX: MOVE] and Cboe Volatility Index [INDEX: VIX]) would bolster the “drift or balance” thesis.
Graphic: Via Physik Invest.
Technical: As of 5:45 AM ET, Monday’s regular session (9:30 AM – 4:00 PM ET), in the S&P 500, will likely open in the upper part of a positively skewed overnight inventory, inside of prior-range and -value, suggesting a limited potential for immediate directional opportunity.
In the best case, the S&P 500 trades higher; activity above the $4,527.00 untested point of control (VPOC) puts in play the $4,562.50 spike base. Initiative trade beyond the spike base could reach as high as the $4,583.00 VPOC and $4,611.75 low volume area (LVNode), or higher.
In the worst case, the S&P 500 trades lower; activity below the $4,527.00 VPOC puts in play the $4,501.25 regular trade low (RTH Low). Initiative trade beyond the RTH Low could reach as low as the $4,469.00 VPOC and $4,438.25 HVNode, or lower.
Considerations: Spikes often mark the beginning of a break from value. Spikes higher (lower) are validated by trade at or above (below) the spike base (i.e., the origin of the spike).
In a spike up (down) situation, trade below (above) the spike base, negates the buying (selling).
Click here to load today’s key levels into the web-based TradingView charting platform. Note that all levels are derived using the 65-minute timeframe. New links are produced, daily.
Graphic: 65-minute profile chart of the Micro E-mini S&P 500 Futures.
The price strength in the SP500 lately has been impressive. But it is not even being confirmed (yet) by a higher high in the HY Bond A-D Line. That is less than impressive. pic.twitter.com/6X6DlXksol
Volume Areas: A structurally sound market will build on areas of high volume (HVNodes). Should the market trend for long periods of time, it will lack sound structure, identified as low volume areas (LVNodes). LVNodes denote directional conviction and ought to offer support on any test.
If participants were to auction and find acceptance into areas of prior low volume (LVNodes), then future discovery ought to be volatile and quick as participants look to HVNodes for favorable entry or exit.
POCs: POCs are valuable as they denote areas where two-sided trade was most prevalent in a prior day session. Participants will respond to future tests of value as they offer favorable entry and exit.
About
After years of self-education, strategy development, mentorship, and trial-and-error, Renato Leonard Capelj began trading full-time and founded Physik Invest to detail his methods, research, and performance in the markets.
Capelj also develops insights around impactful options market dynamics at SpotGamma and is a Benzinga reporter.
In no way should the materials herein be construed as advice. Derivatives carry a substantial risk of loss. All content is for informational purposes only.
Editor’s Note: The Daily Brief is a free glimpse into the prevailing fundamental and technical drivers of U.S. equity market products. Join the 200+ that read this report daily, below!
Overnight, equity index futures auctioned off recovery highs, with bonds. Most commodity products held a bid, as did measures of equity index implied volatility (IV).
Ahead is data on Jobless Claims, the Consumer Price Index (8:30 AM ET), the Federal Budget (2:00 PM ET), and Fed-speak (7:00 PM ET).
Graphic updated 6:50 AM ET. Sentiment Neutral if expected /ES open is inside of the prior day’s range. /ES levels are derived from the profile graphic at the bottom of the following section. Levels may have changed since initially quoted; click here for the latest levels. SqueezeMetrics Dark Pool Index (DIX) and Gamma (GEX) calculations are based on where the prior day’s reading falls with respect to the MAX and MIN of all occurrences available. A higher DIX is bullish. At the same time, the lower the GEX, the more (expected) volatility. Learn the implications of volatility, direction, and moneyness. SHIFT data used for S&P 500 (INDEX: SPX) options activity. Note that options flow is sorted by the call premium spent; if more positive, then more was spent on call options. Breadth reflects a reading of the prior day’s NYSE Advance/Decline indicator. VIX reflects a current reading of the CBOE Volatility Index (INDEX: VIX) from 0-100.
What To Expect
Fundamental: Participants have readied themselves for data on inflation.
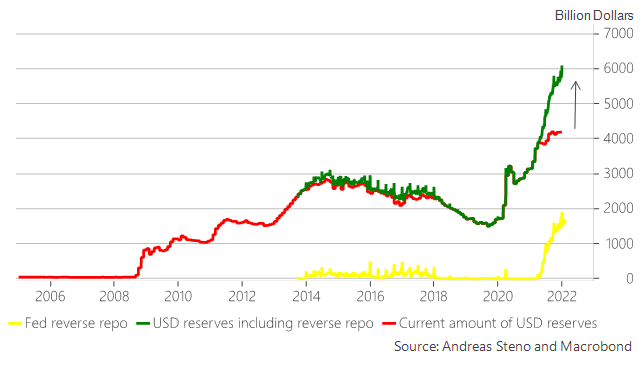
According to Nordea Bank’s (OTC: NRDBY) research, though January inflation will be higher, ultimately leading to volatility in bonds and equities, there will be a moderation in momentum.
The headline figure may print at 7.4% y/y (consensus: 7.2%) while core inflation may print 5.9% y/y (consensus: 5.9%). This is after CPI basket weights were updated and show an increased weight towards the prices that are rising the most (used cars and shelter costs).
“An above-consensus print could imply frontloading of hikes and increased speculation in a 50bp March-hike,” Nordea’s Philip Maldia Madsen and Helene Østergaard explain.
“Frontloading rate hikes support the USD, but substantial gains may require higher terminal rates pricing (more hikes priced, not just faster).”
Graphic: Via TS Lombard. Taken from The Market Ear. Market prices in more than five rate hikes in 2022.
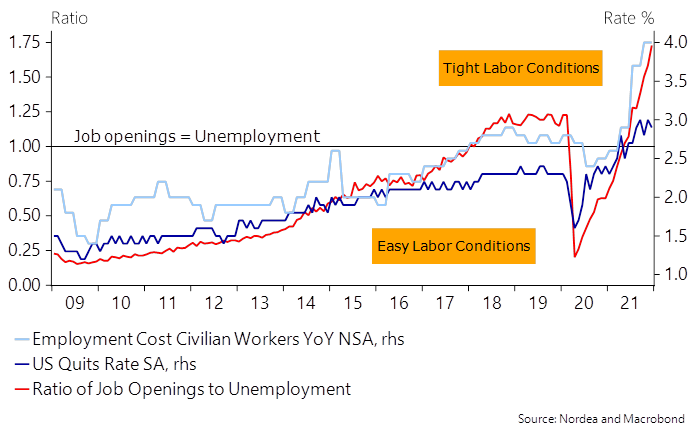
This is as U.S. labor conditions have tightened markedly, fueling a “sell-off in the short-end of the USD curve as inflation risks remain historically high.”
Graphic: Via Nordea, “the million-dollar question for 2022 remains whether wage growth will persist as base effects start to kick in.”
Taken together, data points to the Federal Reserve staying hawkish and a continued risk in shorter-duration bonds.
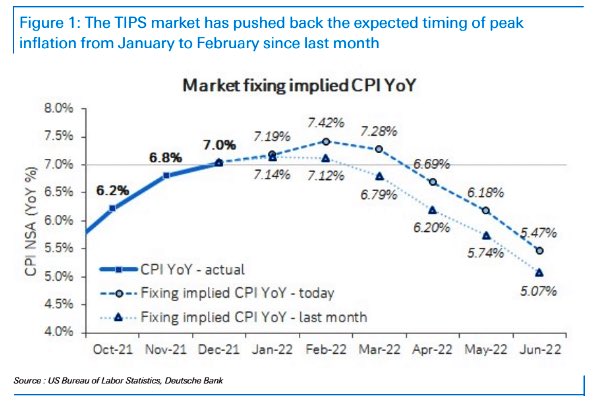
Andreas Steno Larsen of Heimstaden, who this newsletter quoted, yesterday, has explained that despite inflation printing higher in Q1, the trends will shift in Q2-Q4, given new CPI weights.
“The changes made by the BLS hence provide a net/net negative impact on inflation down the line (likely during H2-2022 already), but not before another positive tilt to inflation is seen in the very short-term.”
Graphic: Via Deutsche Bank (NYSE: DB), inflation proving stickier.
What is the outlook for bonds and tech? Steno Larsen suggests it is benign.
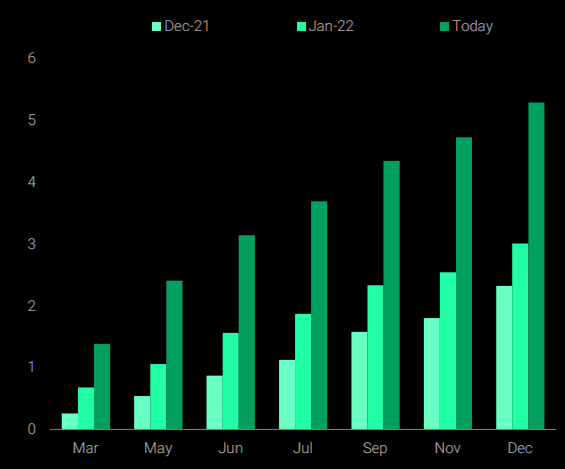
“I don’t really fear the planned QT from the Fed in that regards either,” he elaborates.
“We will not see a strong negative USD liquidity effect from QT initially as the gap between the total amount of printed USD reserves and the current amount of USD reserves available to the banking system will act as a buffer once the Fed starts bringing down the balance sheet size (QT).”
Graphic: Via Steno Larsen, “USD reserves currently parked at the reverse repo will flow into T-bills once QT commences effectively leaving USD liquidity unchanged as frozen reverse repo liquidity will be unleashed into the system, … [mitigating] the adverse effects of the Fed trying to bring down the balance sheet size again, and this is in sharp contrast to the QT process of 2017-2018.”
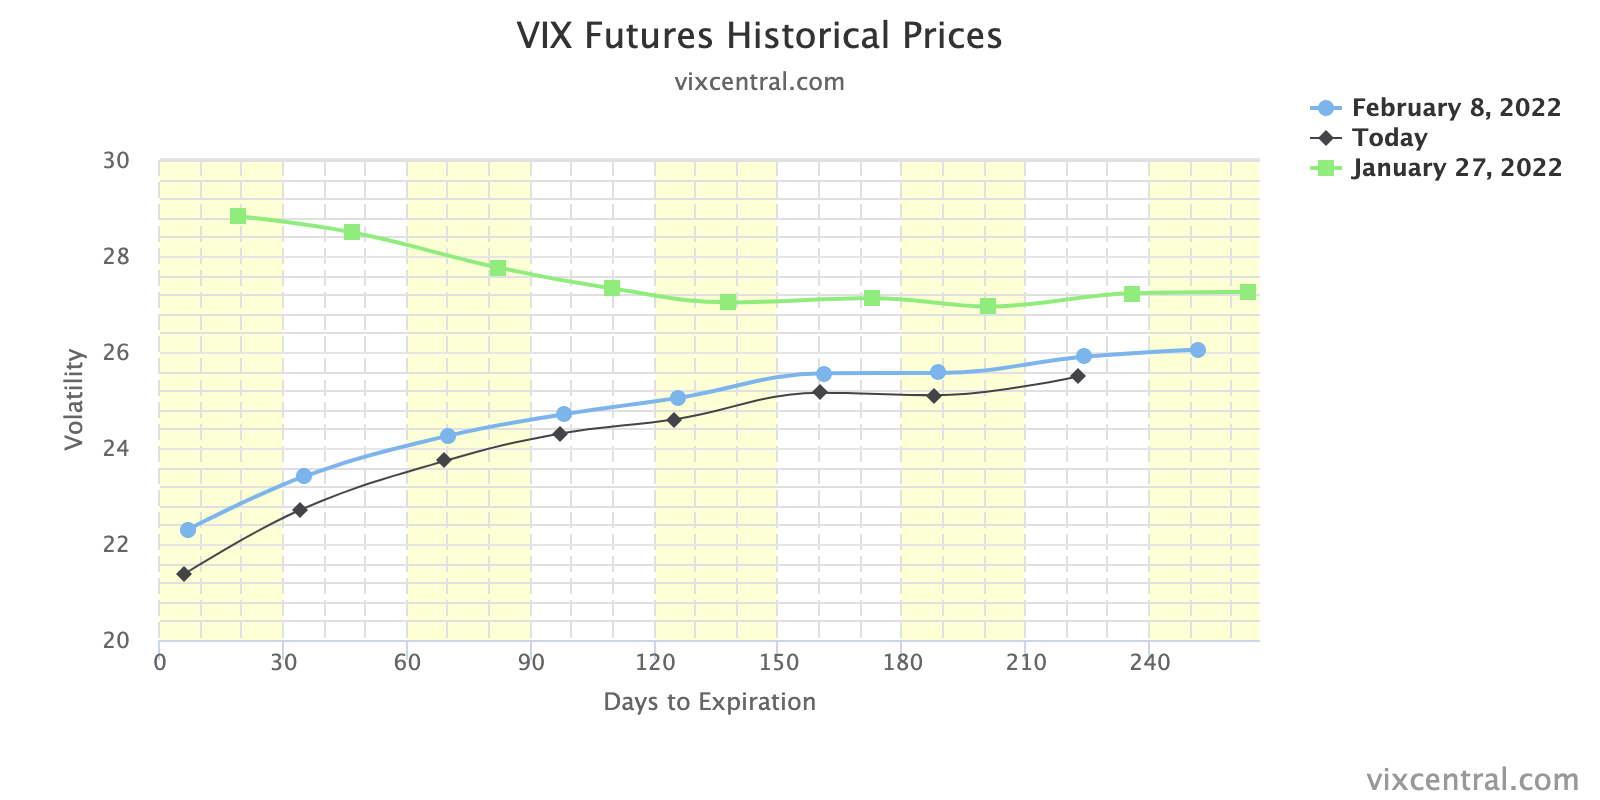
Positioning: The effects of continued volatility compression contended with demand for protection, yesterday.
Graphic: VIX term structure continues to compress. This solicits flows that may bolster a price rise.
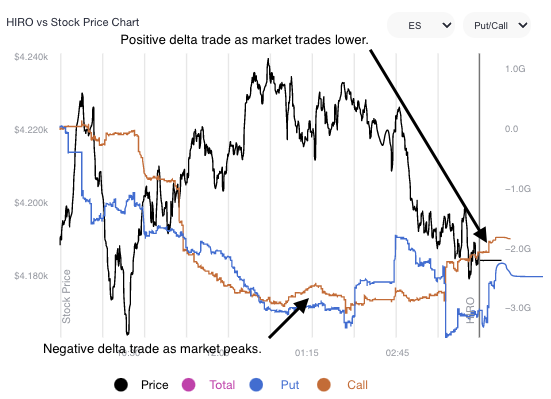
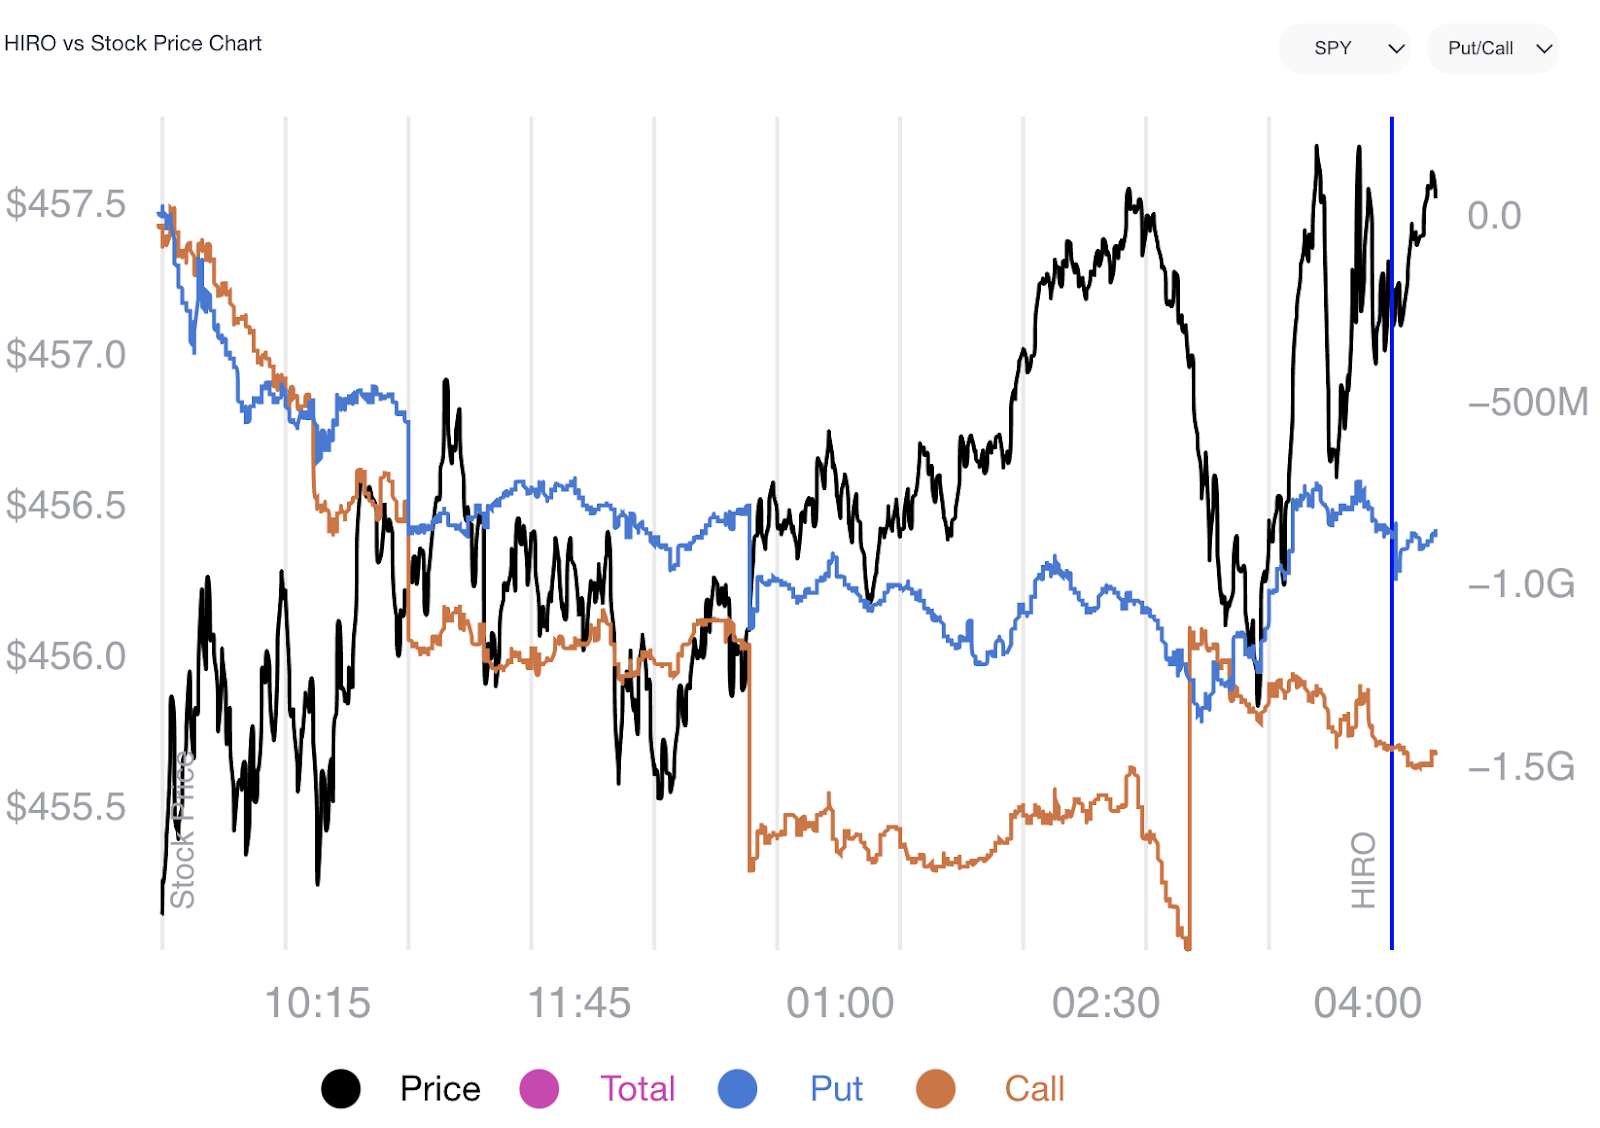
In the face of a sort-of upward drift, participants legged into negative delta (-delta) trades that offered them positive exposure to the downside.
Below is a chart of SpotGamma’s (beta) Hedging Impact of Real-Time Options indicator. Notice the trend in the blue (put) and orange (call) lines. This trend denotes demand for -delta (call selling and put buying) which translates to pressure from dealers who are selling underlying (adding -delta) against their positive delta (+delta) options exposure.
Graphic: SpotGamma’s HIRO indicator for the SPDR S&P 500 ETF Trust (NYSE: SPY).
As stated, the pressure from this divergence was offset by continued compression in volatility; as time and volatility trend to zero, the supportive hedging flows with respect to time (charm) and volatility (vanna), along with “passive buying support,” took from the negative implications of customer demand for protection.
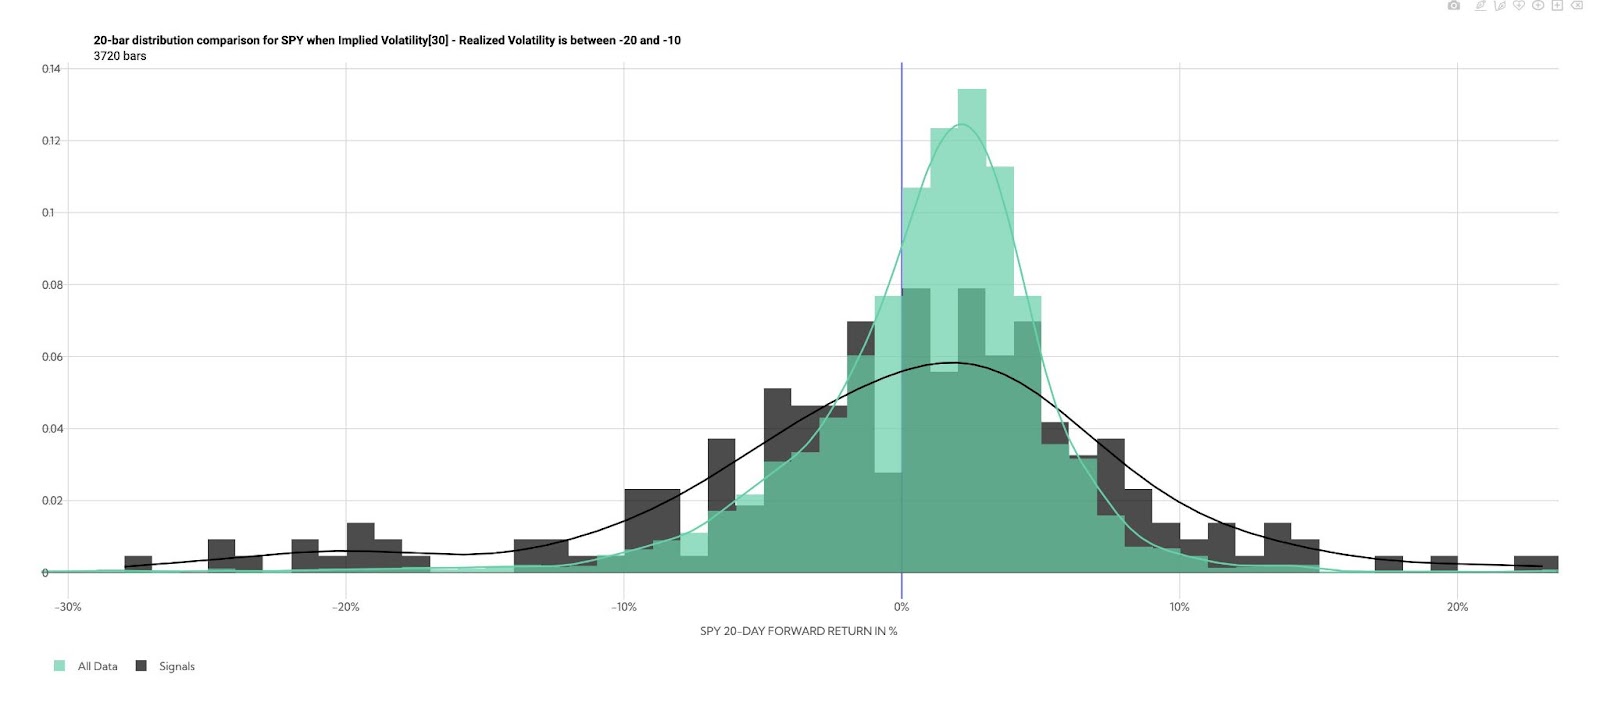
Overall, similar to yesterday, buying proxies still point to modest bullishness.
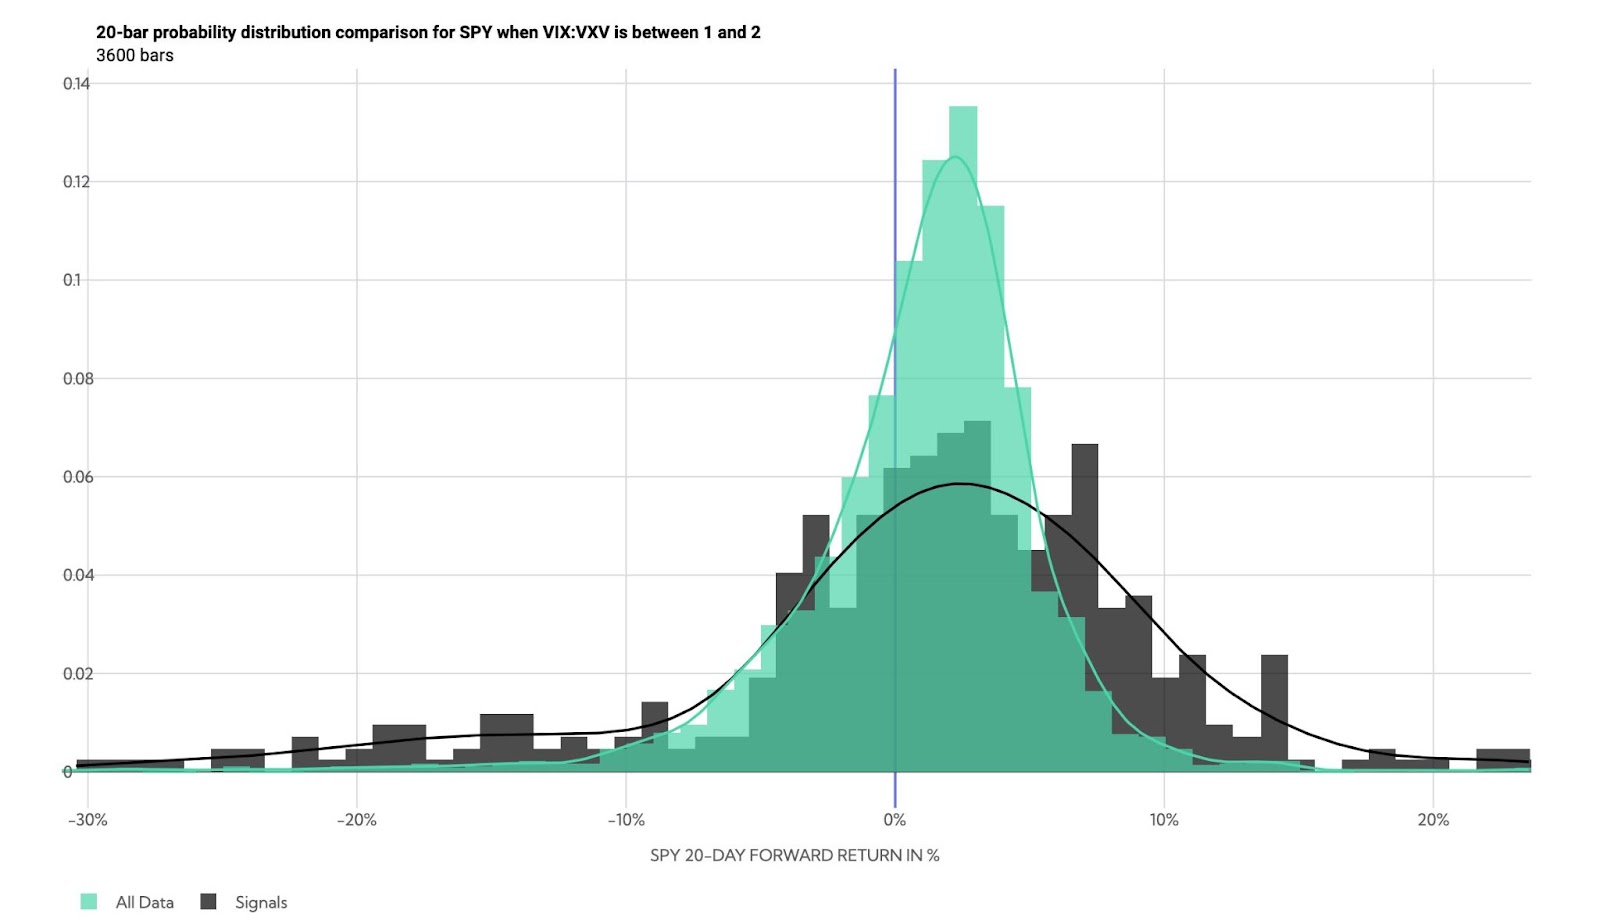
Graphic: Via @HalfersPower, the forward return distribution for SPY when implied volatility less realized volatility is between -20 and -10. “VRP (30 Day ATM Implied Volatility – 21 Day Realized Volatility (Y-Z) is the most deeply negative since the 2020 crash at -12 pts (hitting as low as -14 on Wednesday).”
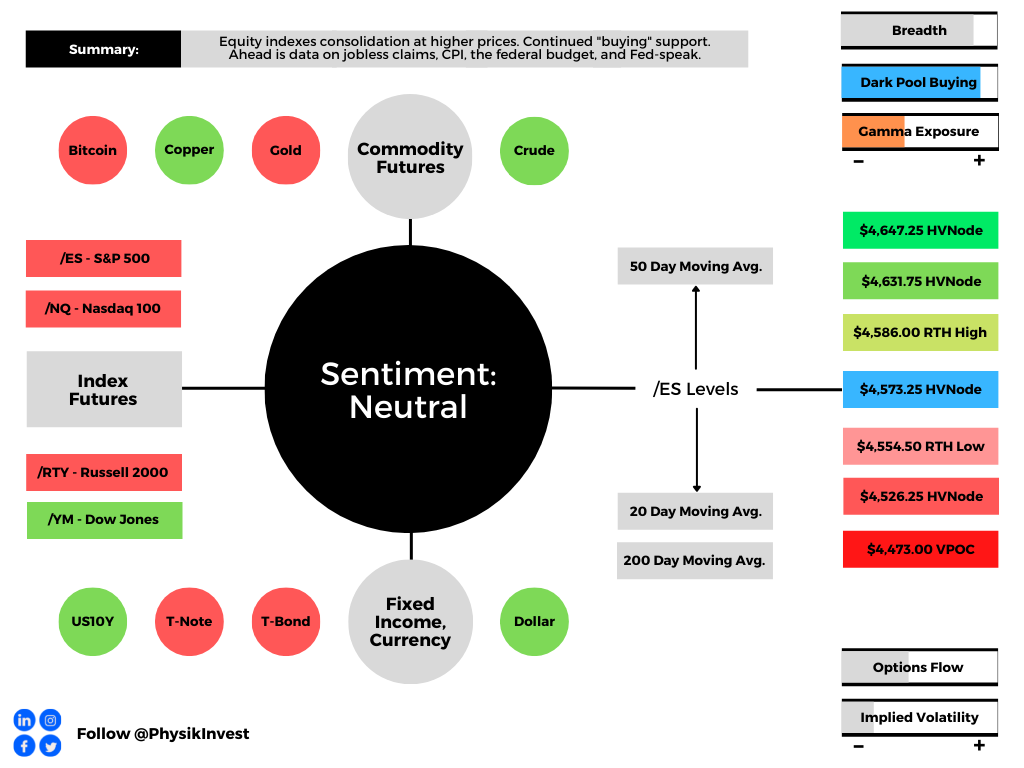
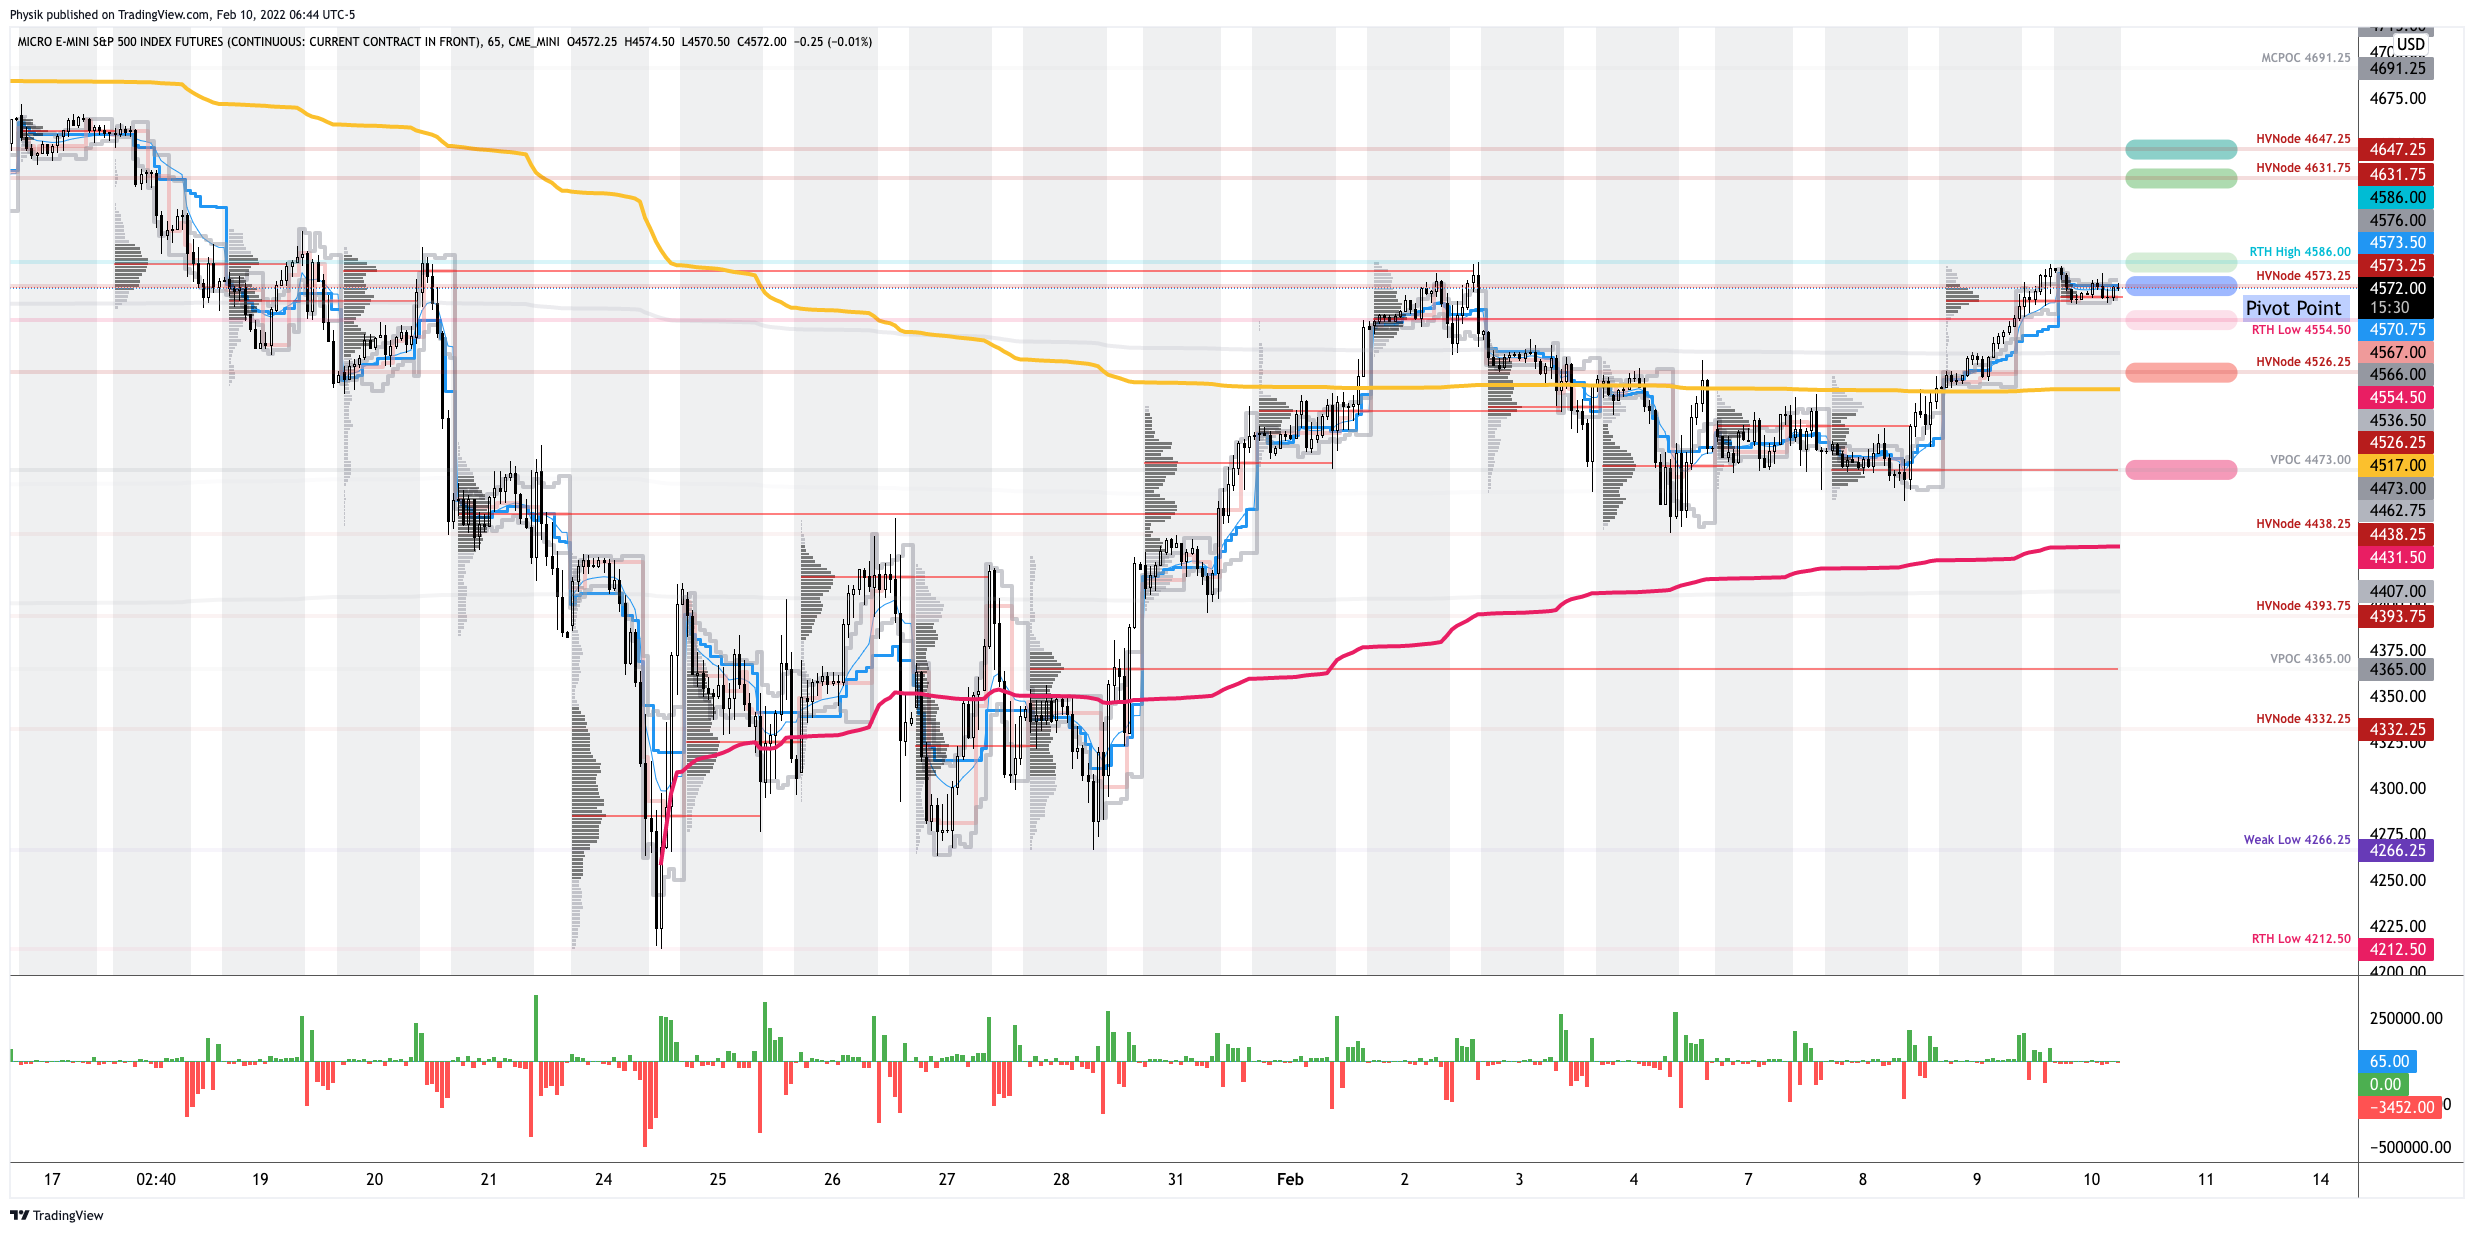
Technical: As of 6:30 AM ET, Monday’s regular session (9:30 AM – 4:00 PM ET), in the S&P 500, will likely open in the middle part of a negatively skewed overnight inventory, inside of prior-range and -value, suggesting a limited potential for immediate directional opportunity.
In the best case, the S&P 500 trades higher; activity above the $4,573.25 high volume area (HVNode) puts in play the $4,586.00 regular trade high (RTH High). Initiative trade beyond the RTH High could reach as high as the $4,631.75 and $4,647.25 HVNodes, or higher.
In the worst case, the S&P 500 trades lower; activity below the $4,573.25 HVNode puts in play the $4,554.50 RTH Low. Initiative trade beyond the RTH Low could reach as low as the $4,526.25 HVNode and $4,473.00 VPOC, or lower.
Click here to load today’s key levels into the web-based TradingView charting platform. Note that all levels are derived using the 65-minute timeframe. New links are produced, daily.
Graphic: 65-minute profile chart of the Micro E-mini S&P 500 Futures.
What People Are Saying
20% probability the Fed is gonna hike >7 times in 2022 (!), & then bring Fed Funds to 2% soon after that.
Yet 30y yields can’t breach 2.25%.
Let’s see if https://t.co/HtlHaKOguK is delivering on its teaching mission: what’s the bond market telling you?
Volume Areas: A structurally sound market will build on areas of high volume (HVNodes). Should the market trend for long periods of time, it will lack sound structure, identified as low volume areas (LVNodes). LVNodes denote directional conviction and ought to offer support on any test.
If participants were to auction and find acceptance into areas of prior low volume (LVNodes), then future discovery ought to be volatile and quick as participants look to HVNodes for favorable entry or exit.
POCs: POCs are valuable as they denote areas where two-sided trade was most prevalent in a prior day session. Participants will respond to future tests of value as they offer favorable entry and exit.
About
After years of self-education, strategy development, mentorship, and trial-and-error, Renato Leonard Capelj began trading full-time and founded Physik Invest to detail his methods, research, and performance in the markets.
Capelj is also a Benzinga finance and technology reporter interviewing the likes of Shark Tank’s Kevin O’Leary, JC2 Ventures’ John Chambers, FTX’s Sam Bankman-Fried, and ARK Invest’s Catherine Wood, as well as a SpotGamma contributor developing insights around impactful options market dynamics.
Disclaimer
Physik Invest does not carry the right to provide advice.
In no way should the materials herein be construed as advice. Derivatives carry a substantial risk of loss. All content is for informational purposes only.