The daily brief is a free glimpse into the prevailing fundamental and technical drivers of U.S. equity market products. Join the 300+ that read this report daily, below!
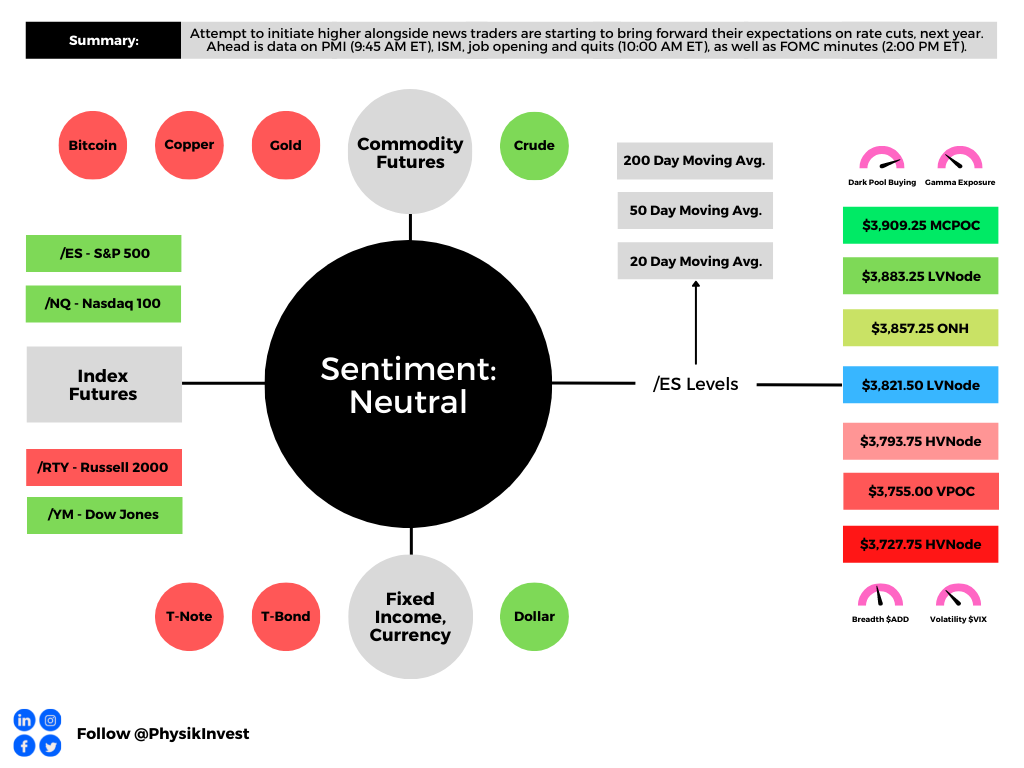
Graphic updated 6:25 AM ET. Sentiment Neutral if expected /ES open is inside of the prior day’s range. /ES levels are derived from the profile graphic at the bottom of the following section. Levels may have changed since initially quoted; click here for the latest levels. SqueezeMetrics Dark Pool Index (DIX) and Gamma (GEX) calculations are based on where the prior day’s reading falls with respect to the MAX and MIN of all occurrences available. A higher DIX is bullish. At the same time, the lower the GEX, the more (expected) volatility. Learn the implications of volatility, direction, and moneyness. Breadth reflects a reading of the prior day’s NYSE Advance/Decline indicator. VIX reflects a current reading of the CBOE Volatility Index (INDEX: VIX) from 0-100.
What To Expect
Fundamental: Impressive was the strength of the Nasdaq 100 (INDEX: NDX), relative to the S&P 500 (INDEX: SPX), yesterday.
Graphic: Via Charles Schwab Corporation-owned (NYSE: SCHW) TD Ameritrade’s Thinkorswim. Retrieved by Physik Invest.
This is as traders are now paring back their bets on monetary tightening, given the deterioration in the U.S. economic outlook. The NDX, which has been most sensitive to changes in monetary policies, accordingly, responded best as that index is comprised of assets that have the most to lose in a high-rate, aggressive quantitative tightening (QT) environment.
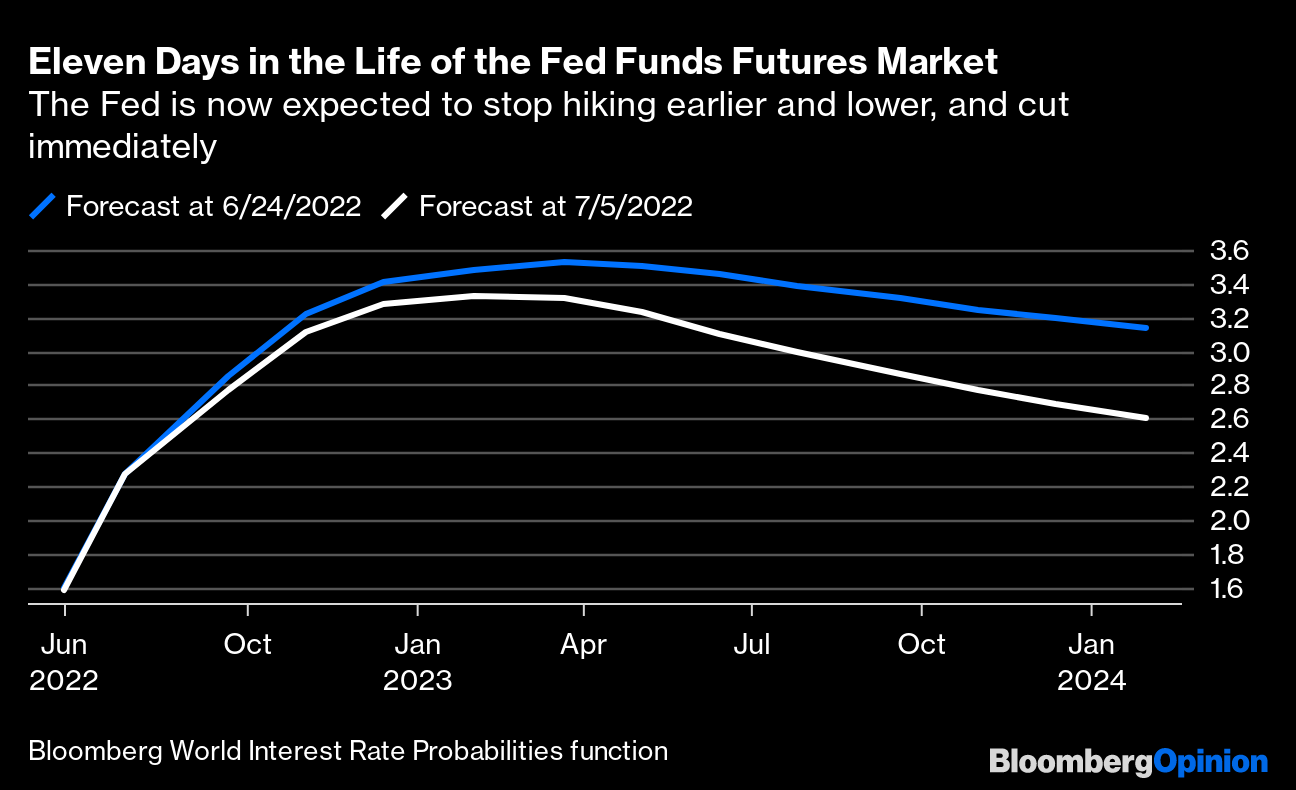
Graphic: Via Bloomberg. “In less than two weeks, the market has dropped its prediction for a peak rate brought forward the moment of the first cut, and forecasts a far more aggressive cutting program that will start next spring.”
For context, QT is the central banking authorities’ removal of balance sheet assets via sales or the non-reinvestment of the principal sum of maturing securities. Accordingly, if bonds are sold, their values fall and yields rise. This pushes yield-hungry investors into less risky categories.
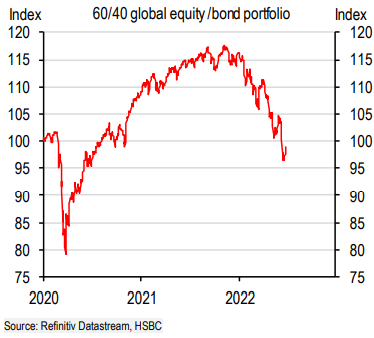
Graphic: Retrieved from @patrick_saner. “A 60/40 portfolio is now worth less than before the pandemic.”
“As you look at where to park your cash for the next six months, you could do worse than to look at a mix of oversold treasuries and stocks – offering both compelling yield and a good degree of value protection,” explains Toggle CEO Jan Szilagyi in a note.
Graphic: Via Toggle.
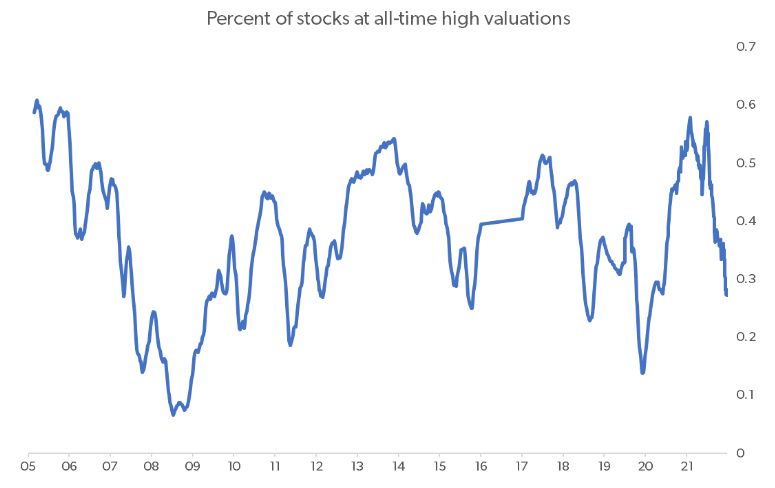
These are comments, however, in the face of what has been a “multiple compression,” as we talked about last week. The upcoming earnings season is likely to shed clarity with respect to corporates’ ability to weather or pass on higher costs, among other things.
In the case of a so-called “earnings compression,” some commentators suggest the market is not priced correctly and another leg lower may be initiated.
Adding, expected are the Federal Open Market Committee (FOMC) meeting minutes, today.
They are likely to “indicate that policymakers were worried about the un-anchoring of inflation expectations, … justifying the Fed’s shift in placing more focus on headline inflation measures rather than just core measures,” according to Bloomberg’s chief U.S. economist Anna Wong.
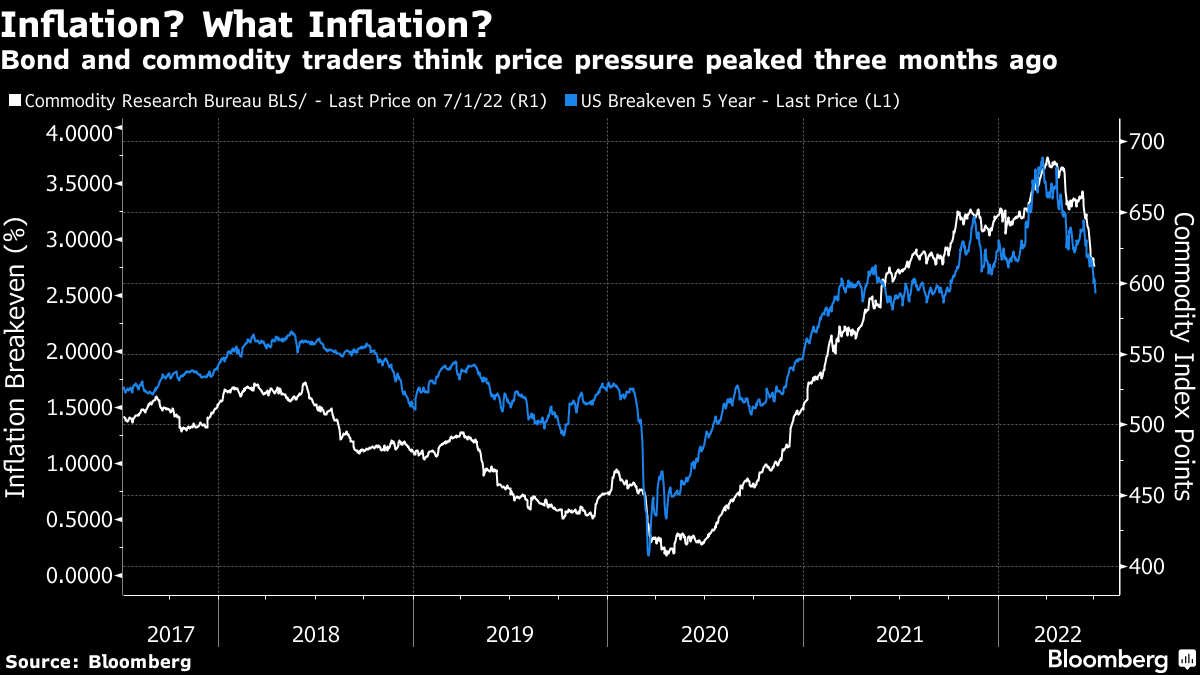
Graphic: Via Bloomberg. “After surging consistently to hit an all-time high in the two years after the March 2020 shutdown, the [Commodity Research Bureau Raw Industrials index] turned sharply southward.”
Positioning: Data shows net gamma exposure increasing which may increasingly feed into smaller ranges if prices continue to rise.
Further, continued are gaps between volatility measures for the rates and equity markets. This is, in part, due to the supply of volatility, as we’ve talked about in past commentaries.
Why haven't traditional hedges been working in the stock market?
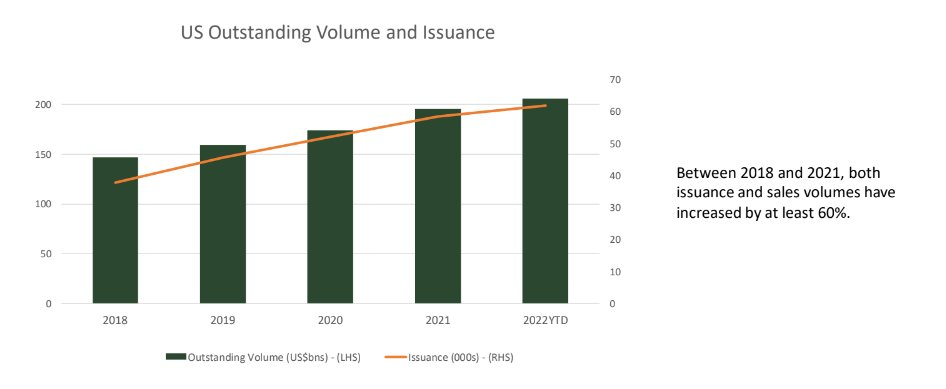
The Ambrus Group’s Kris Sidial adds: “Another reason why equity vol on the index level has been so well offered is due to the structured products market continuing its dominance.”
“Investors are turning to alternatives in this market & these solutions continue to gain attention which leads to index level vol selling.”
Graphic: Via The Ambrus Group’s Kris Sidial. “[S]ome dealers will opportunistically look to sell vol in some buckets in the front of the term structure.”
Given this, the relationship between realized volatility (RVOL) has crept and, at times, exceeded that which the market has implied (IVOL). This, coupled with naive metrics for skew, suggests to us that it still makes sense to be a buyer of volatility, albeit via more complex structures.
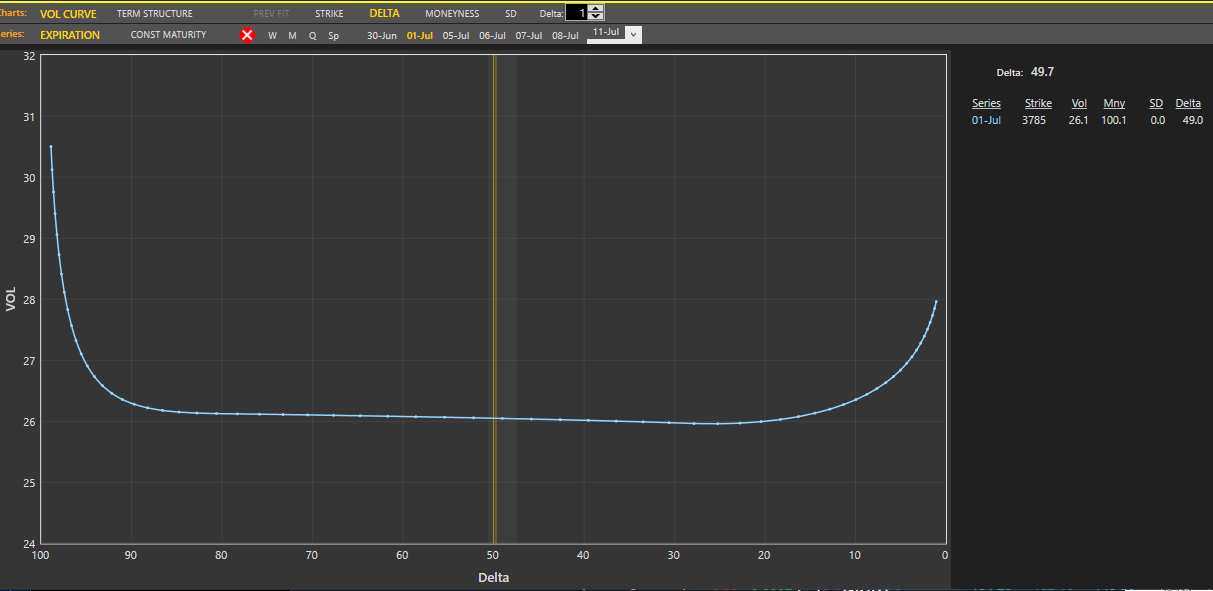
Graphic: Via Pat Hennessy. “Tomorrow’s SPX expo (Jul1) is wildin… 26 vol for any strike with a 37 or 38 handle with a ridiculous curvature in the tails. God speed to all the 1dte theta gang. Selling OTM puts/calls for the same vol as ATM seems… umm… not good.”
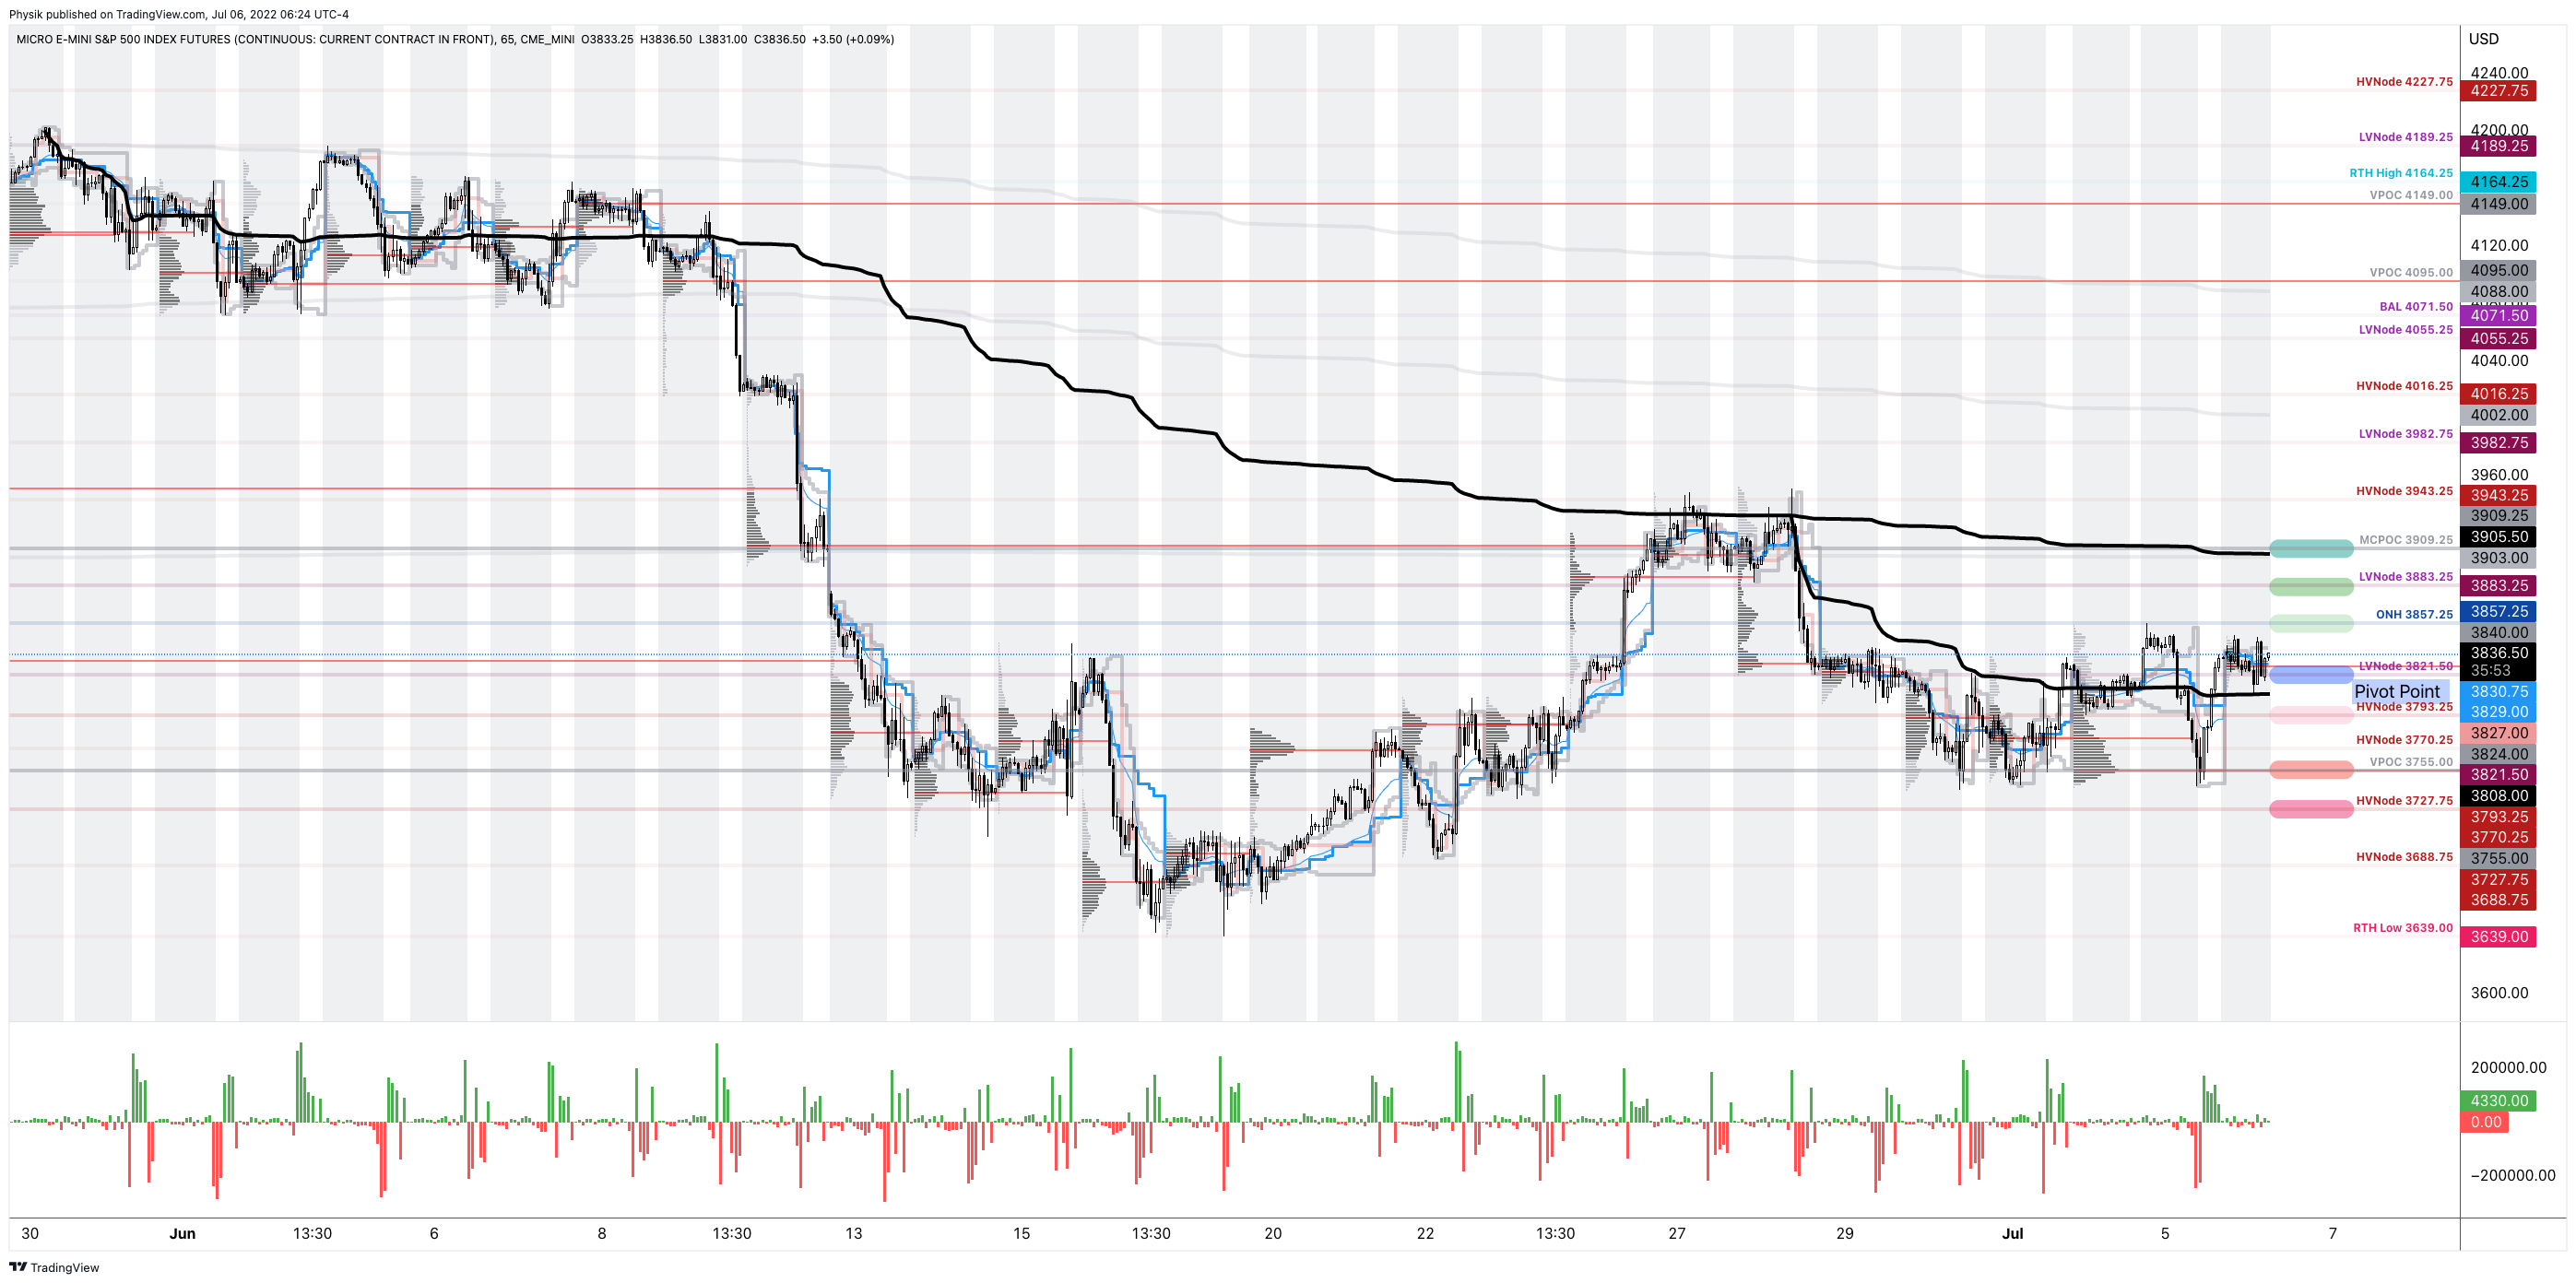
Technical: As of 6:30 AM ET, Wednesday’s regular session (9:30 AM – 4:00 PM ET), in the S&P 500, is likely to open in the mid-to-upper part of a balanced overnight inventory, inside of prior-range and -value, suggesting a potential for immediate directional opportunity.
In the best case, the S&P 500 trades higher.
Any activity above the $3,821.50 LVNode puts into play the $3,857.25 ONH. Initiative trade beyond the ONH could reach as high as the $3,883.25 LVNode and $3,909.25 MCPOC, or higher.
In the worst case, the S&P 500 trades lower.
Any activity below the $3,821.50 LVNode puts into play the $3,793.25 HVNode. Initiative trade beyond the HVNode could reach as low as the $3,755.00 VPOC and $3,727.75 HVNode, or lower.
Click here to load today’s key levels into the web-based TradingView charting platform. Note that all levels are derived using the 65-minute timeframe. New links are produced, daily.
Graphic: 65-minute profile chart of the Micro E-mini S&P 500 Futures.
Definitions
Overnight Rally Highs (Lows): Typically, there is a low historical probability associated with overnight rally-highs (lows) ending the upside (downside) discovery process.
Volume Areas: A structurally sound market will build on areas of high volume (HVNodes). Should the market trend for long periods of time, it will lack sound structure, identified as low volume areas (LVNodes). LVNodes denote directional conviction and ought to offer support on any test.
If participants were to auction and find acceptance into areas of prior low volume (LVNodes), then future discovery ought to be volatile and quick as participants look to HVNodes for favorable entry or exit.
POCs: POCs are valuable as they denote areas where two-sided trade was most prevalent in a prior day session. Participants will respond to future tests of value as they offer favorable entry and exit.
About
After years of self-education, strategy development, mentorship, and trial-and-error, Renato Leonard Capelj began trading full-time and founded Physik Invest to detail his methods, research, and performance in the markets.
Capelj also develops insights around impactful options market dynamics at SpotGamma and is a Benzinga reporter.
In no way should the materials herein be construed as advice. Derivatives carry a substantial risk of loss. All content is for informational purposes only.
The Daily Brief is a free glimpse into the prevailing fundamental and technical drivers of U.S. equity market products. Join the 200+ that read this report daily, below!
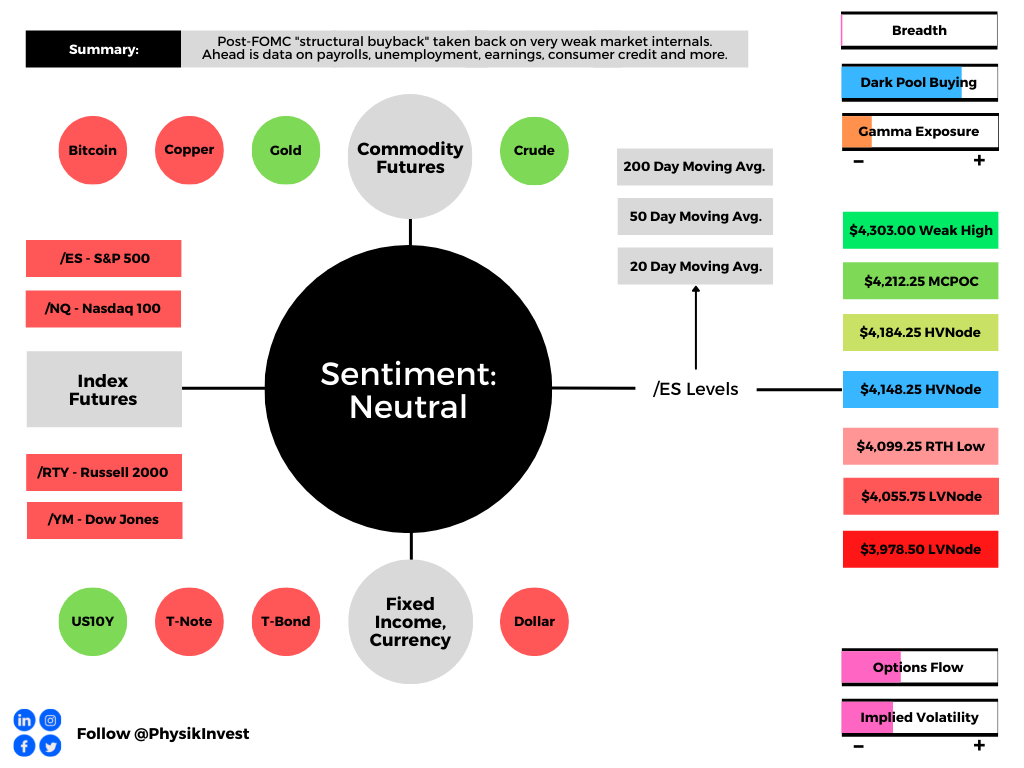
Overnight, equity index futures auctioned weak, inside of the prior day’s large trading range.
Yesterday, the equity indexes, bonds, and crypto (which many saw as a hedge against equities) were sold, aggressively. The selling came one day after the Federal Reserve hiked 0.50 basis points and outlined its balance sheet reduction timeline.
Notable was ten-year Treasury yields breaking the 3.00% barrier.
Despite a more dovish tone (i.e., Fed assuaging participants of a 0.75 basis point hike in the coming meetings), the near-vertical price rise (which we discussed was a function of “structural buyback” in yesterday’s morning letter) was taken back in a fire sale across all sectors.
Today is data on nonfarm payrolls, unemployment rates, average hourly earnings, and labor force participation (8:30 AM ET). Later, consumer credit data is released (3:00 PM ET).
Speaking today is the Fed’s John Williams (9:15 AM ET), Raphael Bostic (3:20 PM ET), James Bullard and Chris Waller (7:15 PM ET), as well as Mary Daly (8:00 PM ET).
Graphic updated 6:45 AM ET. Sentiment Neutral if expected /ES open is inside of the prior day’s range. /ES levels are derived from the profile graphic at the bottom of the following section. Levels may have changed since initially quoted; click here for the latest levels. SqueezeMetrics Dark Pool Index (DIX) and Gamma (GEX) calculations are based on where the prior day’s reading falls with respect to the MAX and MIN of all occurrences available. A higher DIX is bullish. At the same time, the lower the GEX, the more (expected) volatility. Learn the implications of volatility, direction, and moneyness. SHIFT data used for S&P 500 (INDEX: SPX) options activity. Note that options flow is sorted by the call premium spent; if more positive, then more was spent on call options. Breadth reflects a reading of the prior day’s NYSE Advance/Decline indicator. VIX reflects a current reading of the CBOE Volatility Index (INDEX: VIX) from 0-100.
What To Expect
Positioning: In yesterday’s detailed letter, we talked about the implications of participants’ hedging heading into and after the Federal Open Market Committee (FOMC) event.
Mainly, markets were stretched and participants were demanding protection in size. As said:
“Barring a worst-case scenario, if markets do not perform to the downside (i.e., do not trade lower), those highly-priced (often very short-dated) bets on direction will quickly decay, and hedging flows with respect to time and volatility may bolster sharp rallies.”
After that “structural buyback,” as Kai Volatility’s Cem Karsan explained clearly, it was highly likely the bear trend would hold. Participants not shifting their bets on direction (via options) to higher prices, further out in time, further suggested very little change in sentiment.
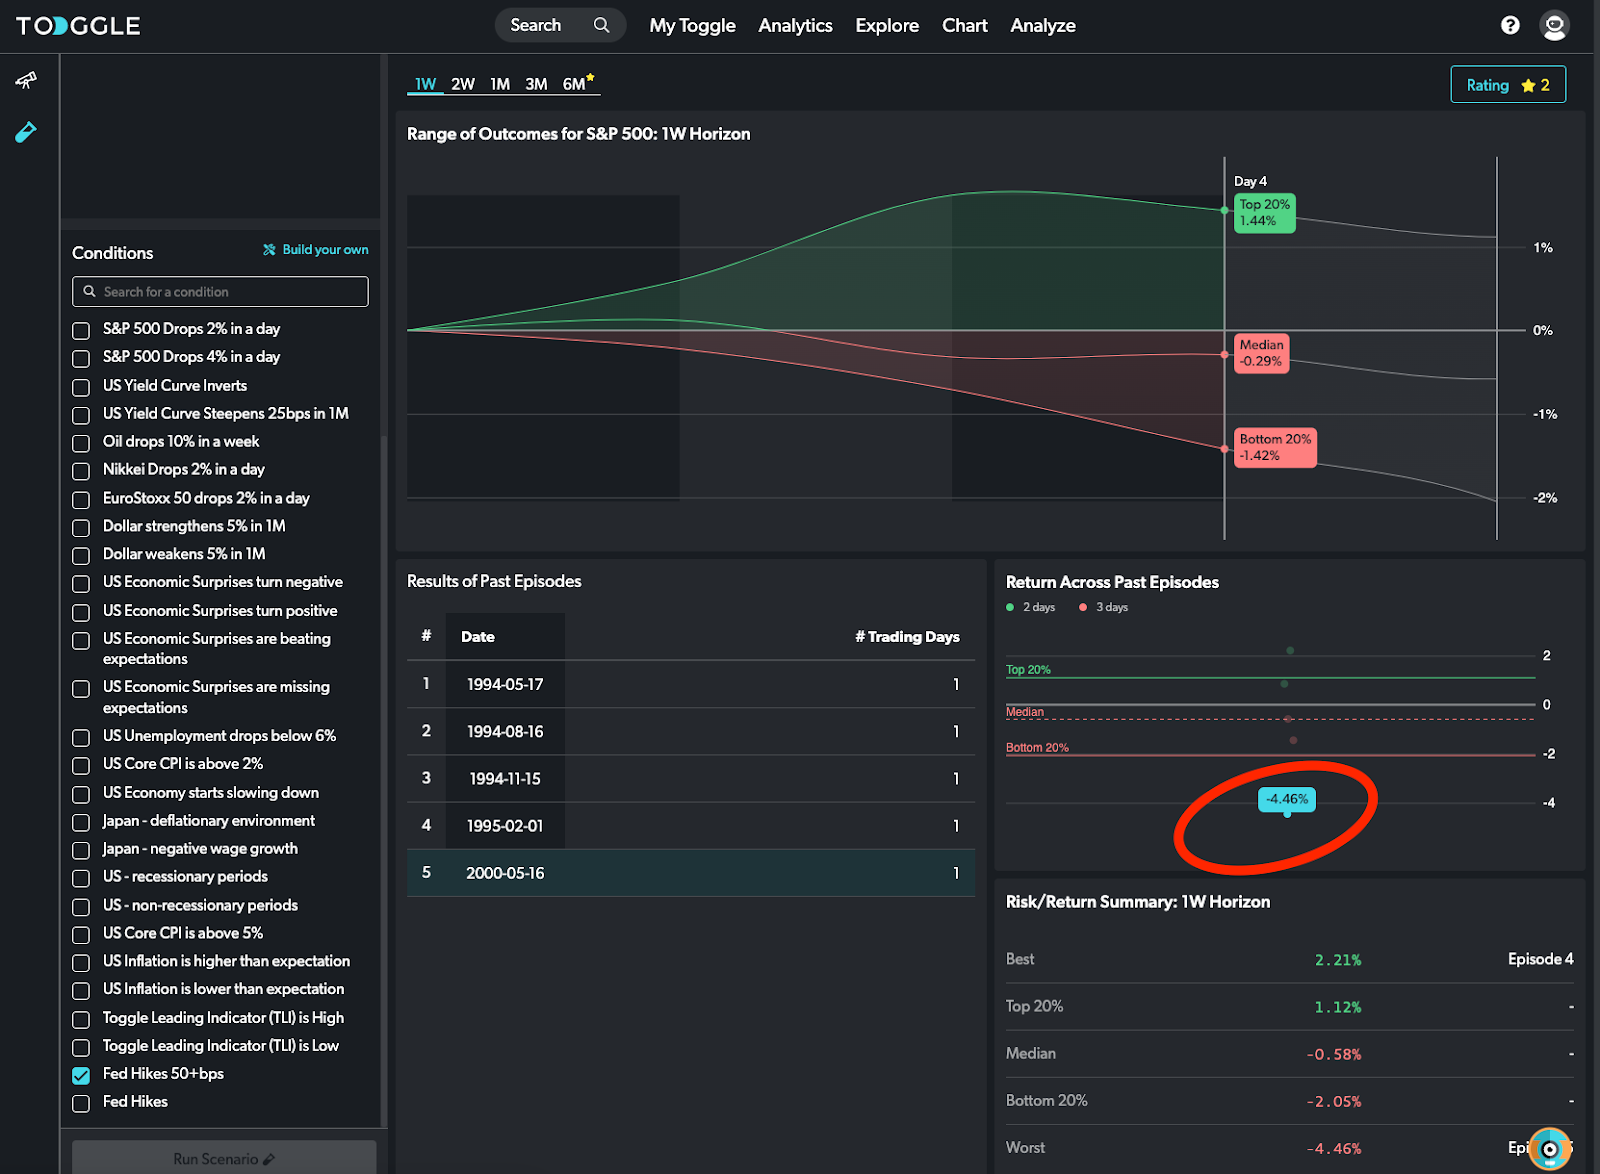
Toggle, which is an AI and machine learning research firm tracking 35,000 securities globally, sent us, yesterday, their post-Fed analysis. According to them, “during the first week after the Fed’s 50 bps hike markets broadly headed lower.”
“In fact, 1 in 5 times the drop reached more than 5%.”
Graphic: Via Toggle.
The firm’s CEO and founder – Jan Szilagyi – said, in response to the market action that “market bulls should root for stocks to go down first.”
That’s actually a powerful statement. For markets to break (rally), they sometimes need to rally (break). Said another way, at times the market is stretched. Sellers (buyers) are either too short (or too long), if we will.
In order to trade lower, for instance, that short inventory (which in and of itself is a support mechanism as it is a bunch of buy orders sitting at lower prices) must be cleared (i.e., covered).
After that support is removed, the market can succumb to whatever fundamental weaknesses it was trying to price in.
In this case, “the incremental effects on liquidity (QE/QT),” as Karsan says.
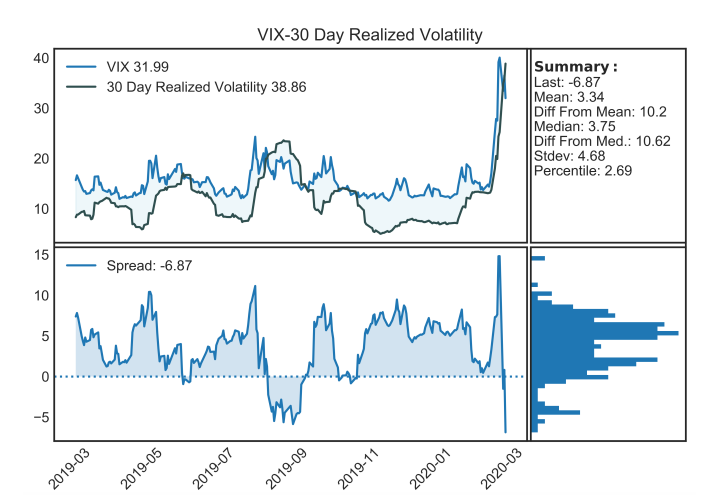
Moreover, what’s interesting, and this is something others have picked up on, is the difference between the level of volatility that is realized and implied by activity in the derivatives market.
Another time we saw such divergences was during the 2020 Coronacrisis sell-off.
Graphic: Via @HalfersPower. On March 2, 2020, “VIX-30 day realized vol go from 99 percentile yesterday to inverted and 9 percentile today lol. (left vs. right).
Let’s unpack. So, the Cboe Volatility Index (INDEX: VIX), as described by Cboe Global Markets Inc (BATS: CBOE), is a “constant, 30-day expected volatility of the U.S. stock market, derived from real-time, mid-quote prices of S&P 500 Index (INDEX: SPX) call and put options.”
Essentially, to make it simple, VIX is the equity market’s pricing of risk or insurance and it has a strong inverse relationship with the SPX. If SPX is lower, the VIX higher, basically.
Then, just as we have metrics to measure the change in an option’s sensitivity to the underlying direction (delta) or gamma, we have the sensitivity of an option to changes in volatility (vega) or volga.
Volga has different names. Vomma. The convexity of vega (i.e., change in vega based on change in volatility implied by market participants’ activity). The volatility of volatility. And so on.
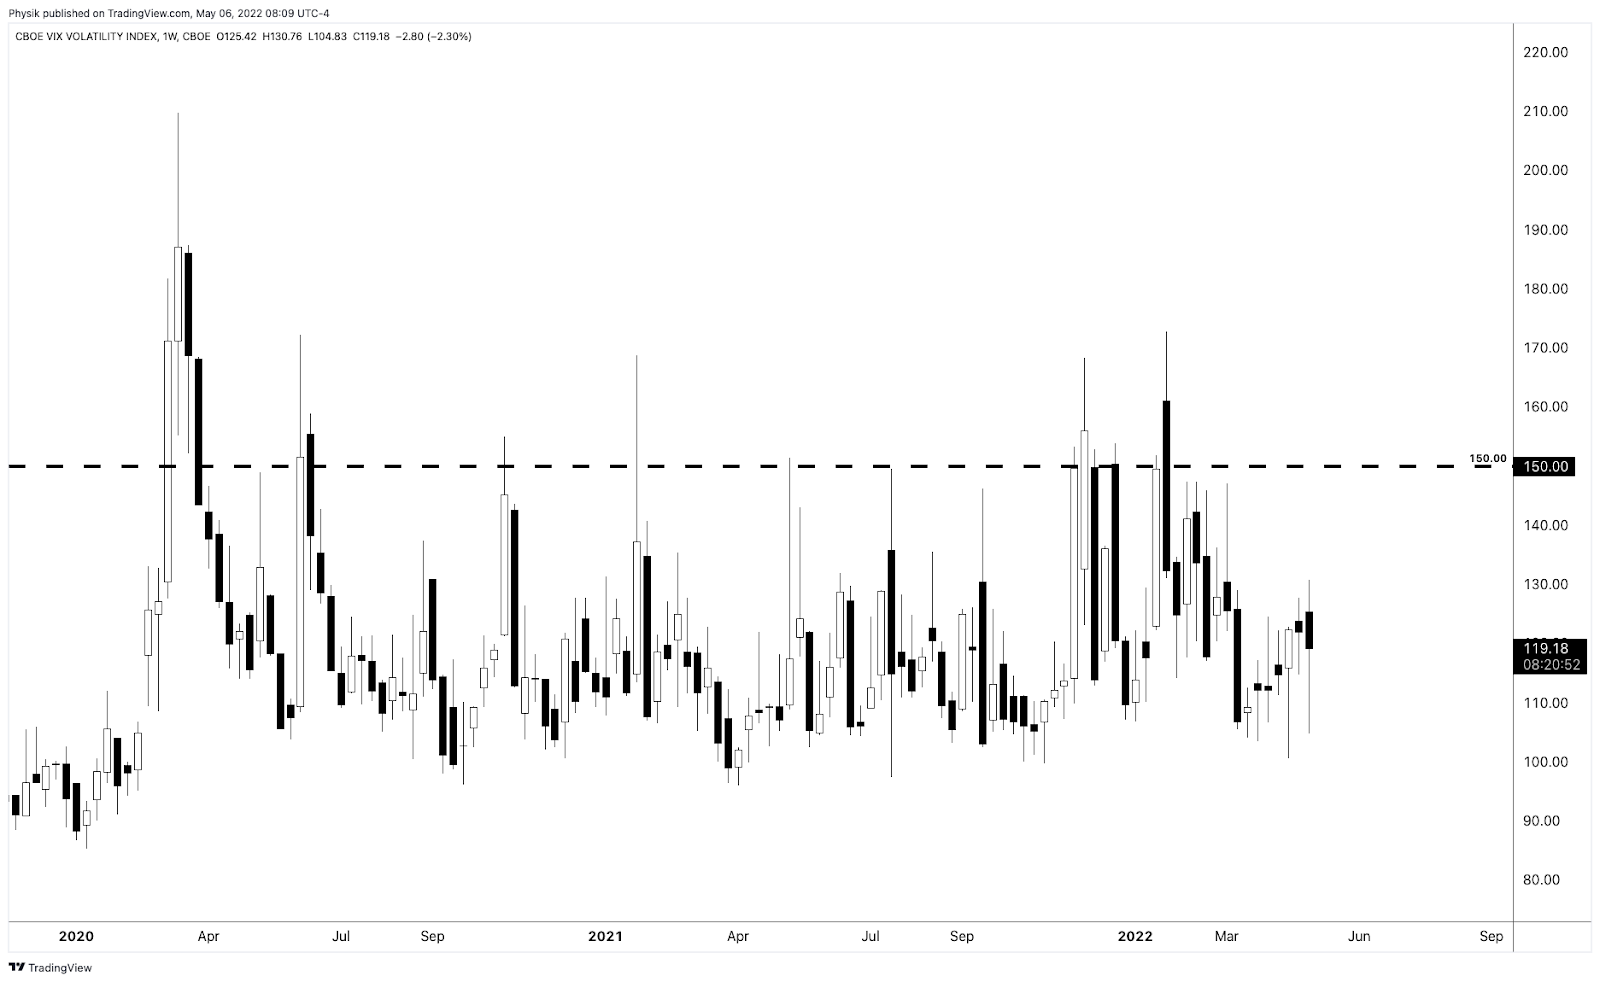
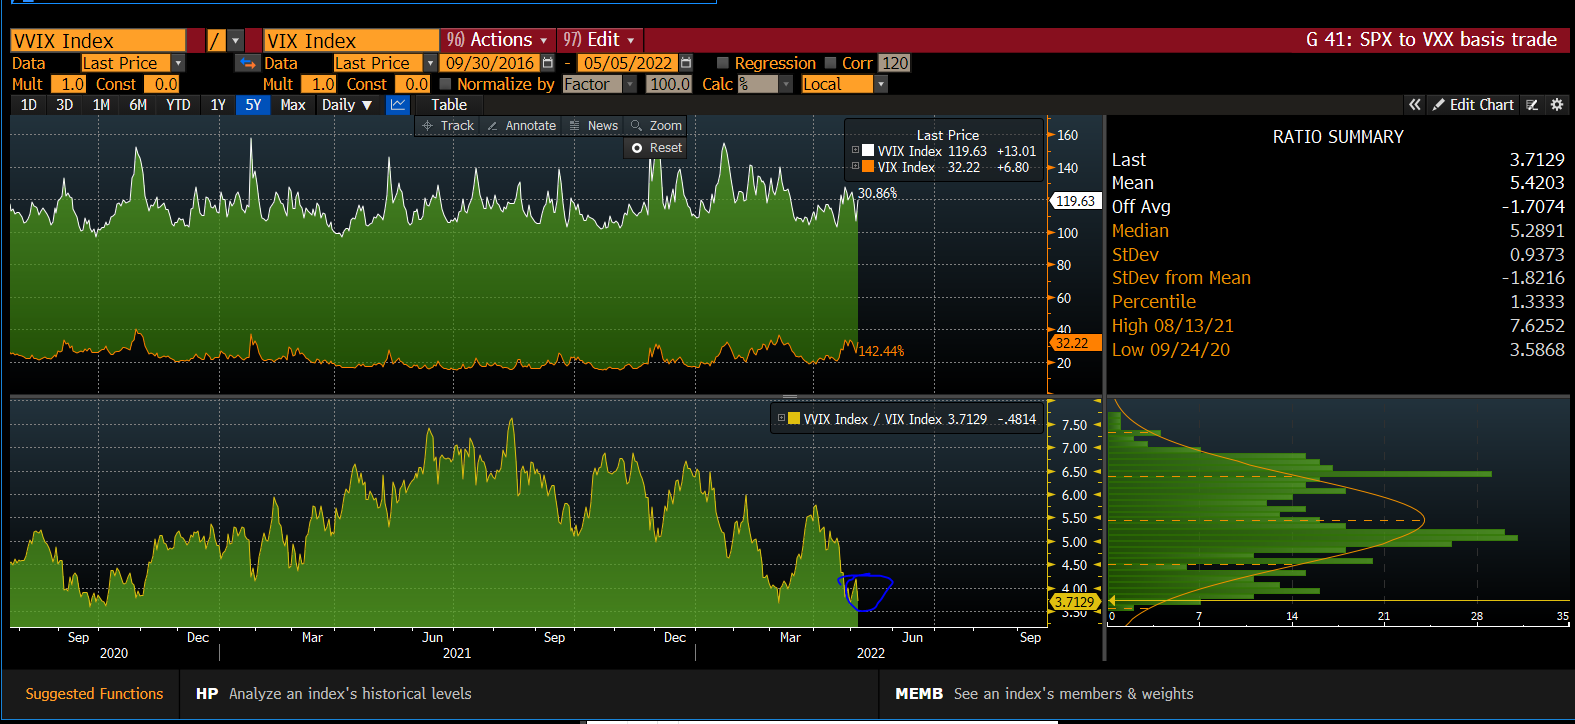
The volatility of volatility can naively be measured through the Cboe VVIX Index (INDEX: VVIX) which, according to Cboe, “represents a volatility of volatility in the sense that it measures the expected volatility of the 30-day forward price of VIX.”
Historically, the gauge has a mean somewhere beneath 100 and a high correlation with the VIX at times of heightened stress (e.g., Coronacrisis).
Graphic: The VVIX via Physik Invest.
What’s going on is there is really negative sentiment and emotion, both of which are playing into market weaknesses and realized volatility. However, that realized volatility is not priced in.
In other words, the volatility of volatility – VVIX – is low relative to the volatility realized (and implied) and that, as I take it, essentially means that the market is not pricing up protection.
Graphic: Via The Ambrus Group’s Kris Sidial. “Trotting out the good old VVIX/VIX (trader heuristic) to compare SPX skew to VIX Vol. Negative sentiment but lack of fear continues.”
Why does this matter? Well, when you think there is to be an outsized move, relative to what is priced, you buy options (positive exposure to gamma) so that you may have gains that are potentially amplified in case of directional movement.
You also buy can buy options for positive exposure to volga. This is so that you may have gains that are potentially amplified in case of movement (repricing) in implied volatility.
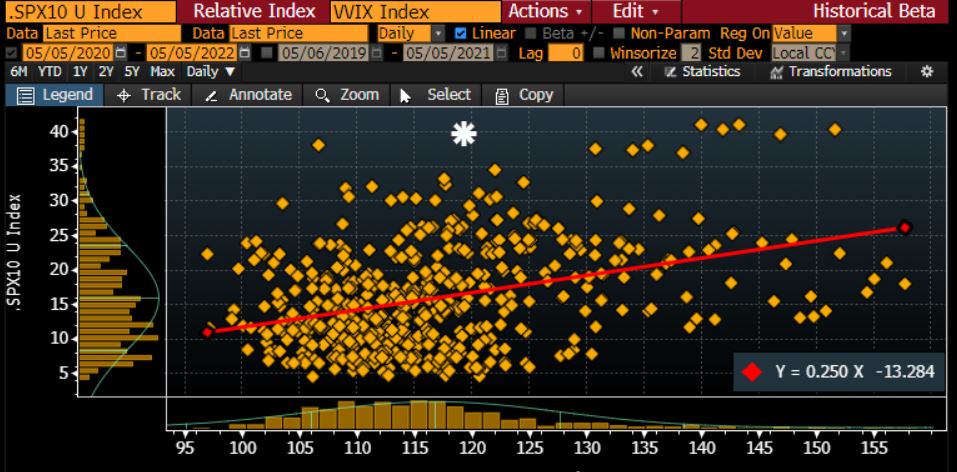
Graphic: Via @Alpha_Ex_LLC. “Here’s 10-day realized vs VVIX on a scatter. The ‘white star’ is 40 realized but only 117 VVIX. When realized this high, VVIX typically closer to 150.”
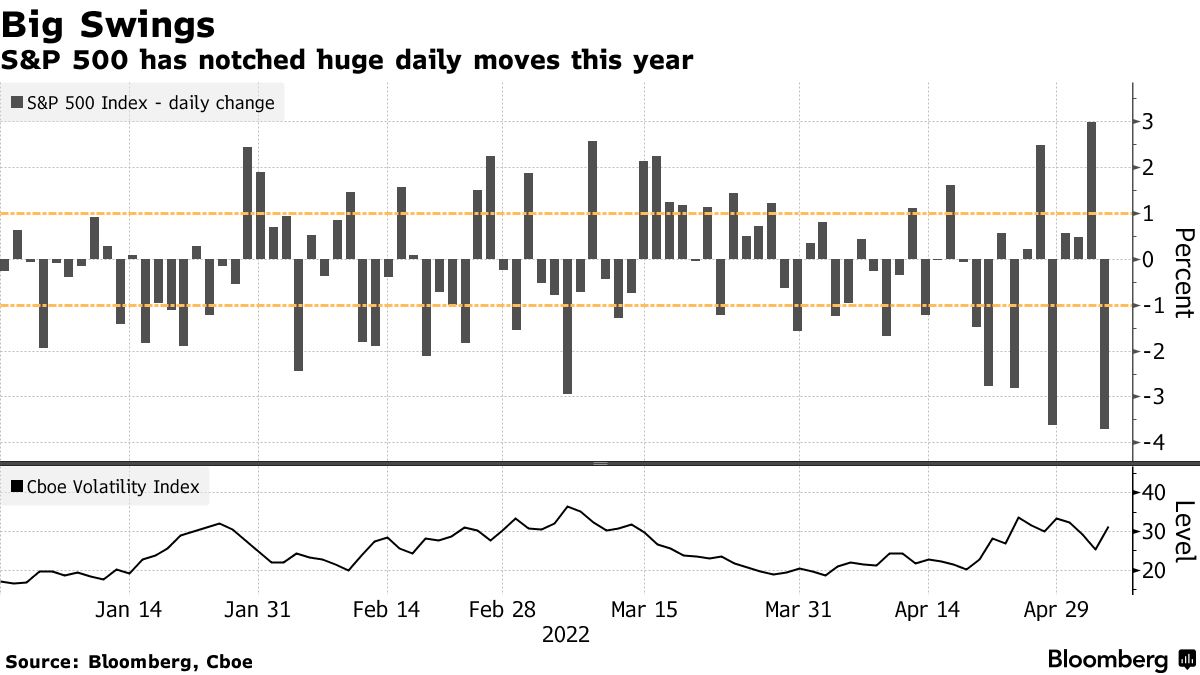
With back-to-back daily price changes sometimes in excess of 2%, this essentially suggests to us the potential for the pricing of equity market risk to “catch up.”
Graphic: Via Bloomberg. The realized volatility for the SPX versus the VIX.
Per SpotGamma, much of this has to do with market participants being “well-hedged.”
“From an options perspective, participants would have to demand en masse protection (buy puts, sell calls) for liquidity providers to further take from market liquidity (sell into weakness) and that volatility skew to, essentially, blowout (e.g., Corona crisis, Meme mania, and the like).”
The Ambrus Group’s Kris Sidial, who felt that the liquidation was likely large desks de-risking their book, explains, well, too:
“Vol is mainly used as a source of hedging. We are coming off of a big FOMC meeting where vol was slightly elevated. Think about this for a second, although SPX had a nasty day today, we are still right where we were at Tuesday… what does that tell you?”
“That means there wasn’t really a NEED to rehedge that same exposure. Volatility didn’t compress much after FOMC and when the market gave it all back it brought us right back to where we started. Put yourself in the shoes of an institution.”
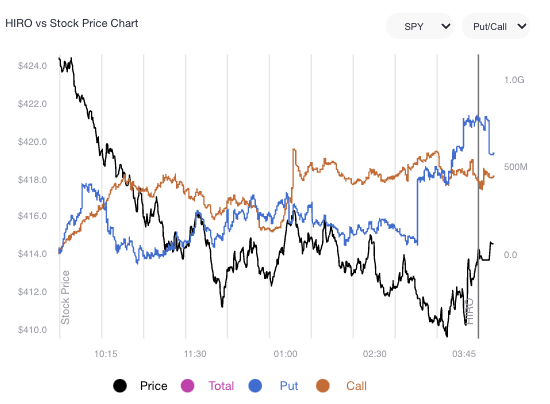
Graphic: SpotGamma’s Hedging Impact of Real-Time Options Indicator (HIRO) for SPY shows light put selling and call buying. Participants are (likely) hedged and are not demanding protection in size amid lower prices.
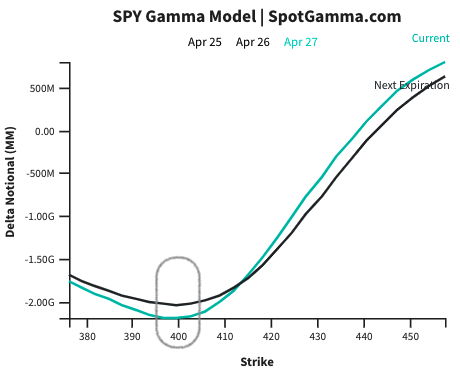
Pursuant to those remarks, SpotGamma sees markets reaching a lower limit near the $4,000.00 SPX area. At that juncture, the rate at which liquidity providers add pressure in their hedging activities flattens as they, too, have hedges.
Graphic: Via SpotGamma. Updated April 27, 2022.
“In turn, dealers may be able to advantageously reduce delta hedging (sell less), and supply markets with more liquidity (buy more stock). This could serve to reduce volatility.”
So, what do you do with this information? The idea is that volatility implied may reprice to reflect what is realized. In such a case, you’d want positive exposure to volga (i.e., don’t sell volatility).
This is more of a view on volatility rather than direction, at this juncture.
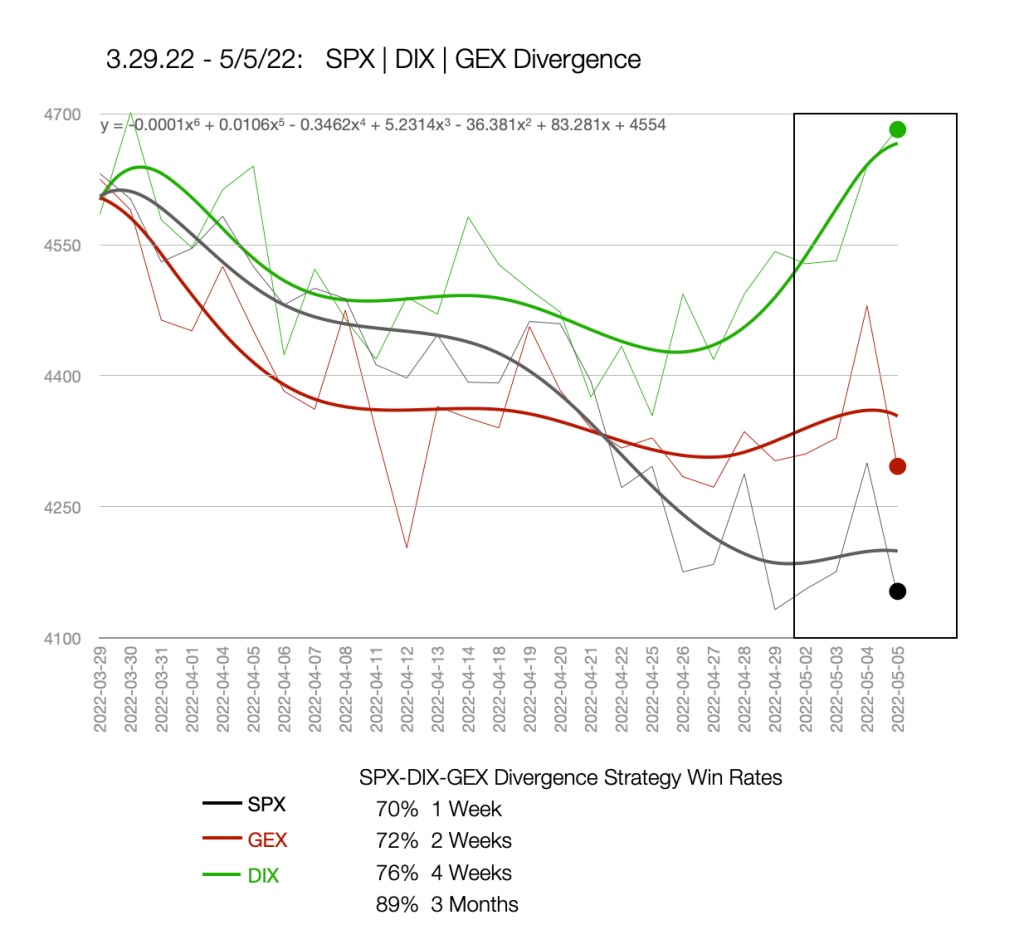
Directionally speaking, the returns distribution is skewed positive. This is from an overlay of proxies for buying and naive gamma exposure.
Here’s one model using similar data we often look at in this letter.
Graphic: Via nextSignals. “When SPX and [gamma exposure] nosedive after an extended selloff while dark pools’ buying sharply diverges to the upside … buy the S&P 500.”
Technical: As of 6:45 AM ET, Friday’s regular session (9:30 AM – 4:00 PM ET), in the S&P 500, will likely open in the middle part of a negatively skewed overnight inventory, inside of prior-range and -value, suggesting a limited potential for immediate directional opportunity.
In the best case, the S&P 500 trades higher; activity above the $4,148.25 high volume area (HVNode) puts in play the $4,184.25 HVNode. Initiative trade beyond the $4,184.25 HVNode could reach as high as the $4,212.25 micro composite point of control (MCPOC) and $4,303.00 weak high (obvious breakout level), or higher.
In the worst case, the S&P 500 trades lower; activity below the $4,148.25 HVNode puts in play the $4,099.25 regular trade low (RTH Low). Initiative trade beyond the RTH Low could reach as low as the $4,055.75 low volume area (LVNode) and $3,978.50 LVNode, or lower.
Click here to load today’s key levels into the web-based TradingView charting platform. Note that all levels are derived using the 65-minute timeframe. New links are produced, daily.
Graphic: 65-minute profile chart of the Micro E-mini S&P 500 Futures.
Definitions
Overnight Rally Highs (Lows): Typically, there is a low historical probability associated with overnight rally-highs (lows) ending the upside (downside) discovery process.
Volume Areas: A structurally sound market will build on areas of high volume (HVNodes). Should the market trend for long periods of time, it will lack sound structure, identified as low volume areas (LVNodes). LVNodes denote directional conviction and ought to offer support on any test.
If participants were to auction and find acceptance into areas of prior low volume (LVNodes), then future discovery ought to be volatile and quick as participants look to HVNodes for favorable entry or exit.
POCs: POCs are valuable as they denote areas where two-sided trade was most prevalent in a prior day session. Participants will respond to future tests of value as they offer favorable entry and exit.
Volume-Weighted Average Prices (VWAPs): A metric highly regarded by chief investment officers, among other participants, for quality of trade. Additionally, liquidity algorithms are benchmarked and programmed to buy and sell around VWAPs.
About
After years of self-education, strategy development, mentorship, and trial-and-error, Renato Leonard Capelj began trading full-time and founded Physik Invest to detail his methods, research, and performance in the markets.
Capelj also develops insights around impactful options market dynamics at SpotGamma and is a Benzinga reporter.
In no way should the materials herein be construed as advice. Derivatives carry a substantial risk of loss. All content is for informational purposes only.