Categories
Commentary

Daily Brief For April 18, 2023

LOAD LEVELS ON TRADINGVIEW BY CLICKING HERE.

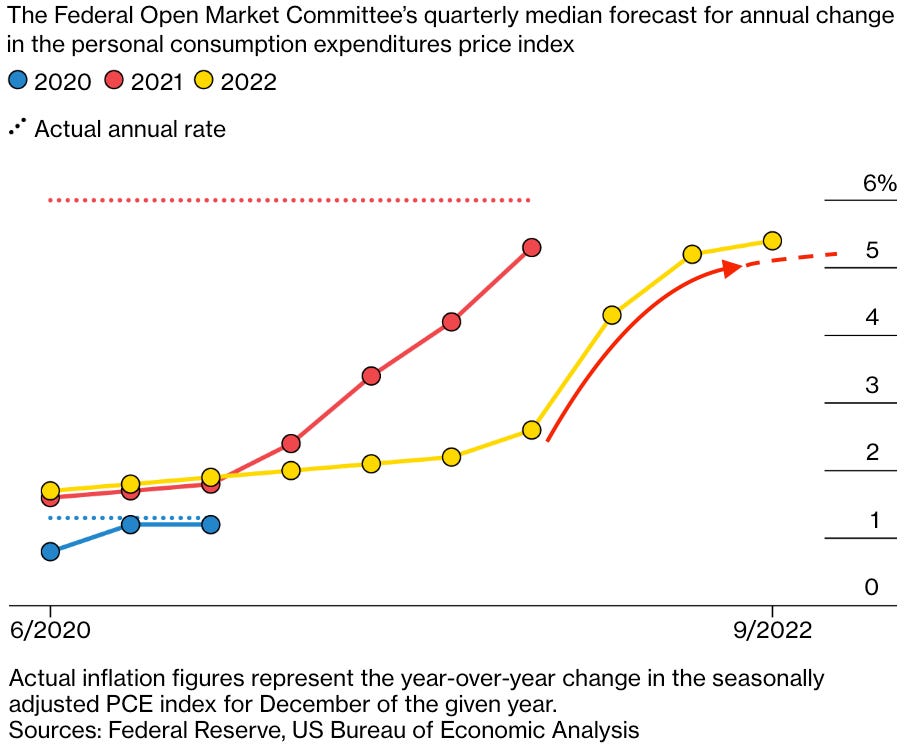
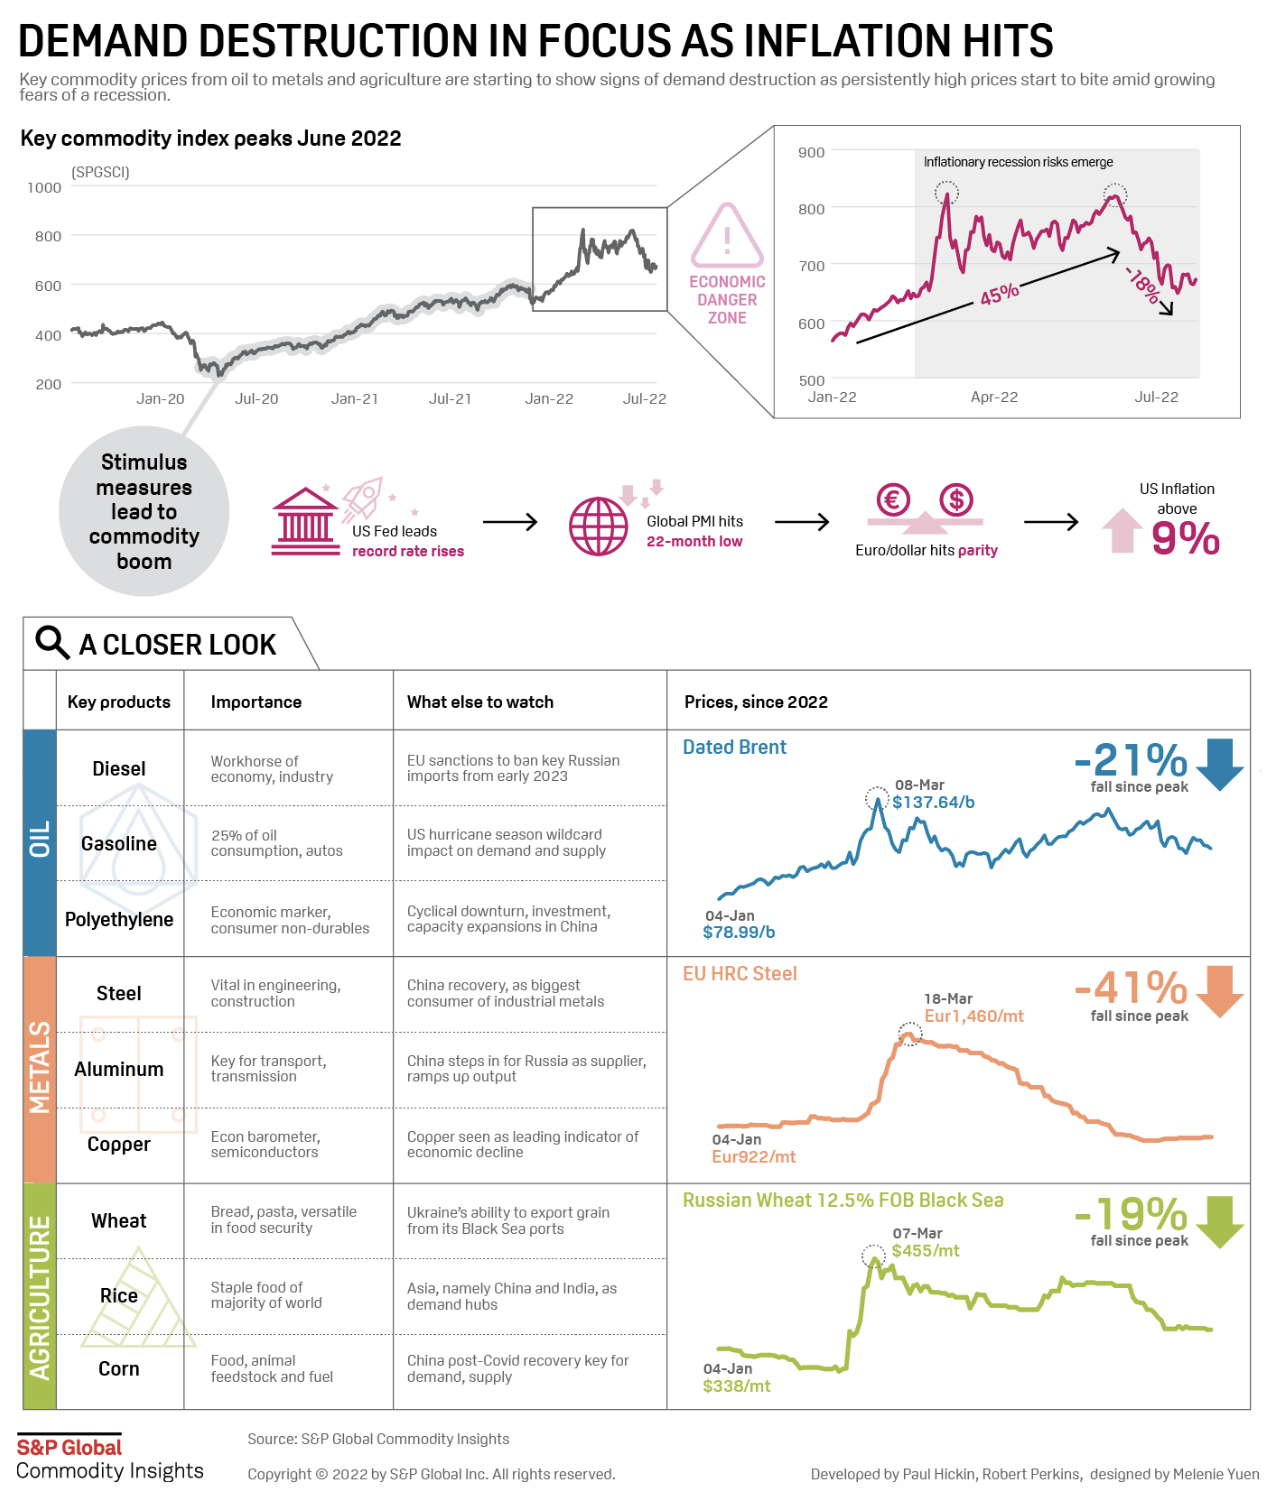
Bank of America Corporation (NYSE: BAC) sees allocations to equities versus bonds falling. That’s amid recession fears. Per EPB, “the cyclical economy has just started to shed jobs today, and leading indicators signal the recession is likely underway.”

“To get advanced warning of recessions, you must look at the construction and manufacturing sectors, even though these two sectors are only 13% of the labor market,” EPB adds, noting traditional indicators’ weakening predictability is not so great to ignore the insight. “It’s clear that the composition of traditional leading indicators remains appropriate, and thus, the current resounding recessionary signal should not be ignored.”

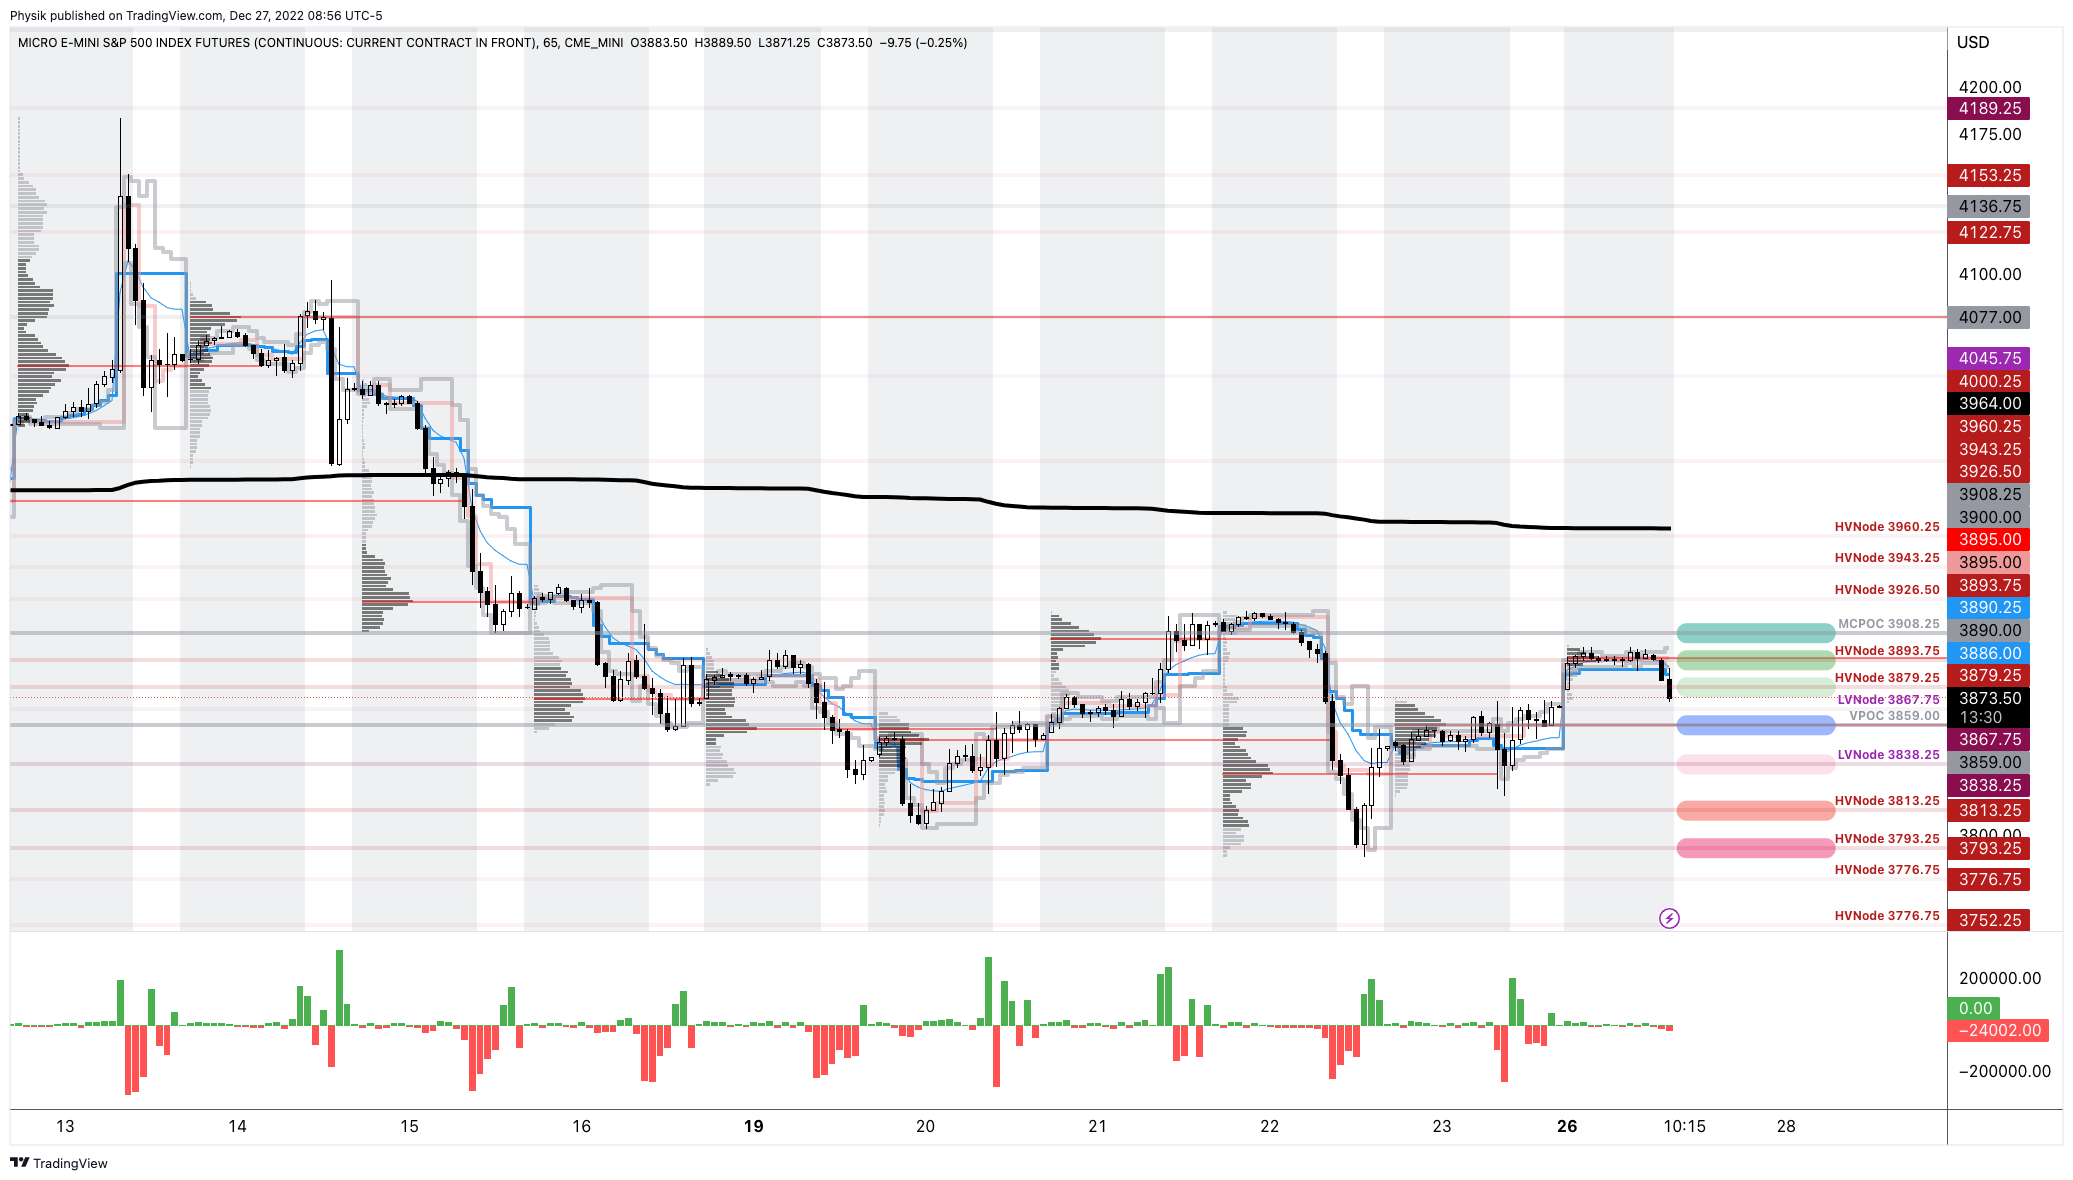
BAC strategist Michael Hartnett said, though, that this “consensus lust for recession” must soon be satisfied. Otherwise, the “pain trade” would be even higher yields and stocks; the S&P 500 (INDEX: SPX) is enjoying an accelerated rally which Jefferies Financial Group (NYSE: JEF) strategists think portends a period of flatness, now, over the coming weeks …

Graphic: Retrieved from Jefferies Financial Group (NYSE: JEF) via The Market Ear.

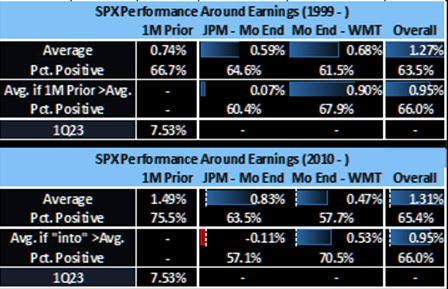
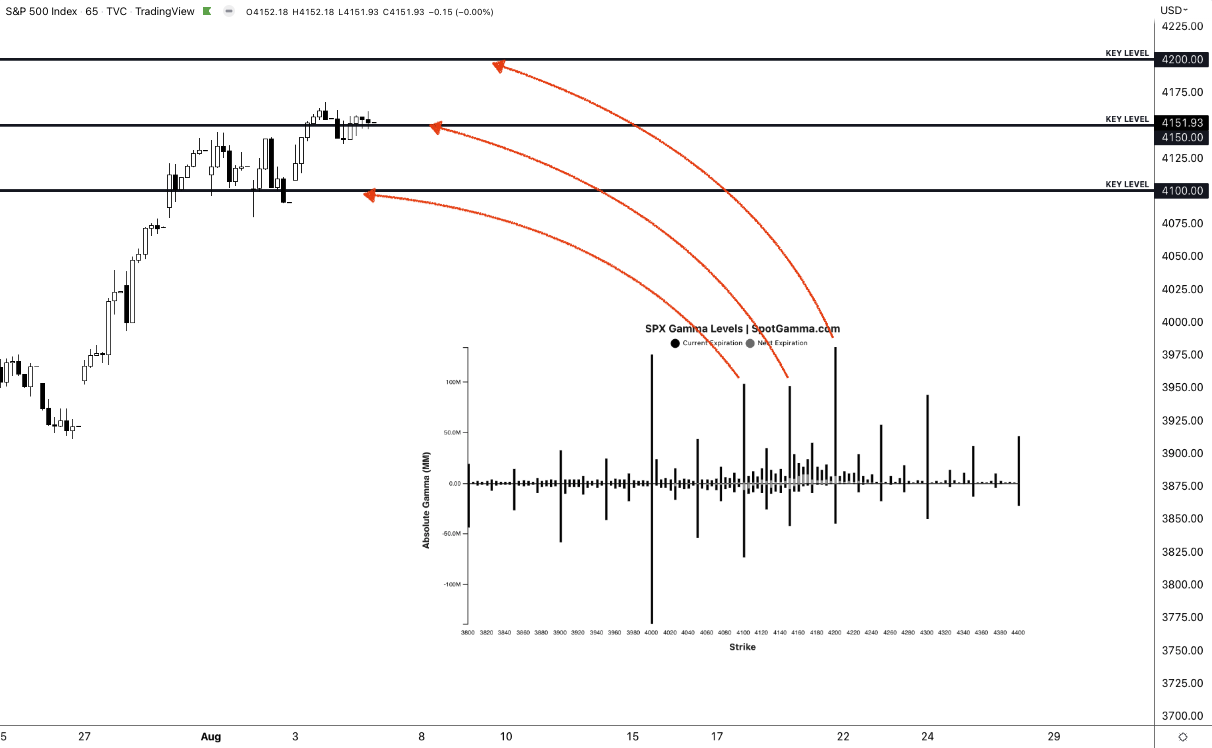
… and through options expiration (OpEx), typically a poor performance period for the SPX.

Displaying
Graphic: Retrieved from Tier1Alpha. 

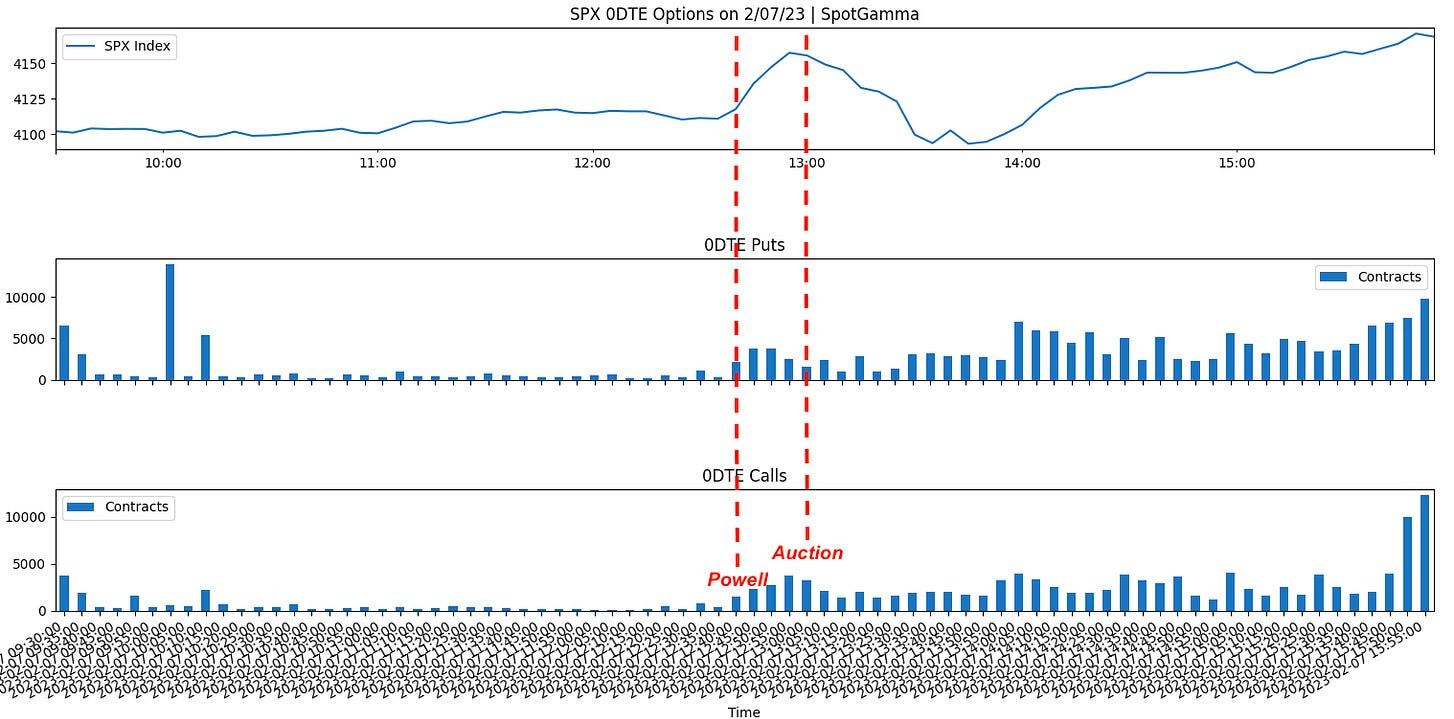
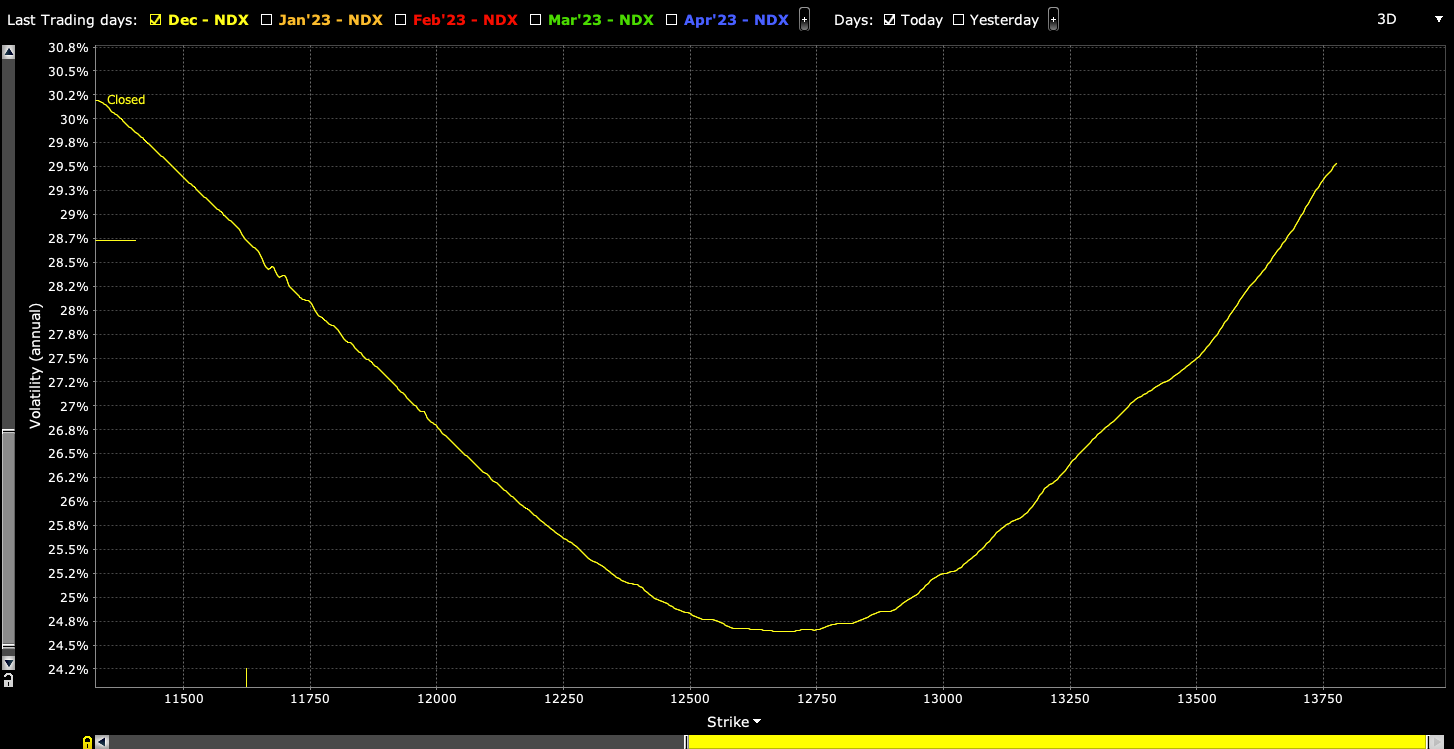
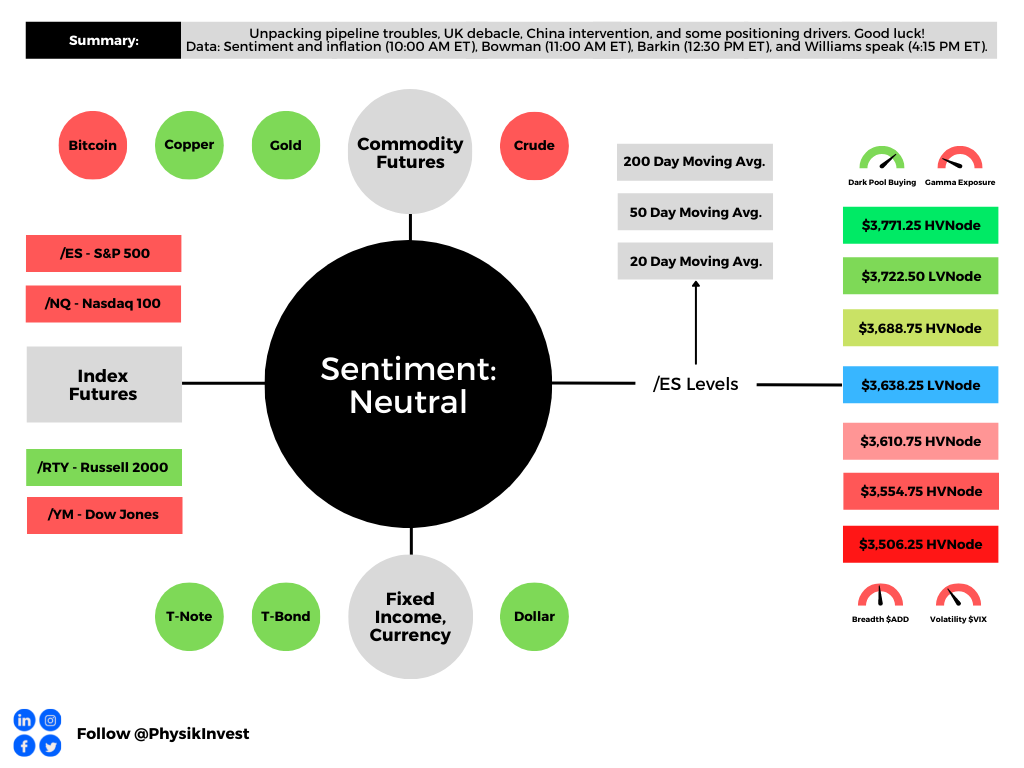
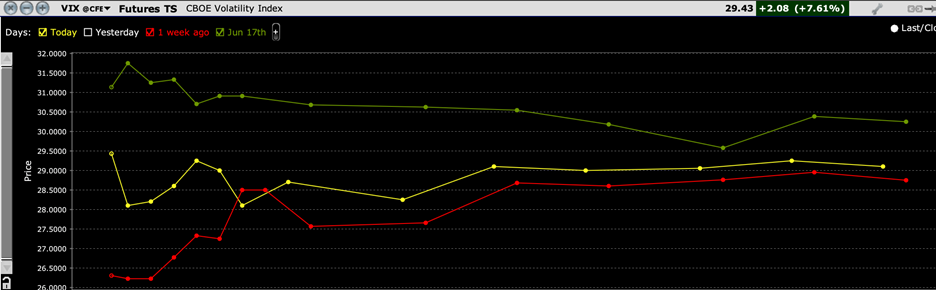
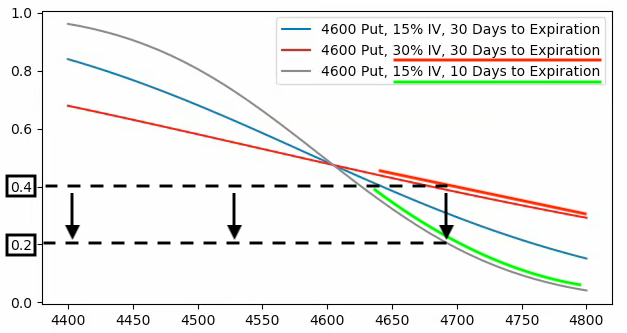
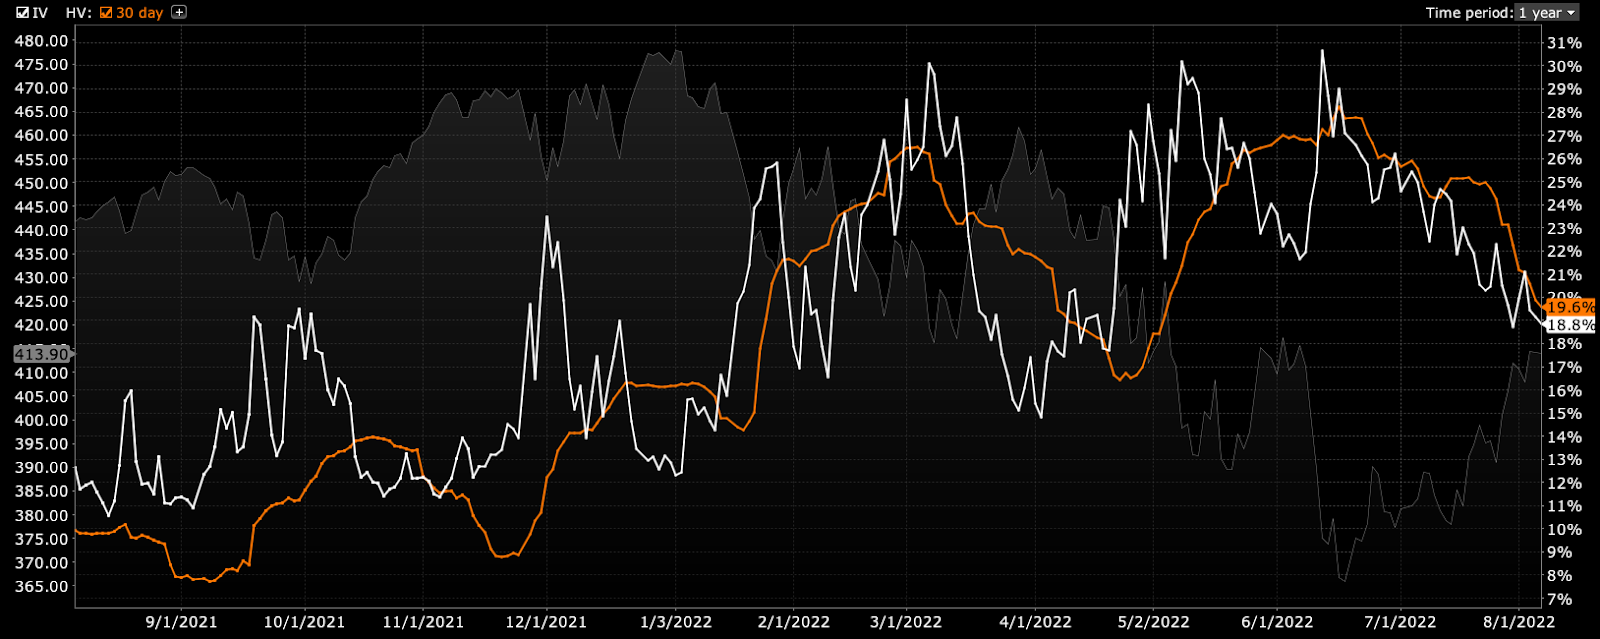
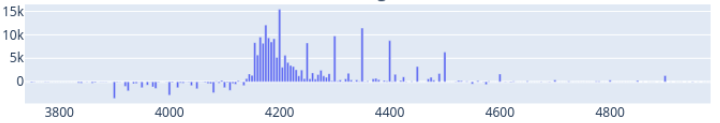
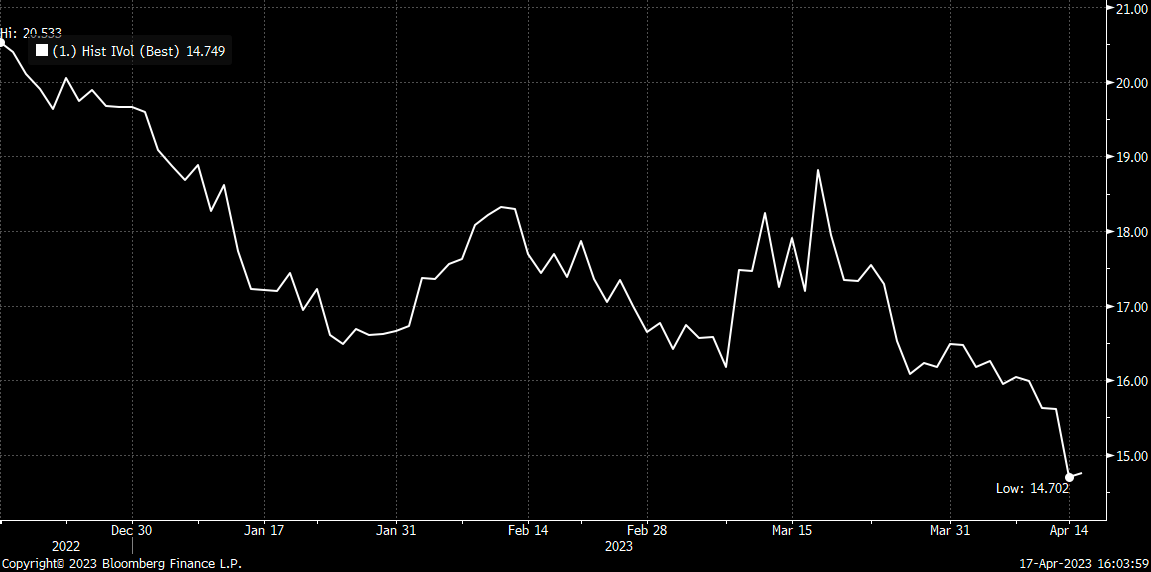
Beyond the uninspiring fundamentals, the positioning contexts are supportive. Recall our letters published earlier this year. If the market consolidated and failed to break substantially, then falling implied volatility (IVOL) and time passing would bolster markets and, potentially, help build a platform for a rally into mid-year. A check of fixed-strike and top-line measures of IVOL like the Cboe Volatility Index or VIX confirms options activities are keeping markets intact.

Graphic: Retrieved from Danny Kirsch of Piper Sandler (NYSE: PIPR). “SPX May $4,150.00 call volatility, the lack of realized volatility weighing on the market. Volatility low, not cheap.”

Beyond the rotation into shorter-dated options, just one of the factors exacerbating the decimation of longer-dated volatility, traders’ consensus is that markets won’t move a lot and/or they don’t need to hedge over longer time horizons; traders want punchier exposure to realized volatility (RVOL), and that they can get through shorter-dated options that have more gamma (i.e., exposure to changes in movement), not vega (i.e., exposure to changes in implied volatility).

Graphic: Retrieved from Goldman Sachs Group Inc (NYSE: GS) via Bloomberg.

Consequently, counterparties may be less dangerous to accelerating movement in either direction; hence, the growing likelihood of a period of flatness.

Graphic: Retrieved from SpotGamma.

“Despite the collapse in the 1-month realized volatility, we suspect most vol control funds have scaled into using their longer-term realized vols, which by design, lead to less aggressive rebalancing flows,” Tier1Alpha says. “For example, the 3-month rVol, which is currently driving our model, was essentially unchanged yesterday, which means volatility targets were maintained, and very little additional rebalancing had to occur. So even with the decline in the 1-month vol, overall risk exposure remained the same.”

With IVOL at a lower bound, the bullish impacts yielded by its compressing have largely played out. There may be more to be gained by movements higher in IVOL, in addition to the expiry of many call options this OpEx. By owning protection, particularly far from current prices, you are positioned to monetize on the market downside and non-linear repricings of volatility, as this letter has discussed in recent history. The caveat is that volatility can cluster and revert for longer; hence, your structure matters.

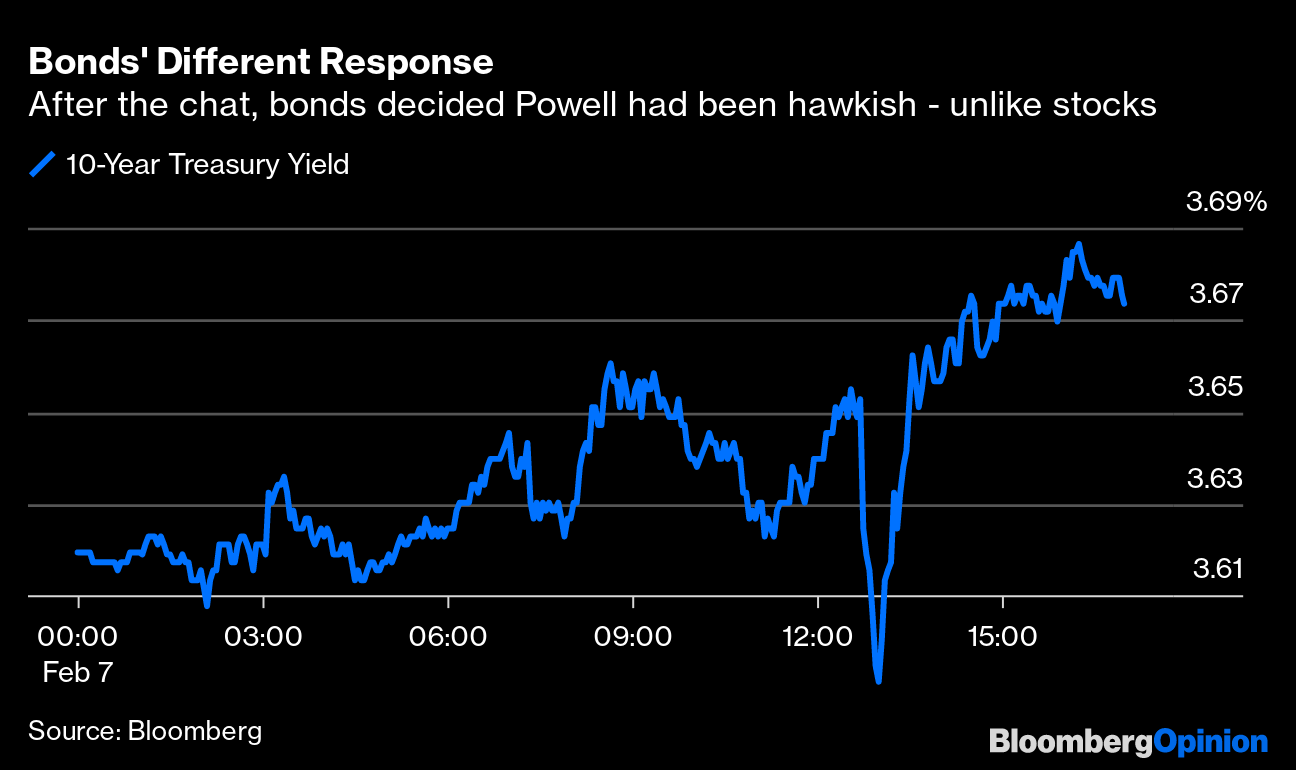
“I am concerned that VIX is underpricing the series of events that we know to expect over the coming weeks,” says Interactive Brokers Group Inc’s (NASDAQ: IBKR) Steve Sosnick. “While there is now an 88% implied likelihood of a 25 basis point hike, the likely path of any potential future hikes and assumed cuts should be more clarified at the meeting and in its aftermath.  And oh, has anyone ever heard the expression “sell in May and go away?”

Graphic: Retrieved from Interactive Brokers Group Inc (NASDAQ: IBKR).

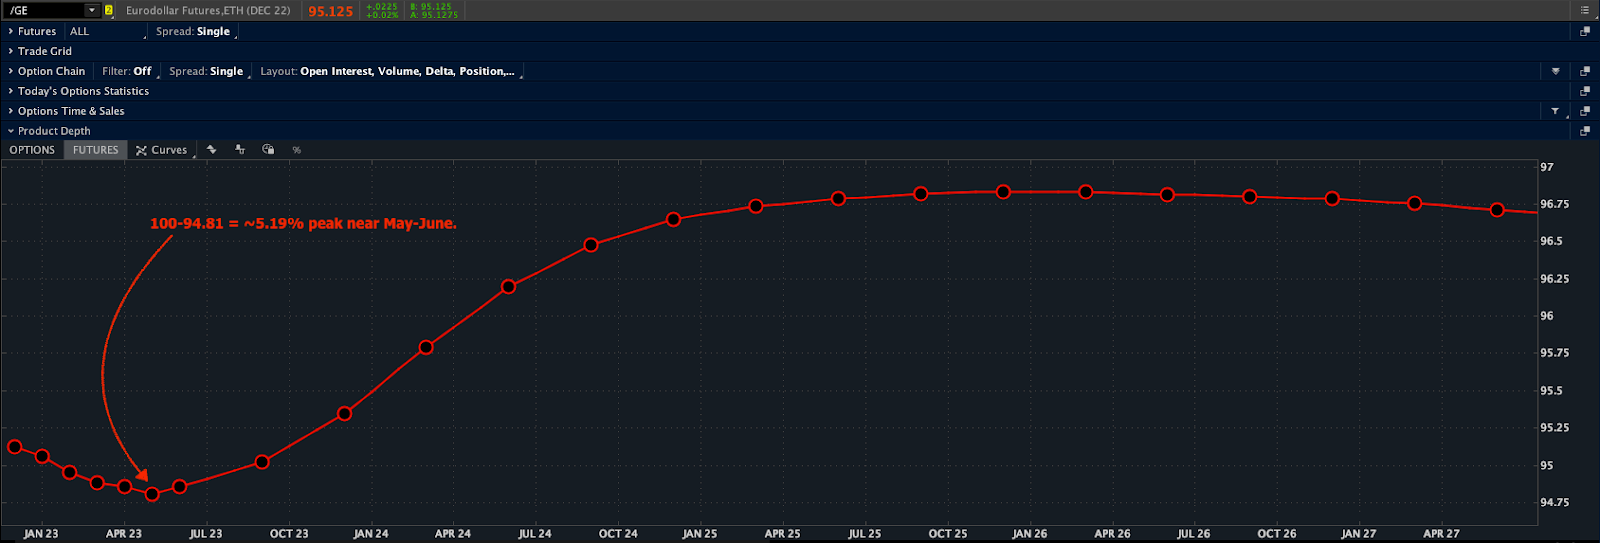
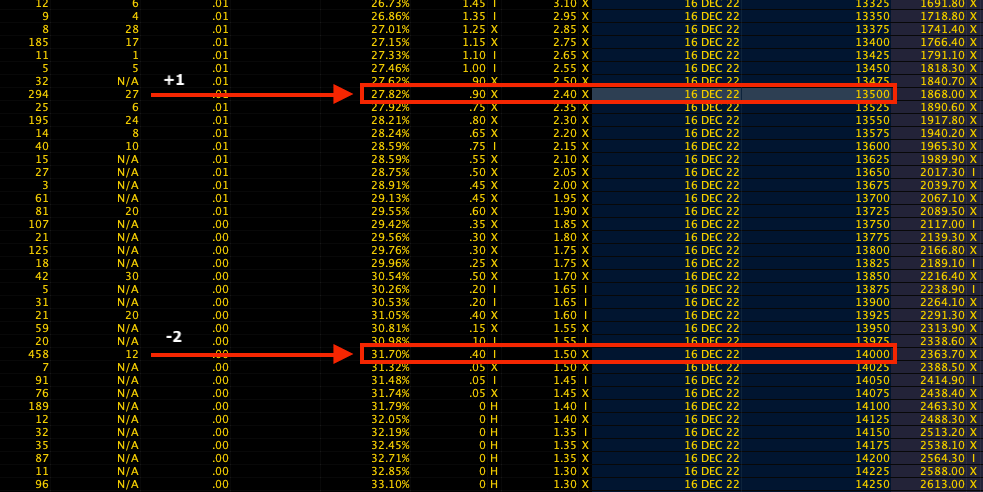
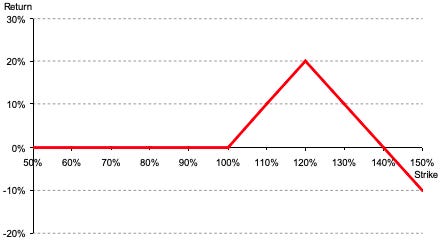
With call skews far up meaningfully steep in some products, still-present low- and zero-cost call structures this letter has talked about in the past remain attractive. If the market falls apart, your costs are low, and losses are minimal. If markets move higher into a “more combustible” position, wherein “volatility is sticky into a rally,” you may monetize your call structures and roll some of those profits into bear put spreads (i.e., buy put and sell another at a lower strike). An alternative option is neutral. Own something such as a T-bill or box spread (i.e., buy call and sell put at one strike and sell call and buy put at another higher strike). Some boxes are yielding upwards of 5.4% as of yesterday’s close.

To end, though the short-dated options activity may prompt cascading events in market downturns, the main issue is the reduced use of longer-dated options; a supply and demand imbalance likely resolves itself with an implied volatility repricing of a great size where longer-dated options outperform those that are shorter-dated.

Our locking in of rates or using the profits of call structures to position for a potential IVOL repricing, particularly in the back half of the year when dealer positioning is less clear, buybacks are to fall off of a cliff, rates may fall, and the boost from short-covering has played its course, is an attractive proposition given the context.

Graphic: Retrieved from Bloomberg. “The S&P 500 (white line) is well above its levels from early March, while the yield on the 3m-2y spread remains in a deep inversion, signifying meaningful expectations of cuts in the months ahead.”

About

Welcome to the Daily Brief by Physik Invest, a soon-to-launch research, consulting, trading, and asset management solutions provider. Learn about our origin story here, and consider subscribing for daily updates on the critical contexts that could lend to future market movement.

Separately, please don’t use this free letter as advice; all content is for informational purposes, and derivatives carry a substantial risk of loss. At this time, Capelj and Physik Invest, non-professional advisors, will never solicit others for capital or collect fees and disbursements. Separately, you may view this letter’s content calendar at this link.

Categories
Commentary

Daily Brief For March 6, 2023

Physik Invest’s Daily Brief is read free by thousands of subscribers. Join this community to learn about the fundamental and technical drivers of markets.

Graphic updated 7:30 AM ET. Sentiment Neutral if expected /MES open is inside of the prior day’s range. /MES levels are derived from the profile graphic at the bottom of this letter. Click here for the latest levels. SqueezeMetrics Dark Pool Index (DIX) and Gamma (GEX) with the latter calculated based on where the prior day’s reading falls with respect to the MAX and MIN of all occurrences available. A higher DIX is bullish. The lower the GEX, the more (expected) volatility. Click to learn the implications of volatility, direction, and moneyness. Breadth reflects a reading of the prior day’s NYSE Advance/Decline indicator. The CBOE VIX Volatility Index (INDEX: VVIX) reflects the attractiveness of owning volatility. UMBS prices via MNDClick here for the economic calendar.

Administrative

A brief letter today. In the next sessions, this letter will publish an exclusive first look at comments from this letter writer’s recent chat with Simplify Asset Management’s Michael Green for a Benzinga article.

Moreover, in a summary of last week’s comments, the economy is on a solid footing and this provides the context for a longer-lasting and, potentially, more aggressive tightening cycle. Notwithstanding, “stocks can ignore bonds for extended periods of time,” says Interactive Brokers’ (NASDAQ: IBKR) Steve Sosnick who thinks investors have sufficiently de-risked and, consequently, “they may not feel compelled to sell more stocks or clamor for protection.”

With less risk, traders may not need as much protection as well, hence low(er) implied volatility (IVOL) via measures including the Cboe Volatility Index (INDEX: VIX). Sosnick adds that “the ‘pain trade’ might be to the upside; institutional investors are highly susceptible to FOMO, especially if they are underweight.”

Interested in how to participate in this volatile market? In the Daily Brief for March 3, we talked about big macro and positioning themes such as 0 DTE, as well as how to cut your downside and have more efficient exposure to the upside. Have a great day!

Technical

As of 7:30 AM ET, Monday’s regular session (9:30 AM – 4:00 PM ET), in the S&P 500, is likely to open in the mid-to-lower part of a balanced overnight inventory, inside of the prior day’s range, suggesting a limited potential for immediate directional opportunity.

The S&P 500 pivot for today is $4,052.25. 

Key levels to the upside include $4,059.25, $4,071.75, and $4,082.75.

Key levels to the downside include $4,045.25, $4,032.75, and $4,024.75.

Disclaimer: Click here to load the updated key levels via the web-based TradingView platform. New links are produced daily. Quoted levels likely hold barring an exogenous development.

Graphic: 65-minute profile chart of the Micro E-mini S&P 500 Futures.

Definitions

Volume Areas: Markets will build on areas of high-volume (HVNodes). Should the market trend for a period of time, this will be identified by a low-volume area (LVNodes). The LVNodes denote directional conviction and ought to offer support on any test.

If participants auction and find acceptance in an area of a prior LVNode, then future discovery ought to be volatile and quick as participants look to the nearest HVNodes for more favorable entry or exit.


About

The author, Renato Leonard Capelj, spends the bulk of his time at Physik Invest, an entity through which he invests and publishes free daily analyses to thousands of subscribers. The analyses offer him and his subscribers a way to stay on the right side of the market. 

Separately, Capelj is an accredited journalist with past works including interviews with investor Kevin O’Leary, ARK Invest’s Catherine Wood, FTX’s Sam Bankman-Fried, North Dakota Governor Doug Burgum, Lithuania’s Minister of Economy and Innovation Aušrinė Armonaitė, former Cisco chairman and CEO John Chambers, and persons at the Clinton Global Initiative.

Connect

Direct queries to renato@physikinvest.com. Find Physik Invest on TwitterLinkedInFacebook, and Instagram. Find Capelj on TwitterLinkedIn, and Instagram. Only follow the verified profiles.

Calendar

You may view this letter’s content calendar at this link.

Disclaimer

Do not construe this newsletter as advice. All content is for informational purposes. Capelj and Physik Invest manage their own capital and will not solicit others for it.

Categories
Commentary

Daily Brief For February 8, 2023

Physik Invest’s Daily Brief is read by thousands of subscribers. You, too, can join this community to learn about the fundamental and technical drivers of markets.

Graphic updated 6:50 AM ET. Sentiment Neutral if expected /ES open is inside of the prior day’s range. /ES levels are derived from the profile graphic at the bottom of this letter. Click here for the latest levels. SqueezeMetrics Dark Pool Index (DIX) and Gamma (GEX) with the latter calculated based on where the prior day’s reading falls with respect to the MAX and MIN of all occurrences available. A higher DIX is bullish. At the same time, the lower the GEX, the more (expected) volatility. Click to learn the implications of volatility, direction, and moneyness. Breadth reflects a reading of the prior day’s NYSE Advance/Decline indicator. The CBOE VIX Volatility Index (INDEX: VVIX) reflects the attractiveness of owning volatility. Backed by popular demand, mortgage rates are rising; 30 Yr. Fixed ~6.45%.

Positioning

The S&P 500 (INDEX: SPX) closed higher yesterday despite the Federal Reserve’s (Fed) Jerome Powell warning rates would stay higher for longer.

According to an analysis by Interactive Brokers Group Inc’s (NASDAQ: IBKR), “it was clear that there were algos programmed to buy if [Powell] mentioned ‘disinflation.’ When [Powell] said the secret word, off we went.”

Graphic: Retrieved from Bloomberg. According to Bloomberg Economics’ Anna Wong, “The jobs surprise confirmed his message from the post-FOMC presser message that disinflation has barely begun and there’s still a long way to go. It seems clear he hasn’t shifted his views based on that gangbuster report alone.”

Implied volatility (IVOL) compression, as evidenced by shifts lower in the IVOL term structure and measures like the Cboe Volatility Index (INDEX: VIX) declining, was a booster, as was the trade of ultra-short-dated call options.

Graphic: Retrieved from SpotGamma on 2/7/2023. “[T]raders hit the bid after Powells “punt”. Stocks then violently flipped at 4165 (SPY 415) with heavy selling after a bad 1pm ET treasury action, only to go aggressively bid off of 4100 into end of day.”

SpotGamma’s HIRO indicator showed positive delta call buying and put selling. This indicator validates the belief that IVOL compression catalyzed a rally and that follow-on strength came from traders’ demand for call options. In instances of put selling and call buying, counterparties hedge by buying underlying stocks and futures.

One way to think about what’s going on is to recall that for options to keep their value, something unexpected has to happen. When nothing unexpected happens, from a trader’s perspective, what’s the value-add of continuing to own put options, for instance? So, you sell and pressure IVOL. Consequently, dealers, who are short puts declining in value, buy back some of their short stock and/or futures hedges, and this is supportive for the market.

Graphic: Retrieved from SpotGamma’s HIRO for the S&P 500 (INDEX: SPX) on 2/7/2023.

The bullish impact of this options activity, taken alone, is not long-lasting.

In the Daily Brief for February 3, 2023, we discussed the impact of this activity, all else equal; as time passes and/or volatility falls, the counterparties’ reaction to long call options, for example, declining in value is to sell some of the stock and futures they own as hedges. This can resist traders’ attempts to explore higher prices.

To close, it continues to make sense to position in structures that take advantage of still low longer-dated S&P 500 (INDEX: SPX) IVOL. For instance, traders can consider selling rich call verticals to finance put verticals expiring months from now.

In our recent commentaries, we reasoned why such structures are priced the way they are. Should market pressures surface, that’s a simple way to protect profits.

Technical

As of 6:50 AM ET, Wednesday’s regular session (9:30 AM – 4:00 PM ET), in the S&P 500, is likely to open in the lower part of a balanced overnight inventory, inside of the prior day’s range, suggesting a limited potential for immediate directional opportunity.

The S&P 500 pivot for today is $4,153.25. 

Key levels to the upside include $4,168.75, $4,189.00, and $4,202.75.

Key levels to the downside include $4,136.25, $4,122.75, and $4,113.00.

Disclaimer: Click here to load the updated key levels via the web-based TradingView platform. New links are produced daily. Quoted levels likely hold barring an exogenous development.

Graphic: 65-minute profile chart of the Micro E-mini S&P 500 Futures.

Definitions

Volume Areas: Markets will build on areas of high-volume (HVNodes). Should the market trend for a period of time, this will be identified by a low-volume area (LVNodes). The LVNodes denote directional conviction and ought to offer support on any test.

If participants auction and find acceptance in an area of a prior LVNode, then future discovery ought to be volatile and quick as participants look to the nearest HVNodes for more favorable entry or exit.

POCs: Areas where two-sided trade was most prevalent in a prior day session. Participants will respond to future tests of value as they offer favorable entry and exit.


About

The author, Renato Leonard Capelj, works in finance and journalism.

Capelj spends the bulk of his time at Physik Invest, an entity through which he invests and publishes free daily analyses to thousands of subscribers. The analyses offer him and his subscribers a way to stay on the right side of the market. Separately, Capelj is an options analyst at SpotGamma and an accredited journalist.

Capelj’s past works include conversations with investor Kevin O’Leary, ARK Invest’s Catherine Wood, FTX’s Sam Bankman-Fried, Lithuania’s Minister of Economy and Innovation Aušrinė Armonaitė, former Cisco chairman and CEO John Chambers, and persons at the Clinton Global Initiative.

Connect

Direct queries to renato@physikinvest.com or find Physik Invest on TwitterLinkedInFacebook, and Instagram.

Calendar

You may view this letter’s content calendar at this link.

Disclaimer

Do not construe this newsletter as advice. All content is for informational purposes.

Categories
Commentary

Daily Brief For December 27, 2022

Physik Invest’s Daily Brief is read by thousands of subscribers. You, too, can join this community to learn about the fundamental and technical drivers of markets.

Graphic updated 9:00 AM ET. Sentiment Neutral if expected /ES open is inside of the prior day’s range. /ES levels are derived from the profile graphic at the bottom of this letter. Levels may have changed since initially quoted; click here for the latest levels. SqueezeMetrics Dark Pool Index (DIX) and Gamma (GEX) with the latter calculated based on where the prior day’s reading falls with respect to the MAX and MIN of all occurrences available. A higher DIX is bullish. At the same time, the lower the GEX, the more (expected) volatility. Click to learn the implications of volatility, direction, and moneyness. Breadth reflects a reading of the prior day’s NYSE Advance/Decline indicator. VIX reflects a current reading of the CBOE Volatility Index (INDEX: VIX) from 0-100.

Administrative

On December 23, 2022, issued was an in-depth trade recap. Check it out here. Adding, in that recap, shortly after release, your letter writer found he made a mistake in the ~11th paragraph. The incorrect greeks were listed, and that issue has been fixed online. Apologies.

Fundamental

Last week, the Bank of Japan’s (BoJ) Governor Haruhiko Kuroda sparked a rise in the yen and a fall in domestic US bonds, potentially ahead of some policy normalization. 

Japanese government bond yields can rise 0.5% versus 0.25% after a change to the BoJ’s yield-curve control policy, a tool used to fight the persistent “stagnation,” per Andreas Steno Larsen’s letter.

“Whatever the BOJ calls this, it is a step toward an exit,” said Masamichi Adachi, chief Japan economist at UBS Group AG (NYSE: UBS) Securities. “This opens a door for a possible rate hike in 2023,” and no more negative interest rates.

This development is not that good for so-called carry trades, as Bloomberg explained, “in which investors borrow in cheaper currencies to finance purchases of higher-yielding peers,” or, even, equities and other risk assets.

Graphic: Retrieved from Japan Securities Clearing Corporation’s website. Who is getting the margin call? Those who may be leveraged short yields. Adding, per Interactive Brokers Group Inc (NASDAQ: IBKR), “those who had the carry trade on should be getting clobbered with the yen rising dramatically. It is now about 3.8% more expensive to pay back the borrowed yen.”

The yen was a popular funding currency. It may not be any longer if this “is the first step towards tightening,” wrote Brown Brothers Harriman strategists, though the BoJ said, yesterday, this was “definitely not a step toward an exit,” with Steno Larsen adding QE “actually increased by 25%.”

Though “higher yields at home [in Japan] could mean less investment” from Japan, Bloomberg said, US stock and bond flows after the news hit suggest the carry trade may not be as impactful, to add.

Graphic: Retrieved from Bloomberg. Equities’ “advantage over bonds” is slimming.

Some, like Steno Larsen, conclude concerns, albeit warranted, may be overblown; in mid-2023, global inflation pressures likely “fade[] sufficiently to allow BoJ to resume its dovish stance,” all the while on recession fears, a “Fed pause or pivot is ultimately what will bring the Japanese lifers and pension funds back to the US Treasury table and a reversal of the USDJPY trade.”

So what?

Liquidity, though appearing positive amid an “empty[ing of] the TGA (Treasury General Account) … ahead of the debt ceiling [cross]-over,” is on a downward trajectory into the second and third quarters, after which “a pivot from the Fed [prompts] … a disinflation rally.”

So, per Steno Larsen, markets go sideways to higher to start the year and, then, down. Therefore, favor “having some equity beta” heading into 2023.

Position in “sectors that can swallow a simultaneous drop in the ISM and CPI on a relative basis … [include] utilities, health care, and staples.”

Graphic: Retrieved from Andreas Steno Larsen. “New year’s liquidity looks positive before getting worse during Q2/Q3.”

Technical

As of 8:55 AM ET, Tuesday’s regular session (9:30 AM – 4:00 PM ET), in the S&P 500, is likely to open in the lower part of a balanced overnight inventory, just inside of the prior-range and -value, suggesting a limited potential for immediate directional opportunity.

Our S&P 500 pivot for today is $3,859.00. 

Key levels to the upside include $3,879.25, $3,893.75, and $3,908.25. 

Key levels to the downside include $3,838.25, $3,813.25, and $3,793.25.

Click here to load today’s key levels into the web-based TradingView platform. All levels are derived using the 65-minute timeframe. New links are produced, daily.

Graphic: 65-minute profile chart of the Micro E-mini S&P 500 Futures.

Definitions

Volume Areas: Markets will build on areas of high-volume (HVNodes). Should the market trend for long periods of time, it will be identified by low-volume areas (LVNodes). LVNodes denote directional conviction and ought to offer support on any test.

If participants auction and find acceptance in an area of a prior LVNode, then future discovery ought to be volatile and quick as participants look to HVNodes for favorable entry or exit.

POCs: Denote areas where two-sided trade was most prevalent in a prior day session. Participants will respond to future tests of value as they offer favorable entry and exit.

MCPOCs: Denote areas where two-sided trade was most prevalent over numerous sessions. Participants will respond to future tests of value as they offer favorable entry and exit.


About

In short, an economics graduate working in finance and journalism.

Capelj spends most of his time as the founder of Physik Invest through which he invests and publishes daily analyses to subscribers, some of whom represent well-known institutions.

Separately, Capelj is an equity options analyst at SpotGamma and an accredited journalist interviewing global leaders in business, government, and finance.

Past works include conversations with investor Kevin O’Leary, ARK Invest’s Catherine Wood, FTX’s Sam Bankman-Fried, Lithuania’s Minister of Economy and Innovation Aušrinė Armonaitė, former Cisco chairman and CEO John Chambers, and persons at the Clinton Global Initiative.

Contact

Direct queries to renato@physikinvest.com or Renato Capelj#8625 on Discord.

Calendar

You may view this letter’s content calendar at this link.

Disclaimer

Do not construe this newsletter as advice. All content is for informational purposes.

Categories
Commentary

Daily Brief For December 1, 2022

Physik Invest’s Daily Brief is read by thousands of subscribers. You, too, can join this community to learn about the fundamental and technical drivers of markets.

Graphic updated 7:00 AM ET. Sentiment Neutral if expected /ES open is inside of the prior day’s range. /ES levels are derived from the profile graphic at the bottom of this letter. Levels may have changed since initially quoted; click here for the latest levels. SqueezeMetrics Dark Pool Index (DIX) and Gamma (GEX) with the latter calculated based on where the prior day’s reading falls with respect to the MAX and MIN of all occurrences available. A higher DIX is bullish. At the same time, the lower the GEX, the more (expected) volatility. Click to learn the implications of volatility, direction, and moneyness. Breadth reflects a reading of the prior day’s NYSE Advance/Decline indicator. VIX reflects a current reading of the CBOE Volatility Index (INDEX: VIX) from 0-100.

Administrative

We will issue a content calendar, soon, revealing the dates letters are likely to be published and the content that may be covered. That said, due to the writer’s travel commitments, from 12/6 to 12/9 and 12/12 to 12/16 there will be no commentaries. If any queries, or if you are local to New York City or Paris, ping renato@physikinvest.com or Renato Capelj#8625 on Discord.

Reflections

Fundamentally, our Wednesday letter pointed to some macro-type forces creating an uncertain context for traders.

Key crosswinds are numbered (1-4).

Alongside (1) easing financial conditions, the markets roared higher with boosts coming from (2) a “vol crunch” and “systemic exposure reallocation,” Nomura Holdings Inc’s (NYSE: NMR) Charlie McElligott November 28, 2022, said.

Our November 30, 2022 letter noted Morgan Stanley (NYSE: MS) strategists were seeing a (3) “contraction … [or] squeezing of liquidity that, alone, implies an 8% drop for the S&P 500.”

Strategists JPMorgan Chase & Co (NYSE: JPM) agreed

On “a significant decline in corporate earnings, at a time of higher interest rates (implying lower P/Es and lower prices relative to the 2022 lows), … [a] market decline could happen between now and the end of the first quarter of 2023.”

With (4) “the financial system … evolved around an environment of near-zero interest rates, … [built up] market interdependencies … can cause selloffs” that feed on themselves (i.e., large market drops statistically add to the likelihood of further large drops).

In light of the above (1-4) crosswinds, we took a step back and asked: 

How do we get bullish – particularly if policymakers ease the pace of rate increases – and not lose much money if the market falls, or position ourselves for the drop many expect?

Graphic: Retrieved from Bloomberg.

To quote our November 30, 2022 letter, the Nasdaq 100’s (INDEX: NDX) “volatility skew … was smile-shaped, … making for some great trades to the upside,” we said, adding: “we can use the richness of further away calls to reduce the cost of our bets on the market upside.”

Graphic: Updated 11/28/2022. Retrieved from Interactive Brokers (NASDAQ: IBKR). Nasdaq 100 (INDEX: NDX) volatility skew resembles the so-called smile.

The sample trade provided: 500-1000 points wide call ratio spreads (buy the closer leg, sell two of the farther legs) expiring in fifteen days may work well (e.g., SELL -1 1/2 BACKRATIO NDX 100 16 DEC 22 [AM] 13425/13925 CALL @.20 CR LMT). 

The trade’s key greeks (+Delta and +Gamma) suggested upside would result in profit. The NDX did rise, and the sample trade priced as high as +2,000%. Adding, as sized by the letter writer, if NDX -10.00%, the loss was limited to $60.00. If the NDX +10.00%, with other conditions the same, profit ~$12,000.00. 

Graphic: Retrieved from the Charles Schwab Corporation-owned (NYSE: SCHW) thinkorswim platform. Nasdaq 100 options prices. 

Back to the present. What now?

With news that China is loosening its grip on Covid, and the Federal Reserve seeing inflation fall in some parts of the economy (despite markets showing the terminal rate at ~5.20% next spring) ahead of PCE inflation updates this morning, there is a chance for follow-on bullishness.

Graphic: Via Charles Schwab Corporation’s (NYSE: SCHW) TD Ameritrade thinkorswim. Observed is the Eurodollar, the interest offered on U.S. dollar-denominated deposits held at banks outside of the U.S. (i.e., participants’ outlook on interest rates).

So, what is the takeaway?

The purpose of this letter, though it seems we venture beyond it at times, is to ponder theory as well as generate actionable trade ideas based on the application of theory to recent happenings. 

Though there are factors that may skew the expected distribution of returns one way or another, a trade is a coinflip; your bet either works or it does not. Using the factors of volatility and time to our advantage may lower the risk and cost of bets, in case they do not pan out.

In short, we don’t know if up or down, but we can use market context to lower our costs and live to fight another day! See you later.

Technical

As of 7:00 AM ET, Thursday’s regular session (9:30 AM – 4:00 PM ET), in the S&P 500, is likely to open in the lower part of a negatively skewed overnight inventory, inside of prior-range and -value, suggesting a limited potential for immediate directional opportunity.

Our S&P 500 pivot for today is $4,069.25. 

Key levels to the upside include $4,093.00, $4,122.75, and $4,136.75. 

Key levels to the downside include $4,049.25, $4,024.00, and $4,000.25.

Click here to load today’s key levels into the web-based TradingView platform. All levels are derived using the 65-minute timeframe. New links are produced, daily.

Graphic: 65-minute profile chart of the Micro E-mini S&P 500 Futures.

Definitions

Volume Areas: Markets will build on areas of high-volume (HVNodes). Should the market trend for long periods of time, it will be identified by low-volume areas (LVNodes). LVNodes denote directional conviction and ought to offer support on any test.

If participants auction and find acceptance in an area of a prior LVNode, then future discovery ought to be volatile and quick as participants look to HVNodes for favorable entry or exit.

POCs: Denote areas where two-sided trade was most prevalent in a prior day session. Participants will respond to future tests of value as they offer favorable entry and exit.

MCPOCs: Denote areas where two-sided trade was most prevalent over numerous sessions. Participants will respond to future tests of value as they offer favorable entry and exit.

Volume-Weighted Average Prices (VWAPs): A metric highly regarded by chief investment officers, among other participants, for quality of trade. Additionally, liquidity algorithms are benchmarked and programmed to buy and sell around VWAPs.


About

In short, an economics graduate working in finance and journalism.

Capelj spends most of his time as the founder of Physik Invest through which he invests and publishes daily analyses to subscribers, some of whom represent well-known institutions.

Separately, Capelj is an equity options analyst at SpotGamma and an accredited journalist interviewing global leaders in business, government, and finance.

Past works include conversations with investor Kevin O’Leary, ARK Invest’s Catherine Wood, FTX’s Sam Bankman-Fried, Lithuania’s Minister of Economy and Innovation Aušrinė Armonaitė, former Cisco chairman and CEO John Chambers, and persons at the Clinton Global Initiative.

Contact

Direct queries to renato@physikinvest.com or Renato Capelj#8625 on Discord.

Disclaimer

Do not construe this newsletter as advice. All content is for informational purposes.

Categories
Commentary

Daily Brief For November 30, 2022

Physik Invest’s Daily Brief is read by thousands of subscribers. You, too, can join this community to learn about the fundamental and technical drivers of markets.

Graphic updated 7:20 AM ET. Sentiment Neutral if expected /ES open is inside of the prior day’s range. /ES levels are derived from the profile graphic at the bottom of this letter. Levels may have changed since initially quoted; click here for the latest levels. SqueezeMetrics Dark Pool Index (DIX) and Gamma (GEX) with the latter calculated based on where the prior day’s reading falls with respect to the MAX and MIN of all occurrences available. A higher DIX is bullish. At the same time, the lower the GEX, the more (expected) volatility. Click to learn the implications of volatility, direction, and moneyness. Breadth reflects a reading of the prior day’s NYSE Advance/Decline indicator. VIX reflects a current reading of the CBOE Volatility Index (INDEX: VIX) from 0-100.

Administrative

For the first time in a while, I am able to catch up to and focus more on active trading, hence the earlier letter, today. What a crazy past few months. Almost back to normal!

We will issue a content calendar, soon, revealing the dates letters are likely to be published and the content that may be covered.

That said, due to the writer’s travel commitments, from 12/6 to 12/9 and 12/12 to 12/16 there will be no commentaries. If any queries, or if you are local to New York City or Paris, ping renato@physikinvest.com or Renato Capelj#8625 on Discord.

Fundamental

In many ways, the opposite of what happened to bolster a rally across risk assets like equities and crypto is happening, now. As unpacked in detail across letters including our Daily Brief for October 5, 2022, liquidity measures are in a near-lockstep fall with the S&P 500 (INDEX: SPX).

The correlation between so-called net liquidity described further below, and the S&P 500, over the past ten years is about 0.70 and explains more than half of the movement in price-earings multiples over the past decade.

Graphic: Retrieved from Bloomberg.

Detailed in previous letters was how processes like quantitative tightening manifest themselves as less demand for assets; per Fabian Wintersberger, central bankers must “recycle bonds into the markets on an unprecedented scale, which could easily lead to lower bond prices/higher yields” causing a “reflux of capital to safe-haven assets, like treasuries.”

Alfonso Peccatiello of The Macro Compass details more on the impact of more or less financial sector money in a post titled “All They Told You About Money Printing Is Really, Really Wrong.”

Adding, “the Fed has [only] reduced its holdings by 1.5% by letting bonds mature on its balance sheet. If they want to reduce the balance sheet back to the level of 2020, it needs to reduce it by 41%; … [therefore], [i]f history is any guide, the stock market has yet to face its most significant problems in such a scenario.”

Morgan Stanley’s (NYSE: MS) trading team agrees, per a recent Bloomberg article on a looming bear case for the S&P 500.

Though “rate increases get all the blame for this year’s bear market” and a projected “slowdown in the pace of rate hikes” helping “equities emerge from the yearlong bear, … the S&P 500 will drop as much as 15% by March, based on historic patterns and projected money flows,” which major inputs include “changes in the Fed’s balance sheet (BS); the Treasury General Account (TGA), or Treasury cash held at the central bank; and Reverse Repo Facilities (RRP), or cash parked at the Fed by money market funds and others.”

Graphic: Retrieved from Bloomberg. Inflation increases are easing.

In other words, net liquidity is the Fed’s BS less TGA and RRP. See the below graphic.

Accordingly, “a rise in Fed’s balance sheet means an expansion in liquidity that bodes well for stocks, while an increase in TGA or RRP suggests a contraction in liquidity.” 

Based on the QT pace ($95 billion per month) and forecasts the Treasury cash balance will “rise by $200 billion into yearend, … [amounting] to a squeezing of liquidity that alone implies an 8% drop for the S&P 500 by the end of December.”

Graphic: Via Physik Invest. Data compiled by @jkonopas623. Fed Balance Sheet data, here. Treasury General Account Data, here. Reverse Repo data, here. NL = BS – TGA – RRP.

In summary, “there’s no longer enough money to finance [the] production of those goods and to support a stock market that’s still far from cheap.”

Graphic: Retrieved from VettaFi. “If the supply of money (in aggregate, M2) is higher than the demand for money (represented by nominal GDP), then there is “excess” liquidity that can and will find its way into asset prices.  Furthermore, if the growth of money supply exceeds the growth of GDP, that excess liquidity builds, and there is more of it to find its way into more asset prices.  In theory, the inverse would also hold true.  If the growth of GDP exceeds the growth of money supply, then excess liquidity is being consumed by the demand for money.  In this scenario, the real economy is feeding on liquidity that was once flowing into asset prices.”

Positioning

As we said earlier this week (November 29, 2022, and November 28, 2022), it’s not a terrible time to hedge, and selling volatility, blindly, on either side of the market, is not a great trade.

As SpotGamma put well, yesterday, implied volatility (IVOL) is at a low meaning “it makes sense to buy volatility and put on trades that make money if the market moves” but leverage the skew to sell “options to cut down the cost of waiting for that movement to happen.”

In our letter, yesterday, we highlighted Nasdaq 100 (INDEX: NDX) volatility skew and showed it was smile-shaped, rather than the typical smirk-shaped reverse pattern, making for some great trades to the upside. Through steeper call volatility skew – a result of traders positioning for an upside move – we can use the richness of further away calls to reduce the cost of our bets on the market upside.

Graphic: Updated 11/28/2022. Retrieved from Interactive Brokers (NASDAQ: IBKR). Nasdaq 100 (INDEX: NDX) volatility skew resembles the so-called smile.

For instance, low-cost 500-1000 points wide call ratio spreads (buy the closer leg, sell two of the farther legs) expiring in fifteen days may work well (e.g., SELL -1 1/2 BACKRATIO NDX 100 16 DEC 22 [AM] 13425/13925 CALL @.20 CR LMT). The immediate concern with these strategies is your exposure to Delta (i.e., direction) and Gamma (i.e., does movement make you money).

The required reading is Dynamic Hedging: Managing Vanilla and Exotic Options!

Graphic: Retrieved from the Charles Schwab Corporation-owned (NYSE: SCHW) thinkorswim platform. Nasdaq 100 options prices.

If you are exposed to +Delta and +Gamma, your trade makes money in an increasing way as the market rises, barring any other changes (e.g., passage of time, increases in volatility, etc).

If you are exposed to -Delta and -Gamma, your trade loses money in an increasing way as the market rises, barring any other changes. Should the movement happen quickly, and volatility rise, which is not likely, then that worsens the situation. 

The required reading is Dynamic Hedging: Managing Vanilla and Exotic Options!

This is not advice but a framework for how to act on the theory we talk about on a daily basis. In short, don’t sell calls and puts blindly. Adding, the above trade may not provide safe exposure to the market upside or downside. Given the sideways trade and contraction in ranges, we aim to be well-positioned for a move from low to high volatility. Stay safe and watch your risk.

Noting, should you sell IVOL, the market trade lower, and the demand for IVOL rises, you may be left in an awkward position; big market drops statistically add to the likelihood of more drops.

Read The Second Leg Down: Strategies for Profiting after a Market Sell-Off!

Graphic: Retrieved from SqueezeMetrics.

Technical

As of 7:15 AM ET, Wednesday’s regular session (9:30 AM – 4:00 PM ET), in the S&P 500, is likely to open in the upper part of a positively skewed overnight inventory, inside of prior-range and -value, suggesting a limited potential for immediate directional opportunity.

Our S&P 500 pivot for today is $3,965.25. 

Key levels to the upside include $3,997.00, $4,024.00, and $4,051.00. 

Key levels to the downside include $3,923.00, $3,909.25, and $3,871.25.

Click here to load today’s key levels into the web-based TradingView platform. All levels are derived using the 65-minute timeframe. New links are produced, daily.

Graphic: 65-minute profile chart of the Micro E-mini S&P 500 Futures.

Definitions

Volume Areas: Markets will build on areas of high-volume (HVNodes). Should the market trend for long periods of time, it will be identified by low-volume areas (LVNodes). LVNodes denote directional conviction and ought to offer support on any test.

If participants auction and find acceptance in an area of a prior LVNode, then future discovery ought to be volatile and quick as participants look to HVNodes for favorable entry or exit.

Gamma: The sensitivity of an option’s Delta to changes in the underlying asset’s price.

Volga: The sensitivity of an option’s Vega to changes in the underlying’s implied volatility.

POCs: Denote areas where two-sided trade was most prevalent in a prior day session. Participants will respond to future tests of value as they offer favorable entry and exit.

MCPOCs: Denote areas where two-sided trade was most prevalent over numerous sessions. Participants will respond to future tests of value as they offer favorable entry and exit.

Volume-Weighted Average Prices (VWAPs): A metric highly regarded by chief investment officers, among other participants, for quality of trade. Additionally, liquidity algorithms are benchmarked and programmed to buy and sell around VWAPs.


About

In short, an economics graduate working in finance and journalism.

Capelj spends most of his time as the founder of Physik Invest through which he invests and publishes daily analyses to subscribers, some of whom represent well-known institutions.

Separately, Capelj is an equity options analyst at SpotGamma and an accredited journalist interviewing global leaders in business, government, and finance.

Past works include conversations with investor Kevin O’Leary, ARK Invest’s Catherine Wood, FTX’s Sam Bankman-Fried, Lithuania’s Minister of Economy and Innovation Aušrinė Armonaitė, former Cisco chairman and CEO John Chambers, and persons at the Clinton Global Initiative.

Contact

Direct queries to renato@physikinvest.com or Renato Capelj#8625 on Discord.

Disclaimer

Do not construe this newsletter as advice. All content is for informational purposes.

Categories
Commentary

Daily Brief For November 29, 2022

Physik Invest’s Daily Brief is read by over 1,200 people. To join this community and learn about the fundamental and technical drivers of markets, subscribe below.

Graphic updated 6:50 AM ET. Sentiment Neutral if expected /ES open is inside of the prior day’s range. /ES levels are derived from the profile graphic at the bottom of this letter. Levels may have changed since initially quoted; click here for the latest levels. SqueezeMetrics Dark Pool Index (DIX) and Gamma (GEX) with the latter calculated based on where the prior day’s reading falls with respect to the MAX and MIN of all occurrences available. A higher DIX is bullish. At the same time, the lower the GEX, the more (expected) volatility. Click to learn the implications of volatility, direction, and moneyness. Breadth reflects a reading of the prior day’s NYSE Advance/Decline indicator. VIX reflects a current reading of the CBOE Volatility Index (INDEX: VIX) from 0-100.

Positioning

Aksel Kibar of Tech Charts said it well: There are two types of trades.

1) Trades that you take moving from low volatility to high volatility [and] 2) trades that you take in high volatility while moving to low volatility.”

Graphic: Retrieved from Aksel Kibar, CMT.

Like Kibar, we aim to be well-positioned for a move from low to high volatility. In short, that is where we are today. After an expansion of range to the upside, markets are trading sideways, in a tight range, and traders’ recent activities are likely to keep the status quo intact a bit longer.

Notwithstanding, we are likely nearing an expansion of realized volatility (RVOL), per the implied volatility (IVOL) bid; on Monday, some IVOL measures, such as the Cboe Volatility Index (INDEX: VIX), shifted up, as did term structure. Markets sold a bit, too.

Quick aside:

Changes in IVOL are a byproduct of supply and demand (i.e., demand rushes in → IVOL rises → option prices adjust higher).

When protection is demanded by investors, counterparties may pressure markets (a naive take, if we will, for the purpose of breaking things down).

To explain further, say the market is in balance and trading sideways, and traders seek to protect against potential downside movement by purchasing put options.

This new demand will bid put options prices, causing counterparties to hedge in a manner that pressures the market (i.e., a trader buys put and bids IVOL → the counterparty sells that put and futures to hedge that put), as we’re seeing (i.e., IVOL higher and market lower ahead of updates to measures like the Personal Consumption Expenditures [INDEX: PCE], the Fed’s go-to inflation reading).

Back to the letter:

Upon some new information, participants will enter and reprice the market.

Counterparties’ re-hedging could add to the movement up or down (e.g., traders sell their put hedges → IVOL compresses → counterparties buy back futures hedges and support the market).

If you’re betting on lower prices, recommended is a quick reference of Physik Invest’s Daily Brief for November 28, 2022. In short, according to SpotGamma, “there’s less to be lost owning protection down below,” given the performance of skew, relative to topline measures such as the Cboe Volatility Index (INDEX: VIX).

“On the contrary, if you buy [protection] and nothing happens, that [protection] may very well hold its value better than in the past.”

Graphic: Retrieved from TradingView. Top, S&P 500 (INDEX: SPX). Middle Nations SkewDex (INDEX: SDEX). Bottom Cboe Volatility Index (INDEX: VIX). According to one paper from Nations Indexes, “SkewDex tells market participants how expensive out-of-the-money options are in relation to at-the-money options and thus, how risk-averse investors are.”

On the call side, the story is similar; selling volatility blindly is not a good trade. 

To explain, incentive schemes drove “people to be much more willing to pay and chase upside,” and this is, in part, evidenced by historically low skew. There is also stock replacement, among other things, due to the opportunity cost of buying stock being higher in the current interest rate environment (i.e., “higher call options premium when interest rates are high is the ‘opportunity cost’ of forgone interest”).

Graphic: Retrieved from Charles Schwab Corporation (NYSE: SCHW).

In the interest of brevity, this environment has resulted in a smile-shaped volatility skew pattern, rather than the typical smirk-shaped reverse volatility skew pattern. 

Graphic: Retrieved from Interactive Brokers (NASDAQ: IBKR). Nasdaq 100 (INDEX: NDX) volatility skew resembles the so-called smile.

Skew has steepened on the call side – a result of traders positioning for an upside move – and we can use the richness of out-of-the-money calls to reduce the cost of our bets on the market upside.

Graphic: Retrieved from the Charles Schwab Corporation-owned (NYSE: SCHW) thinkorswim platform. Nasdaq 100 options prices.

For instance, low-cost 500-1000 points wide call ratio spreads (buy the closer leg, sell two of the farther legs) expiring in fifteen days may work well.

Graphic: Via Banco Santander SA (NYSE: SAN) research. The return profile, at expiry, of a 1×2 (long 1, short 2 further away) ratio spread.

A concern with these strategies is the width and time to expiry. Should either of those be wrong, then spreads initially positive gamma turn negative, meaning upside market movement hurts the position and losses are amplified.

Technical

As of 6:45 AM ET, Tuesday’s regular session (9:30 AM – 4:00 PM ET), in the S&P 500, is likely to open in the middle part of a positively skewed overnight inventory, inside of prior-range and -value, suggesting a limited potential for immediate directional opportunity.

Our S&P 500 pivot for today is $4,997.00. 

Key levels to the upside include $4,024.00, $4,051.00, and $4,069.25. 

Key levels to the downside include $3,965.25, $3,923.00, and $3,909.25.

Click here to load today’s key levels into the web-based TradingView platform. All levels are derived using the 65-minute timeframe. New links are produced, daily.

Graphic: 65-minute profile chart of the Micro E-mini S&P 500 Futures.

About

After years of self-education, strategy development, mentorship, and trial-and-error, Renato Leonard Capelj began trading full-time and founded Physik Invest to detail his methods, research, and performance in the markets. 

Capelj also writes options market analyses at SpotGamma and is a Benzinga journalist. 

His past works include private discussions with ARK Invest’s Catherine Wood, investors Kevin O’Leary and John Chambers, the infamous Sam Bankman-Fried of FTX, former Bridgewater Associate Andy Constan, Kai Volatility’s Cem Karsan, The Ambrus Group’s Kris Sidial, the Lithuanian Delegation’s Aušrinė Armonaitė, among many others.

Contact

Direct queries to renato@physikinvest.com or Renato Capelj#8625 on Discord.

Disclaimer

Do not construe this newsletter as advice. All content is for informational purposes.

Categories
Commentary

Daily Brief For September 30, 2022

The daily brief is a free glimpse into the prevailing fundamental and technical drivers of U.S. equity market products. Join the 980+ that read this report daily, below!

Graphic updated 9:50 AM ET. Sentiment Neutral if expected /ES open is inside of the prior day’s range. /ES levels are derived from the profile graphic at the bottom of the following section. Levels may have changed since initially quoted; click here for the latest levels. SqueezeMetrics Dark Pool Index (DIX) and Gamma (GEX) calculations are based on where the prior day’s reading falls with respect to the MAX and MIN of all occurrences available. A higher DIX is bullish. At the same time, the lower the GEX, the more (expected) volatility. Learn the implications of volatility, direction, and moneyness. Breadth reflects a reading of the prior day’s NYSE Advance/Decline indicator. VIX reflects a current reading of the CBOE Volatility Index (INDEX: VIX) from 0-100.

Administrative

Apologies for the delay. Hectic end-of-week! A little heavy on the fundamental side of things and light on the positioning. More to unpack next week. Have a great weekend!

Fundamental

As an update to our September 29, 2022 letter, Russia responded to the Nord Stream attack suggesting the incident spoke of state-sponsored “terrorism”, all the while “an EU official said the incident had fundamentally changed the nature of the conflict in Ukraine,” per Refinitiv.

Graphic: Retrieved from Bloomberg. Updated September 28, 2022.

In short, Russia’s throwing blame on the US, among others, suggesting it was likely to benefit through a boost in liquefied natural gas (LNG) sales. Russia previously said the leaks were in areas “fully under the control” of US intelligence agencies.

It’s the case that in February 2022, Joe Biden commented that if Russia invaded Ukraine, there would “no longer be a Nord Stream 2,” also.

In response, Nord Stream 1 leaks will be stopped on Monday with no forecasts yet on the future of the pipeline’s operation.

To note, the pipelines were not “supplying gas to Europe when the leaks were first detected, … [but] both had gas in them.” Regardless, the EU will be assessing the application of sanctions.

Moving on, as a recap, this week there was tons of volatility in overseas fixed income and FX markets. In short, the announcement of new fiscal policies coincided with market volatility that prompted reflexive feedback responses, which we dissected in our September 29, 2022 letter.

A cascade of margin calls, during the route to 7-8% yields, would have put in jeopardy 90% of UK pension funds. 

To explain, per Reuters, there are schemes “that pay pensioners a fixed annual amount, often a portion of the final salary they earned as employees.” The schemes invest about 50% of assets in bonds, in order to have cash on hand and pay pension liabilities.

To reduce the effects of market volatility, positions are hedged through derivatives “managed by so-called liability-driven investment (LDI) funds,” Reuters well explained. “For example, pension schemes might pay the floating rate leg of an interest rate swap and receive fixed rates.”

Due to the leverage, market moves have an amplified effect on the funds. Therefore, if bonds fall too much, too fast, more cash must be sent to these LDIs. 

“[P]ositions become loss-making – they are paying out more money in the transaction than they are receiving.”

In some cases, schemes were to have “cash reserves to cope with a 200 bps rise in swap rates over a year. However, 30-year gilt interest rate swaps … rose 360 bps this year and 120 bps in the last few days before the BoE stepped in” and bought bonds, boosting inflation expectations, the thing that monetary tightening was, in part, intended to reduce.

Graphic: Retrieved from Fabian Wintersberger.

Accordingly, pensions sold gilts to “ready cash to meet those collateral calls, or they were kicked out of their derivatives positions because they could not pay up in time and had to sell gilts to avoid having a naked exposure to further sharp moves.”

The BoE’s actions calm the market allowing for the more orderly processing of transactions. 

Still, the UK is seen “out-hiking the Fed in the wake of Kwarteng tax cuts,” while “schemes are running out of cash.”

Graphic: Retrieved via Bloomberg.

The risks don’t just stop there, though, we added. 

For one, there’s damage to be had if FX hedges go awry, which we said would likely prompt a call for collateral, too; investors will “buy overseas assets and hedge away the currency risk,” Jim Leaviss explained. “[I]f you had bought a dollar bond and hedged it, the dollars that you have effectively sold ‘short’ against sterling as the hedge have rallied, and the counterparty to the FX hedge will call for a collateral payment.”

The actions of the recent days likely put investors in a position of less liquid assets to meet the (potential) collateral calls, and this is part of the aforementioned technical factors that are likely to have a bearing on the direction of bonds and yields “over coming months.”

Additionally, some participants speculate the US may run into similar issues as the UK. A single (unconfirmed) participant explained pensions may be “selling equities and other asset classes to meet their swap obligations.”

Graphic: Retrieved via Bloomberg.

Separately, another topic of discussion was the People’s Bank of China (PBOC) telling state-run banks to prepare for the shedding of dollar holdings to buy and assist in propping up the yuan.

Graphic: Retrieved from Reuters’ John Kemp.

This is all the while the Federal Reserve (Fed), to address problems of its own (e.g., real estate affordability) is implementing aggressive monetary tightening (prompting a rise in the dollar and triggering a “reverse currency war”). 

Graphic: Retrieved from Bloomberg. “So if you want to spend $2,500 a month, you can now buy a house that costs $476,425. For that same monthly payment, you could have purchased a $758,572 house in early 2021.”

As an aside, US mortgage rates hit a 15-year high and home prices are falling.

Graphic: Retrieved via Bloomberg. To note, housing wealth regressions indicate “that every dollar of changes in housing wealth leads to a 38-cent change in consumption.”

China is looking to do less of the same and “spark growth in an economy that’s been dragged down by COVID-19 lockdowns, a real estate crash, and supply chain snags,” which have hurt some US firms including Apple Inc (NASDAQ: AAPL).

Graphic: Retrieved from Bloomberg. Apple’s manufacturing exposure to China.

That’s the mismatch (i.e., China easy, US uneasy) that’s going on and, per some, the Fed may be acting on a set of lagging indicators; monetary policy action may do more harm than good.

Graphic: Retrieved from Bloomberg. Via Liz Ann Sonders. “Unbelievable decline in shipping rates … cost to send a 40-ft container from Shanghai to Los Angeles has fallen by 74% from peak and is back to August 2020 levels.”

But, for now, a robust labor market and continued spending by American consumers have some feeling there’s far more room to go before US monetary policy does more harm than good.

Graphic: Retrieved from Bloomberg. An end of an era is approaching, however, as companies that grew largely over the past years, including Meta Platforms Inc (NASDAQ: META), seek to reduce headcount and reorganize.

Positioning

All that was said yesterday, and earlier this week, remains valid. In short, the decline prompted traders to demand downside protection, and this wound measures of implied volatility (IVOL).

Graphic: Retrieved from Interactive Brokers Group Inc (NASDAQ: IBKR). Read, here, to understand backwardation and contango in futures markets.

For IVOL measures to remain wound, something bad needs to happen, in short. Otherwise, as seen yesterday, slightly, the S&P 500 drifted lower while certain IVOL measures, such as the Cboe Volatility Index (INDEX: VIX) printed a lower high than that observed on Wednesday.

Per SpotGamma, “If the decline in IVOL is very pronounced, relative to the decline in the S&P, that too can aid in a push-and-pull that actually serves to … resist far-reaching weakness.”

Graphic: Retrieved from SpotGamma. SPX prices X-axis. Option delta Y-axis. When the factors of implied volatility (Vanna) and time change (Charm), hedging ratios change. The graphic is for illustrational purposes, only.

From hereon, the decay and/or removal of the protection that’s been demanded in the past days and weeks may place a like on IVOL and boost markets over a very short term. In the long term, however, weakness is here to stay, says Kai Volatility’s Cem Karsan. 

That’s amid impacts of quantitative tightening (QT) which is manifesting itself as “$4.5 billion less in demand for assets per day,” as well as the blackout period for buybacks (which were consistently “supporting the market”) and options repositioning bolstering the weakness.

Graphic: Via Physik Invest. Data compiled by @jkonopas623. Fed Balance Sheet data, here. Treasury General Account Data, here. Reverse Repo data, here. NL = BS – TGA – RRP.

A lot more on this positioning, and the rollover of some large fund exposures, which have grasped the attention of many online, in some coming letters.

Technical

As of 9:50 AM ET, Friday’s regular session (9:30 AM – 4:00 PM ET), in the S&P 500, is likely to open in the middle part of a balanced overnight inventory, inside of prior-range and -value, suggesting a limited potential for immediate directional opportunity.

In the best case, the S&P 500 trades higher.

Any activity above the $3,638.25 LVNode puts into play the $3,688.75 HVNode. Initiative trade beyond the HVNode could reach as high as the $3,722.50 LVNode and $3,771.25 HVNode, or higher.

In the worst case, the S&P 500 trades lower.

Any activity below the $3,638.25 LVNode puts into play the $3,610.75 HVNode. Initiative trade beyond the latter could reach as low as the $3,554.75 and $3,506.25 HVNode, or lower.

Click here to load today’s key levels into the web-based TradingView charting platform. Note that all levels are derived using the 65-minute timeframe. New links are produced, daily.
Graphic: 65-minute profile chart of the Micro E-mini S&P 500 Futures.

Definitions

Volume Areas: A structurally sound market will build on areas of high volume (HVNodes). Should the market trend for long periods of time, it will lack sound structure, identified as low volume areas (LVNodes). LVNodes denote directional conviction and ought to offer support on any test. 

If participants were to auction and find acceptance into areas of prior low volume (LVNodes), then future discovery ought to be volatile and quick as participants look to HVNodes for favorable entry or exit.

About

After years of self-education, strategy development, mentorship, and trial-and-error, Renato Leonard Capelj began trading full-time and founded Physik Invest to detail his methods, research, and performance in the markets.

Capelj also develops insights around impactful options market dynamics at SpotGamma and is a Benzinga reporter.

Some of his works include conversations with ARK Invest’s Catherine Wood, investors Kevin O’Leary and John Chambers, FTX’s Sam Bankman-Fried, ex-Bridgewater Associate Andy Constan, Kai Volatility’s Cem Karsan, The Ambrus Group’s Kris Sidial, among many others.

Disclaimer

In no way should the materials herein be construed as advice. Derivatives carry a substantial risk of loss. All content is for informational purposes only.

Categories
Commentary

Daily Brief For August 5, 2022

The daily brief is a free glimpse into the prevailing fundamental and technical drivers of U.S. equity market products. Join the 750+ that read this report daily, below!

Graphic updated 7:00 AM ET. Sentiment Neutral if expected /ES open is inside of the prior day’s range. /ES levels are derived from the profile graphic at the bottom of the following section. Levels may have changed since initially quoted; click here for the latest levels. SqueezeMetrics Dark Pool Index (DIX) and Gamma (GEX) calculations are based on where the prior day’s reading falls with respect to the MAX and MIN of all occurrences available. A higher DIX is bullish. At the same time, the lower the GEX, the more (expected) volatility. Learn the implications of volatility, direction, and moneyness. Breadth reflects a reading of the prior day’s NYSE Advance/Decline indicator. VIX reflects a current reading of the CBOE Volatility Index (INDEX: VIX) from 0-100.

Fundamental

Shortened fundamentals section, today.

It’s the case that from mid-2020 to late-2021, as well explained by Damped Spring’s Andy Constan, the decline in risk premiums boosted assets, across the board.

Then, when “the drumbeats of quantitative tightening (QT) sounded on December 29,” the expansion in risk premiums bolstered a rotation out of risk.

Per Constan, conditions are unchanged. 

The “knee jerk re-leveraging flow [] will not survive the high coupon issuance/QT doubling of the September and Q4. Fade the [fear of missing out] until Turkey day when Santa comes to town.”

Graphic: Via Physik Invest. Data compiled by @jkonopas623. Fed Balance Sheet data, here. Treasury General Account Data, here. Reverse Repo data, here. NL = BS – TGA – RRP.

Positioning

As of 7:00 AM ET, Thursday’s expected volatility, via the Cboe Volatility Index (INDEX: VIX), sits at ~1.14%. Net gamma exposures are increasing which may promote tighter ranges.

Further, given where realized (RVOL) and implied (IVOL) volatility are, as well as skew, it is beneficial to be a buyer of options structures (e.g., put back spread and/or call ratio spread).

Here is some context.

Per past letters, such as the Daily Brief for August 2, the monetization and counterparty hedging of existing customer volatility (i.e., options) hedges, as well as the sale of short-dated volatility, particularly in some single stocks where there was “rich” volatility into the fall, lent to lackluster performance in IVOL and index mean reversion.

Graphic: RVOL (orange) versus IVOL (white) on the S&P 500 (INDEX: SPX).

These forces have only grown and are, presently, adding to the stickiness of the move higher. 

Graphic: Retrieved from SpotGamma on 8/4/2022.

Why? 

Well – though naive – if we take participants as trading similar to the way they do historically (i.e., buying stocks and hedging by selling calls and buying puts), the counterparty is left with a bullish trade (i.e., short put, long call). 

Depending on (A) where the market is in relation to this exposure, as well as (B) where this exposure is more concentrated, the call or put side may solicit increased hedging activities.

Today, with markets trading higher and participants becoming increasingly active on the call side, the counterparties have a trade that is (becoming increasingly) bullish; positive delta (i.e., exposure to direction) and gamma (i.e., rate of change of exposure to direction) are growing.

Further, knowing that participants are concentrating their bets on options close to current market prices, which are very short-dated (and with little time to expiration), the counterparty’s exposure is way more sensitive to changes in direction because options can go from having a lot of value to very little in a small window (of time and movement). 

In other words, it is a fact that an option that is at the money can go from having a near 50% chance of expiring in the money to 0%. However, if the time to expiry is shorter, then the speed at which these options may go from a near 50% chance of expiring in the money to 0% rises.

That’s probably one of the simplest ways one could explain put it.

Therefore (with activity becoming more concentrated at options strikes near current price, all the while IVOL continues to fall), into weakness, counterparties lean toward buying (selling) dips (rips).

Adding:

If you (like a counterparty) own a call option and want no exposure to the positive payoff when the market moves higher, you sell the underlying asset (e.g., stock, future).

If the market is sideways and slightly lower, while volatility is generally trending lower, as it is recently, and your option declines in value, then you must rebalance your hedge. So, you would buy (cover) some of your existing short stock and futures position to rebalance your deltas.

That’s supportive.

Read: SqueezeMetrics’ “The Implied Order Book” for more regarding the impact of options trade on underlying liquidity.

Moreover, the trends above may be coming to an end as entities are squeezed out of trades that aren’t working (i.e., participants continue to rotate out of poor-performing volatility and commodities). 

Accordingly, Kai Volatility’s Cem Karsan explains that markets can, now, as that suppressive options activity fades, potentially, “really begin to respond to the core macro factors.”

Here’s why.

Should markets experience a shock (e.g., China and U.S. tensions escalate), the new demand for hedges may result in an “untethering” in IVOL, which was “one of the most supportive things into the decline,” Karsan explained.

That means that now is the best time to rotate into call options that are outperforming “their delta to the upside.”

Graphic: Via Banco Santander SA (NYSE: SAN) research, the return profile, at expiry, of a classic 1×2 (long 1, short 2 further away) ratio spread.

You may ask: what’s bolstering some of the market’s strength, in the shorter term?

In spite of negative macro narratives, as IVOL continues to decline and options, in general, are less sought after per their poor performance, what’s providing an added boost is the “cohort of quantitative-based investment strategies [buying] equities when volatility is lower,” according to statements by the Wall Street Journal.

“This year, these so-called systematic strategies have exited the market to historically low levels, meaning they have plenty of buying power.”

Much more next week! Talk soon.

Technical

As of 7:00 AM ET, Thursday’s regular session (9:30 AM – 4:00 PM ET), in the S&P 500, is likely to open in the middle part of a balanced overnight inventory, just inside of prior-range and -value, suggesting a limited potential for immediate directional opportunity.

In the best case, the S&P 500 trades higher.

Any activity above the $4,153.25 HVNode puts into play the $4,189.25 LVNode. Initiative trade beyond the LVNode could reach as high as the $4,227.75 HVNode and $4,259.75 LVNode, or higher.

In the worst case, the S&P 500 trades lower.

Any activity below the $4,153.25 HVNode puts into play the $4,117.75 MCPOC. Initiative trade beyond the MCPOC could reach as low as the $4,073.00 VPOC and $4,040.75 HVNode, or lower.

Click here to load today’s key levels into the web-based TradingView charting platform. Note that all levels are derived using the 65-minute timeframe. New links are produced, daily.
Graphic: 65-minute profile chart of the Micro E-mini S&P 500 Futures.

Considerations: Responsiveness near key-technical areas (that are discernable visually on a chart), suggests technically-driven traders with short time horizons are very active. 

Such traders often lack the wherewithal to defend retests and, additionally, the type of trade may be indicative of the other time frame participants waiting for more information to initiate trades.

Definitions

Volume Areas: A structurally sound market will build on areas of high volume (HVNodes). Should the market trend for long periods of time, it will lack sound structure, identified as low volume areas (LVNodes). LVNodes denote directional conviction and ought to offer support on any test. 

If participants were to auction and find acceptance into areas of prior low volume (LVNodes), then future discovery ought to be volatile and quick as participants look to HVNodes for favorable entry or exit.

POCs: POCs are valuable as they denote areas where two-sided trade was most prevalent in a prior day session. Participants will respond to future tests of value as they offer favorable entry and exit.

MCPOCs: POCs are valuable as they denote areas where two-sided trade was most prevalent over numerous day sessions. Participants will respond to future tests of value as they offer favorable entry and exit.

Volume-Weighted Average Prices (VWAPs): A metric highly regarded by chief investment officers, among other participants, for quality of trade. Additionally, liquidity algorithms are benchmarked and programmed to buy and sell around VWAPs.

About

After years of self-education, strategy development, mentorship, and trial-and-error, Renato Leonard Capelj began trading full-time and founded Physik Invest to detail his methods, research, and performance in the markets.

Capelj also develops insights around impactful options market dynamics at SpotGamma and is a Benzinga reporter.

Some of his works include conversations with ARK Invest’s Catherine Wood, investors Kevin O’Leary and John Chambers, FTX’s Sam Bankman-Fried, ex-Bridgewater Associate Andy Constan, Kai Volatility’s Cem Karsan, The Ambrus Group’s Kris Sidial, among many others.

Disclaimer

In no way should the materials herein be construed as advice. Derivatives carry a substantial risk of loss. All content is for informational purposes only.

Categories
Commentary

Daily Brief For August 4, 2022

The daily brief is a free glimpse into the prevailing fundamental and technical drivers of U.S. equity market products. Join the 750+ that read this report daily, below!

Graphic updated 7:10 AM ET. Sentiment Neutral if expected /ES open is inside of the prior day’s range. /ES levels are derived from the profile graphic at the bottom of the following section. Levels may have changed since initially quoted; click here for the latest levels. SqueezeMetrics Dark Pool Index (DIX) and Gamma (GEX) calculations are based on where the prior day’s reading falls with respect to the MAX and MIN of all occurrences available. A higher DIX is bullish. At the same time, the lower the GEX, the more (expected) volatility. Learn the implications of volatility, direction, and moneyness. Breadth reflects a reading of the prior day’s NYSE Advance/Decline indicator. VIX reflects a current reading of the CBOE Volatility Index (INDEX: VIX) from 0-100.

Fundamental

A heavy week content-wise. 

Monday, we talked about some of the big narratives participants are seeking to price. Tuesday and Wednesday we elaborated, providing information on the calculation of net liquidity and its relationship with equity index prices, as well as the probable paths the economy may traverse.

Today, we’ll add context with respect to some of the big headlines heading into today’s trade.

At the top of the list is geopolitical tension. US House Speaker Nancy Pelosi traveled to Taiwan. 

It’s the case that “China views Taiwan as a breakaway island” subject to mainland rules. The visit by Pelosi, who, per NPR, “has long been a critic of China and an advocate for Taiwan’s democracy,” China viewed as a provocation.

Accordingly, China responded with trade boycotts and military exercises such as the firing of 11 missiles into the sea around Taiwan.

Graphic: Retrieved from Bloomberg.

White House officials, per Bloomberg, were said to be “fuming” at Pelosi. In response, the Biden administration was seeking to put brakes on friendlier US and Taiwan policies.

In other news, an ISM Services reading climbed unexpectedly, easing the concern of economic slowing while other data showed material and commodity prices falling.

Graphic: Retrieved from S&P Global Inc’s (NYSE: SPGI) commodity insights.

Still, more firms, from the likes of Credit Suisse Group AG (NYSE: CS) to Robinhood Markets Inc (NASDAQ: HOOD), are seeking to cut thousands of jobs and restructure.

Graphic: Retrieved from The Daily Shot.

And, though equity markets are enjoying some relief, profit forecasts continue to be cut, and broad measures of the supply of money are falling.

Graphic: Via Physik Invest. Data compiled by @jkonopas623. Fed Balance Sheet data, here. Treasury General Account Data, here. Reverse Repo data, here. NL = BS – TGA – RRP.

Additionally, many maintain that conditions are set to get tighter with the Bank of England raising rates the most since 1995 and a Fed funds rate of 5-6% not out of the realm of possibilities.

Graphic: Retrieved from @ConvexityMaven. “Home buyers don’t panic, retail Mortgage rates should soon be under 4.90%. MBS (mortgage bonds) usually trade ~75bp above the 10yr swap rate  (~85bp above the UST10yr rate). The retail Home loan rate should be ~100bp above MBS rate (chart). Mortgage brokers will be begging soon.

Positioning

As of 7:10 AM ET, Thursday’s expected volatility, via the Cboe Volatility Index (INDEX: VIX), sits at ~1.14%. Net gamma exposures increasing may promote tighter ranges at higher price levels.

Context: Customers concentrate bets at and above current S&P 500 (INDEX: SPX) prices. 

Taking the naive view and assuming this activity is, indeed, aligned with historical trends (i.e., customers sell calls and use those proceeds to finance protection, down below), then counterparts are likely taking on exposure to more long call positions, which they hedge by selling underlying. Into strength, some more underlying will be sold. Into weakness, some underlying will be bought. This activity can promote mean-reversion at higher prices.
Graphic: Retrieved from SpotGamma. Changes in call open interest.

As well put in our August 3 letter, given where realized (RVOL) and implied (IVOL) volatility are, as well as skew, it is beneficial to be a buyer of options structures (e.g., put back spread).

Graphic: Updated 8/3/2022. Time-lapse skew on the S&P 500 (INDEX: SPX) for Tuesday, Monday, and one week ago. Retrieved from Interactive Brokers Group Inc’s (NASDAQ: IBKR) Trader Workstation.

According to SpotGamma, “data suggests markets have entered into a period of normalization” and “IVOL likely reached a lower bound (see the bid skew).”

Graphic: Retrieved from Bloomberg. “The CBOE VIX index shows price swings usually rise in the summer and early autumn, and the S&P 500 is now entering its period of the worst historical returns over the past 25 years.”

“To maintain a risk-on (rally) environment, traders would need to position themselves into call options, now, further up in price, farther out in time, which they seem to be doing, albeit in not overly significant quantities.”

Notwithstanding, as SpotGamma adds, “with participants getting rid of commodity inflation and long volatility hedges that performed poorly, [this] (1) leaves equity markets more susceptible to the whims of potentially negative underlying macro forces and (2) leaves volatility markets more prone to jumps.”

Thus far, it’s the case that we’re far more than halfway through a dot-com type collapse that’s happened “underneath the surface of the indices,” per Simplify Asset Management’s Mike Green. Should those strong passive flows falter, that likely takes from some of the support in the largest of index constituents.

Graphic: Retrieved from The Market Ear. Via Barclays PLC (NYSE: BCS).

Were the latter to happen, you’d want protection in the form of structures that would enable you to monetize on some sort-of non-linear repricing in volatility (e.g., butterflies and back spreads), should participants seek protection in a way they haven’t this year.

If nothing were to happen, the bid in skew would, at least, assist those structures in maintaining their value better, essentially.

Technical

As of 7:00 AM ET, Thursday’s regular session (9:30 AM – 4:00 PM ET), in the S&P 500, is likely to open in the upper part of a positively skewed overnight inventory, just inside of prior-range and -value, suggesting a limited potential for immediate directional opportunity.

In the best case, the S&P 500 trades higher.

Any activity above the $4,153.25 HVNode puts into play the $4,189.25 LVNode. Initiative trade beyond the LVNode could reach as high as the $4,227.75 HVNode and $4,259.75 LVNode, or higher.

In the worst case, the S&P 500 trades lower.

Any activity below the $4,153.25 HVNode puts into play the $4,117.75 MCPOC. Initiative trade beyond the MCPOC could reach as low as the $4,073.00 VPOC and $4,040.75 HVNode, or lower.

Click here to load today’s key levels into the web-based TradingView charting platform. Note that all levels are derived using the 65-minute timeframe. New links are produced, daily.
Graphic: 65-minute profile chart of the Micro E-mini S&P 500 Futures.

Considerations: Responsiveness near key-technical areas (that are discernable visually on a chart), suggests technically-driven traders with short time horizons are very active. 

Such traders often lack the wherewithal to defend retests and, additionally, the type of trade may be indicative of the other time frame participants waiting for more information to initiate trades.

Definitions

Volume Areas: A structurally sound market will build on areas of high volume (HVNodes). Should the market trend for long periods of time, it will lack sound structure, identified as low volume areas (LVNodes). LVNodes denote directional conviction and ought to offer support on any test. 

If participants were to auction and find acceptance into areas of prior low volume (LVNodes), then future discovery ought to be volatile and quick as participants look to HVNodes for favorable entry or exit.

POCs: POCs are valuable as they denote areas where two-sided trade was most prevalent in a prior day session. Participants will respond to future tests of value as they offer favorable entry and exit.

MCPOCs: POCs are valuable as they denote areas where two-sided trade was most prevalent over numerous day sessions. Participants will respond to future tests of value as they offer favorable entry and exit.

Volume-Weighted Average Prices (VWAPs): A metric highly regarded by chief investment officers, among other participants, for quality of trade. Additionally, liquidity algorithms are benchmarked and programmed to buy and sell around VWAPs.

About

After years of self-education, strategy development, mentorship, and trial-and-error, Renato Leonard Capelj began trading full-time and founded Physik Invest to detail his methods, research, and performance in the markets.

Capelj also develops insights around impactful options market dynamics at SpotGamma and is a Benzinga reporter.

Some of his works include conversations with ARK Invest’s Catherine Wood, investors Kevin O’Leary and John Chambers, FTX’s Sam Bankman-Fried, ex-Bridgewater Associate Andy Constan, Kai Volatility’s Cem Karsan, The Ambrus Group’s Kris Sidial, among many others.

Disclaimer

In no way should the materials herein be construed as advice. Derivatives carry a substantial risk of loss. All content is for informational purposes only.