The daily brief is a free glimpse into the prevailing fundamental and technical drivers of U.S. equity market products. Join the 300+ that read this report daily, below!
What Happened
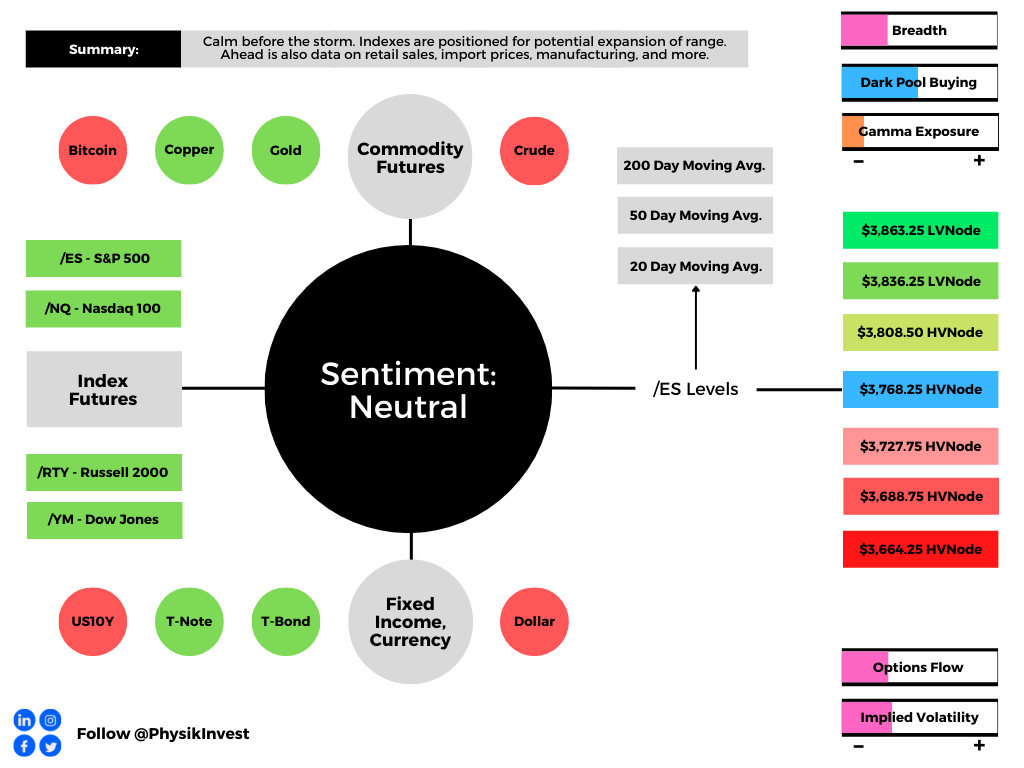
The calm before the storm.
Overnight, equity index futures auctioned sideways, inside of a developing balance area. The S&P 500 was glued to the area above $3,700.00.
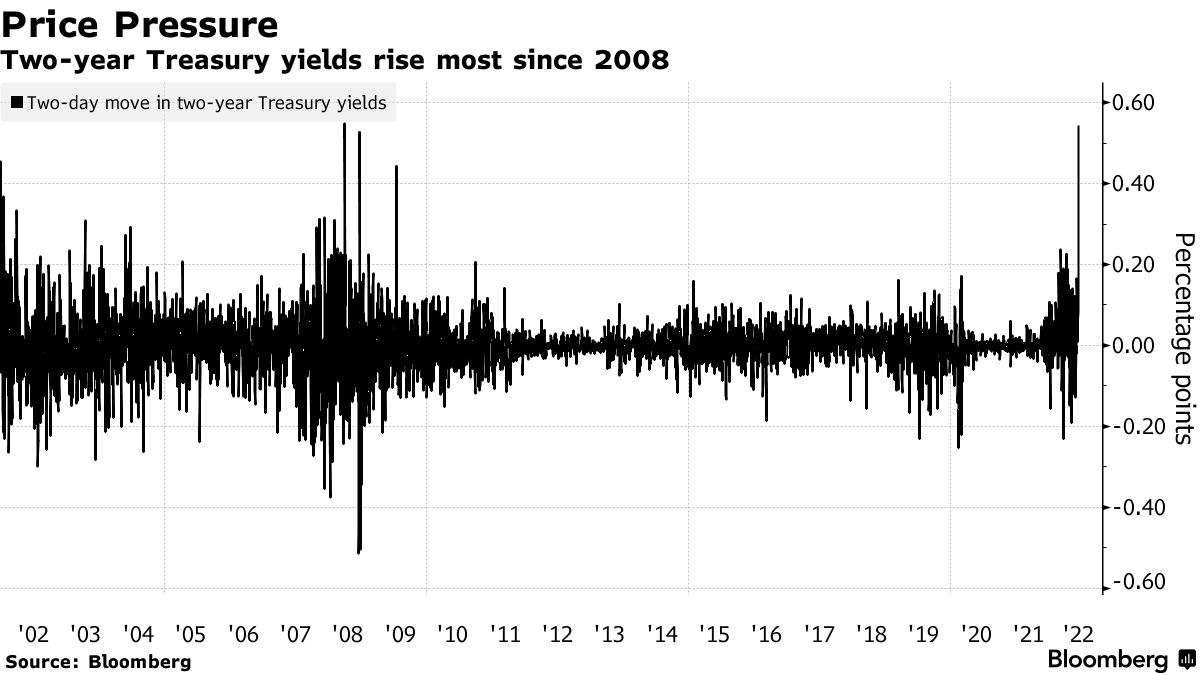
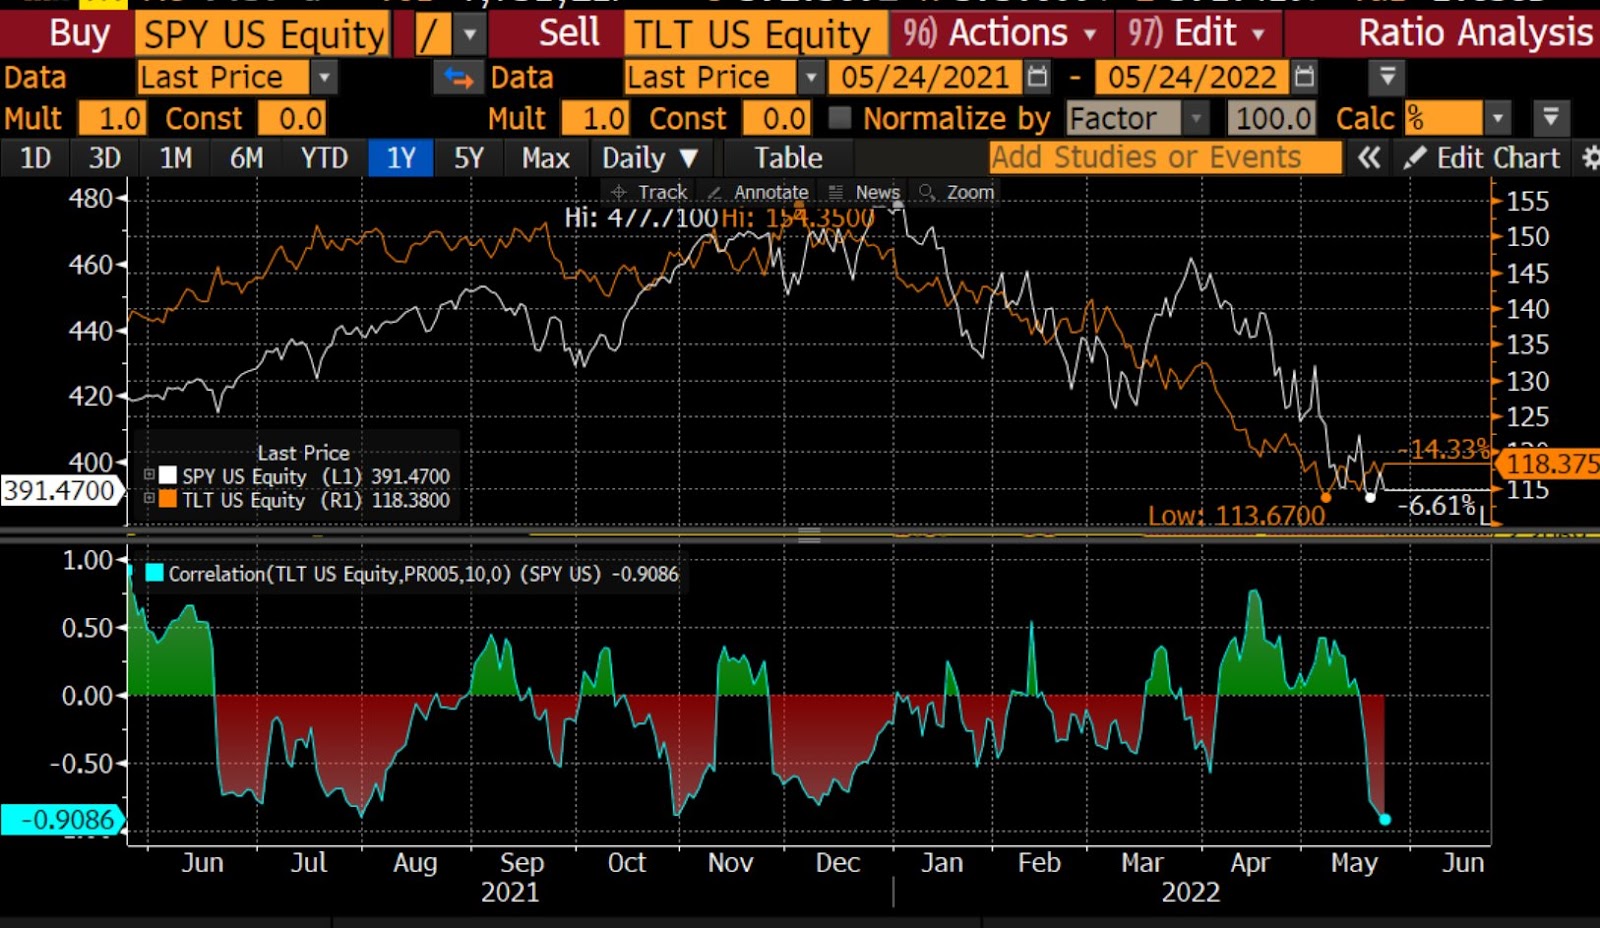
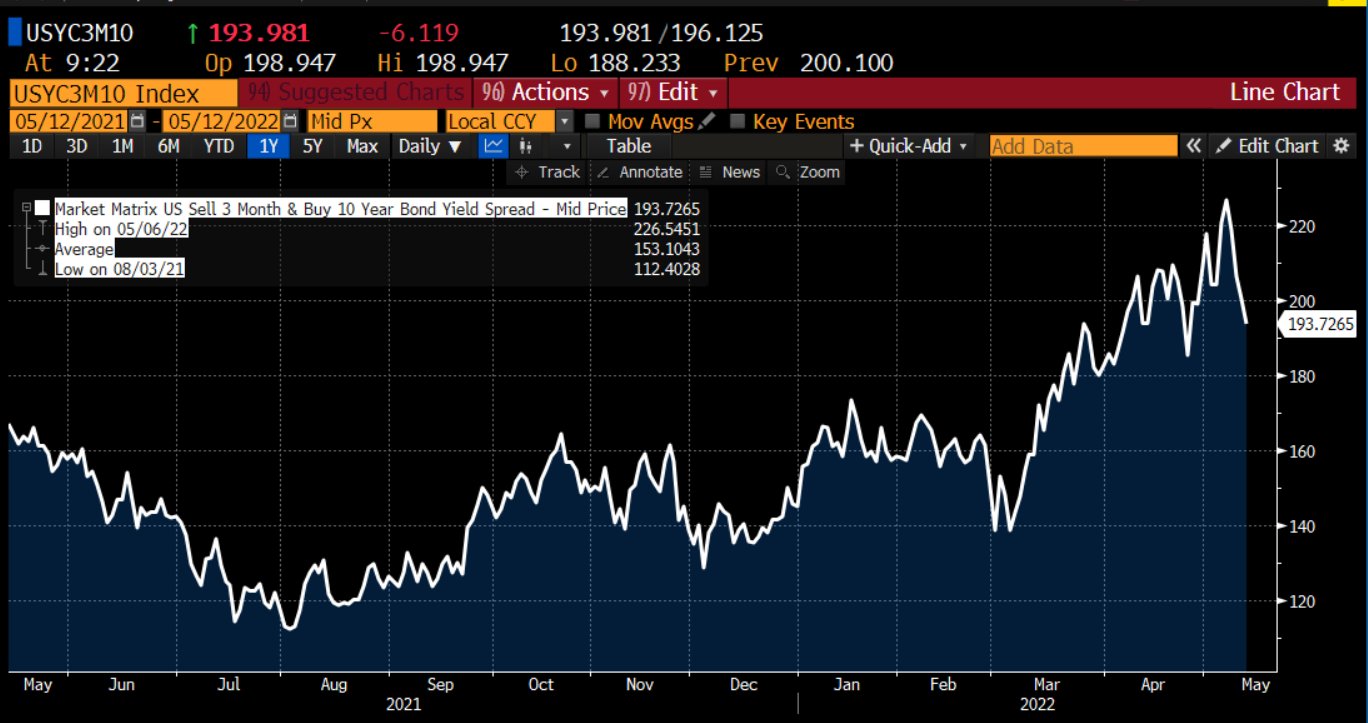
The Treasury rout cooled. T-Note (FUTURE: /ZN) and T-Bond (FUTURE: /ZB) futures were off their lows. Per Bloomberg, the sell-off in fixed income wiped nearly $10 trillion of value in global bonds, erasing post-Pandemic gains on stimulative central bank intervention.
This letter has talked about the bonds and equities down phenomenon before. It is the shifting in priorities at the policy level – from monetary to fiscal – driving (more) positive correlations.
Abroad, the slump solicited the attention of policymakers. The European Central Bank (ECB) said it would have an emergency meeting to discuss current market conditions. Policymakers are to sign off on the reinvestment of bond purchases conducted during the pandemic.
In other news, the American Petroleum Institute issued policies to unleash American energy and fuel recovery. The U.S. rebuffed China by calling the Taiwan Strait an international waterway as CEOs urge the U.S. Congress to pass a China competition bill. More news of layoffs hit the wire also. Coinbase Global Inc (NASDAQ: COIN) will lay off 18% of its workforce, alongside many other crypto companies.
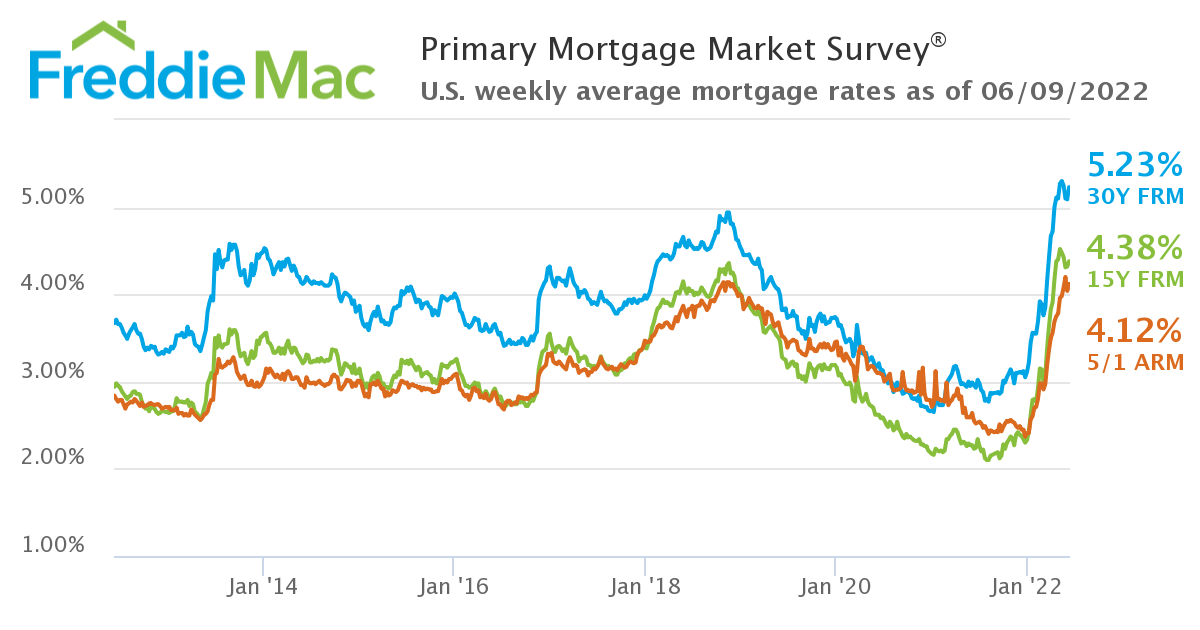
Elsewhere, Redfin Corporation (NASDAQ: RDFN) and Compass Inc (NYSE: COMP) are laying off workers, as are automotive manufacturers.
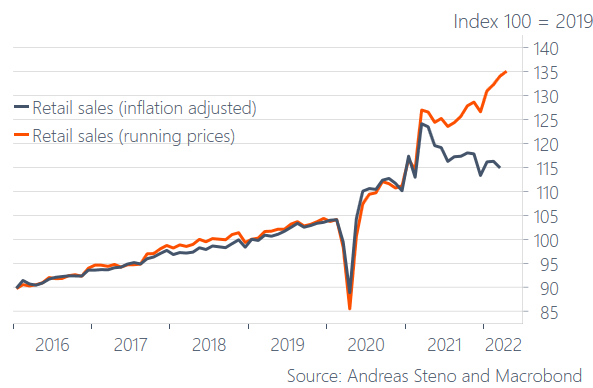
Ahead is a packed calendar. To be released is data on retail sales, import prices, and manufacturing (8:30 AM ET). Later is data on home building and inventories (10:00 AM ET).
Key is the Federal Open Market Committee (FOMC) statement, projections, and news conference (2:00 PM ET).
What To Expect
Fundamental: Let’s keep it short and to the point.
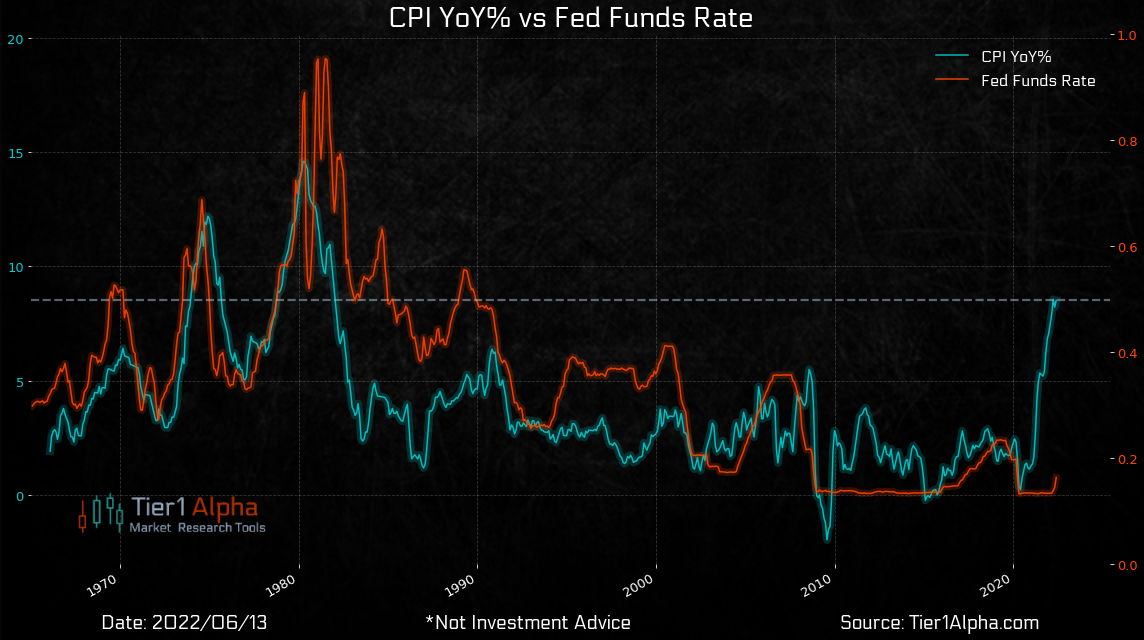
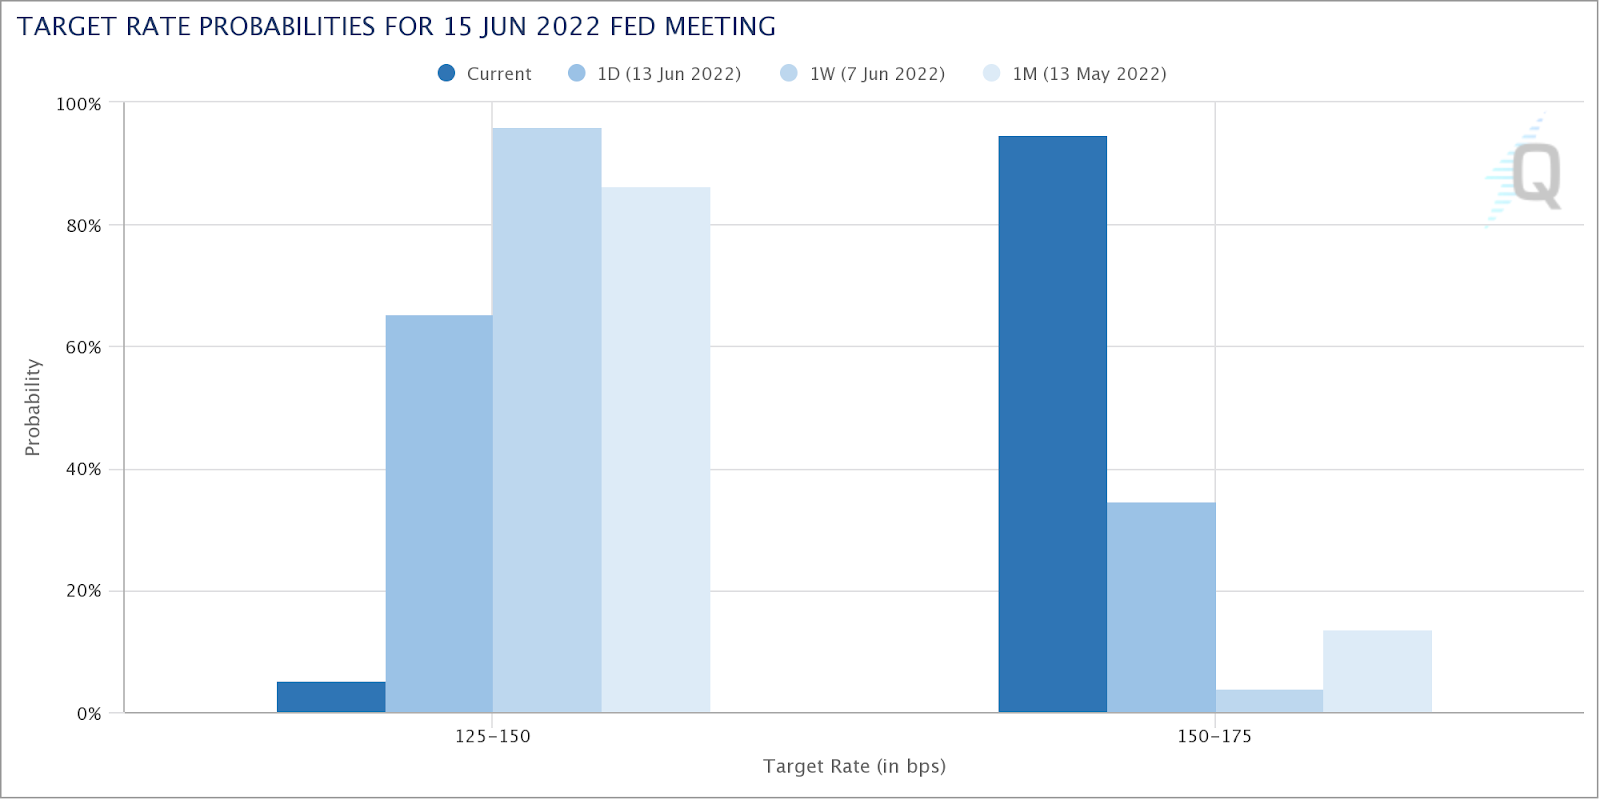
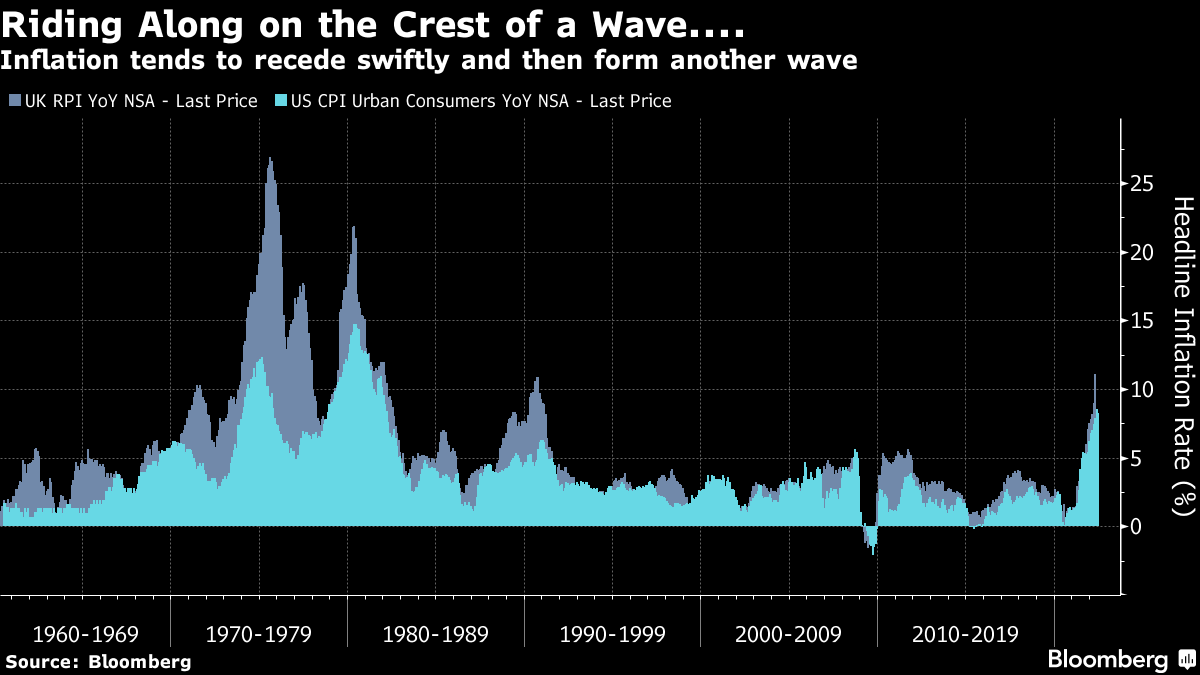
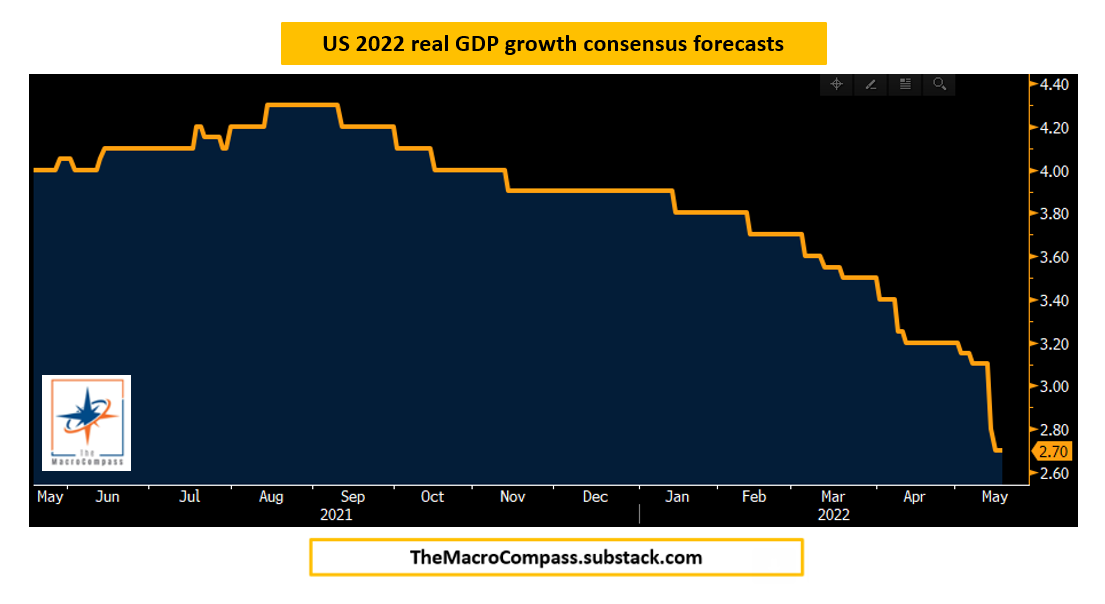
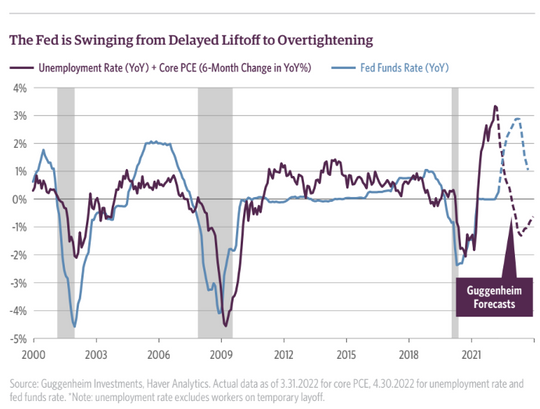
As talked about, yesterday, the FOMC is expected to raise rates by 75 basis points in light of new data. Per Bloomberg, “Powell will argue that a supersized move is needed to preempt inflation expectations from unanchoring.”
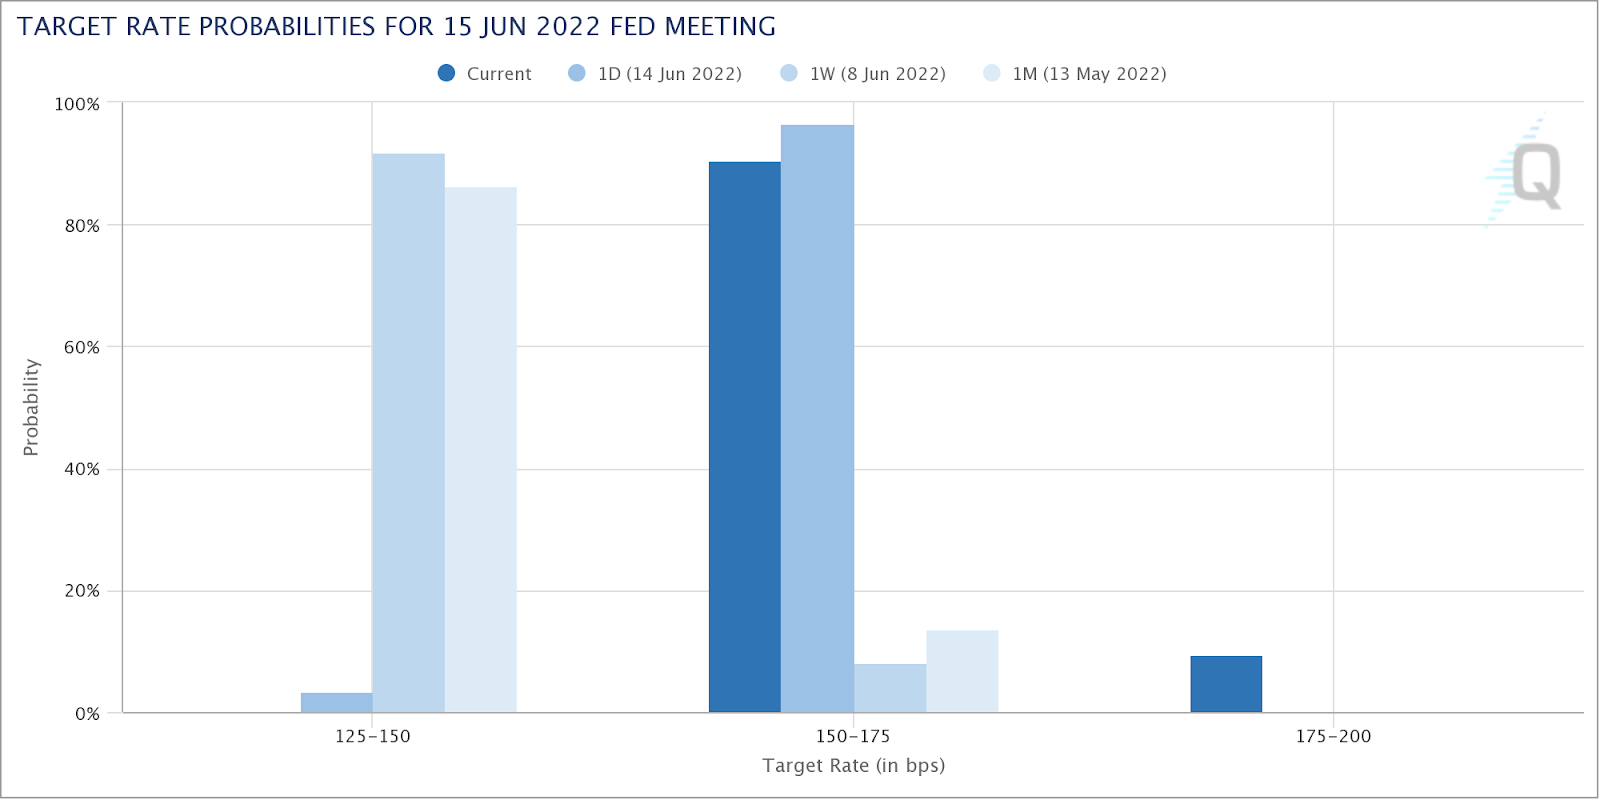
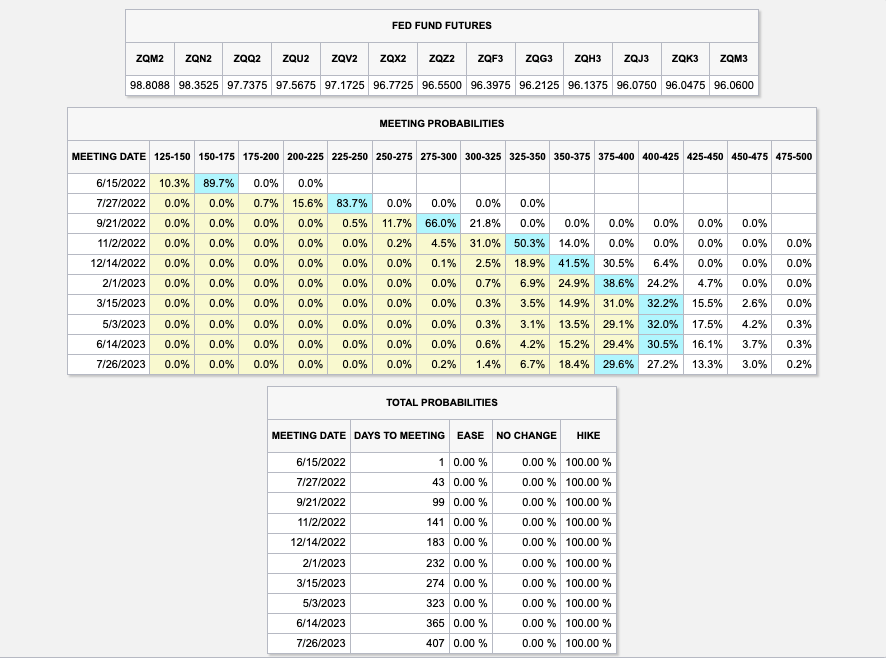
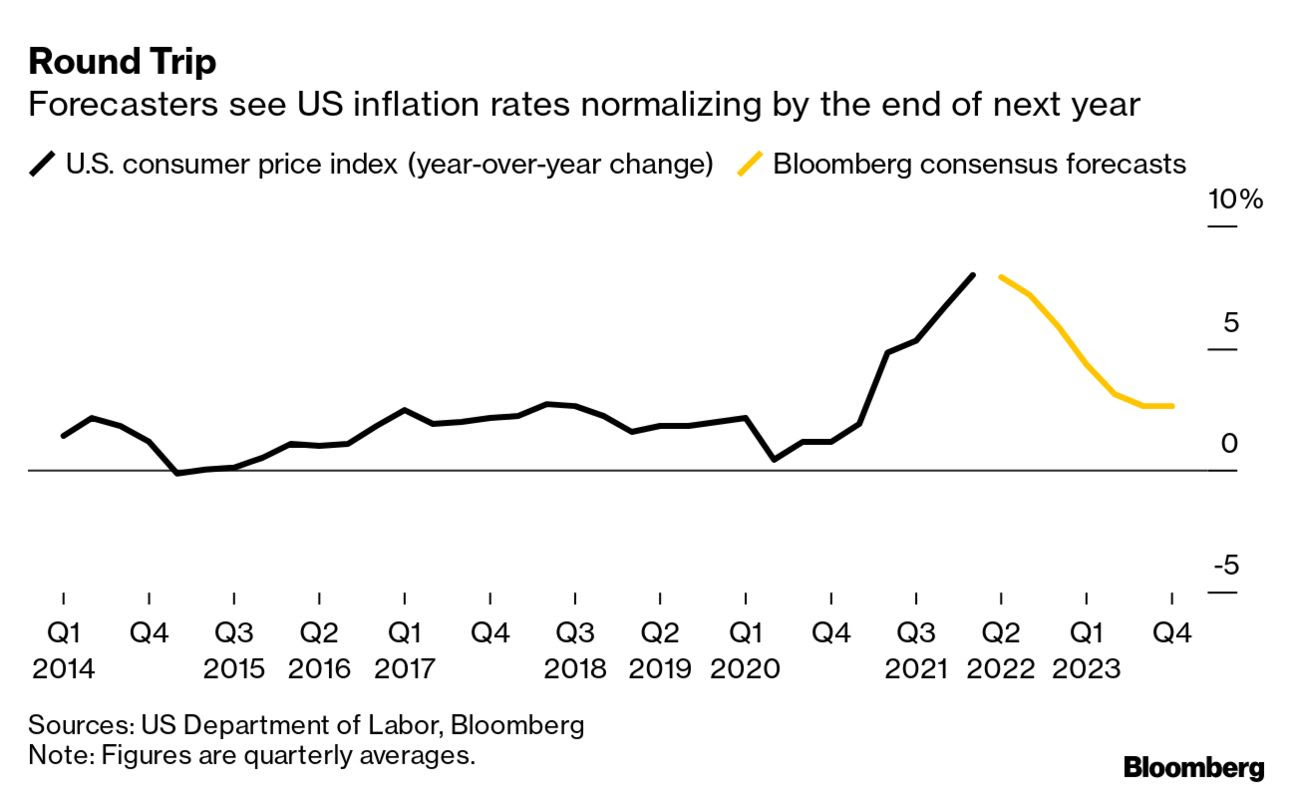
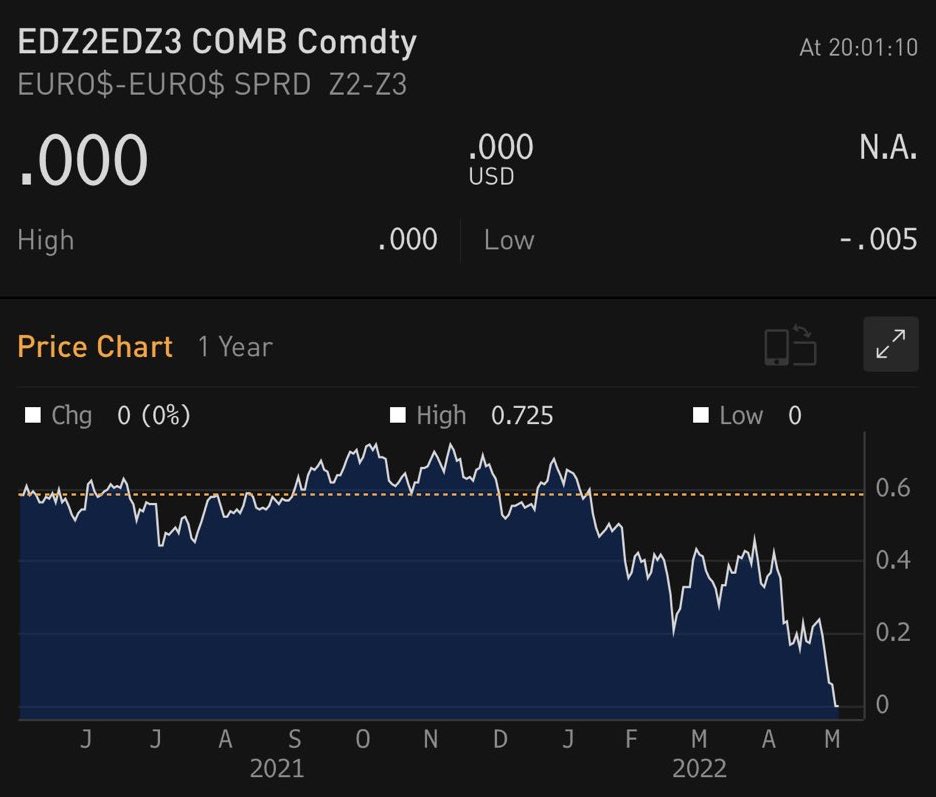
The peak in rates is somewhere in the 3.75-4.00% range out in early-to-mid 2023. Into that date range, there is a 100% the Fed will hike.
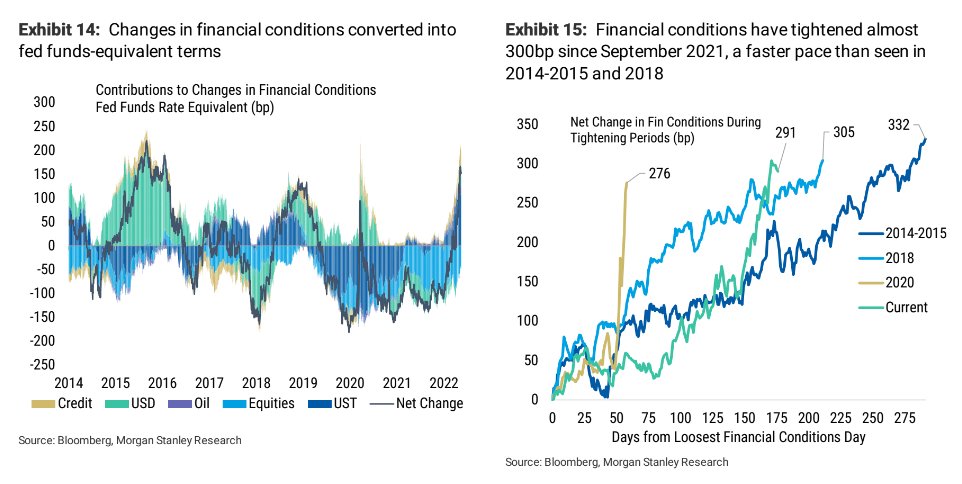
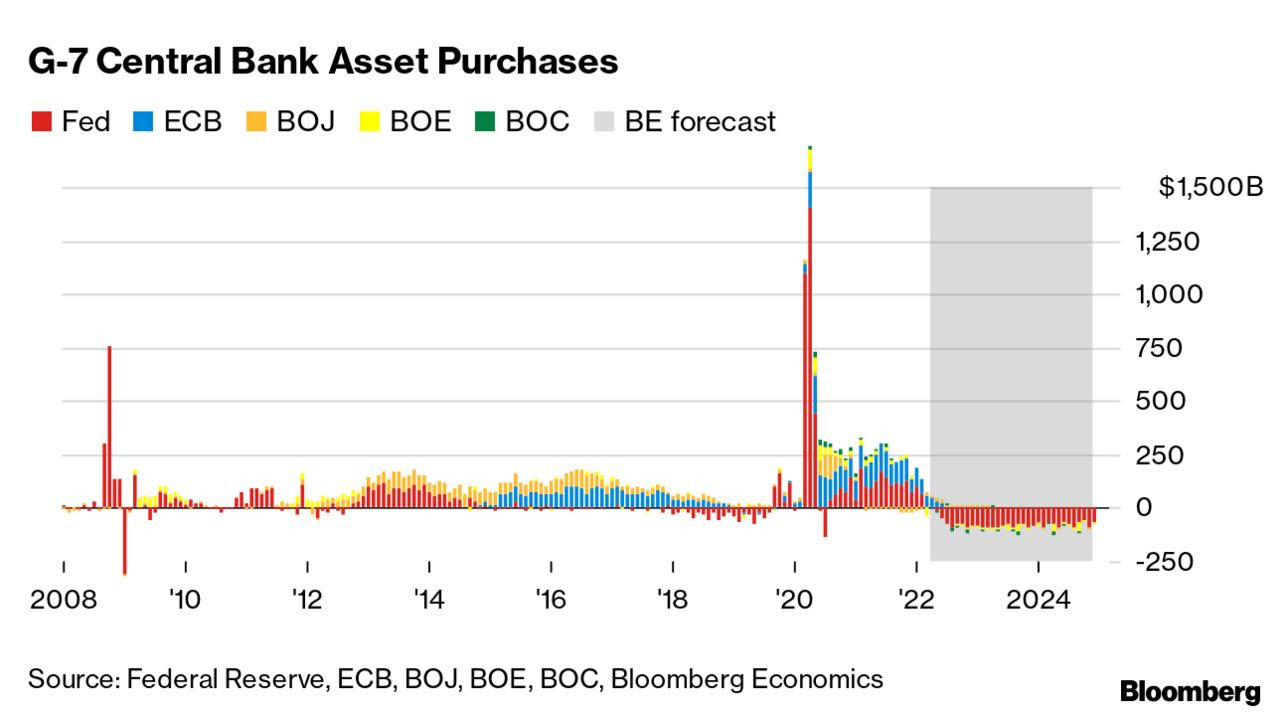
On the quantitative tightening (QT) side of things, which is the direct (out) flow of capital from capital markets, the Fed will stop reinvesting the proceeds of maturing Treasuries for the first time since the start of quantitative easing (QE).
Per the Financial Times, in May, FOMC members agreed to cap their monthly balance-sheet run-off at $30 billion in U.S. Treasuries (UST) and $17.5 billion for agency mortgage-backed securities (MBS).
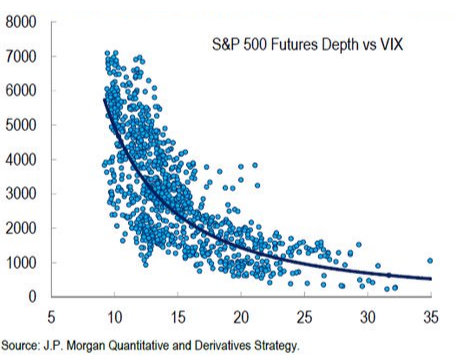
This will have an effect on prices “as liquidity – the ease with which investors can buy and sell assets – deteriorates as markets grapple with a larger amount of bond supply to absorb.”
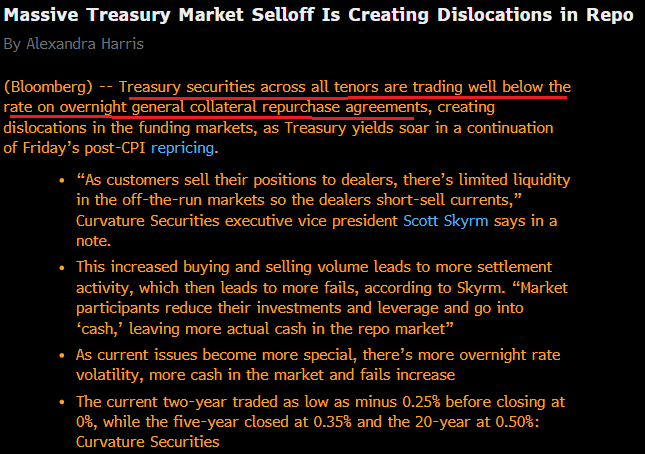
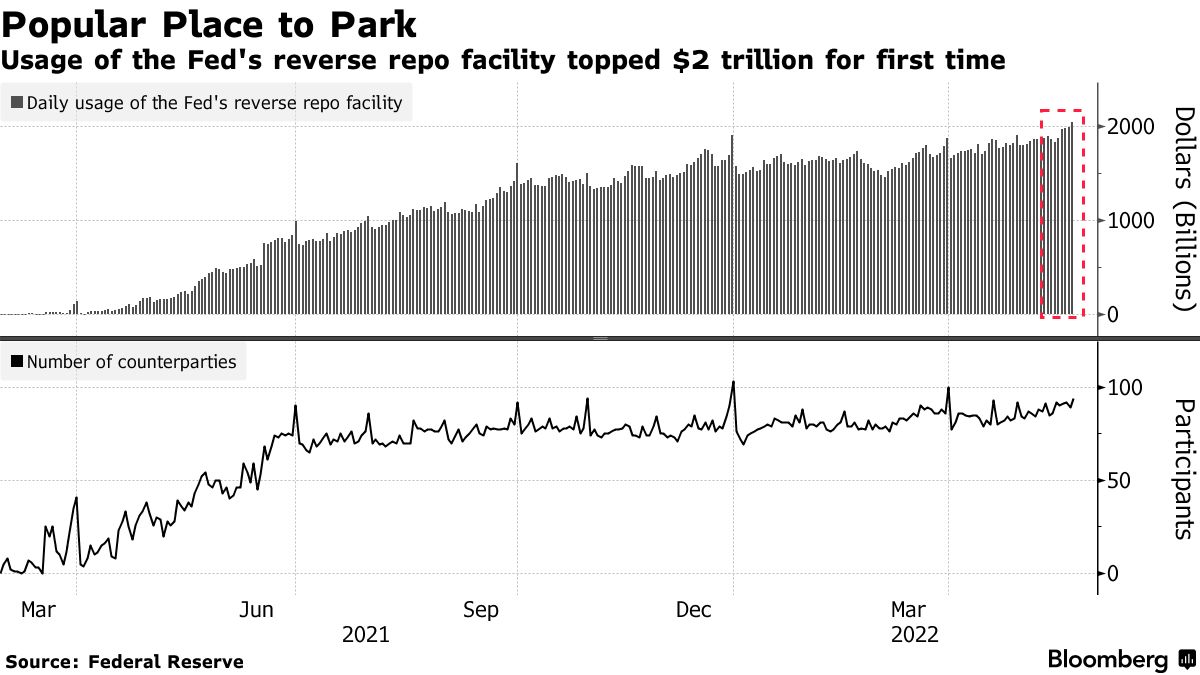
Moreover, in the recent sale of bonds, liquidity was “worse than it was leading up to Lehman,” and, accordingly, this has played into repo dislocations.
“As customers sell their position to dealers, there’s limited liquidity in the off-the-run markets so the dealers short-sell currents,” Scott Skyrm of Curvature Securities says on increased buys and sells leading to more settlement activity, which plays into more fails.
“Market participants reduce their investments and leverage and go into ‘cash,’ leaving more actual cash in the repo market.”
Therefore, Treasury securities, across all tenors, have traded below the rate on overnight general collateral repurchase agreements.
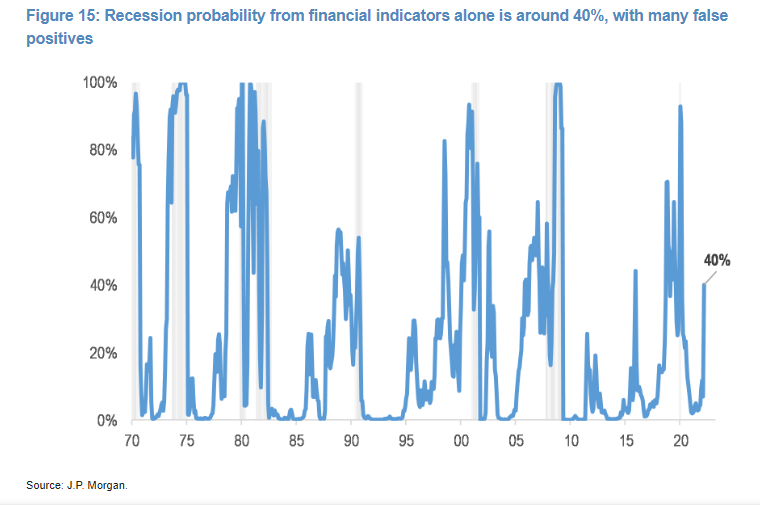
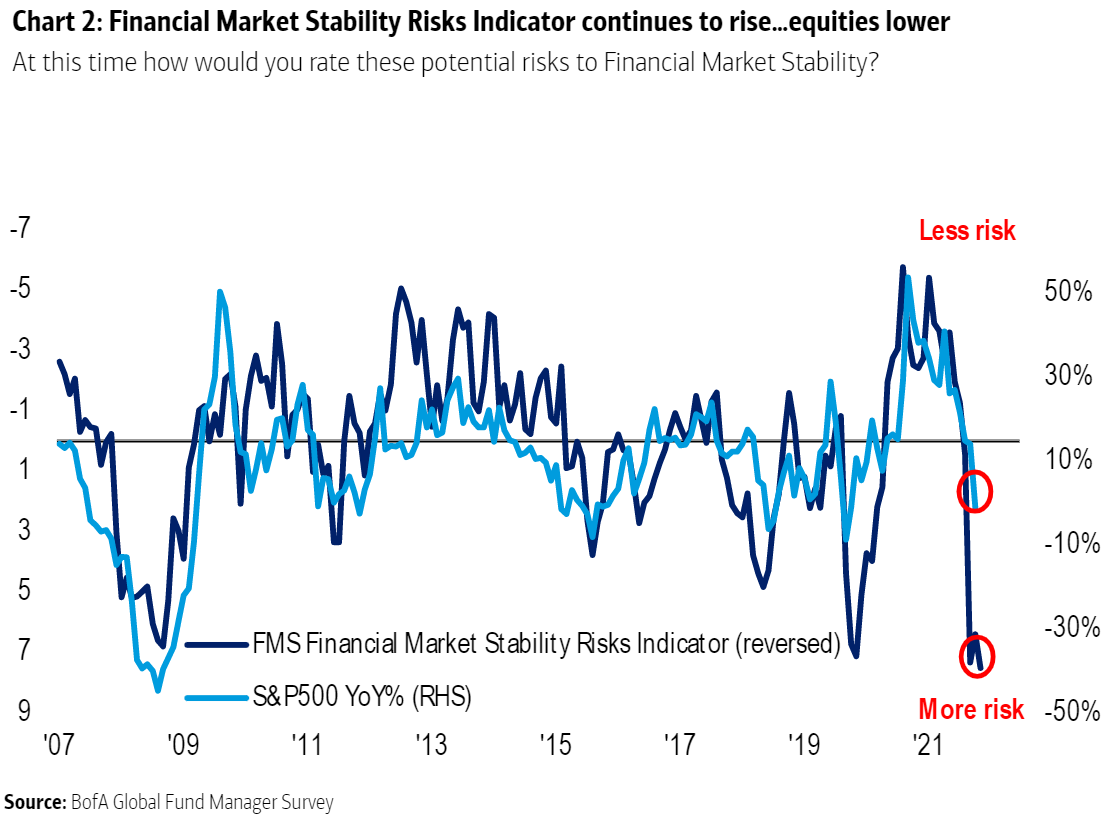
This could “be a sign of another shortage of collateral and that another systemic risk event might come up in the future,” as Fabian Wintersberger well explained in his newsletter.
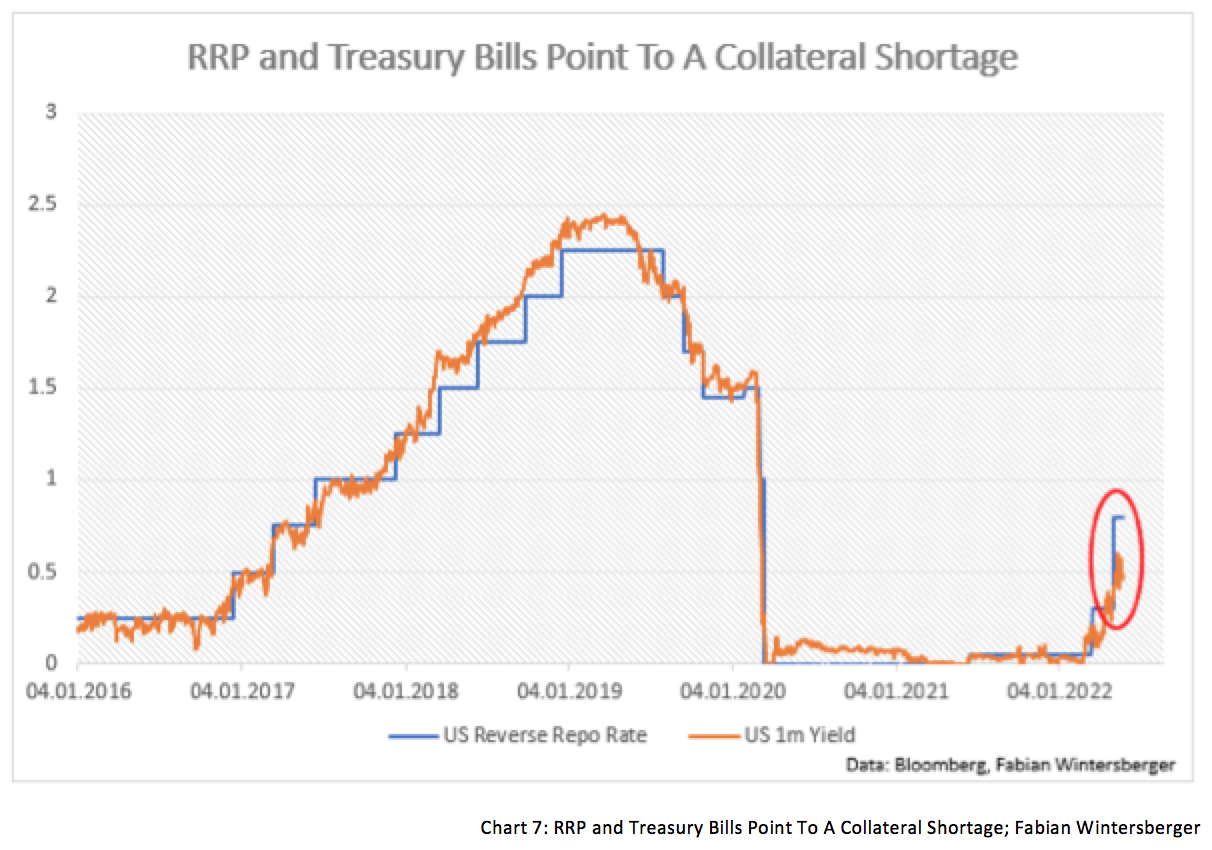
Wintersberger adds: “All those things suggest that the storm we are currently facing in markets is just the beginning. The war in Ukraine, a rising interest rate environment, energy costs that subdue the outlook for the real economy, and finally, signals of stress in financial markets imply that there might be tough times ahead.”
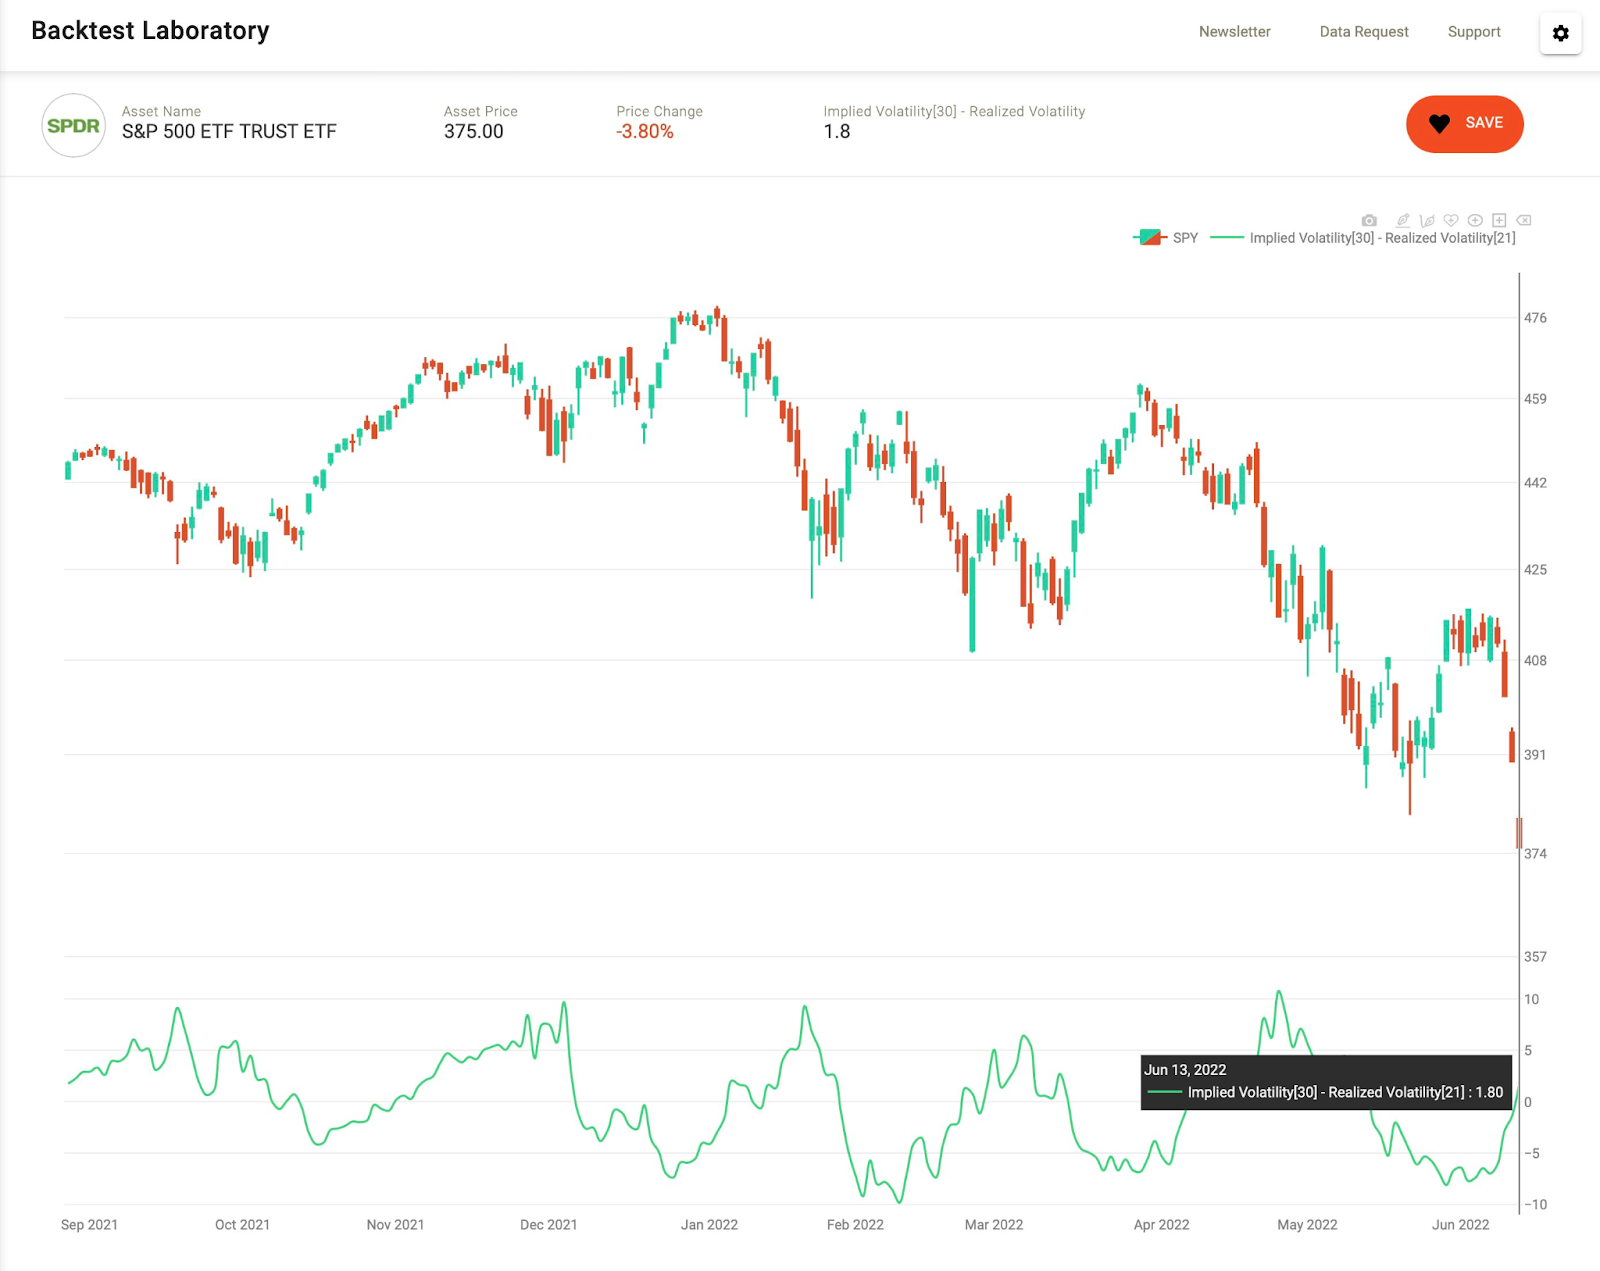
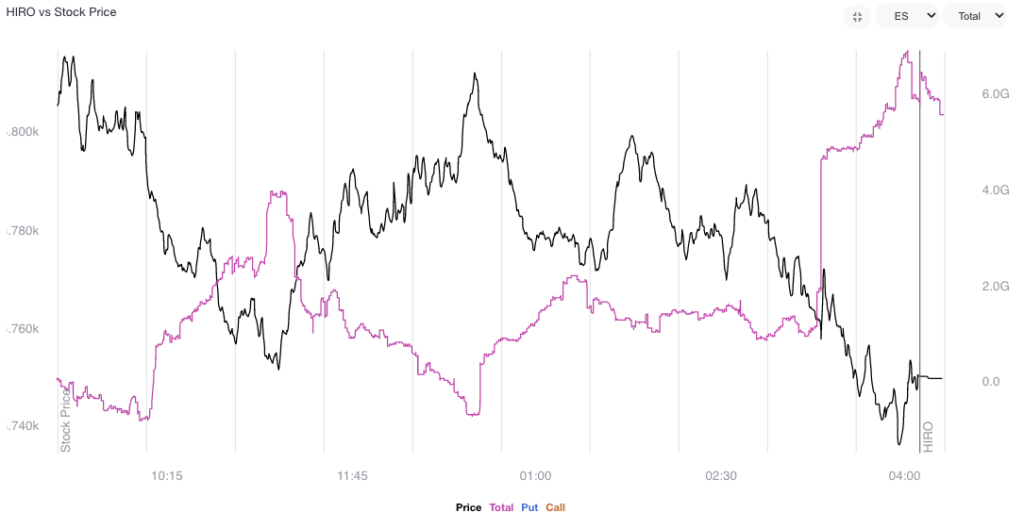
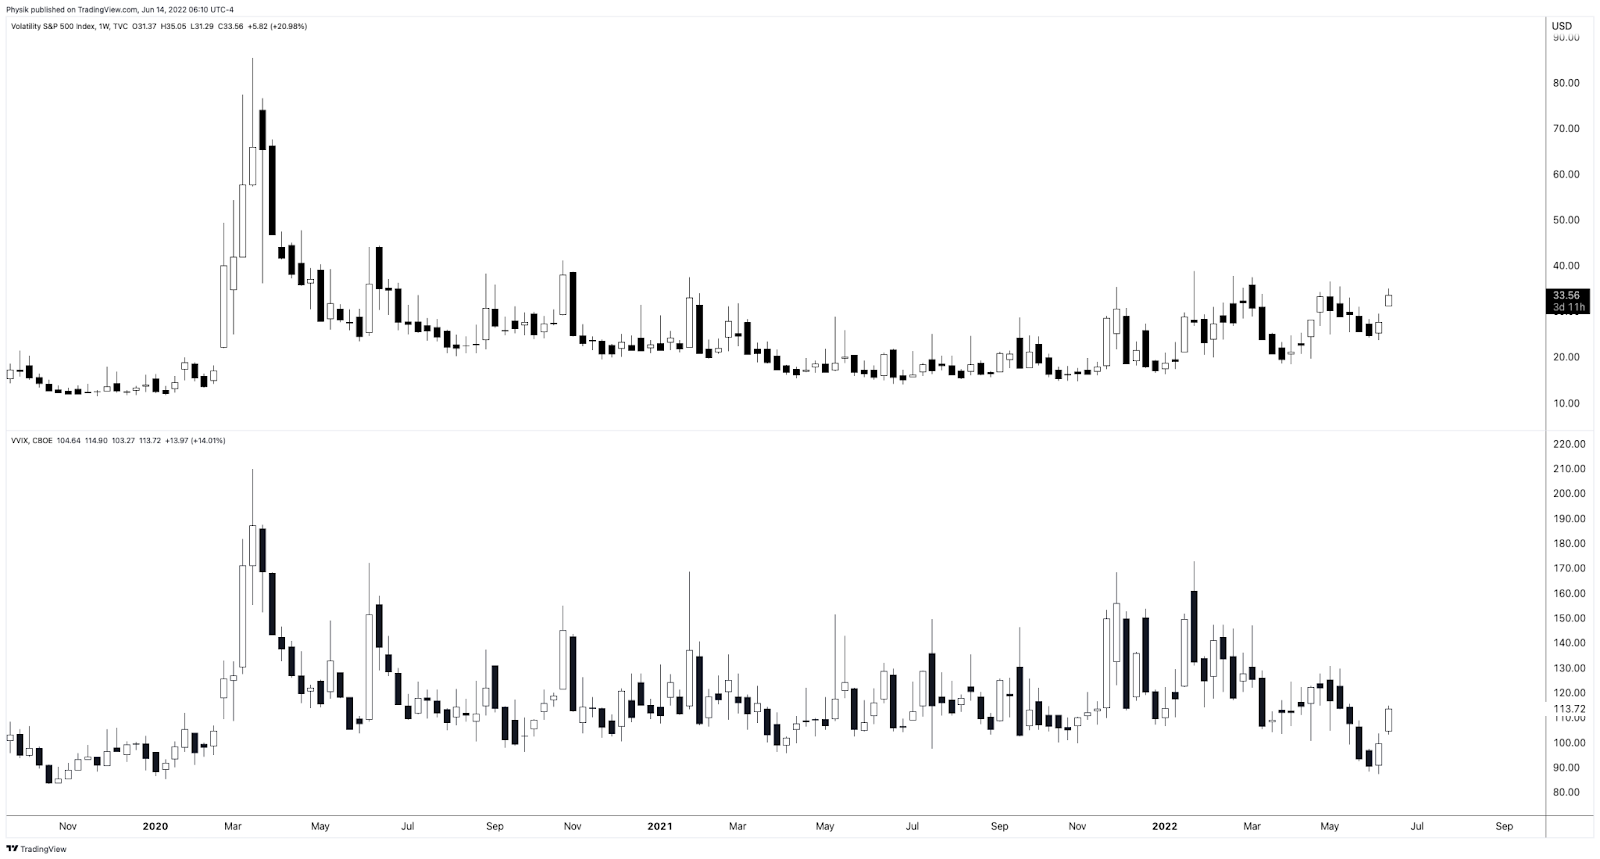
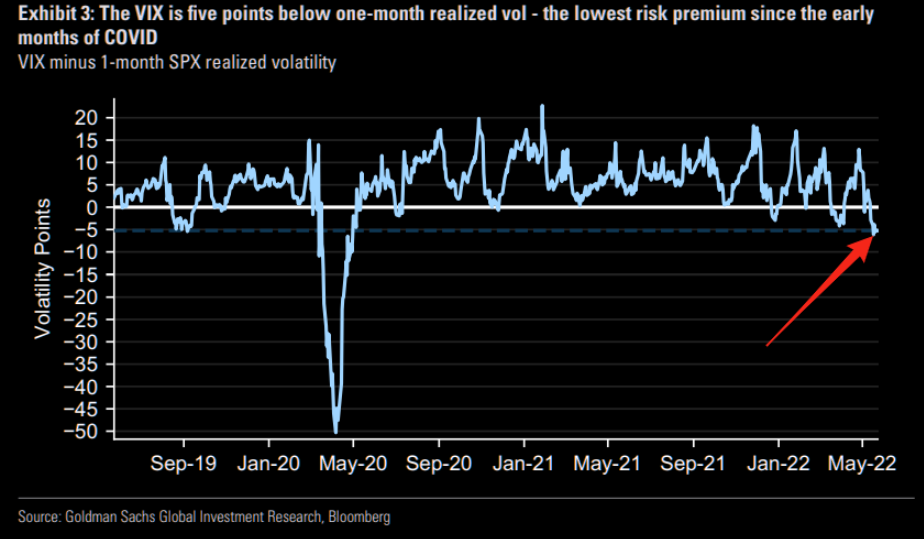
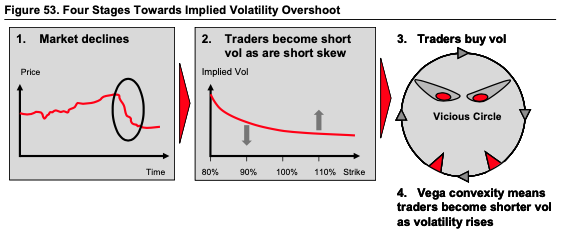
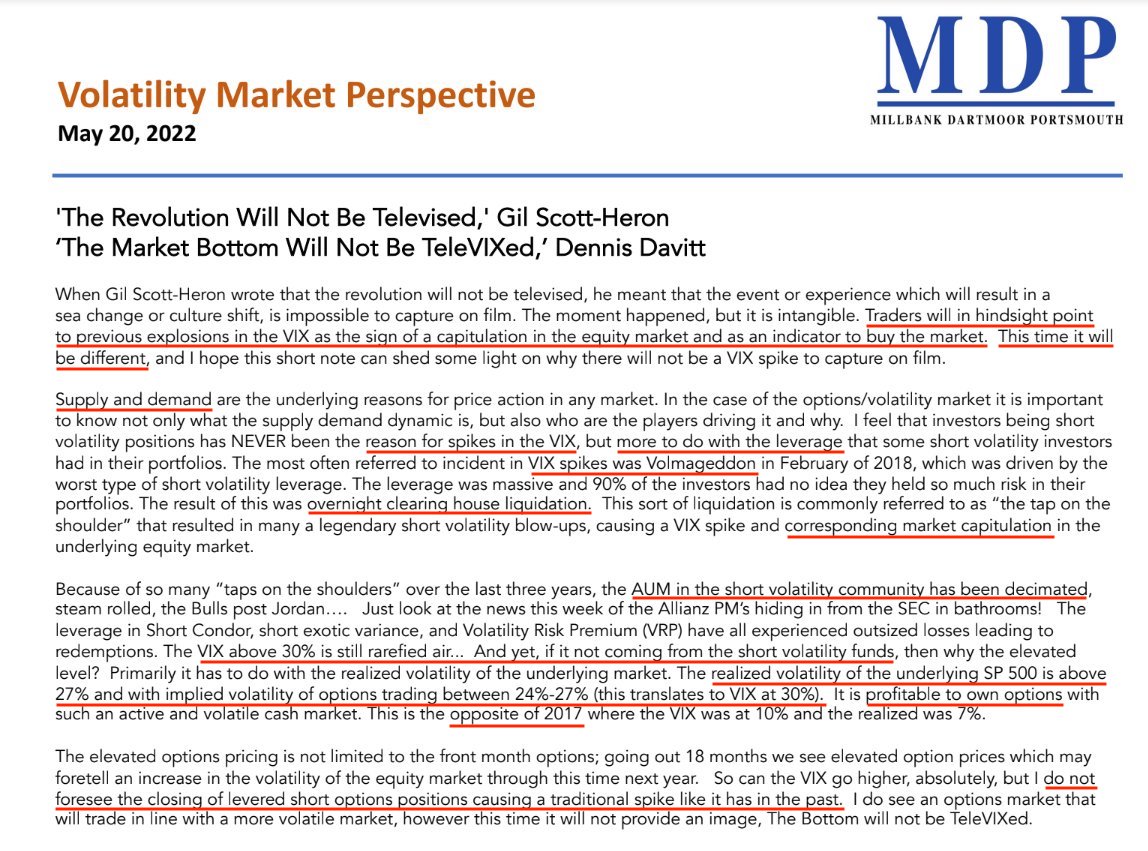
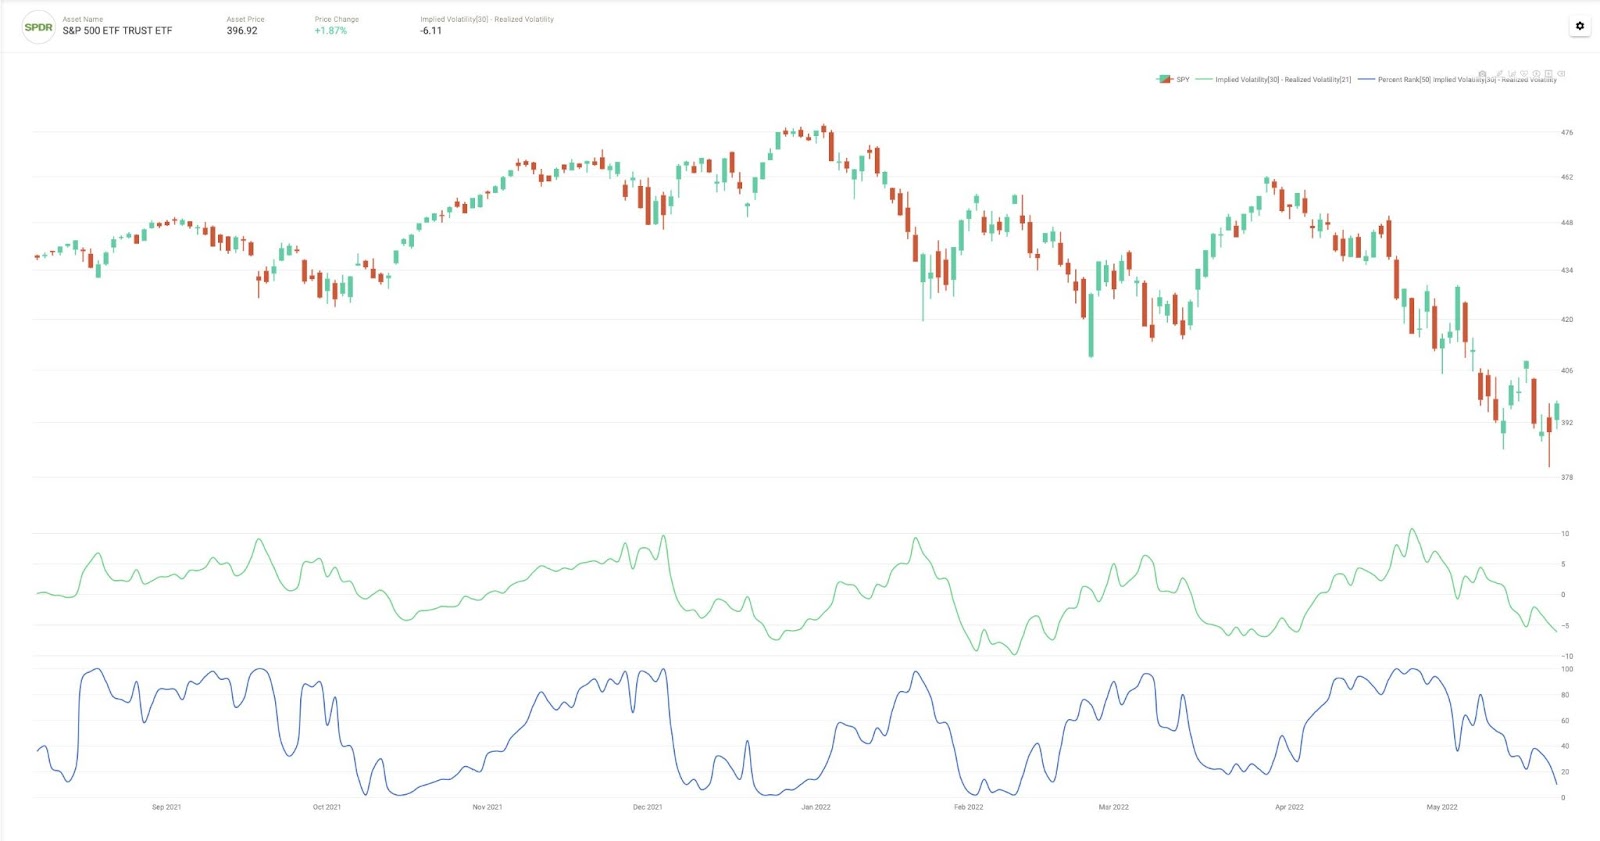
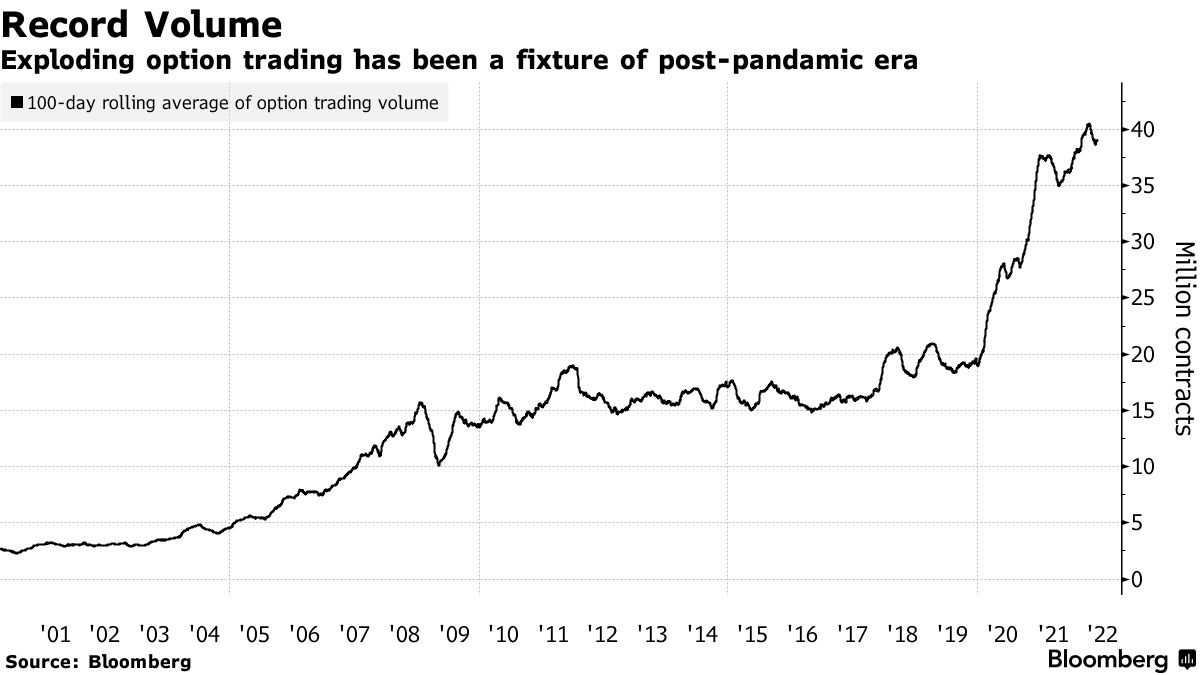
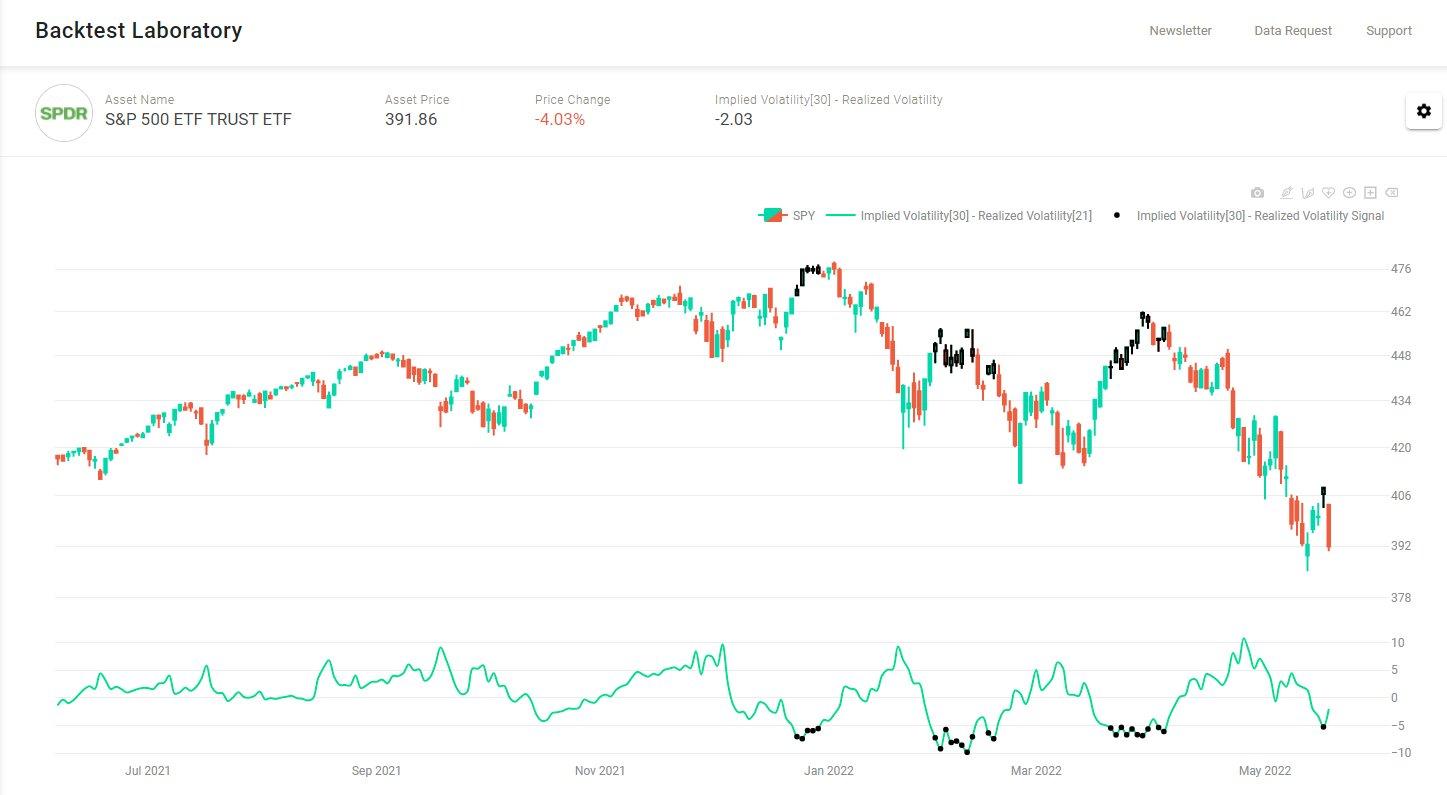
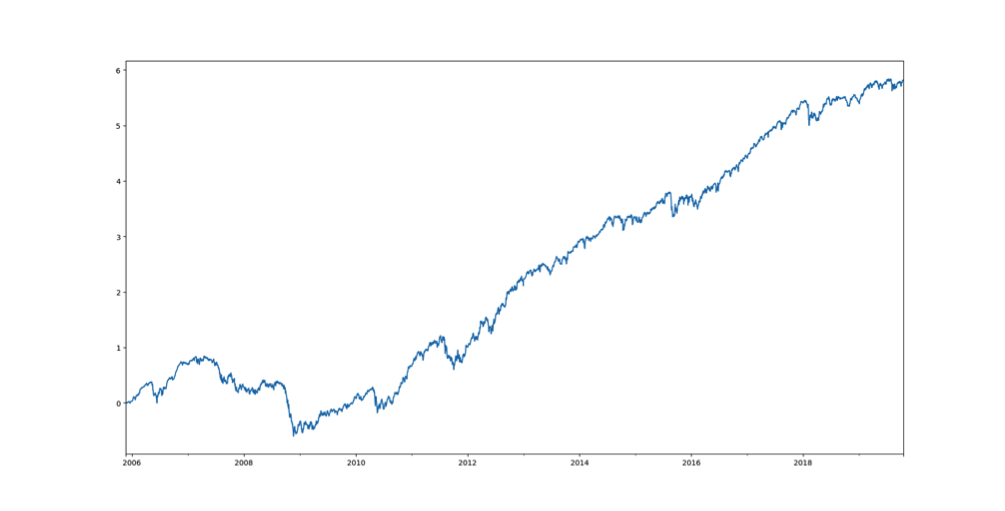
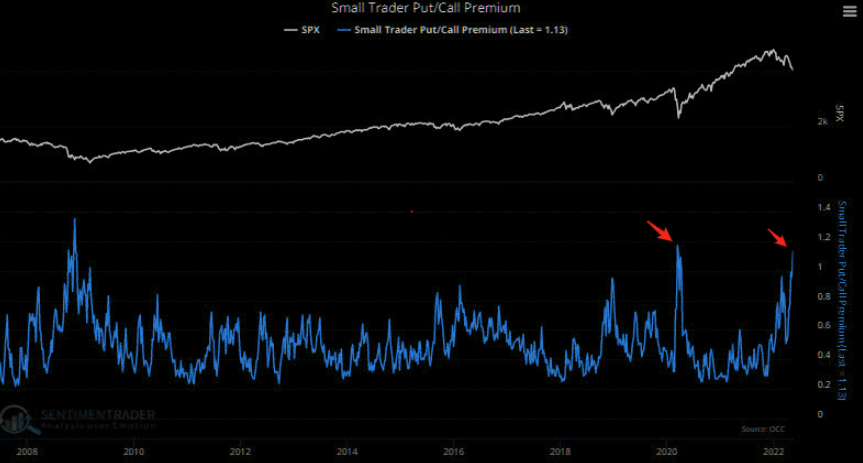
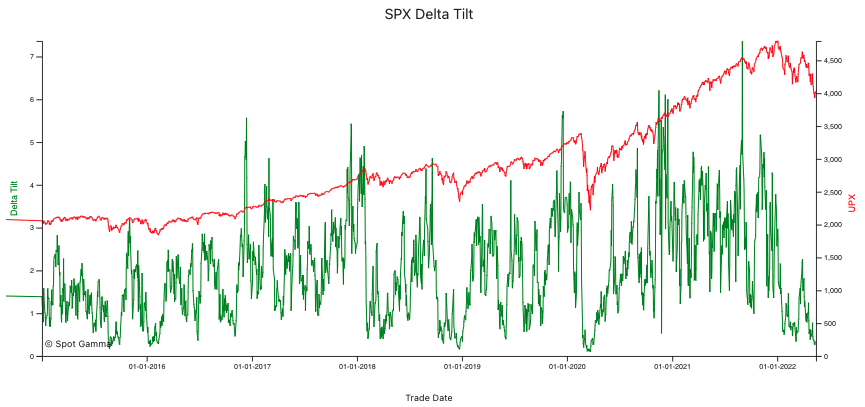
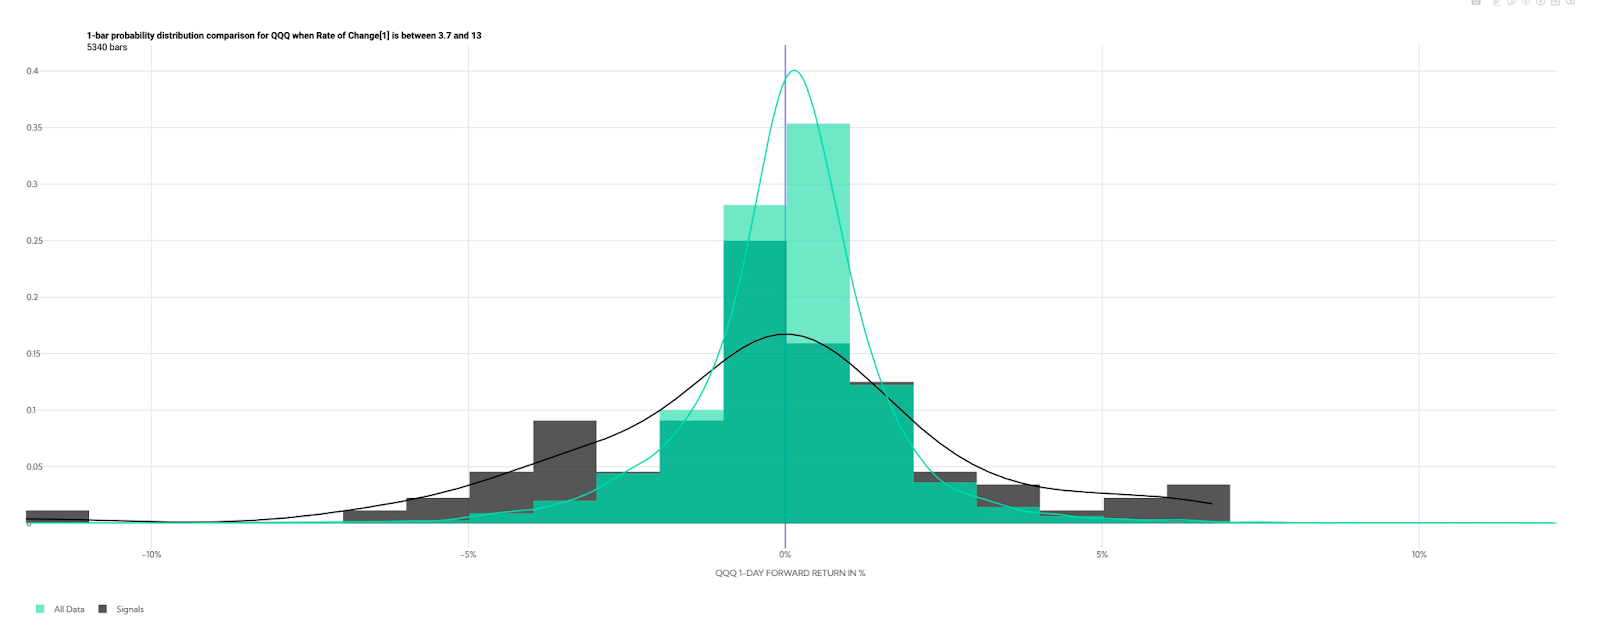
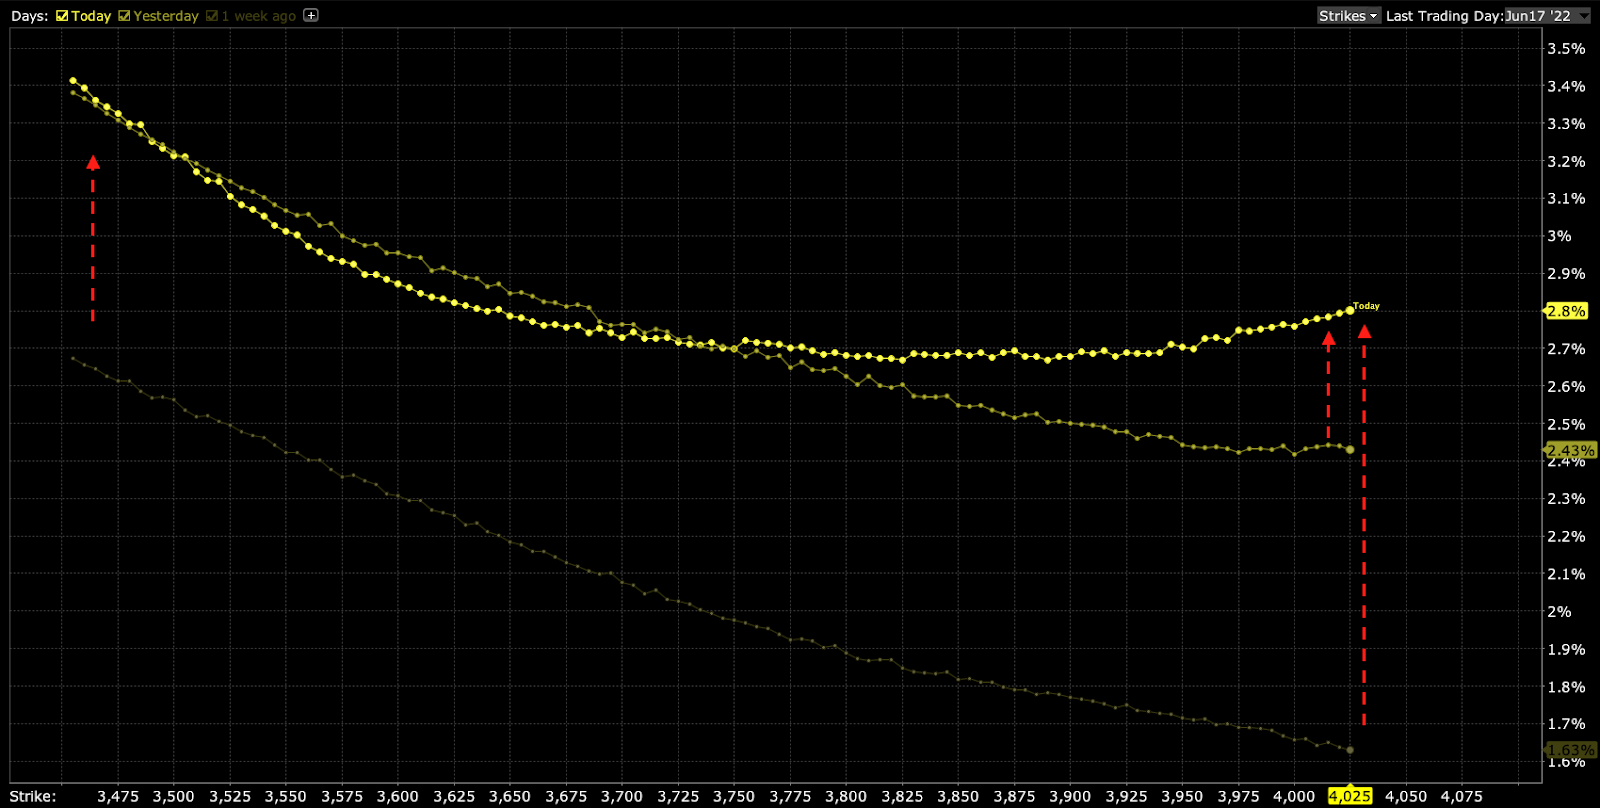
Positioning: The divergence in volatility implied (IVOL) by participants’ options activity, versus that which the market realizes (RVOL) was resolved.

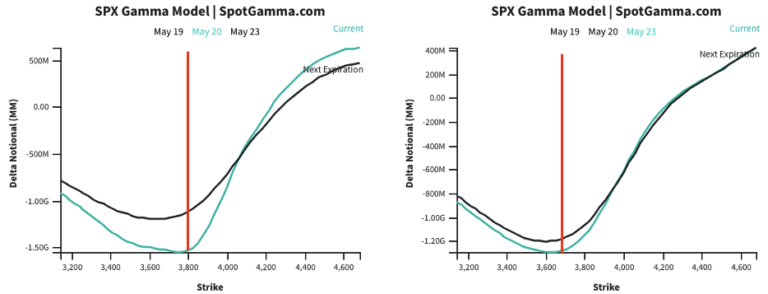
As I wrote in my commentary for options data and analysis platform SpotGamma, yesterday, pursuant to remarks made in Physik Invest’s recent letters, volatility repriced and that was a boon for participants who bought into the implied skew convexity idea.
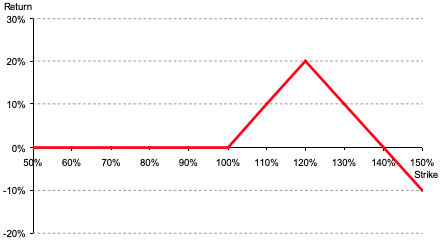
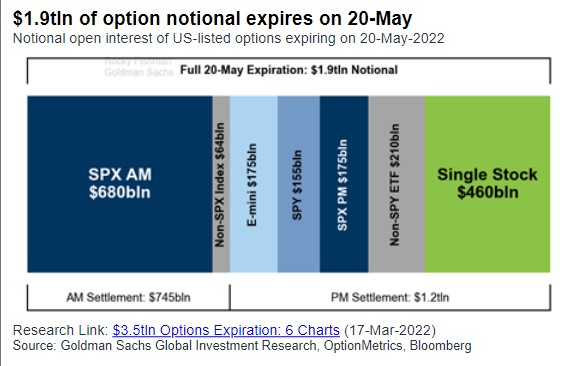
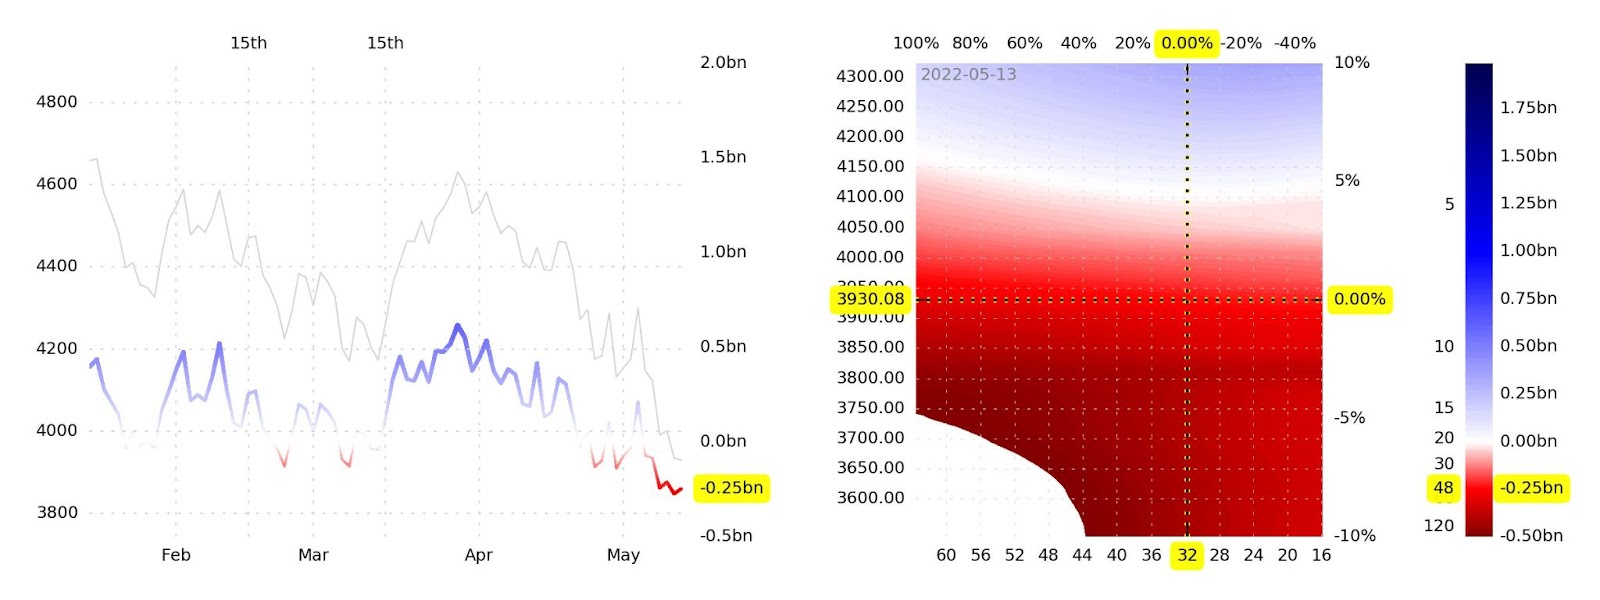
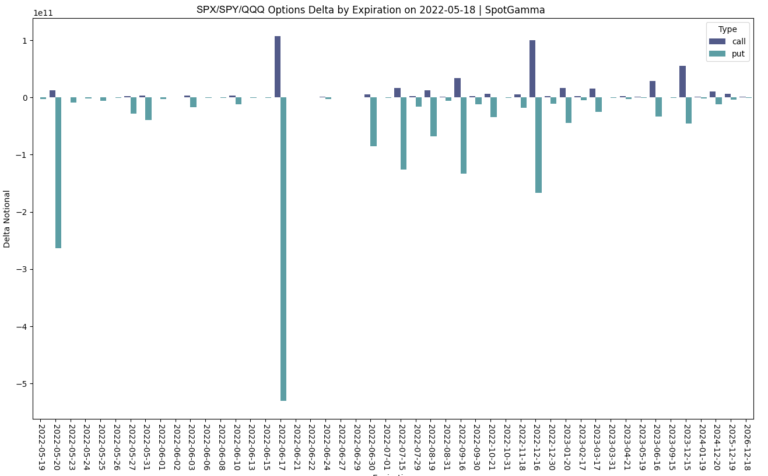
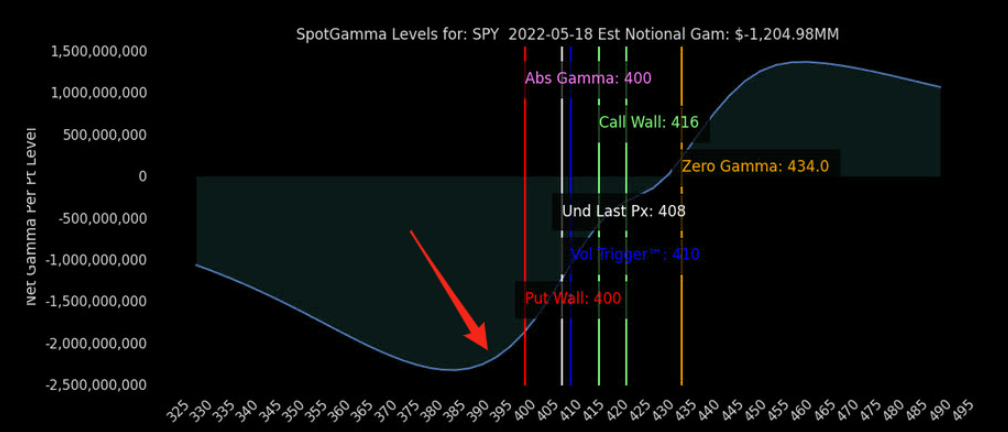
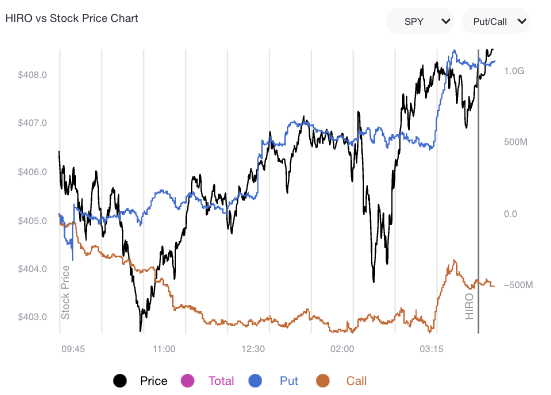
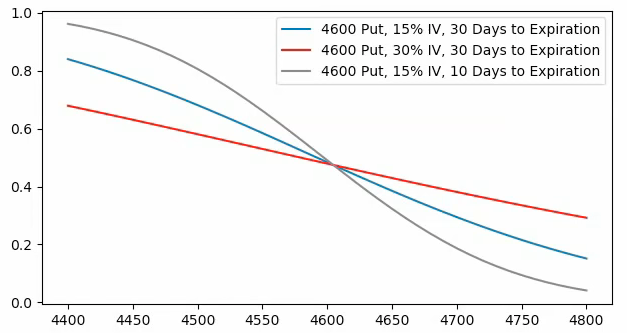
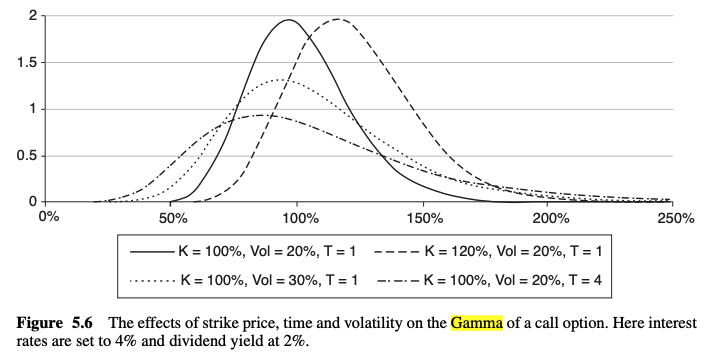
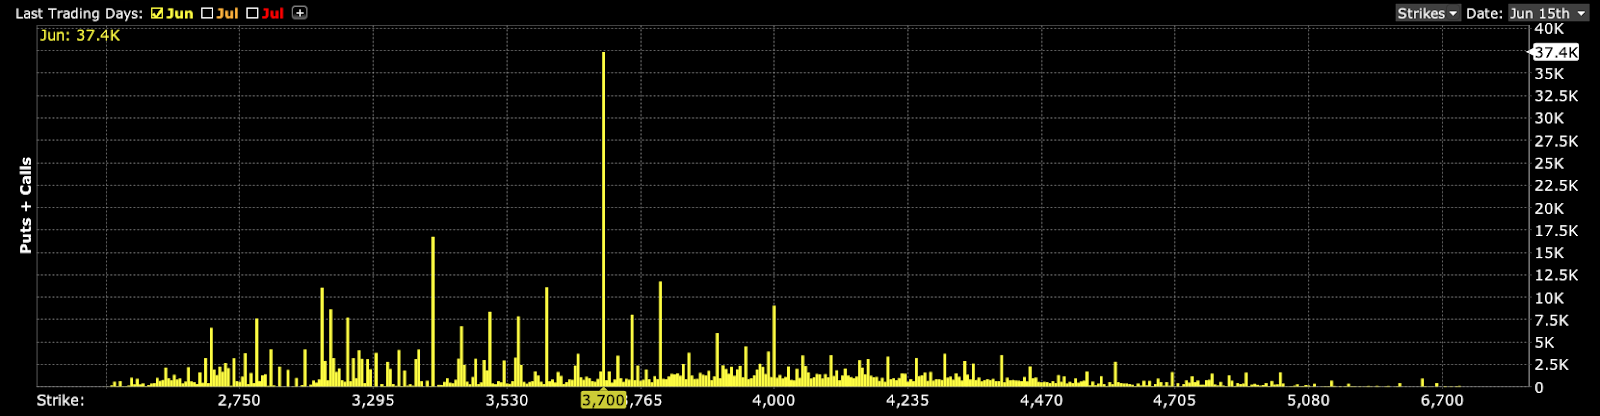
Moreover, $3,700.00 SPX is a key level, per SpotGamma. This is because there is sizeable interest at that level expiring June 17, after FOMC. These options have little time to expiry and, thus, their gamma (options sensitivity to direction) grows rather large, at near-the-money strikes.
In theory, we see participants as owning protection against their stock exposures. Therefore, the counterparties are short puts (positive delta) and short stock or futures (negative delta).
As the time to expiry narrows, above the strike in question delta decays, and counterparts buy back their static delta hedges.
As the time to expiry narrows, below the strike in question delta expands and counterparts sell more static delta to hedge.

That means, depending on what happens with FOMC, if below $3,700.00, associated hedging, less any new reach for protection would pressure markets lower. If above $3,700.00, hedging, less any new sale of protection, would bolster markets higher.
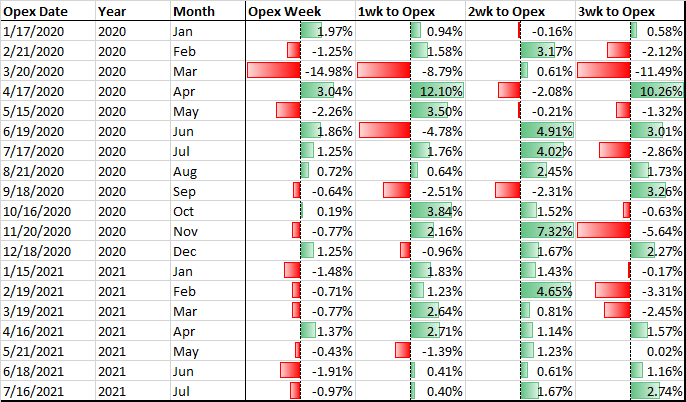
If lower, all else equal, the June 17 options expiration will coincide with the removal of the in-the-money options exposures in question. This opens a window during which markets may have less pressure to rally against.
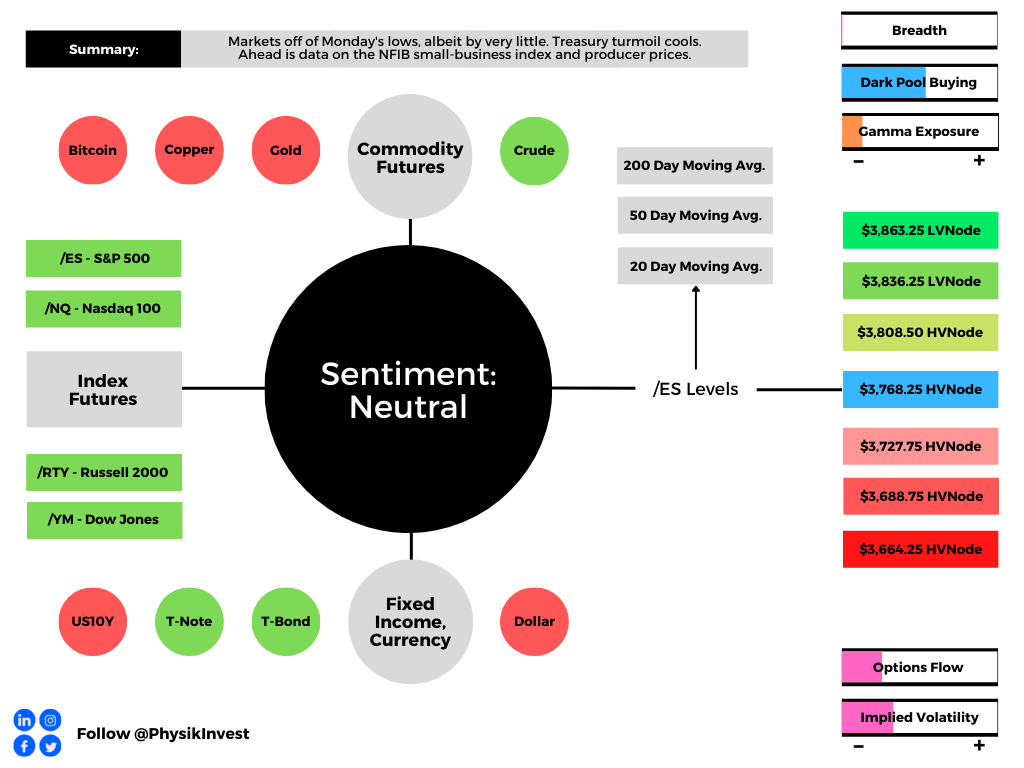
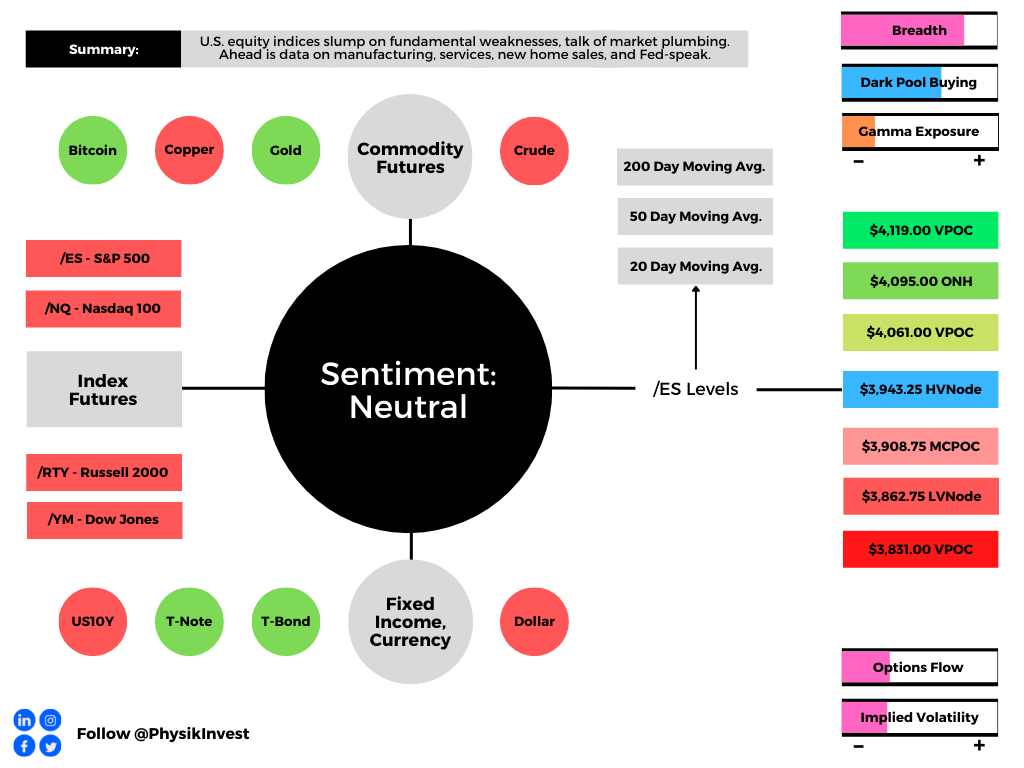
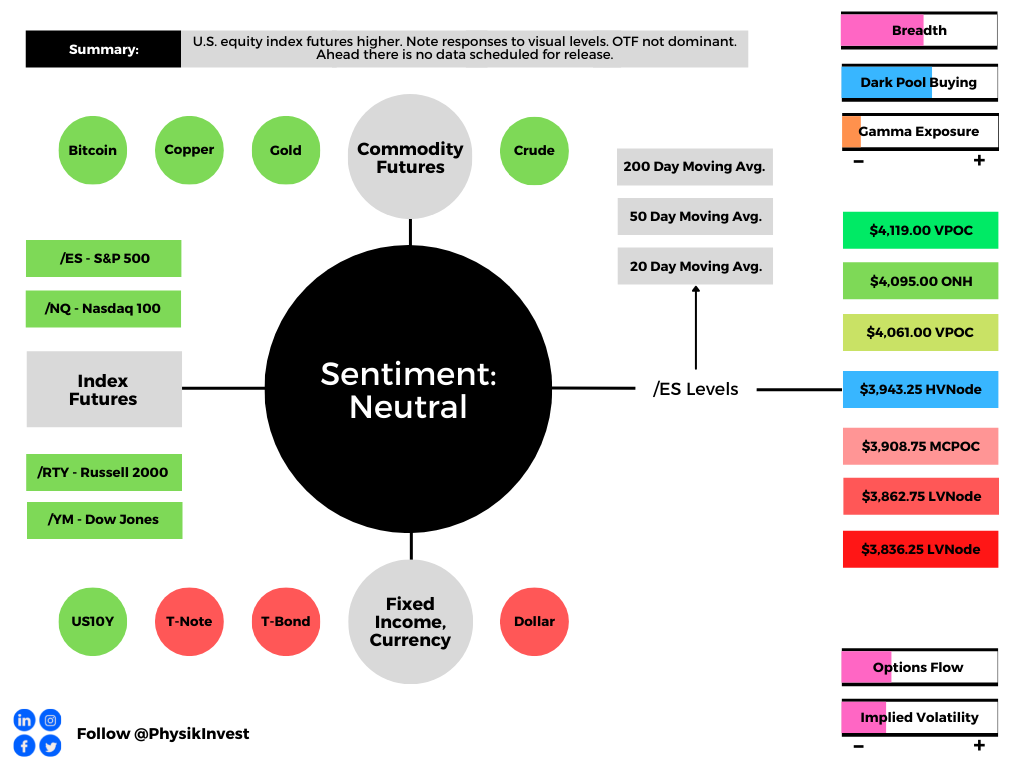
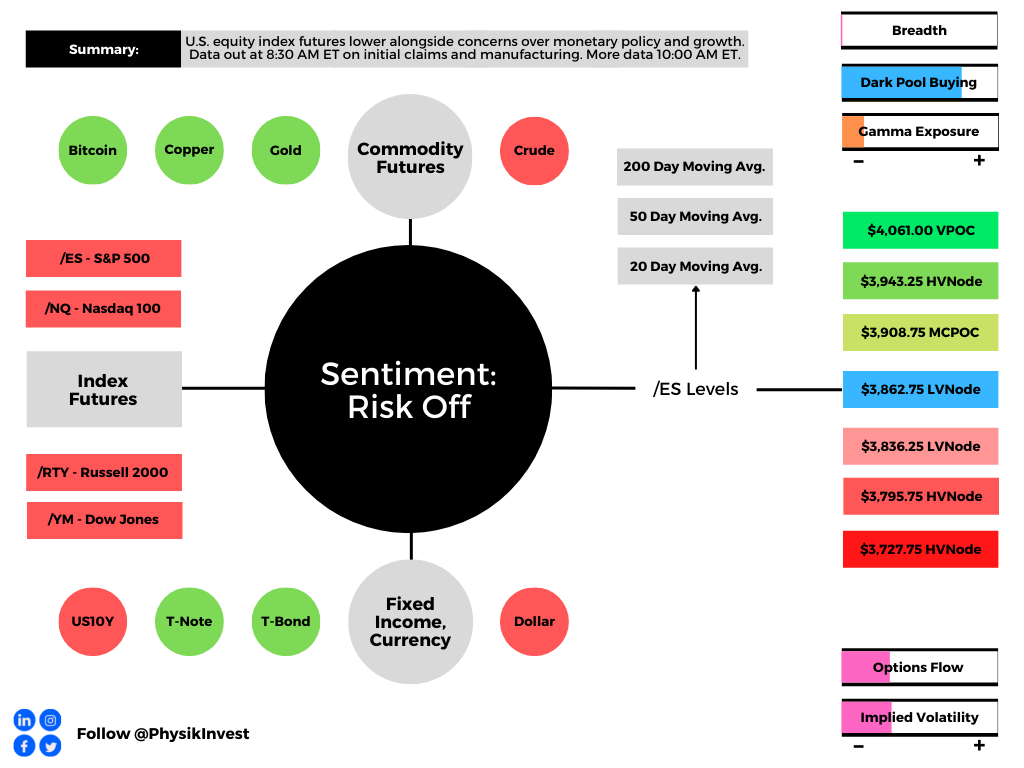
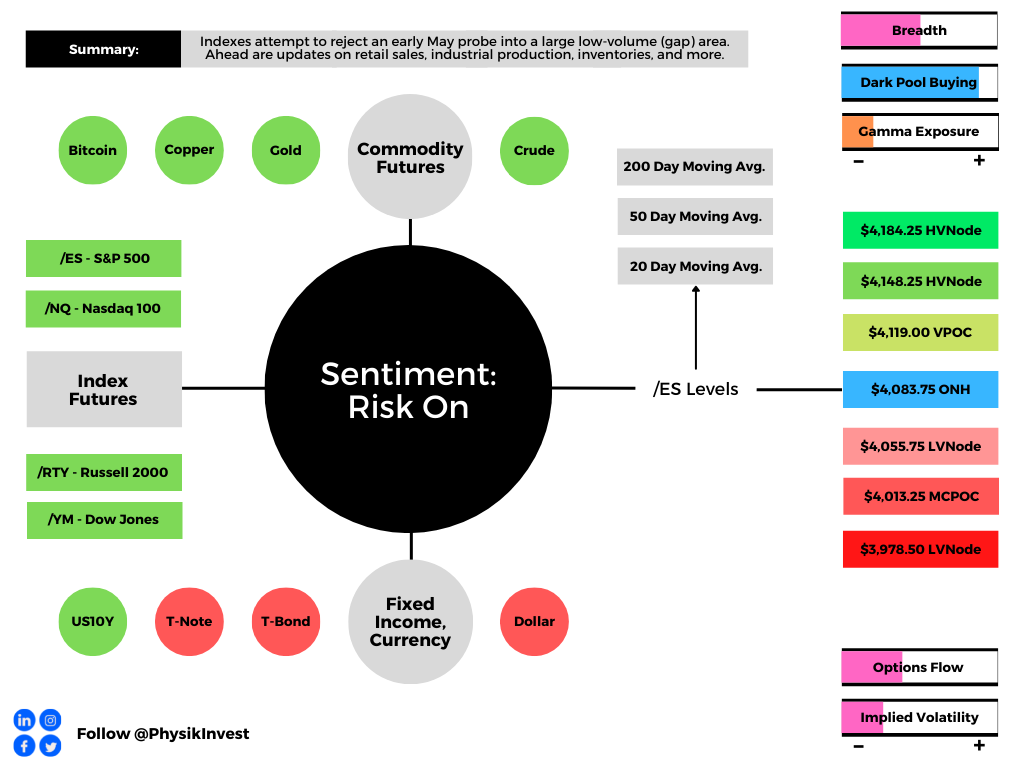
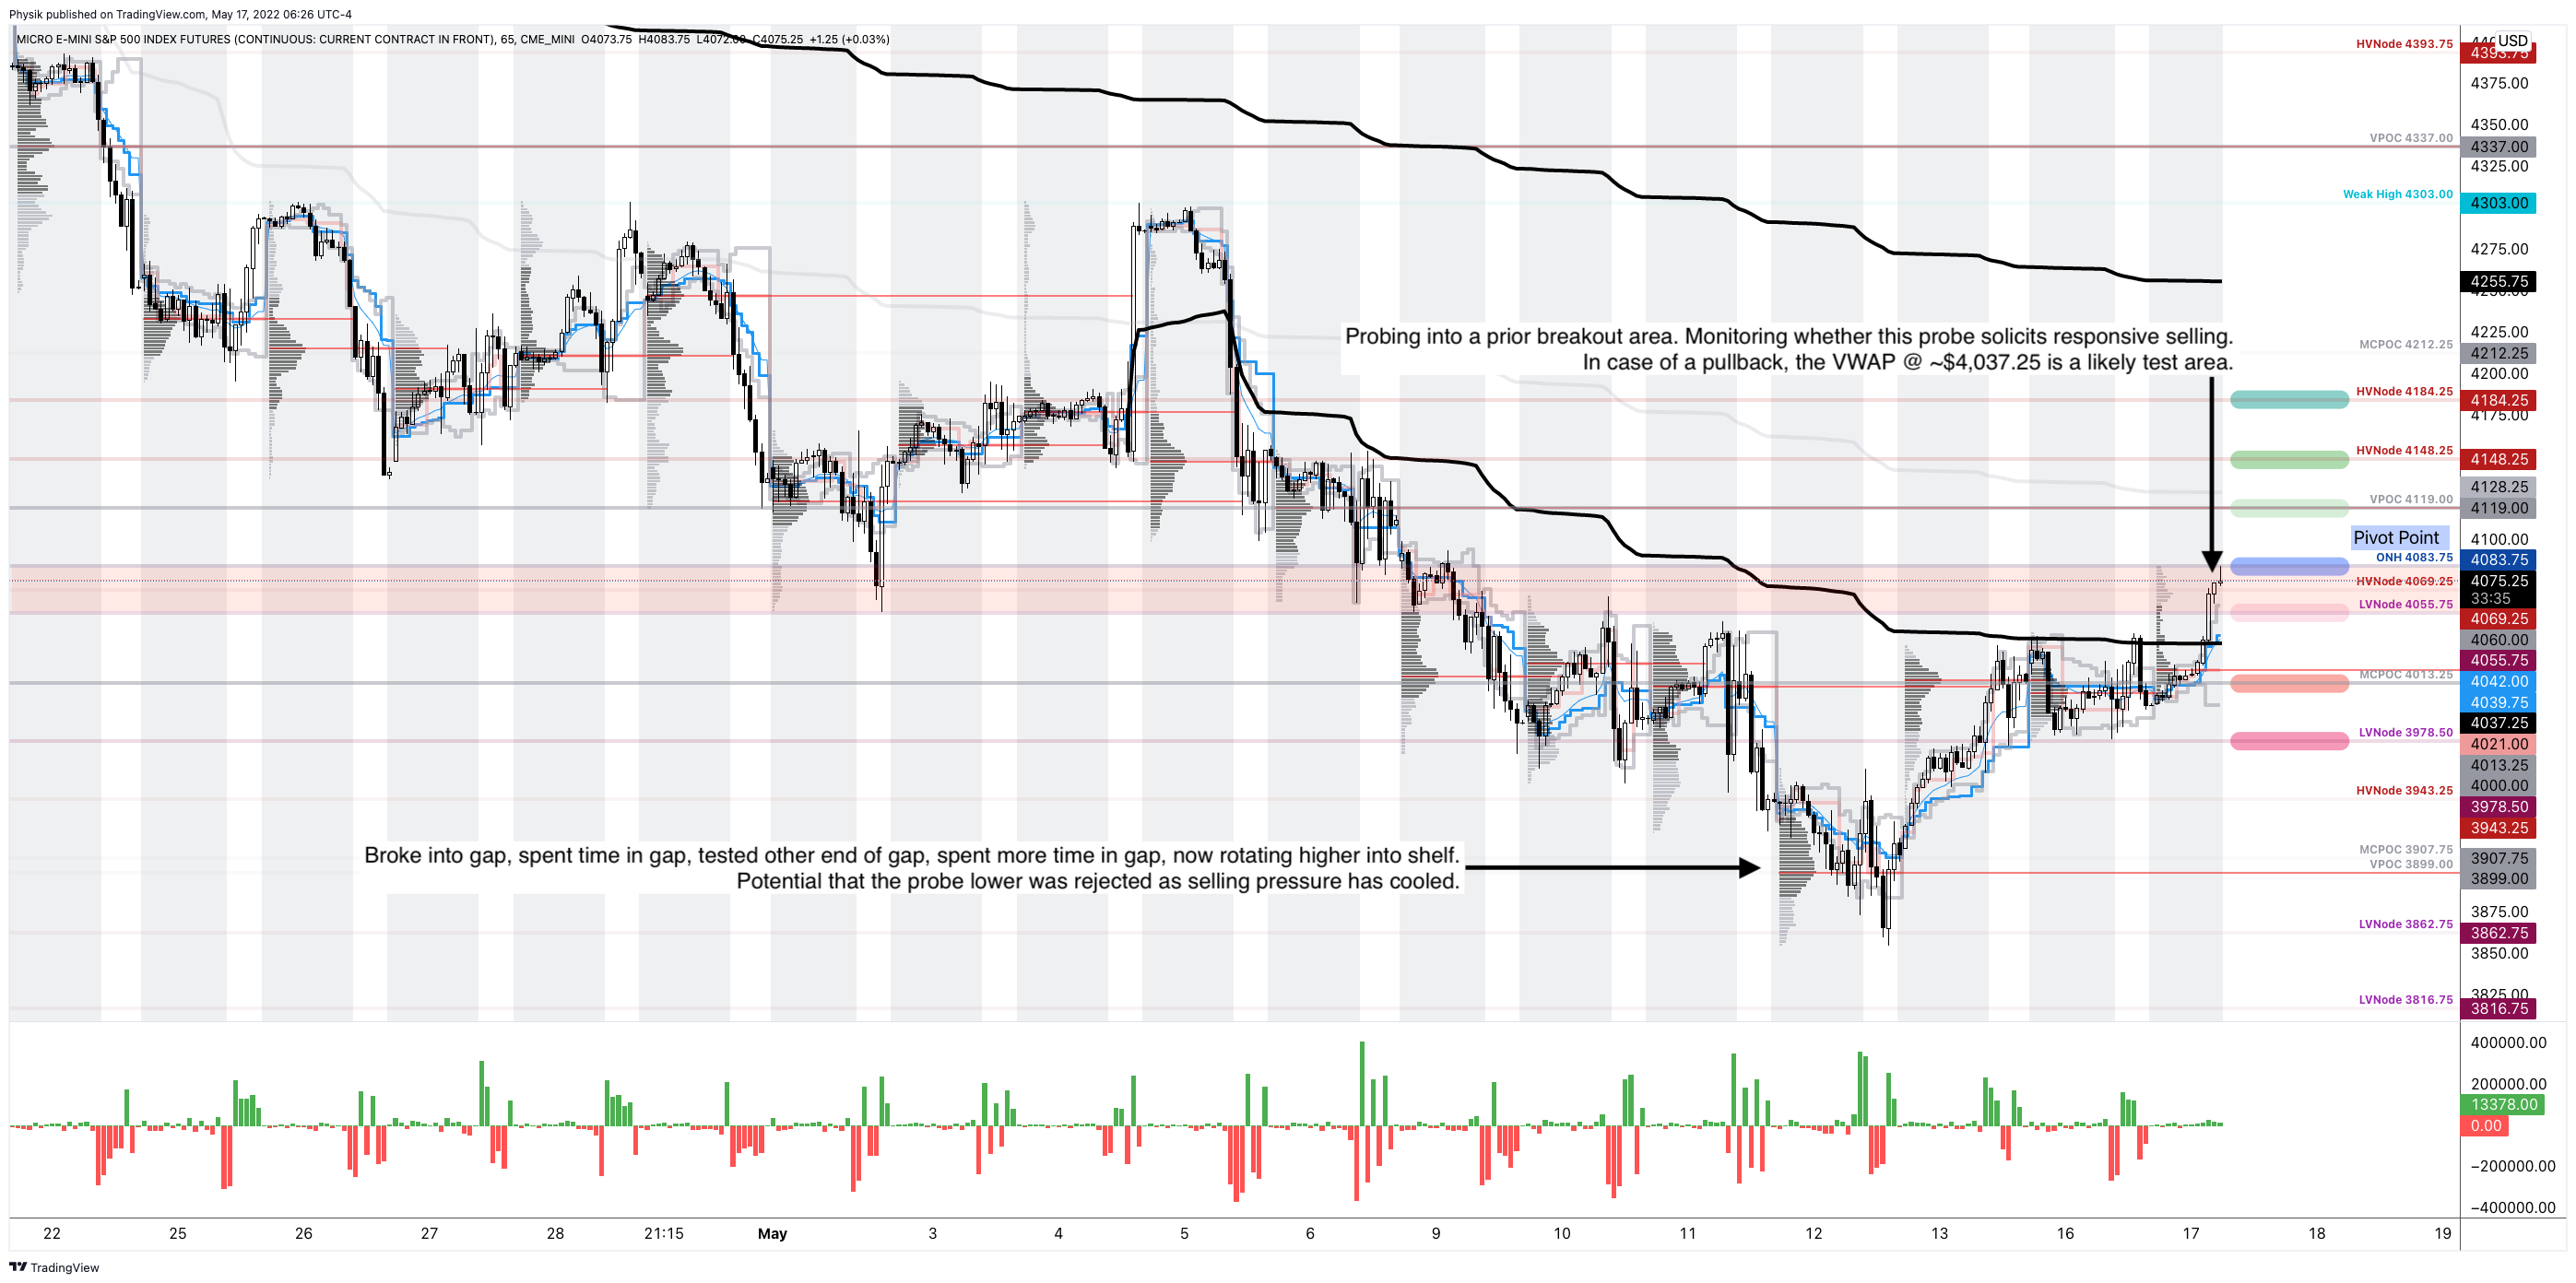
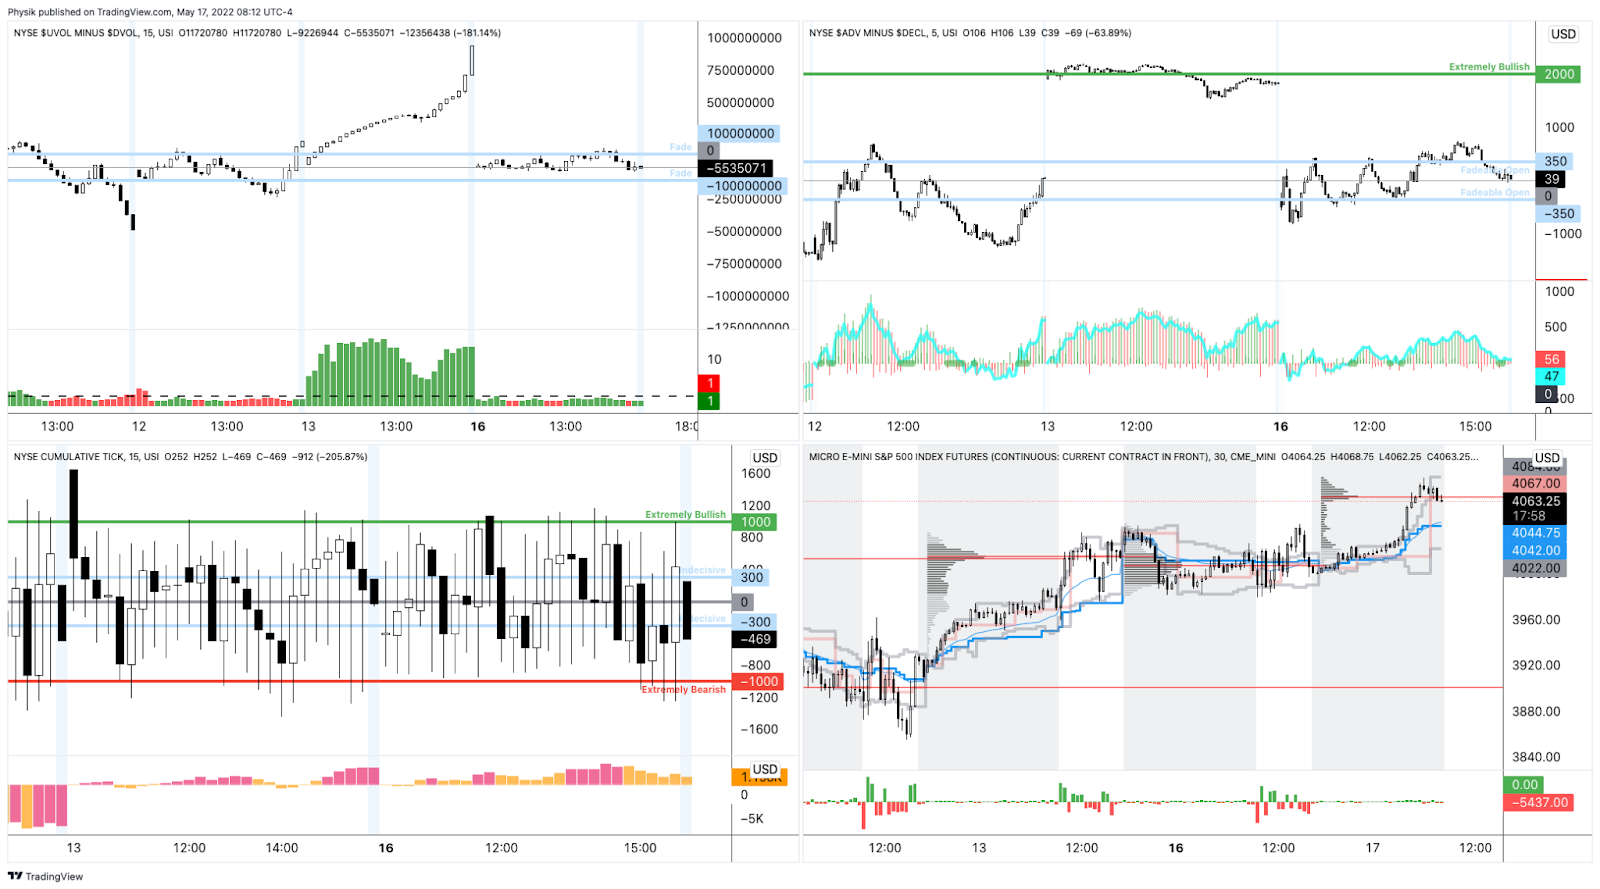
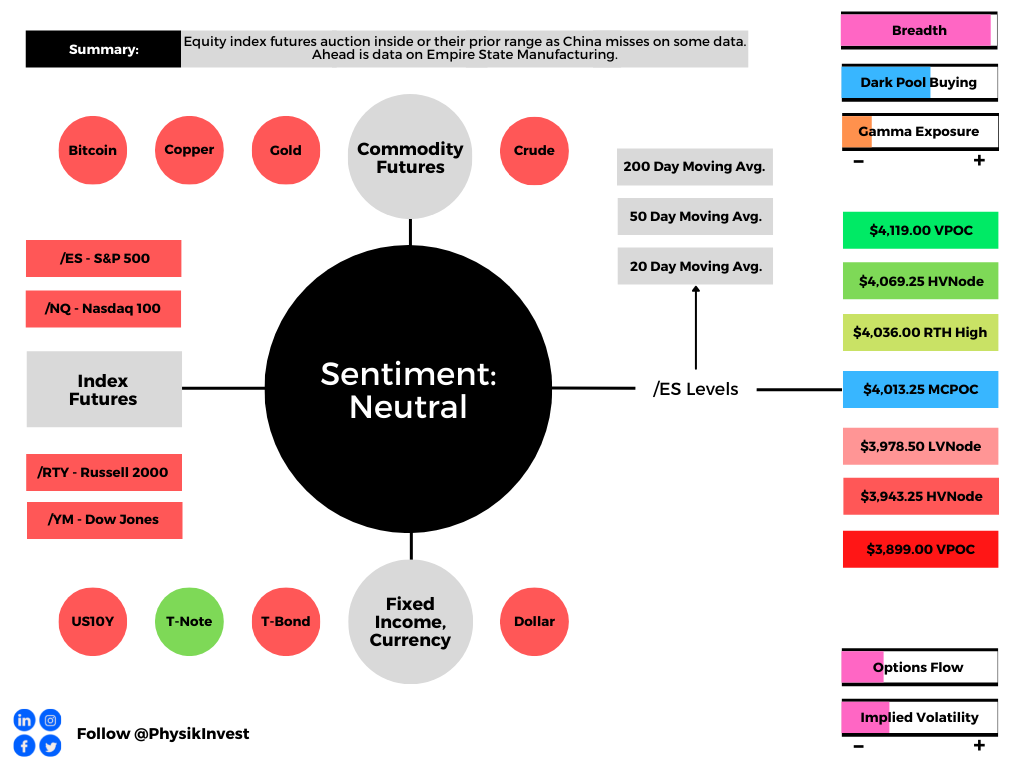
Technical: As of 6:30 AM ET, Wednesday’s regular session (9:30 AM – 4:00 PM ET), in the S&P 500, will likely open in the lower part of a positively skewed overnight inventory, inside of prior-range and -value, suggesting a limited potential for immediate directional opportunity.
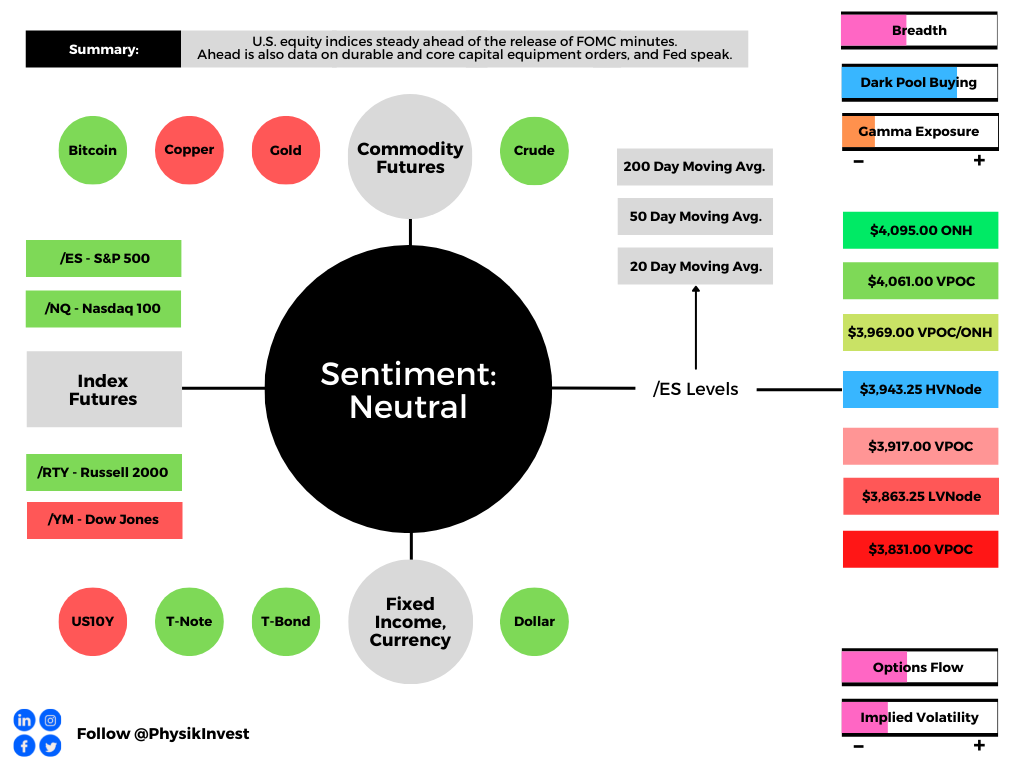
In the best case, the S&P 500 trades higher; activity above the $3,768.25 HVNode puts in play the $3,808.50 HVNode. Initiative trade beyond the $3,808.50 HVNode could reach as high as the $3,836.25 LVNode and $3,863.25 LVNode, or higher.
In the worst case, the S&P 500 trades lower; activity below the $3,768.25 HVnode puts in play the $3,727.75 HVNode. Initiative trade beyond the $3,727.75 HVNode could reach as low as the $3,688.75 and $3,664.25 HVNode, or lower.
Click here to load today’s key levels into the web-based TradingView charting platform. Note that all levels are derived using the 65-minute timeframe. New links are produced, daily.

Definitions
Should the market trend for long periods of time, it will lack sound structure, identified as low volume areas (LVNodes). LVNodes denote directional conviction and ought to offer support on any test.
If participants were to auction and find acceptance into areas of prior low volume (LVNodes), then future discovery ought to be volatile and quick as participants look to HVNodes for favorable entry or exit.
Point Of Control: POCs are valuable as they denote areas where two-sided trade was most prevalent in a prior day session. Participants will respond to future tests of value as they offer favorable entry and exit.
Micro Composite Point Of Control: POCs are valuable as they denote areas where two-sided trade was most prevalent over numerous day sessions. Participants will respond to future tests of value as they offer favorable entry and exit.
Volume-Weighted Average Prices (VWAPs): A metric highly regarded by chief investment officers, among other participants, for quality of trade. Additionally, liquidity algorithms are benchmarked and programmed to buy and sell around VWAPs.
About
After years of self-education, strategy development, mentorship, and trial-and-error, Renato Leonard Capelj began trading full-time and founded Physik Invest to detail his methods, research, and performance in the markets.
Capelj also develops insights around impactful options market dynamics at SpotGamma and is a Benzinga reporter.
Some of his works include conversations with ARK Invest’s Catherine Wood, investors Kevin O’Leary and John Chambers, FTX’s Sam Bankman-Fried, Kai Volatility’s Cem Karsan, The Ambrus Group’s Kris Sidial, among many others.
Disclaimer
In no way should the materials herein be construed as advice. Derivatives carry a substantial risk of loss. All content is for informational purposes only.