The daily brief is a free glimpse into the prevailing fundamental and technical drivers of U.S. equity market products. Join the 850+ that read this report daily, below!
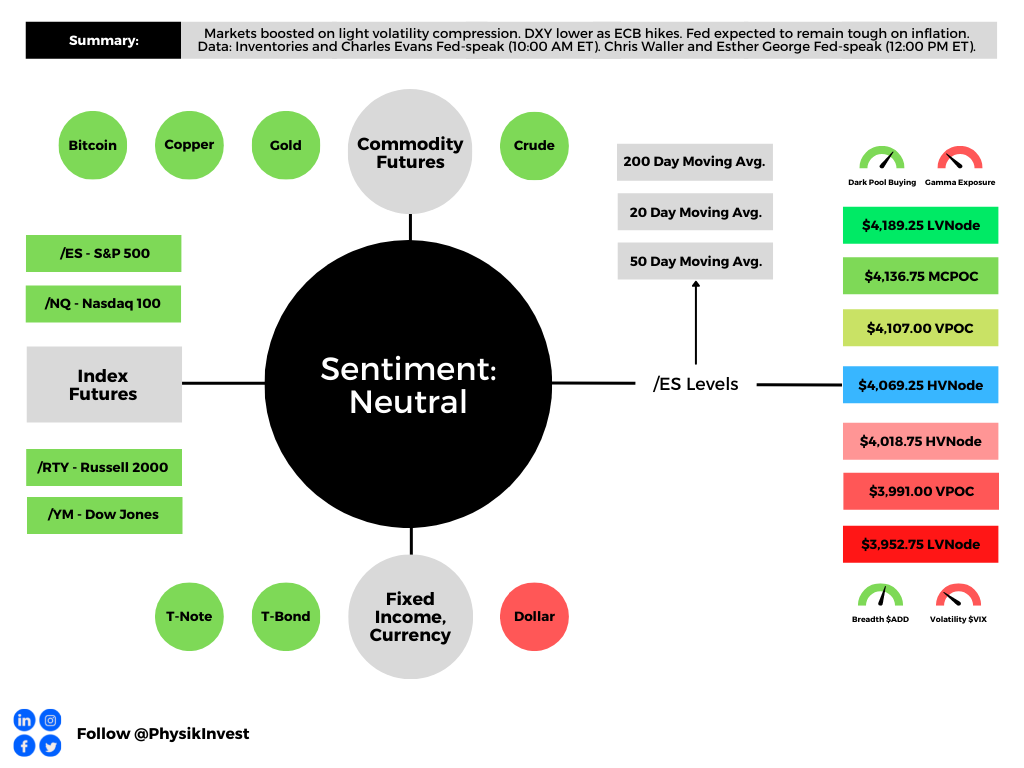
Graphic updated 8:00 AM ET. Sentiment Risk-On if expected /ES open is above the prior day’s range. /ES levels are derived from the profile graphic at the bottom of the following section. Levels may have changed since initially quoted; click here for the latest levels. SqueezeMetrics Dark Pool Index (DIX) and Gamma (GEX) calculations are based on where the prior day’s reading falls with respect to the MAX and MIN of all occurrences available. A higher DIX is bullish. At the same time, the lower the GEX, the more (expected) volatility. Learn the implications of volatility, direction, and moneyness. Breadth reflects a reading of the prior day’s NYSE Advance/Decline indicator. VIX reflects a current reading of the CBOE Volatility Index (INDEX: VIX) from 0-100.
Fundamental
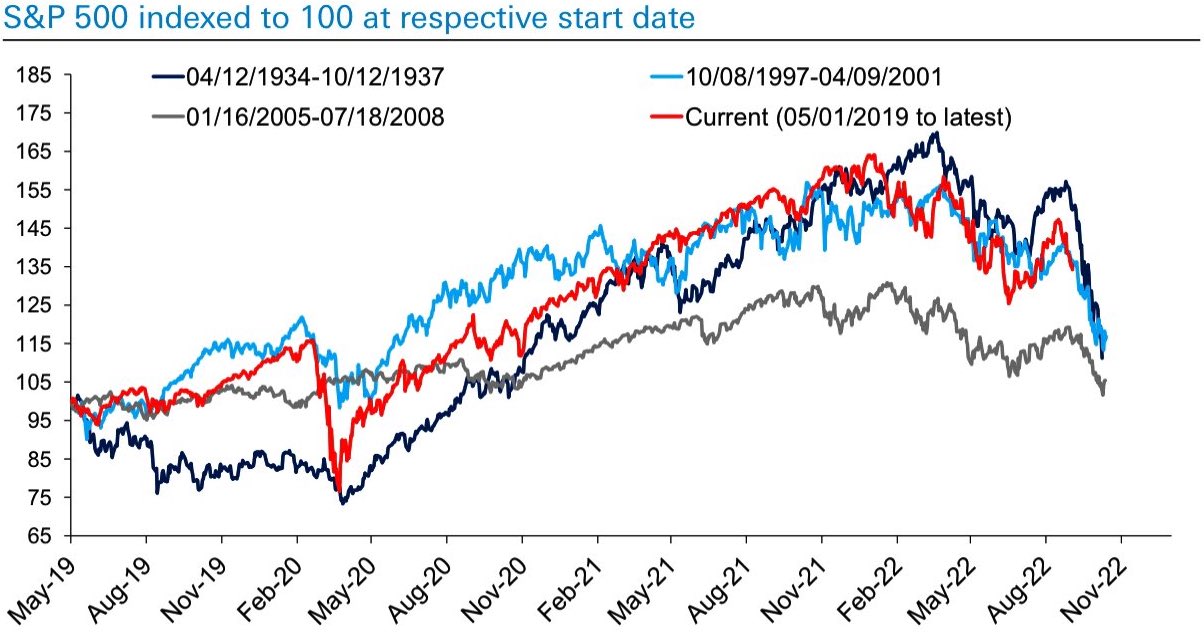
As much as it may be a so-called chart crime to overlap past market environments and project or forecast what may happen, it’s quite eerie that today’s path of returns appears similar to that of 1394-1937, 2005-2008, and 1997-2001, for example.
Graphic: Retrieved from Deutsche Bank AG (NYSE: DB).
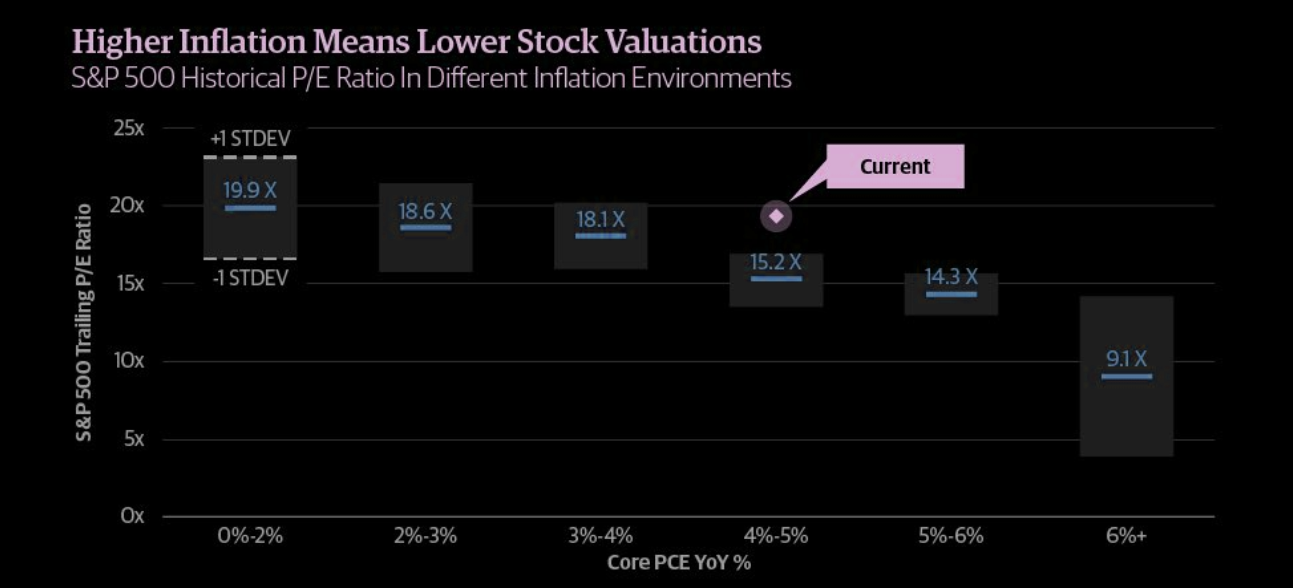
Moreover, this time around, it’s the case that markets have fallen on participants’ pricing of higher interest rates and quantitative tightening (QT).
Graphic: Retrieved from The Market Ear. Via Guggenheim Partners.
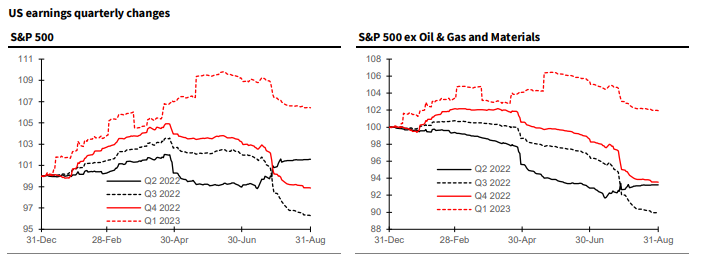
Some argue there is more to go on the pricing of a potential economic slowing happening here, in the U.S., abroad in China, and beyond.
Graphic: Retrieved from Bloomberg. “Earnings are related to the economic cycle, but not tightly, and expectations for next year are intertwined with macroeconomic concerns.”
Notwithstanding, and we will end the fundamental section with this, today, Credit Suisse Group AG’s (NYSE: CS) Jonathan Golub puts forth the following:
“Although revisions are negative, projected EPS growth rates remain positive for the remainder of 2022-23. While 3Q growth has fallen to 4.7%, EPS should expand 9-10%, assuming similar beats as experienced in 2Q. Historically, earnings hold up best when inflation is elevated. Many investors are interpreting the recent decline in estimates as a harbinger to recession. Our work shows that in high inflationary periods (1973, 1980, 1981) earnings peak just 2 months prior to a recession’s onset. With EPS growth projections still positive, revisions would have to fall much more to signal an economic contraction.”
Positioning
Referring traders to a recent case study (HERE) on how to play this market environment, as well as the impacts of implied volatility (IVOL) compression September 8 (HERE).
After a period of sideways-to-lower, markets are rebounding, boosted by IVOL compression and traders’ re-positioning ahead of potential including inflation and monetary policy updates.
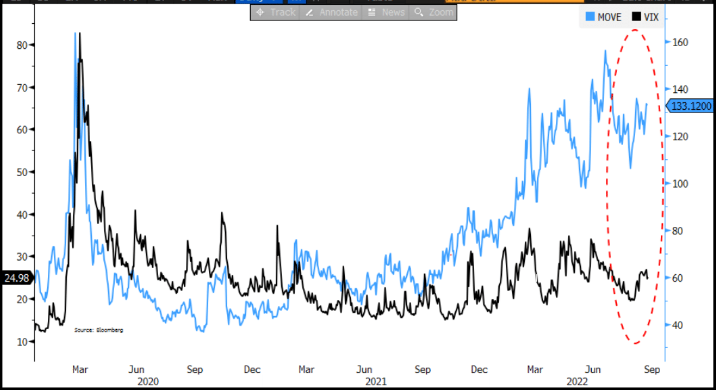
Notwithstanding, as Kai Volatility’s Cem Karsan well explained to Charles Schwab Corporation’s (NYSE: SCHW) TD Ameritrade Network, traders must look out for the “window of real risk.”
The energy for a downside move “is significant” after this year’s decimation of “skew and volatility,” he said. “Hedging for convexity is in the 5th percentile.”
This is because participants hedged heading into the decline, and sold skew as the markets explored lower. After the current period of volatility supply passes, Karsan added, and markets were to trade lower, there is the risk of a reach for protection and a fatter tail.
Graphic: Merrill Lynch Options Volatility Estimate (INDEX: MOVE), a measure of volatility for the US Treasury market, versus the Cboe Volatility Index (INDEX: VIX), a measure of volatility for the equity market, diverged this year. This is, in part, due to the supply of volatility in equities.
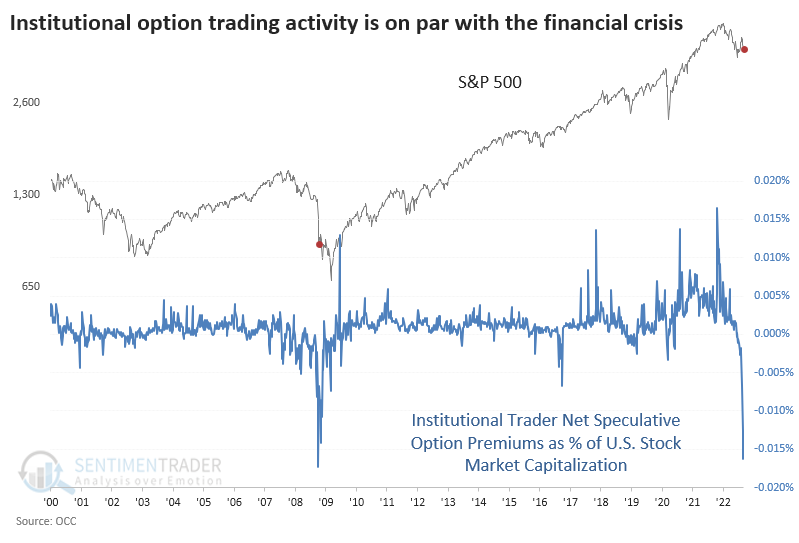
Should nothing happen, then the unwind of the recent speculation amongst “family offices and institutions front-running the speculative hedges that are more than 50 units,” will add support.
Graphic: Retrieved from SentimenTrader on September 7, 2022.
Technical
As of 6:40 AM ET, Friday’s regular session (9:30 AM – 4:00 PM ET), in the S&P 500, is likely to open in the upper part of a positively skewed overnight inventory, outside of prior-range and -value, suggesting a potential for immediate directional opportunity.
In the best case, the S&P 500 trades higher.
Any activity above the $4,069.25 HVNode puts into play the $4,107.00 VPOC. Initiative trade beyond the VPOC could reach as high as the $4,136.75 MCPOC and $4,189.25 LVNode, or higher.
In the worst case, the S&P 500 trades lower.
Any activity below the $4,069.25 HVNode puts into play the $4,018.75 HVNode. Initiative trade beyond the HVNode could reach as low as the $3,991.00 VPOC and $3,952.75 LVNode, or lower.
Click here to load today’s key levels into the web-based TradingView charting platform. Note that all levels are derived using the 65-minute timeframe. New links are produced, daily.
Graphic: 65-minute profile chart of the Micro E-mini S&P 500 Futures.
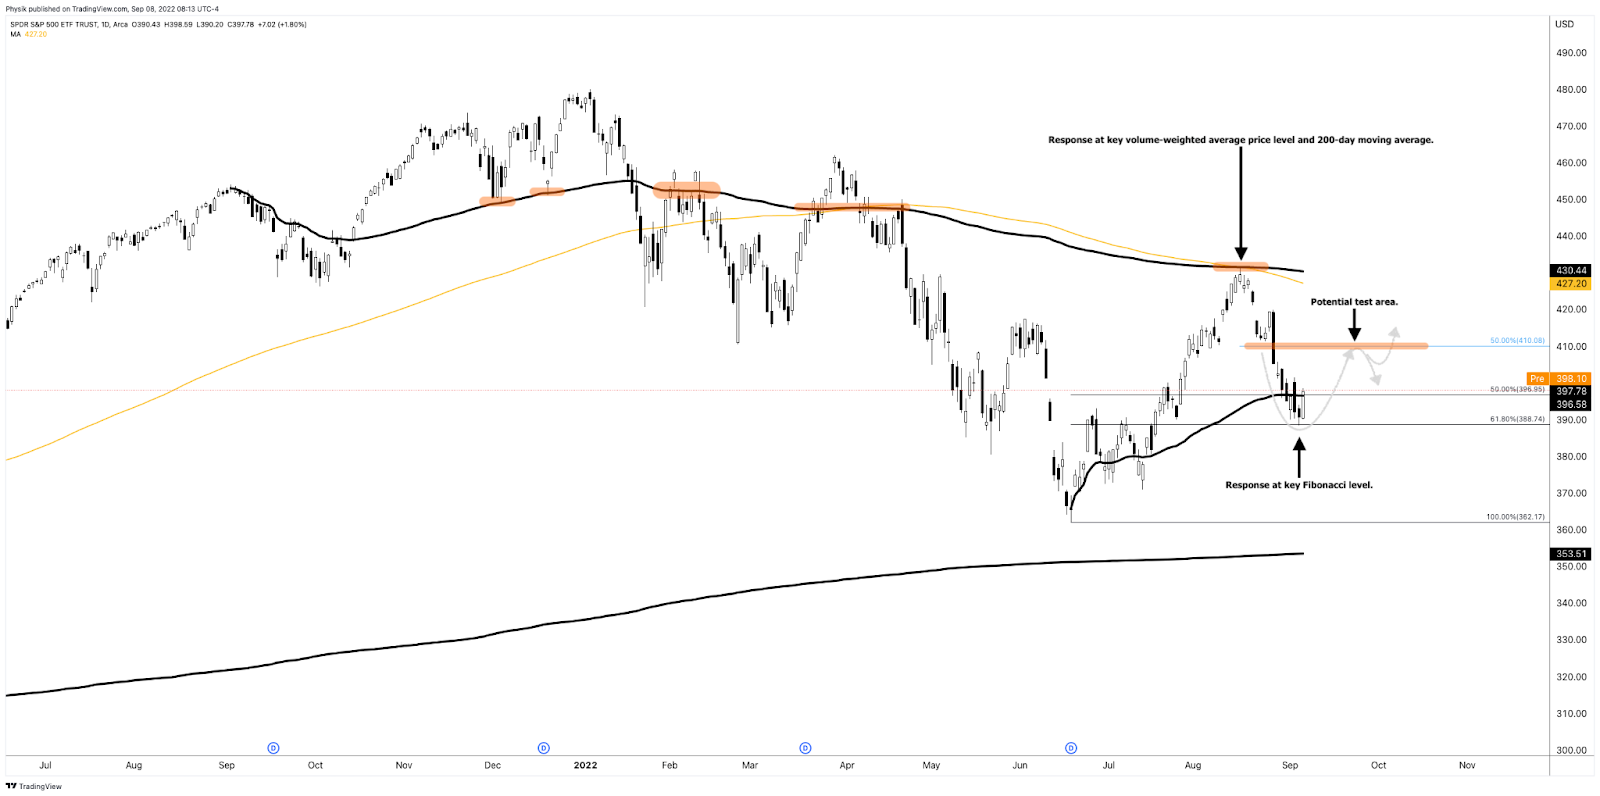
Considerations: Responsiveness near key-technical areas (that are discernable visually on a chart), suggests technically-driven traders with short time horizons are very active.
Such traders often lack the wherewithal to defend retests and, additionally, the type of trade may be indicative of the other time frame participants waiting for more information to initiate trades.
Graphic: Updated 9/8/2022. The daily chart of the SPDR S&P 500 ETF Trust (NYSE: SPY).
Definitions
Volume Areas: A structurally sound market will build on areas of high volume (HVNodes). Should the market trend for long periods of time, it will lack sound structure, identified as low volume areas (LVNodes). LVNodes denote directional conviction and ought to offer support on any test.
If participants were to auction and find acceptance into areas of prior low volume (LVNodes), then future discovery ought to be volatile and quick as participants look to HVNodes for favorable entry or exit.
POCs: POCs are valuable as they denote areas where two-sided trade was most prevalent in a prior day session. Participants will respond to future tests of value as they offer favorable entry and exit.
MCPOCs: POCs are valuable as they denote areas where two-sided trade was most prevalent over numerous day sessions. Participants will respond to future tests of value as they offer favorable entry and exit.
Volume-Weighted Average Prices (VWAPs): A metric highly regarded by chief investment officers, among other participants, for quality of trade. Additionally, liquidity algorithms are benchmarked and programmed to buy and sell around VWAPs.
About
After years of self-education, strategy development, mentorship, and trial-and-error, Renato Leonard Capelj began trading full-time and founded Physik Invest to detail his methods, research, and performance in the markets.
Capelj also develops insights around impactful options market dynamics at SpotGamma and is a Benzinga reporter.
In no way should the materials herein be construed as advice. Derivatives carry a substantial risk of loss. All content is for informational purposes only.
The daily brief is a free glimpse into the prevailing fundamental and technical drivers of U.S. equity market products. Join the 300+ that read this report daily, below!
Overnight, equity index futures continued lower as weakness spread overseas. Commodities were mixed and yields were lower. At a high-level, measures of implied volatility held their bid.
Apart from the removal of structural forces underpinning a rally into mid-week, earnings reports played into “fears of the consequences of if inflation is brought under control,” per Bloomberg.
Ahead is data on jobless claims and manufacturing (8:30 AM ET). Later, existing home sales and leading economic indicators (10:00 AM ET). No events are scheduled for tomorrow.
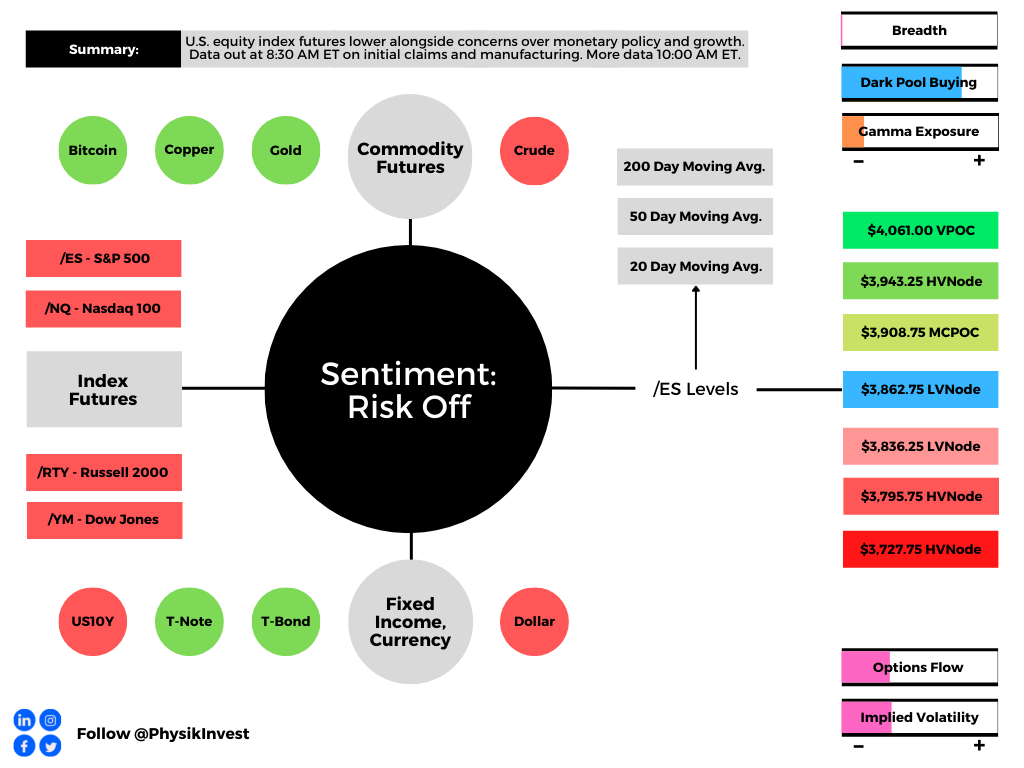
Graphic updated 8:30 AM ET. Sentiment Risk-Off if expected /ES open is below the prior day’s range. /ES levels are derived from the profile graphic at the bottom of the following section. Levels may have changed since initially quoted; click here for the latest levels. SqueezeMetrics Dark Pool Index (DIX) and Gamma (GEX) calculations are based on where the prior day’s reading falls with respect to the MAX and MIN of all occurrences available. A higher DIX is bullish. At the same time, the lower the GEX, the more (expected) volatility. Learn the implications of volatility, direction, and moneyness. SHIFT data used for S&P 500 (INDEX: SPX) options activity. Note that options flow is sorted by the call premium spent; if more positive, then more was spent on call options. Breadth reflects a reading of the prior day’s NYSE Advance/Decline indicator. VIX reflects a current reading of the CBOE Volatility Index (INDEX: VIX) from 0-100.
What To Expect
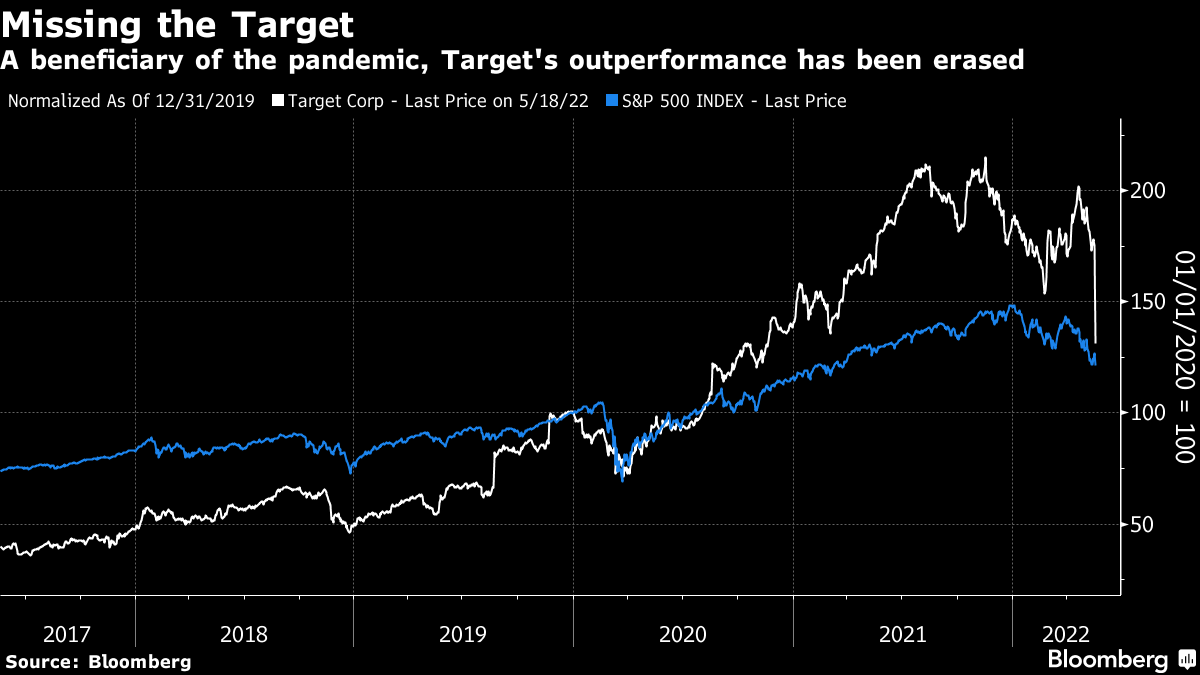
Fundamental: On the heels of Target reporting lower profits on costs and tighter margins, the beloved Cathie Wood of Ark Invest chimed in with a note on an explosion in inventories. Late last year, we quoted Wood suggesting businesses were scrambling to increase inventories.
Graphic: Via Bloomberg. “Target announced that sales were up, but profit was down thanks to increasing costs and tightening margins. Also like Walmart the day before, the market rewarded the stock with its biggest one-day decline since the Black Monday crash of October 1987. That’s alarming, although it’s worth pointing out that Target had been a conspicuous beneficiary of the pandemic to date.”
Though early, she said inflation would eventually be on its way out and inventory build-ups were one of the indicators to watch.
“Walmart Inc’s (NYSE: WMT) inventories increased 33% in nominal terms on a year over year basis, translating into 20-25% in real or unit terms, as Target Corporation’s (NYSE: TGT) inventories increased by 42% and 30-35%, respectively,” Wood said.
At the same time, sentiment has plunged to Great Recession levels, all the while consumers are “rebelling against their loss of purchasing power,” and China is in turmoil (talked about May 16).
These comments play into the recession narratives we unpacked earlier this week (May 17 and May 18). Monetary policies sent money to capital and that bolstered deflationary trends.
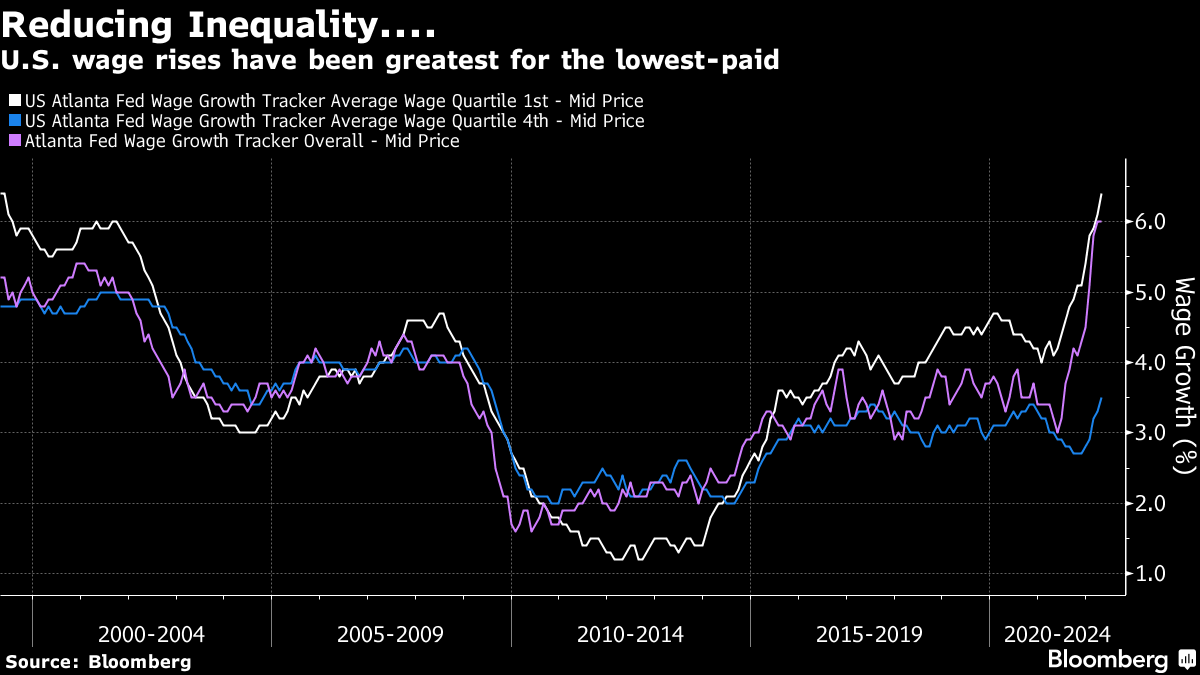
Then came the pandemic and the increasing effects of inequality; money was sent to labor, and that bolstered inflationary trends.
Graphic: Via Bloomberg. “Overall wage increases were 6% in April, for the second month running — too high for the Fed’s comfort but at least with no increase. It is the least well paid who are commanding the highest percentage rises.”
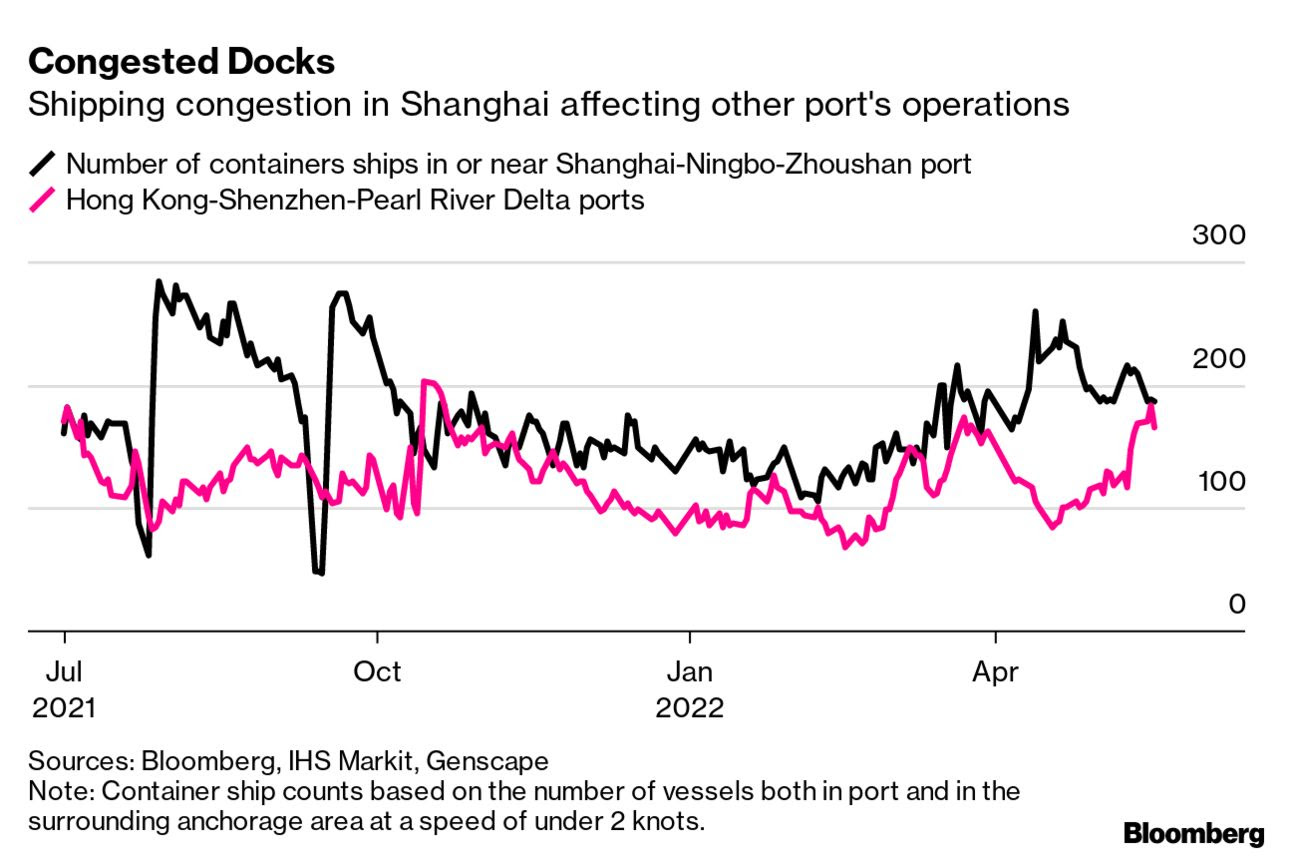
As we quoted Kai Volatility’s Cem Karsan explaining, today’s contractionary monetary policy is a blunt tool and is not equipped to “address the main problem which is a lack of supply to absorb the demand.”
Graphic: Via Bloomberg. “China appears to be gradually easing its lockdown of Shanghai, but that won’t bring immediate relief to global supply-chain congestion.”
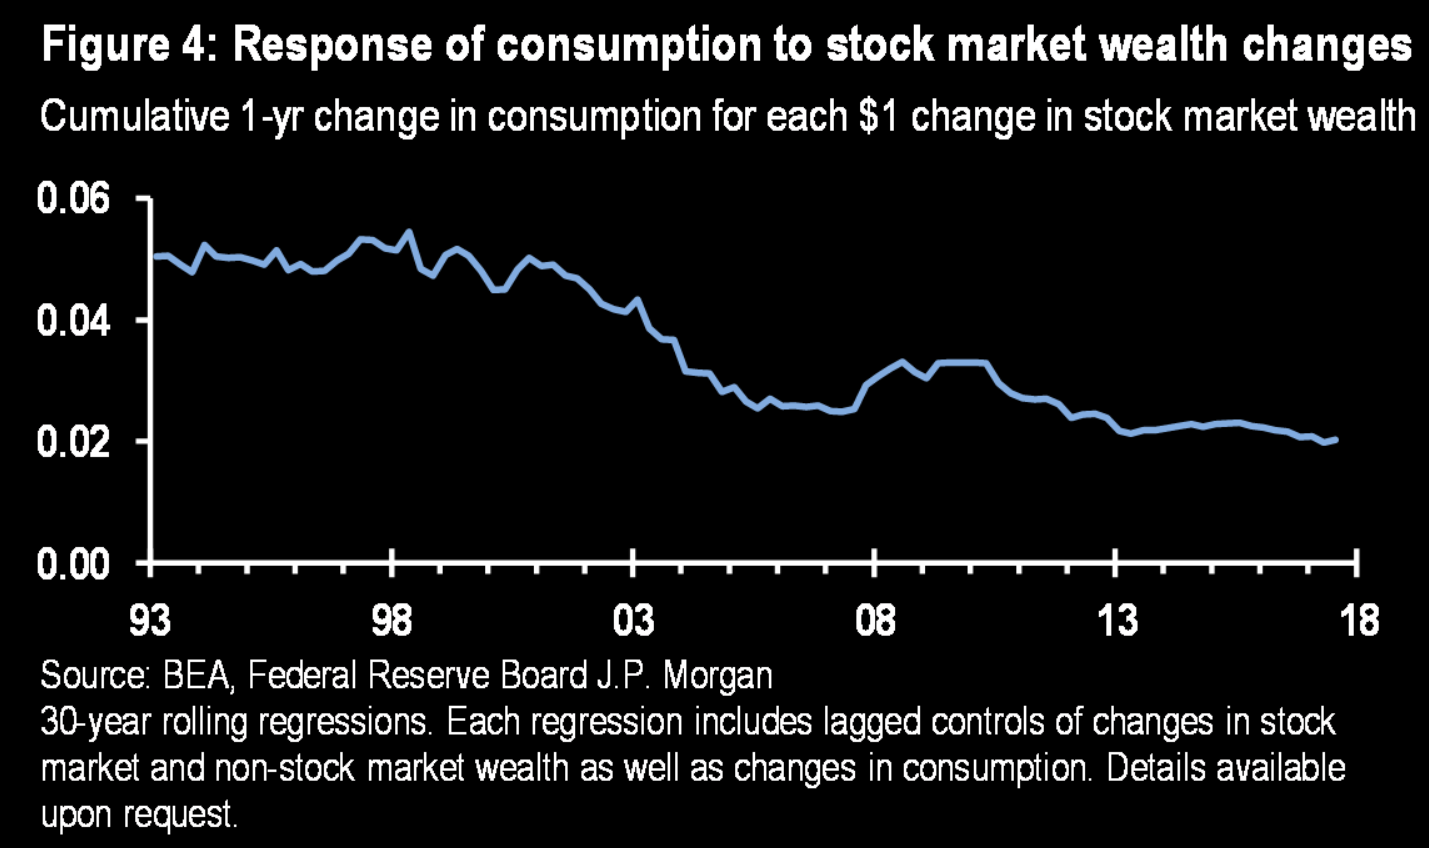
Likewise, Credit Suisse Group AG’s (NYSE: CS) Zoltan Pozsar explained what he felt was “the Fed is pursuing demand destruction through negative wealth effects,” as the “central banks can only deal with nominal” chokepoints.
Graphic: Via JPMorgan Chase & Co (NYSE: JPM). Taken from The Market Ear. “A stronger dollar, lower equity prices, and higher mortgage rates will weigh on demand growth [and] Over time weaker output demand should lead to weaker labor demand Don’t fight the Fed as this is what Fed wants (slower growth).”
By that token, we must “[c]onsider at least the possibility that the extreme volatility and lack of liquidity [we] see in markets is by design, and the Fed will not be deterred by it, but rather that it will be emboldened by it in its singular pursuit of price stability.”
Why does any of this matter?
As quoted, yesterday, “[w]ith supply-side economics, the only way that they can control [price stability] is to pull back. And slow capital markets decrease via the wealth effect. Ultimately, there’s a significant lag, so [the Fed is] not in a position to ultimately control inflation without bringing down markets.”
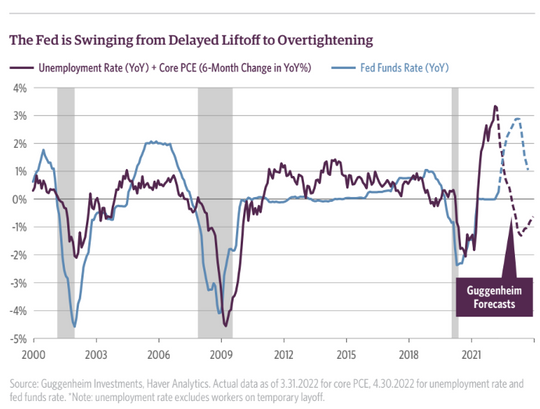
By that token, a stock market drop is both a recession and a direct reflection of the unwind of global carry. It is the manifestation of a deflationary shock, and today’s sentiment, the gradual build-up of inventories, tightening of financial conditions, and the like, are a reflection of this.
Graphic: Via Guggenheim Partners. Taken from MarketWatch. The “ Fed is headed toward overtightening financial conditions just as employment show some softness.”
Perspectives: Recall that the indexes are trading relatively strong, in comparison to constituents, especially those that are smaller technology and growth companies.
Essentially, “we’re two-thirds of the way through a dot-com type collapse,” we quoted Simplify Asset Management’s Mike Green explaining.
“It’s just happened underneath the surface of the indices which is [that] … dynamic of passive flows supporting the largest stocks within the index, whereas the smaller stocks can be influenced to a greater extent by the behavior of discretionary managers.”
Pursuant to those remarks, JPMorgan Chase & Co’s Marko Kolanovic says there are significant opportunities in the beaten areas of the market.
“I almost refuse to talk about ‘where should I buy S&P?’” he said adding that “[m]ost of the bad things have happened already this year.”
“There will be no recession this year, some summer increase in consumer activity on the back of reopening, China increasing monetary and fiscal measures.”
Per the earlier quoted Pozsar, Kolanovic, like Wood, maybe too early in his calls.
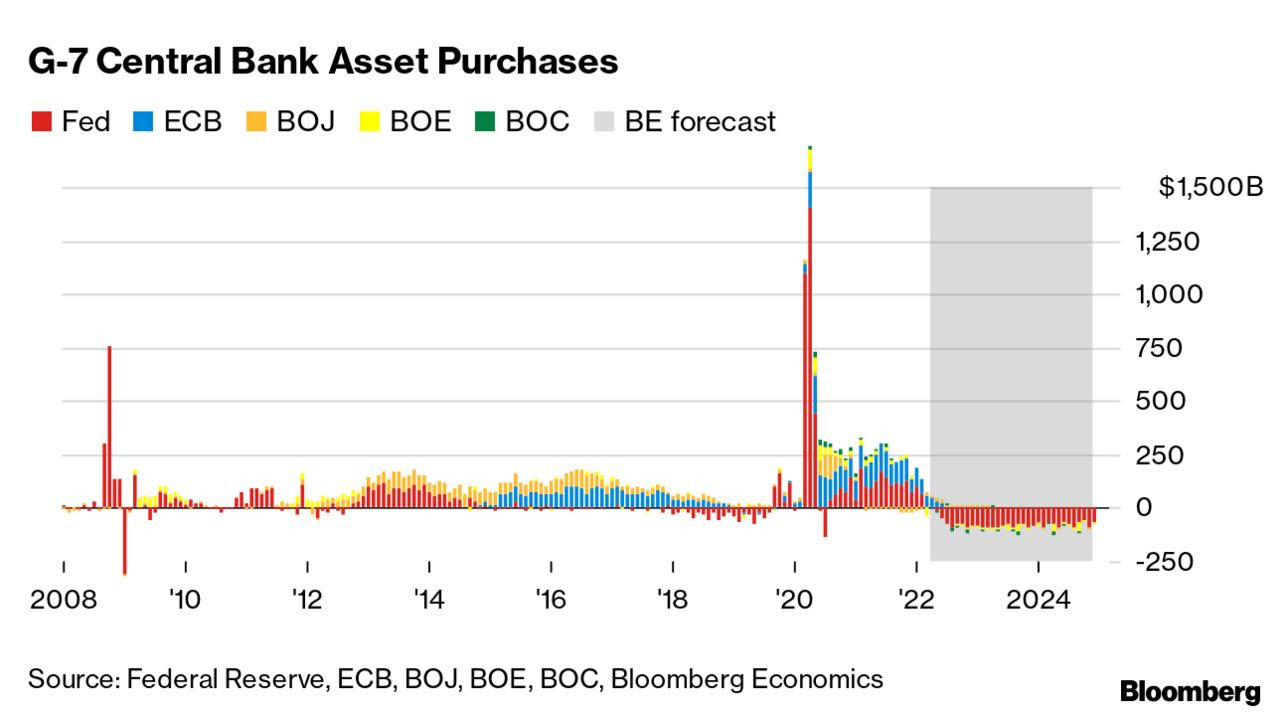
“Banks’ stock buybacks are lowering SLRs [], and the Fed is about to embark on QT,” Pozsar says. For context, QT (Quantitative Tightening) is the central banking authorities’ removal of balance sheet assets via sales or the non-reinvestment of the principal sum of maturing securities.
The dynamic is as follows: if bonds are sold, their values fall and yields rise, thus pushing yield-hungry investors into less risky asset categories.
“These nominal balance sheet and liquidity trends, will at some point clash with the realities of a garden variety of supply chain issues,” as a result of geopolitical chokepoints.
Graphic: Per Bloomberg, “[E]very $1 trillion of QT will equate to a decline of roughly 10% in stocks over the next 12 months or so.”
Given Pozsar’s findings, the Fed is likely to do QE again in the summer of 2023.
Checking Eurodollar (FUTURE: /GE), a reflection of participants’ outlook for U.S. interest rates, shows the peak of the Fed-rate-hike cycle – terminal rate – at around June 2023.
Positioning: This week’s expiration of options on the Cboe Volatility Index (INDEX: VIX), per SpotGamma, pulled forward the positive effects of volatility compression heading into the large May monthly equity and index options expiration (OPEX).
“Barring a forced re-pricing, we saw what was already little fuel to the upside drained into the weighty VIX options expiration (as bets on the VIX decay, this leads to hedging that bolsters S&P 500 upside),” SpotGamma said.
“Following this event (and the coming monthly May OPEX), we see the door open to lower prices amid the removal of “max put” positioning which “clears the way for lower-lows.”
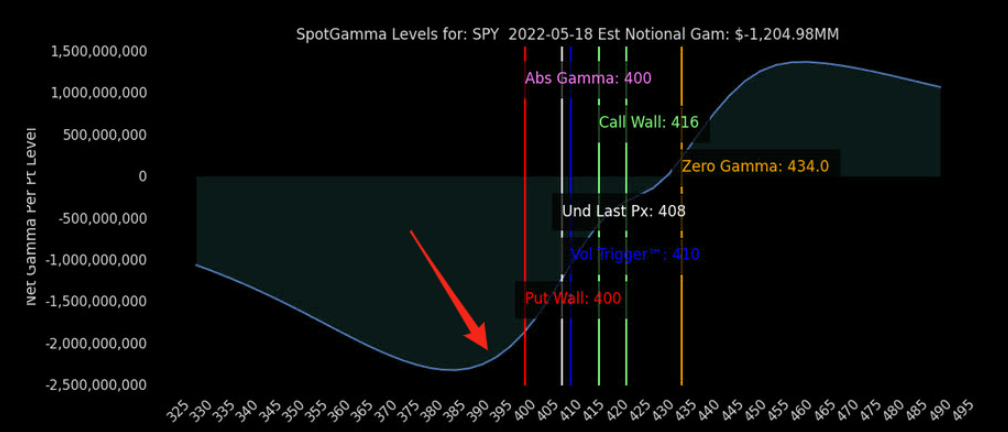
Heading into the monthly OPEX, if the S&P 500 Index (INDEX: SPX) is well below $4,000.00, “the buyback of short futures to short put exposures that no longer require liquidity providers to hedge,” may bolster a sharp reversal.
Graphic: Via SpotGamma. Taken from The Market Ear. “Deep short gamma where dealers are trapped in selling low and buying high and the poor liquidity environment, where the pushing of deltas (both ways) gets even more magnified due to non-existent volumes. This dynamic works both ways.”
Technical: As of 8:30 AM ET, Thursday’s regular session (9:30 AM – 4:00 PM ET), in the S&P 500, will likely open in the lower part of a negatively skewed overnight inventory, outside of prior-range and -value, suggesting a potential for immediate directional opportunity.
In the best case, the S&P 500 trades higher; activity above the $3,862.75 low volume area (LVNode) puts in play the $3,908.75 micro composite point of control (MCPOC). Initiative trade beyond the MCPOC could reach as high as the $3,943.25 high volume area (HVNode) and $4,061.00 virgin point of control (VPOC), or higher.
In the worst case, the S&P 500 trades lower; activity below the $3,862.75 LVNode puts in play the $3,836.25 LVNode. Initiative trade beyond the LVNodes could reach as low as the $3,795.75 and $3,727.25 HVNodes, or lower.
Click here to load today’s key levels into the web-based TradingView charting platform. Note that all levels are derived using the 65-minute timeframe. New links are produced, daily.
Graphic: 65-minute profile chart of the Micro E-mini S&P 500 Futures.
Definitions
Overnight Rally Highs (Lows): Typically, there is a low historical probability associated with overnight rally-highs (lows) ending the upside (downside) discovery process.
Volume Areas: A structurally sound market will build on areas of high volume (HVNodes). Should the market trend for long periods of time, it will lack sound structure, identified as low volume areas (LVNodes). LVNodes denote directional conviction and ought to offer support on any test.
If participants were to auction and find acceptance into areas of prior low volume (LVNodes), then future discovery ought to be volatile and quick as participants look to HVNodes for favorable entry or exit.
POCs: POCs are valuable as they denote areas where two-sided trade was most prevalent in a prior day session. Participants will respond to future tests of value as they offer favorable entry and exit.
MCPOCs: POCs are valuable as they denote areas where two-sided trade was most prevalent over numerous day sessions. Participants will respond to future tests of value as they offer favorable entry and exit.
Volume-Weighted Average Prices (VWAPs): A metric highly regarded by chief investment officers, among other participants, for quality of trade. Additionally, liquidity algorithms are benchmarked and programmed to buy and sell around VWAPs.
About
After years of self-education, strategy development, mentorship, and trial-and-error, Renato Leonard Capelj began trading full-time and founded Physik Invest to detail his methods, research, and performance in the markets.
Capelj also develops insights around impactful options market dynamics at SpotGamma and is a Benzinga reporter.
In no way should the materials herein be construed as advice. Derivatives carry a substantial risk of loss. All content is for informational purposes only.
Editor’s Note: If this commentary was valuable to you, consider forwarding it to your peers. Alternatively, share on social media and tag either @renatolcapelj or @physikinvest.
Wishing you good health and success!
Market Commentary
Equity index, bond, and commodity futures traded higher Friday. The VIX, US10Y, and dollar were sideways to lower.
What happened and things to expect.
Ahead is important employment data.
Trade Idea: Complex spread in GME.
Expecting less volatility to the upside.
What Happened: U.S. stock index futures auctioned sideways to higher last week alongside impactful events like the Federal Reserve’s Jackson Hole Economic Symposium.
Ahead this coming week is important data on employment, consumer confidence, vehicle sales, manufacturing, and more. See here for updated calendar data.
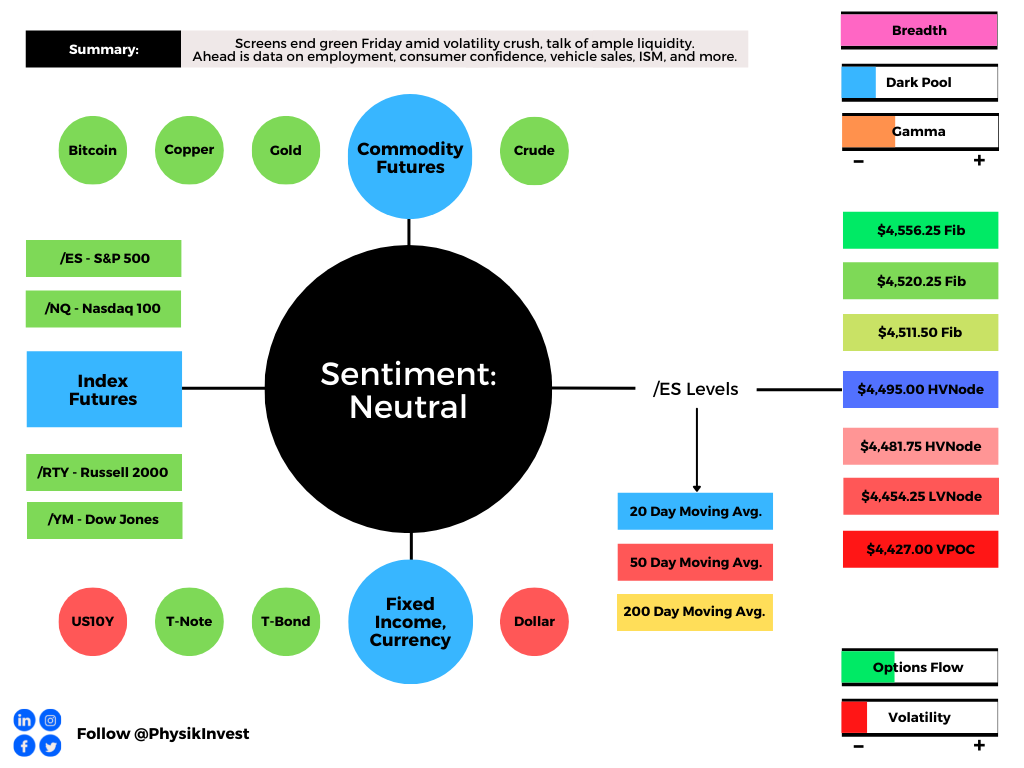
Graphic updated 7:30 AM ET Sunday. Sentiment Neutral if expected /ES open is inside of the prior day’s range. SqueezeMetrics Dark Pool Index (DIX) and Gamma (GEX) calculations are based on where the prior day’s reading falls with respect to the MAX and MIN of all occurrences available. A higher DIX is bullish. At the same time, the lower the GEX, the more (expected) volatility. SHIFT data used for S&P 500 (INDEX: SPX) options activity approximation. Note that options flow is sorted by the call premium spent; if more positive then more was spent on call options. Breadth reflects a reading of the prior day’s NYSE Advance/Decline indicator. VIX reflects a current reading of the CBOE Volatility Index (INDEX: VIX) from 0-100.
What To Expect: During the prior week’s trade, on mostly strong intraday breadth and market liquidity metrics, the best case outcome occurred, evidenced by new all-time highs in the S&P 500 and Nasdaq 100. This is significant because it suggests continued bullishness after a v-pattern recovery.
V-Pattern: A pattern that forms after a market establishes a high, retests some support, and then breaks above said high. In most cases, this pattern portends continuation.
Further, the aforementioned trade is happening in the context of the Jackson Hole Economic Symposium. This event’s implications on price are supportive.
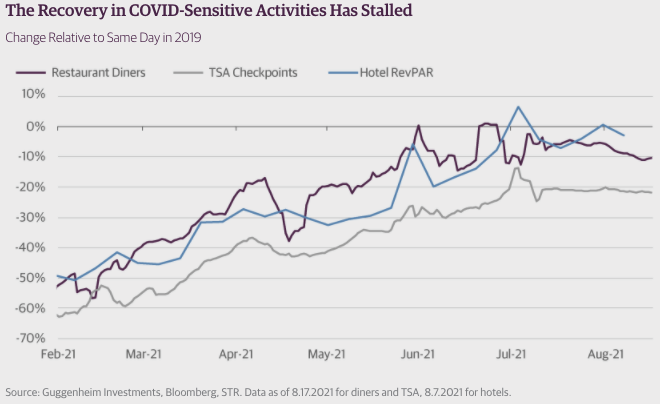
To elaborate, given a slow down in the pace of the post-pandemic recovery, the Federal Reserve (i.e., Fed) decided not to manipulate policy to offset temporary factors. The reason being, policy effects are often delayed; doing something now could curb the recovery.
Graphic: Guggenheim Investments unpacks the impact of weaker data on monetary policy.
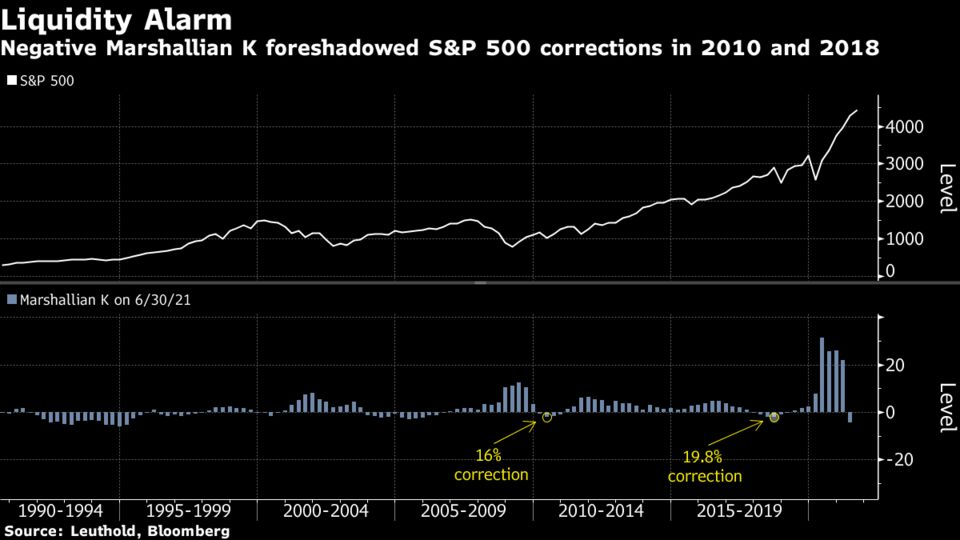
At the same time, with measures like the Marshallian K – the difference between year-over-year growth in M2 money supply and GDP – turning negative, there are concerns around liquidity and its impact on the equity market.
Graphic: According to Bloomberg, “While stocks kept rising during frequent negative Marshallian K readings in the 1990s, the pattern since the 2008 global financial crisis — a period when the central bank was in what Ramsey calls a “perpetual crisis mode” — begs for caution.”
According to Moody’s, however, “it will take a while before liquidity concerns are justified even with the Fed likely to begin tapering its $120 billion in monthly asset purchases either late this year or early next.”
Why? Well, for starters, if liquidity was an issue, financial institutions wouldn’t be parking that much money at the Fed. Low volatility in the bond and stock market also implies ample liquidity, Moody’s adds.
So, by not rapidly reducing its asset purchases, the Fed isn’t worried about the economy overheating due to non-temporary inflation; instead, Chairman Jerome Powell maintains that “[o]verall global deflationary trends remain in force.”
Eventually, though, after progress is made on full employment, the Fed will taper, likely keeping inflation expectations in line.
To note, last week’s straight-up trade came alongside the so-called sale of any volatility spike which can – through the process of hedging – support the market. Here’s just one example that received a lot of attention.
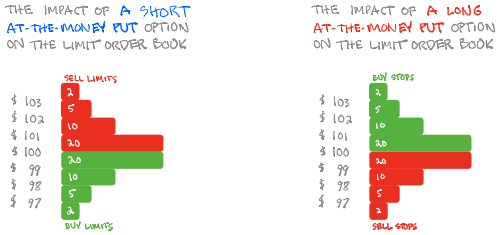
“In theory, if a stock was dropping and the retail masses all started to sell puts, they could push market makers to start buying large blocks of shares,” SpotGamma, an important voice in the space, says. “This could stabilize a dropping stock.”
Graphic: SqueezeMetrics details the implications of customer activity in the options market, on the underlying’s order book. For instance, in selling a put, customers add liquidity and stabilize the market. How? The counterparty long the put will buy (sell) the underlying to neutralize directional risk as price falls (rises).
Moreover, given a divergent volume delta and decline in metrics like DIX and GEX, the odds of significant upside volatility are lower. Still, participants may make use of the following objective frameworks for next week’s trade. Check for updated levels in Monday morning’s commentary.
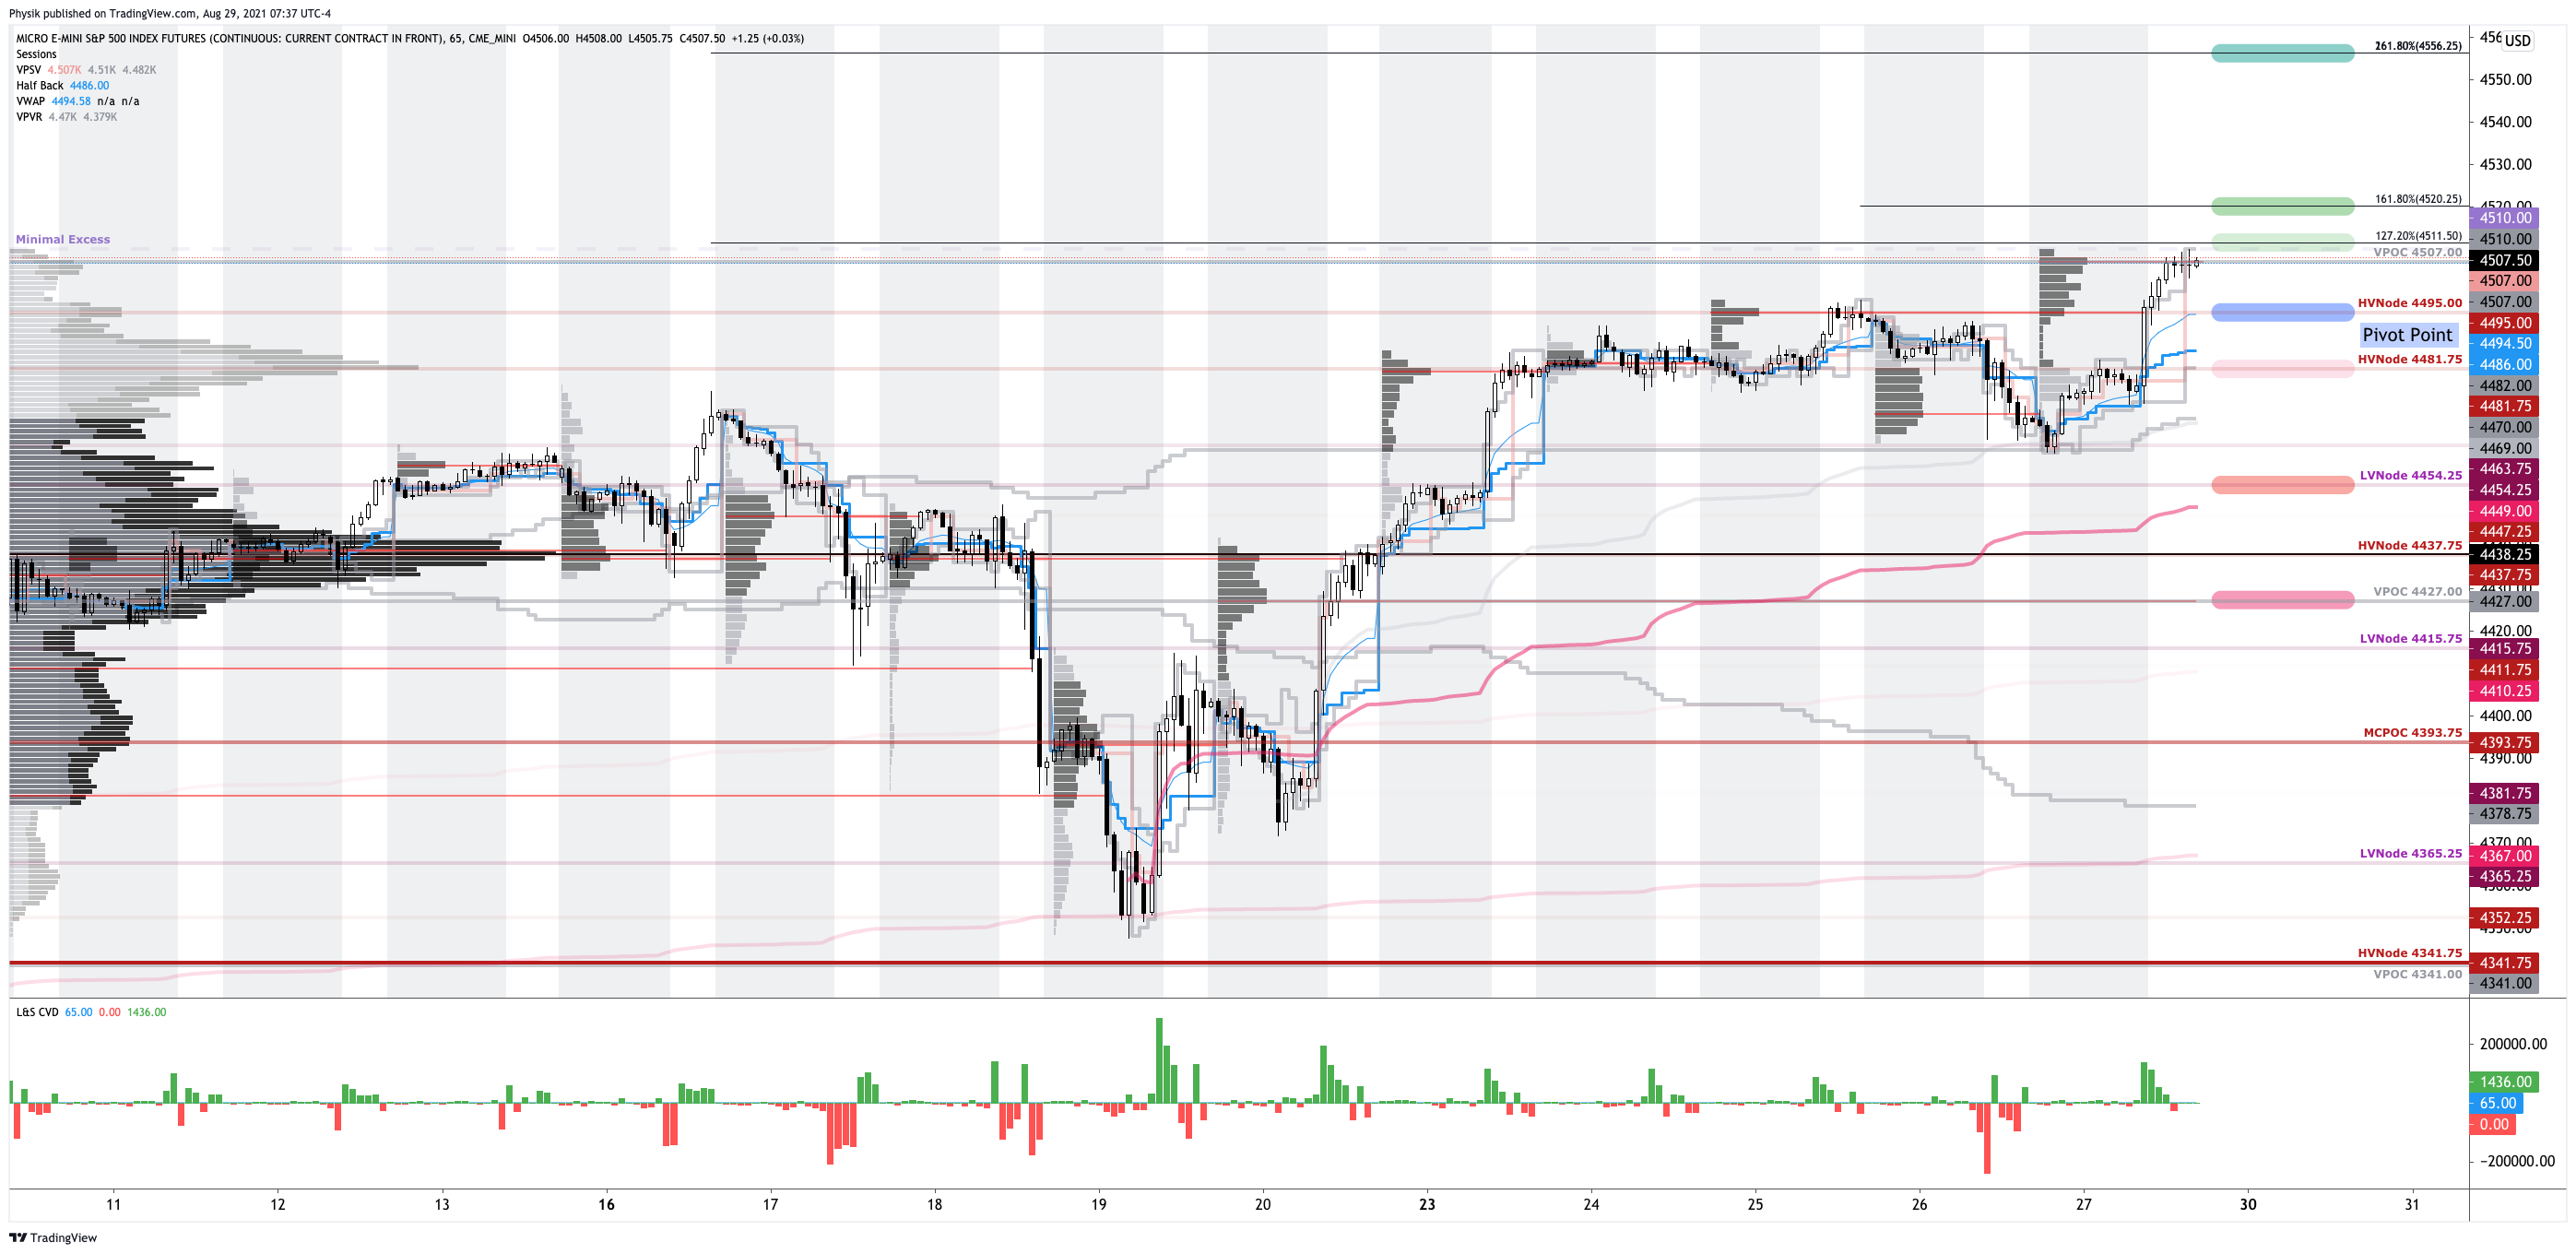
In the best case, the S&P 500 trades sideways or higher; activity above the $4,495.00 high volume area (HVNode) pivot puts in play the minimal excess all-time high and $4,511.50 Fibonacci extension. Initiative trade beyond the $4,511.50 level could reach as high as the $4,520.25 and $4,556.25 extensions.
In the worst case, the S&P 500 trades lower; activity below the $4,495.00 HVNode puts in play the $4,481.75 HVNode. Initiative trade beyond the $4,481.75 HVNode could reach as low as the $4,454.25 low volume area (LVNode) and $4,427.00 untested point of control (VPOC).
To note, the $4,454.25 LVNode corresponds with an anchored volume-weighted average price (VWAP), a metric highly regarded by chief investment officers, among other participants, for quality of trade. Additionally, liquidity algorithms are benchmarked and programmed to buy and sell around VWAPs.
Volume Delta: Buying and selling power as calculated by the difference in volume traded at the bid and offer.

DIX: For every buyer is a seller (usually a market maker). Using DIX — which is derived from short sales (i.e., liquidity provision on the market-making side) — we can measure buying pressure.

Gamma: Gamma is the sensitivity of an option to changes in the underlying price. Dealers that take the other side of options trades hedge their exposure to risk by buying and selling the underlying. When dealers are short-gamma, they hedge by buying into strength and selling into weakness. When dealers are long-gamma, they hedge by selling into strength and buying into weakness. The former exacerbates volatility. The latter calms volatility.

Volume Areas: A structurally sound market will build on past areas of high volume. Should the market trend for long periods of time, it will lack sound structure (identified as a low volume area which denotes directional conviction and ought to offer support on any test).

If participants were to auction and find acceptance into areas of prior low volume, then future discovery ought to be volatile and quick as participants look to areas of high volume for favorable entry or exit.

Excess: A proper end to price discovery; the market travels too far while advertising prices. Responsive, other-timeframe (OTF) participants aggressively enter the market, leaving tails or gaps which denote unfair prices.

POCs: POCs are valuable as they denote areas where two-sided trade was most prevalent. Participants will respond to future tests of value as they offer favorable entry and exit.
Graphic: 65-minute profile chart of the Micro E-mini S&P 500 Futures updated 7:30 AM ET Sunday.
Weekly Trade Idea
Please Note: In no way is the below a trade recommendation. It is a peek into the thought process here at Physik Invest.
Options offer an efficient way to gain directional exposure.
If an option buyer was short (long) stock, he or she could buy a call (put) to hedge upside (downside) exposure. Additionally, one can spread, or buy (+) and sell (-) options together, strategically.
Commonly discussed spreads include credit, debit, ratio, back, and calendar.
Credit: Sell -1 option closer to the money. Buy +1 option farther out of the money.
Debit: Buy +1 option closer to the money. Sell -1 option farther out of the money.
Ratio: Buy +1 option closer to the money. Sell -2 options farther out of the money.
Back: Sell -1 option closer to the money. Buy +2 options farther out of the money.
Calendar: Sell -1 option. Buy +1 option farther out in time, at the same strike.
Typically, if bullish (bearish), sell at-the-money put (call) credit spread and/or buy a call (put) debit/ratio spread structured around target price. Alternatively, if the expected directional move is great (small), opt for a back spread (calendar spread). Also, if credit spread, capture 50-75% of the premium collected. If debit spread, capture 2-300% of the premium paid.
Be cognizant of risk exposure to direction (delta), time (theta), and volatility (vega).
Negative (positive) delta = synthetic short (long).
Negative (positive) theta = time decay hurts (helps).
Though I began filling this trade at limits for credit as high as 2.00, the spread collapsed markedly, Friday. Still, there’s an opportunity for unique structures such as the 530C+1, 680C-2 that pay you to be long the stock.
All else equal (i.e., discounting factors such as an increase in volatility), should the spread trade fully in-the-money – meaning the stock travels to the $680 short strike – the 530 strike will be 150 points in-the-money while the at-the-money strikes, combined (based on current at-the-money pricing), will trade around $53.00.
That suggests the spread should price for a credit north of $97.00 to close. Nice!
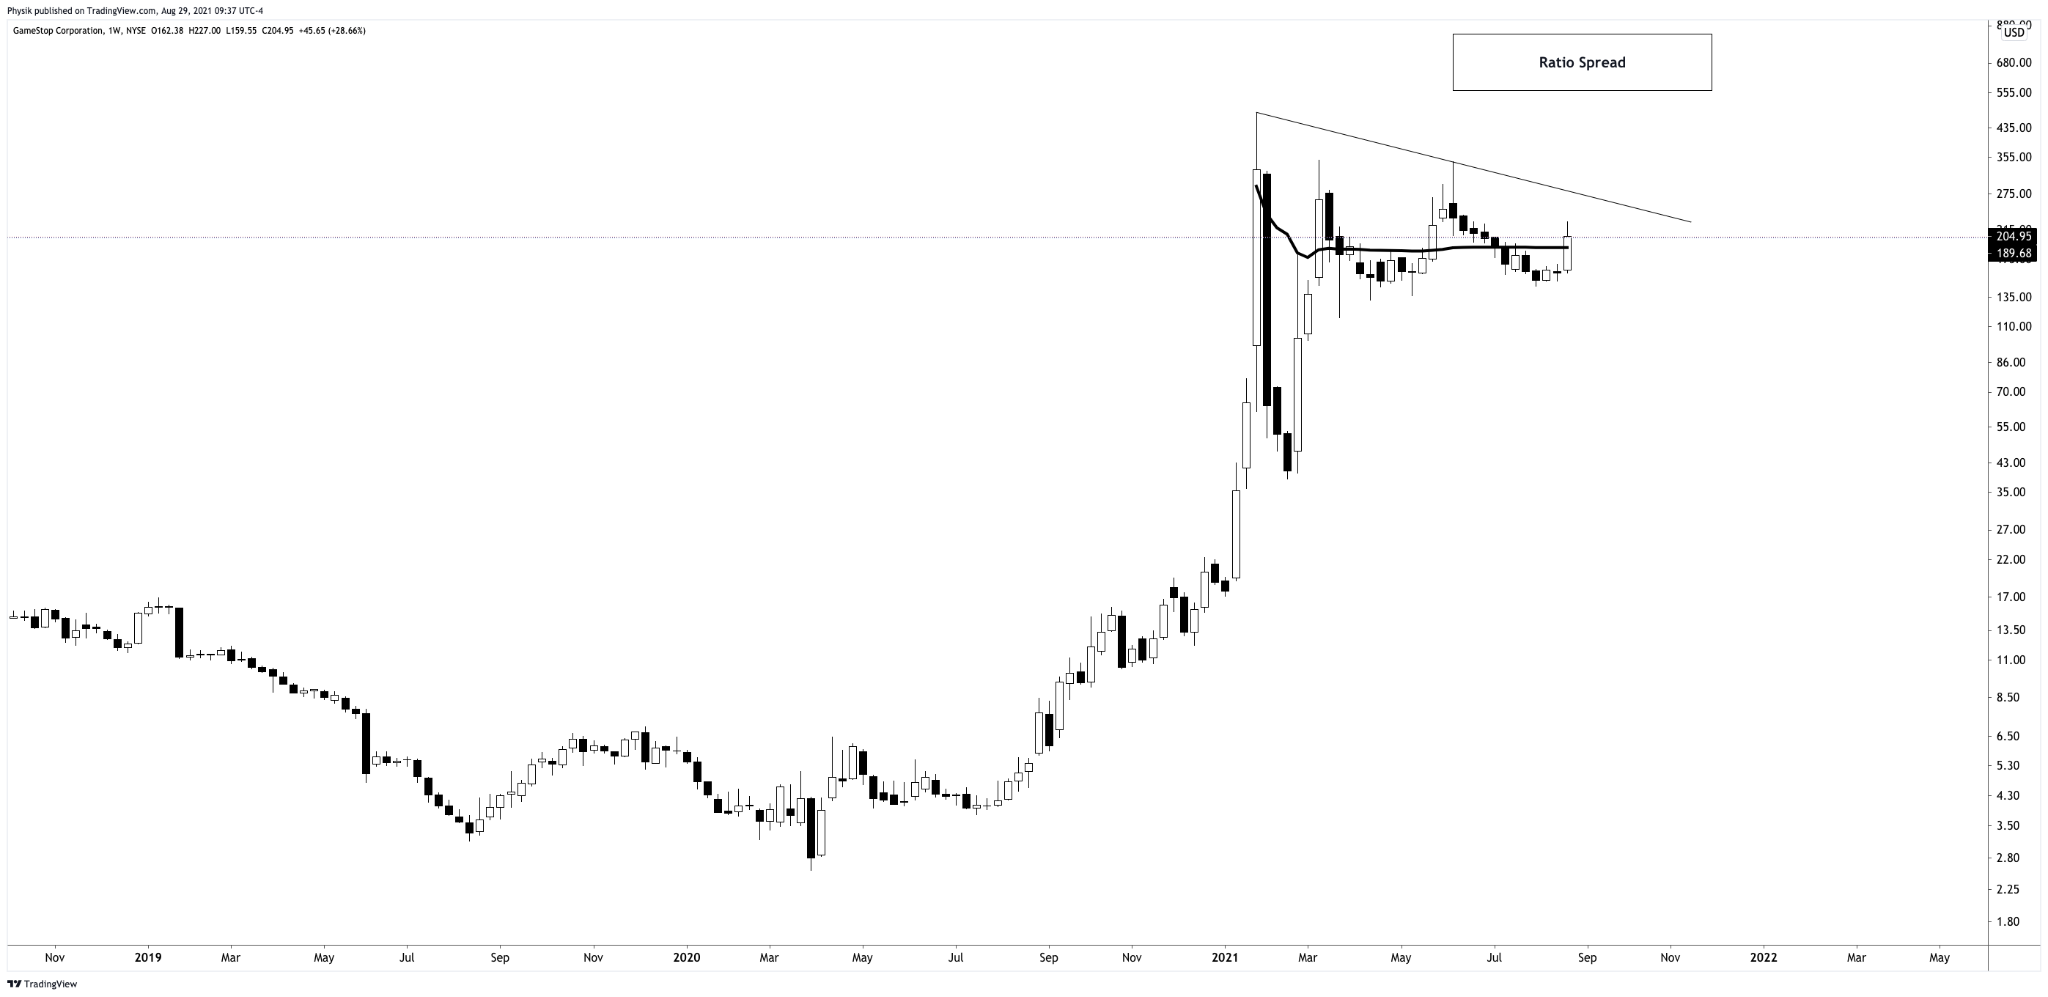
Thesis: I’m bullish on GameStop and I think the stock may climb over the next week few weeks.
I will structure a spread above the current stock price, expiring in 18 days. I will buy the 530 call option once (+1) and sell the 680 call option twice (-2) for a $1.20 credit or better. Should the stock not move to my target, I keep the $120.00 credit. Should it move to $680, I could make $15,000.00 at expiry. Should the stock move past $830 break even or so, I may incur unlimited losses. My goal with this spread is to capture the initial credit and close for additional credit if the stock moves higher.
If necessary, I will hedge the position by either (A) buying stock, (B) widening strikes, (C) buying a far out-of-the-money call option to cap upside in case of an unpredictable move higher, or (D) roll strikes up in price and out in time.
Below is a log chart of GameStop Corporation (NYSE: GME) and the ratio spread profit zone.
News And Analysis
Treasury bears redeemed as Citi, Michael Burry see higher yields.
Visa jumps into the NFT craze, buying a CryptoPunk for $150,000.
The top 7 reasons why COVID-19 could lead to inflationary regime.
Storm Ida roars toward Louisiana with winds of 150 miles per hour.
Chinese health officials reject U.S. allegations on COVID-19 probe.
What People Are Saying
Traders who have capital, confidence, commitment, and learn to adapt their techniques to varying market environments, can and will succeed.
After years of self-education, strategy development, and trial-and-error, Renato Leonard Capelj began trading full-time and founded Physik Invest to detail his methods, research, and performance in the markets.
Additionally, Capelj is a finance and technology reporter. Some of his biggest works include interviews with leaders such as John Chambers, founder and CEO, JC2 Ventures, Kevin O’Leary, businessman and Shark Tank host, Catherine Wood, CEO and CIO, ARK Invest, among others.
Disclaimer
At this time, Physik Invest does not manage outside capital and is not licensed. In no way should the materials herein be construed as advice. Derivatives carry a substantial risk of loss. All content is for informational purposes only.