Categories
Commentary

Daily Brief For November 10, 2022

The daily brief is a free glimpse into the prevailing fundamental and technical drivers of U.S. equity market products. Join the 1,200+ that read this report daily, below!

Graphic updated 8:00 AM ET. Sentiment Neutral if expected /ES open is inside of the prior day’s range. /ES levels are derived from the profile graphic at the bottom of the following section. Levels may have changed since initially quoted; click here for the latest levels. SqueezeMetrics Dark Pool Index (DIX) and Gamma (GEX) calculations are based on where the prior day’s reading falls with respect to the MAX and MIN of all occurrences available. A higher DIX is bullish. At the same time, the lower the GEX, the more (expected) volatility. Learn the implications of volatility, direction, and moneyness. Breadth reflects a reading of the prior day’s NYSE Advance/Decline indicator. VIX reflects a current reading of the CBOE Volatility Index (INDEX: VIX) from 0-100.

Administrative

Yesterday, this letter unpacked the events surrounding recent crypto-market turmoil. There were some loose ends we will continue to clean up below and in the coming letters.

Fundamental

As a recap, the “seemingly untouchable” FTX.com (CRYPTO: FTT) is on a path toward bankruptcy online reports appear to show. In short, the firm has a shortfall of ~$8 billion prompting investors like Sequoia Capital to write down the full value of their investments in FTX.com and FTX.US, the latter of which owns names like Blockfolio and LedgerX, and is allegedly “unaffected by its parent company’s liquidity.”

Graphic: Retrieved from Litquidity’s Exec Sum newsletter.

It’s the case that, unlike what I was explained to by Sam Bankman-Fried (SBF), with FTX.com (not FTX.US which is required to hold customer assets 1:1) there is counterparty risk, of sorts. 

As well put by Bloomberg’s Matt Levine, there’s a timing problem that’s “connected to a real economic risk.” The safety provided by “systems that automatically liquidate trades” was overwhelmed by the dangers of volatility and a simultaneous bank run.

The complicated part is as follows: “whereas the basic model of Coinbase Global Inc (NASDAQ: COIN) is ‘they buy Bitcoin (CRYPTO: BTC) for you and put it in an envelope,’ the basic model of FTX has to be ‘they lend your money to buy crypto and then make use of your crypto to get money.’ In financial terms, they … rehypothecate your collateral; you can’t expect them to just keep it in an envelope if they’re lending you the money” for leveraged trading.

Accordingly, “[t]he reason for a run on FTX is if you think that FTX loaned Alameda [Research, a trading firm also founded by SBF], a bunch of customer assets and got back FTT in exchange. If that’s the case, then a crash in the price of FTT will destabilize FTX. If you’re worried about that, you should take your money out of FTX before the crash. If everyone is worried about that, they will all take their money out of FTX. But FTX doesn’t have their money; it has FTT and a loan to Alameda. If they all take their money out, that’s a bank run.”

“[D]ue to recent revelations,” Binance Holdings Ltd’s (CRYPTO: BNB) founder Changpeng Zhao (CZ) was prompted to sell large FTT holdings. “People worried that this would tank the price of FTT and put pressure on FTX, so they started withdrawing money from FTX. FTX didn’t have the money, and SBF started calling around asking for a loan or a bailout.”

The proposed bailout has since been withdrawn and CZ established some major takeaways as a result of the event: “1: Never use a token you created as collateral [and] 2: Don’t borrow if you run a crypto business. Don’t use capital ‘efficiently’. Have a large reserve.”

Now that the deal has fallen through, Coinbase’s CEO Brian Armstrong says it is likely users of FTX will “take losses.”

In summary, Alameda and FTX were far closer than they appeared. Alameda tapped into some large reserves of FTT and used them as collateral when borrowing customer funds from FTX. 

Per The Milk Road: If “Alameda’s investments go south, or the FTT collateral starts to dump in value, then Alameda goes down, and it pulls FTX down with it.”

Some Knew Earlier Than Others:

A fall in volumes and market share, “splintered attention”, the departure of executives including but not limited to FTX.US’ Brett Harrison and Alameda’s Sam Trabucco, “market manipulation allegations,” and “bad bull market decisions” such as partaking in NFT community “Doodles’ insane $54 million raise,” were some of the reasons prompting users to turn on FTX early.

Potential Follow-On Implication:

As Kai Volatility’s Cem Karsan puts eloquently, “[T]he collapse[s] of crypto will increasingly feed the [fire] of more traditional populism as its promise as a solution to the populism that fueled its ascent fades, leaving anger in its wake.”

That’s a narrative Karsan has maintained for as long as I can remember. Back in 2021, he and I spoke about the revolutionary technology of blockchain and its “broad association [and] use for cryptocurrency [being] tied up in the liquidity bubble that exists across all assets.”

Read the Daily Brief for November 9 to better understand this “liquidity bubble that exists across all assets.”

On the heels of scrutiny that was likely to come with some collapses, Karsan said there would likely be no “clear window where cryptocurrency is not subject to constraints,” adding that it’s likely “we move towards a digital dollar.”

Graphic: Retrieved from Bloomberg.

Circle (CRYPTO: USDC) co-founder and CEO Jeremy Allaire noted, too: 

“Once again, it’s moments like these that require all of us to hold crypto to a higher standard, a standard with greater transparency and accountability, enshrined in practice and in law,” adding that “Circle has no material exposure to FTX and Alameda.”

A ‘Good Practice For Indie Traders’: 

Independent volatility trader Darrin Johnson suggests traders “[s]weep excess cash into short-term T-notes or [money-market] accounts.” In case of some catastrophic events, “securities will be reimbursed at a higher notional value than cash.”

FTX’s Roadmap ‘For The Next Week’:

An online whistleblower shared messages allegedly sent by SBF to employees. 

In short, SBF’s “number one priority, right now, is to do right by customers.” To do so requires “a raise” which “may end up being a combined FTX Int[ernational] and FTX.US infusion.” Without a cash injection, the company would likely file for bankruptcy.

It’s reported SBF et al transferred ~$4 billion in FTX funds (e.g., customer deposits) to help buoy Alameda Research after severe losses including a $500 million loan agreement with Voyager.

Technical

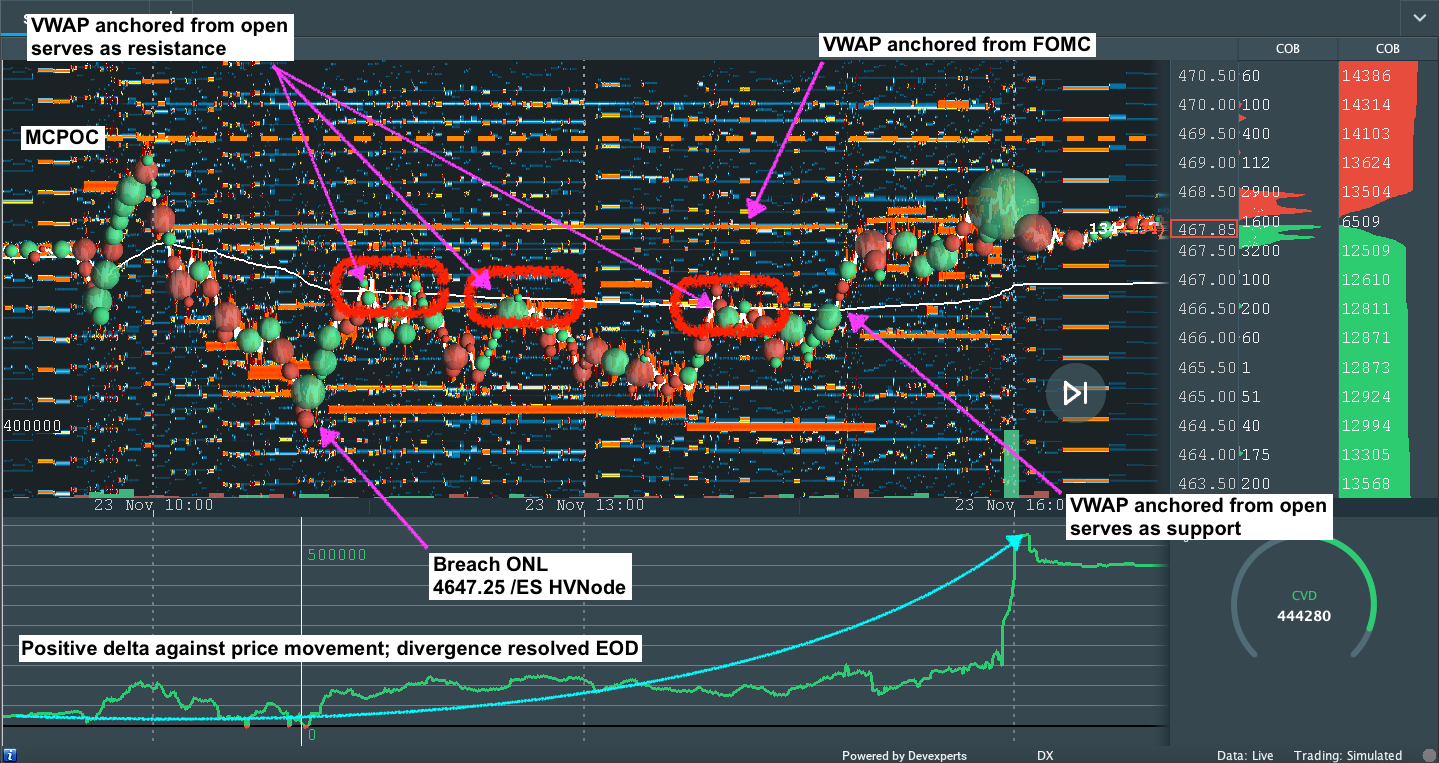
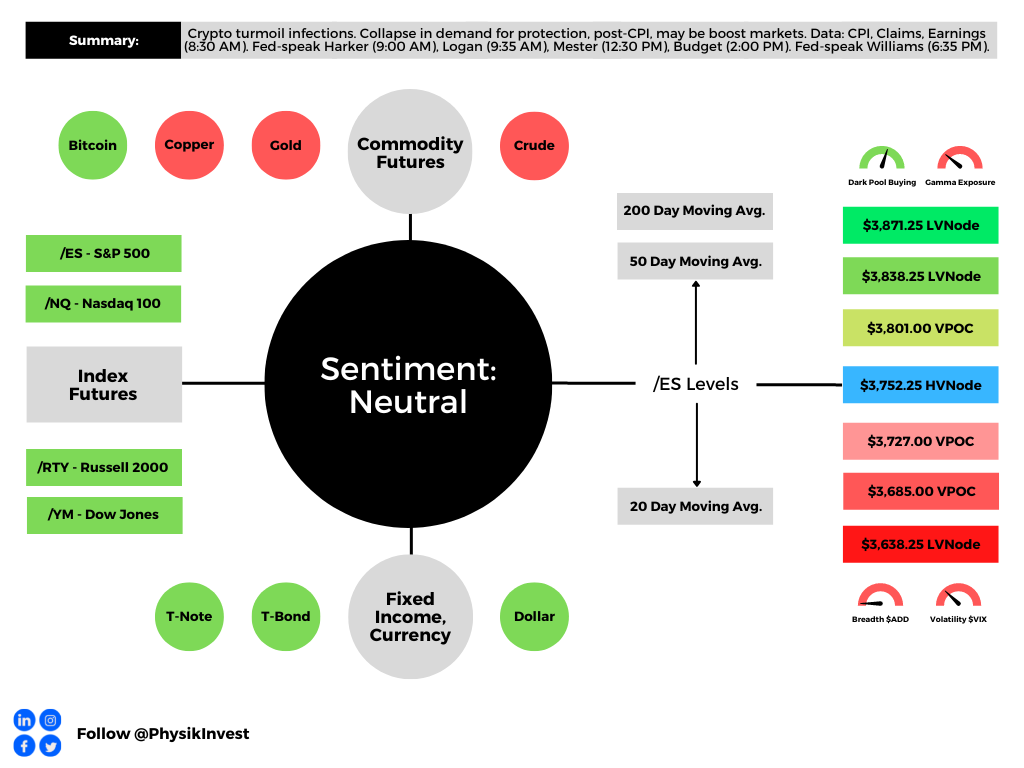
As of 8:00 AM ET, Thursday’s regular session (9:30 AM – 4:00 PM ET), in the S&P 500, is likely to open in the upper part of a positively skewed overnight inventory, inside of prior-range and -value, suggesting a limited potential for immediate directional opportunity.

In the best case, the S&P 500 trades higher.

Any activity above the $3,752.25 HVNode puts into play the $3,801.00 VPOC. Initiative trade beyond the VPOC could reach as high as the $3,838.25 and $3,871.25 LVNode, or higher.

In the worst case, the S&P 500 trades lower.

Any activity below the $3,752.25 HVNode puts into play the $3,727.00 VPOC. Initiative trade beyond the latter could reach as low as the $3,685.00 VPOC and $3,638.25 LVNode, or lower.

Click here to load today’s key levels into the web-based TradingView charting platform. Note that all levels are derived using the 65-minute timeframe. New links are produced, daily.

Graphic: 65-minute profile chart of the Micro E-mini S&P 500 Futures.

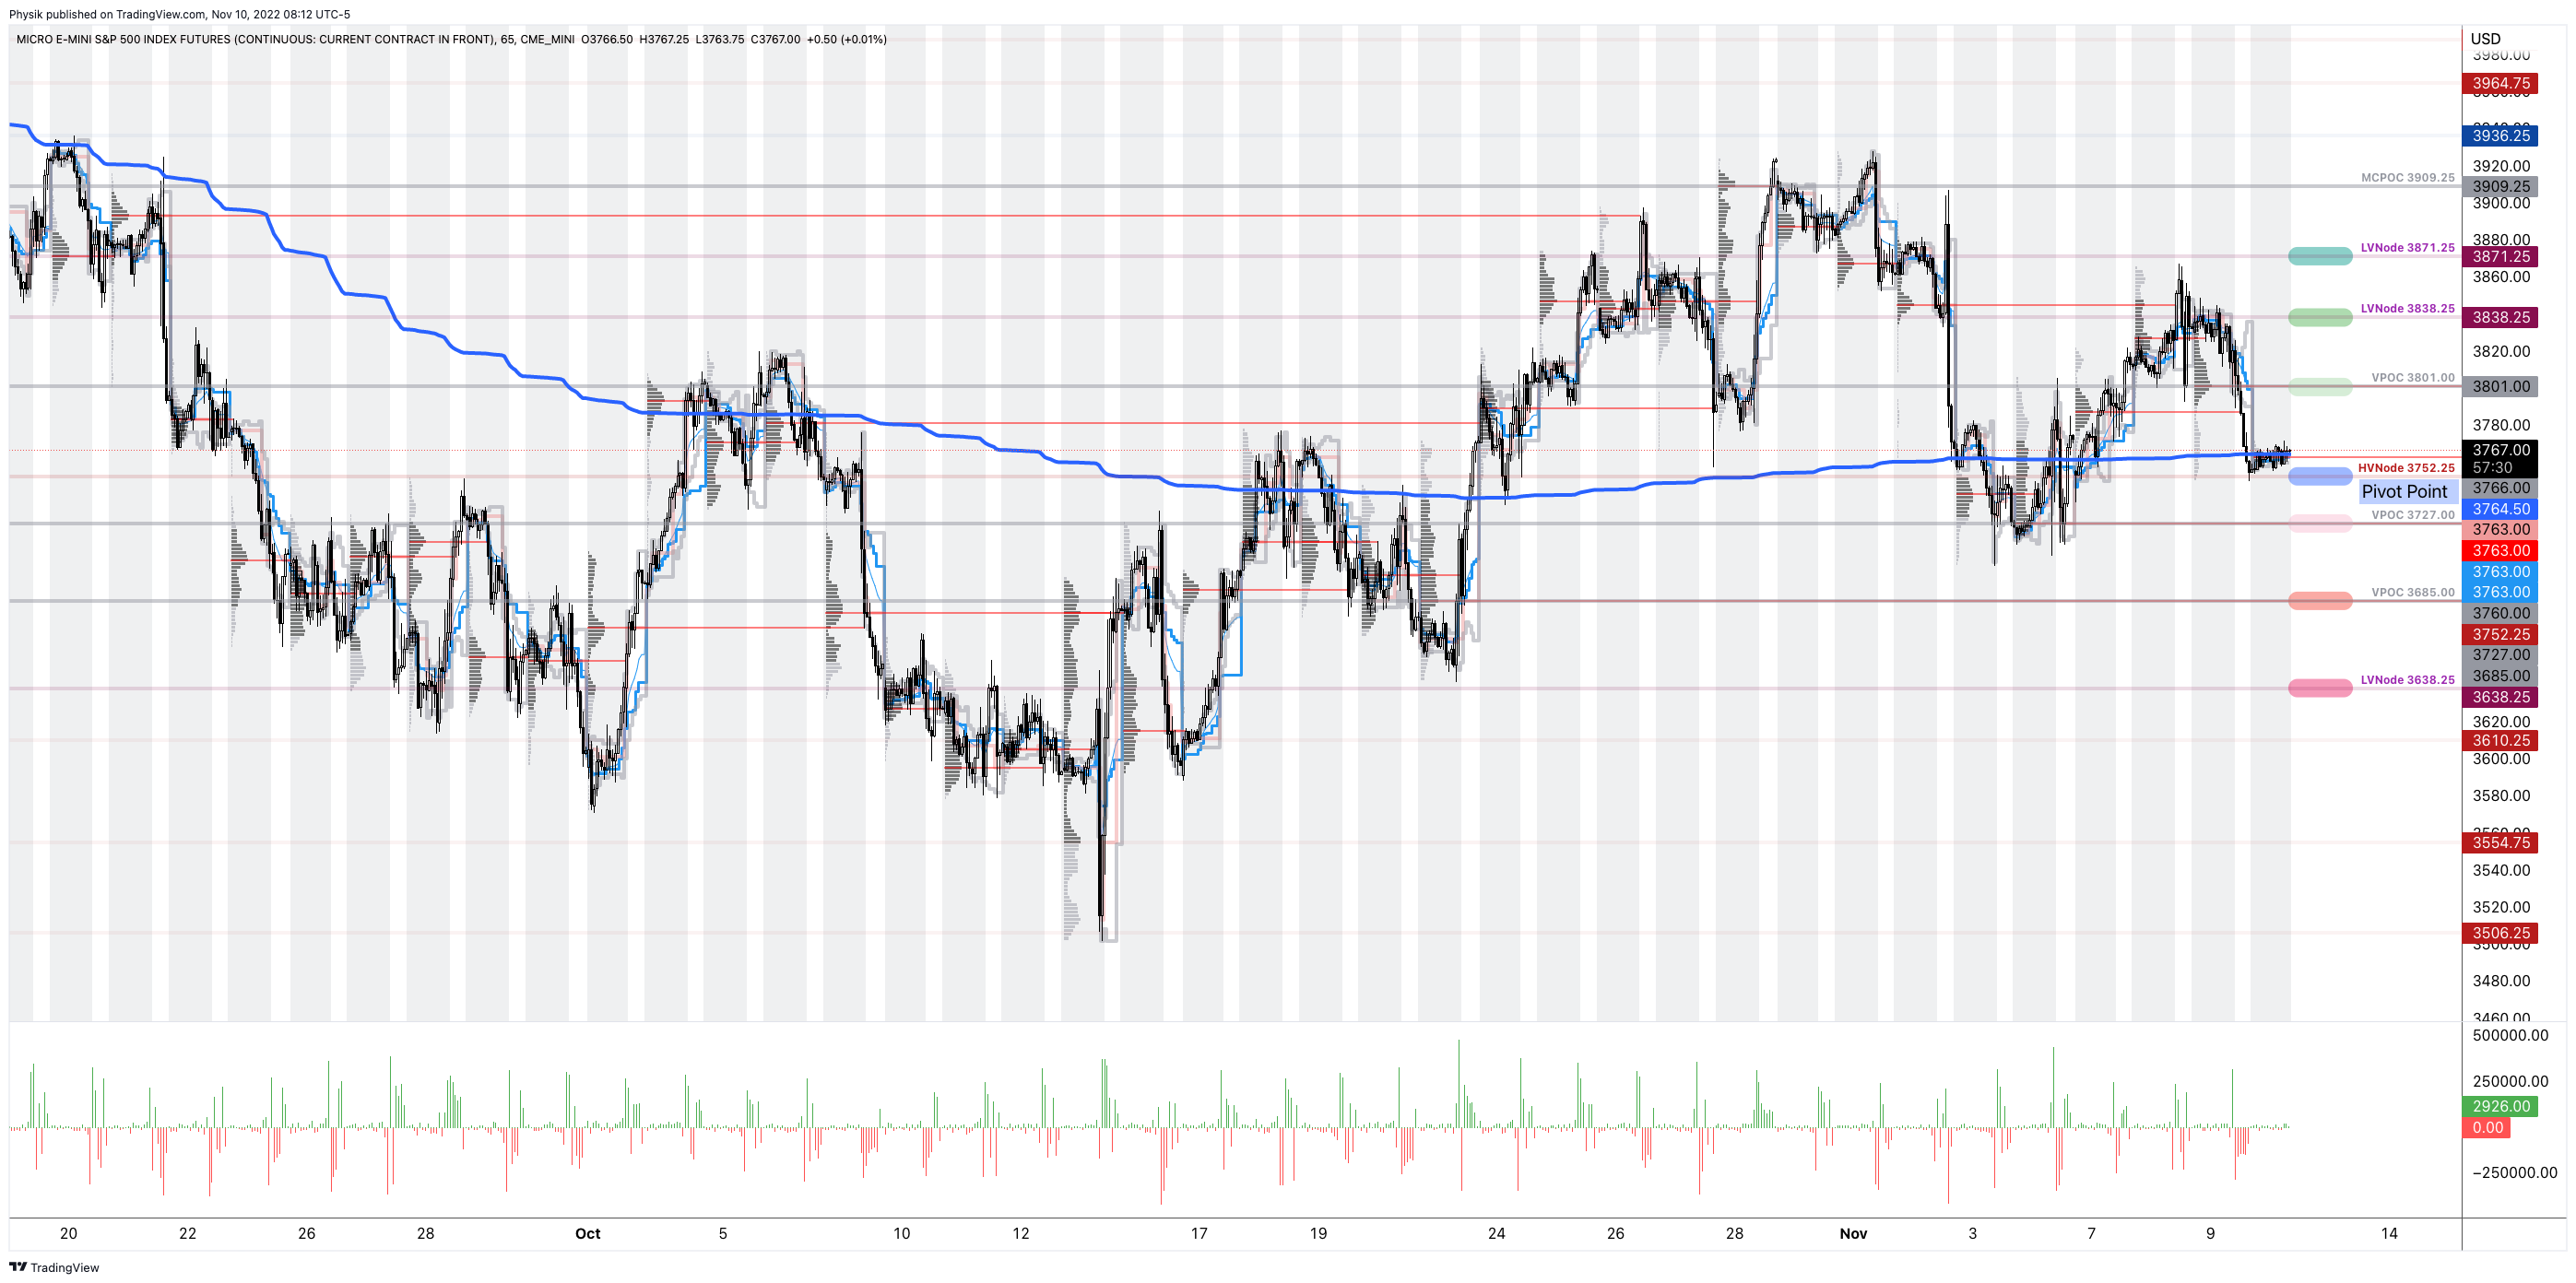
Considerations: Futures tied to the S&P 500 are trading within close proximity to a blue line in the above graphic. This blue line depicts a volume-weighted average price (VWAP) anchored to price action following the release of consumer price data on September 13, 2022.

The VWAP metric is highly regarded by chief investment officers, among other participants, for the quality of trade. Additionally, liquidity algorithms are benchmarked and programmed to buy and sell around VWAPs.

Should the S&P 500 auction away from this level, and come back to it, a prudent response is to fade. If the price is above the VWAP, and it auctions lower, into the VWAP, traders would buy. On the other hand, if the price is below the VWAP, and it auctions higher, into the VWAP, sell.

At this time, the S&P 500 is near VWAP offering traders lower (directional) opportunities.

Definitions

Volume Areas: A structurally sound market will build on areas of high volume (HVNodes). Should the market trend for long periods of time, it will lack sound structure, identified as low volume areas (LVNodes). LVNodes denote directional conviction and ought to offer support on any test. 

If participants were to auction and find acceptance into areas of prior low volume (LVNodes), then future discovery ought to be volatile and quick as participants look to HVNodes for favorable entry or exit.

POCs: POCs are valuable as they denote areas where two-sided trade was most prevalent in a prior day session. Participants will respond to future tests of value as they offer favorable entry and exit.

About

After years of self-education, strategy development, mentorship, and trial-and-error, Renato Leonard Capelj began trading full-time and founded Physik Invest to detail his methods, research, and performance in the markets.

Capelj also develops insights around impactful options market dynamics at SpotGamma and is a Benzinga reporter.

Some of his works include conversations with ARK Invest’s Catherine Wood, investors Kevin O’Leary and John Chambers, FTX’s Sam Bankman-Fried, ex-Bridgewater Associate Andy Constan, Kai Volatility’s Cem Karsan, The Ambrus Group’s Kris Sidial, among many others.

Disclaimer

In no way should the materials herein be construed as advice. Derivatives carry a substantial risk of loss. All content is for informational purposes only.

Categories
Commentary

Daily Brief For June 15, 2022

The daily brief is a free glimpse into the prevailing fundamental and technical drivers of U.S. equity market products. Join the 300+ that read this report daily, below!

What Happened

The calm before the storm.

Overnight, equity index futures auctioned sideways, inside of a developing balance area. The S&P 500 was glued to the area above $3,700.00.

The Treasury rout cooled. T-Note (FUTURE: /ZN) and T-Bond (FUTURE: /ZB) futures were off their lows. Per Bloomberg, the sell-off in fixed income wiped nearly $10 trillion of value in global bonds, erasing post-Pandemic gains on stimulative central bank intervention.

This letter has talked about the bonds and equities down phenomenon before. It is the shifting in priorities at the policy level – from monetary to fiscal – driving (more) positive correlations.

Abroad, the slump solicited the attention of policymakers. The European Central Bank (ECB) said it would have an emergency meeting to discuss current market conditions. Policymakers are to sign off on the reinvestment of bond purchases conducted during the pandemic.

In other news, the American Petroleum Institute issued policies to unleash American energy and fuel recovery. The U.S. rebuffed China by calling the Taiwan Strait an international waterway as CEOs urge the U.S. Congress to pass a China competition bill. More news of layoffs hit the wire also. Coinbase Global Inc (NASDAQ: COIN) will lay off 18% of its workforce, alongside many other crypto companies. 

Elsewhere, Redfin Corporation (NASDAQ: RDFN) and Compass Inc (NYSE: COMP) are laying off workers, as are automotive manufacturers.

Ahead is a packed calendar. To be released is data on retail sales, import prices, and manufacturing (8:30 AM ET). Later is data on home building and inventories (10:00 AM ET).

Key is the Federal Open Market Committee (FOMC) statement, projections, and news conference (2:00 PM ET).

Graphic updated 6:30 AM ET. Sentiment Neutral if expected /ES open is inside of the prior day’s range. /ES levels are derived from the profile graphic at the bottom of the following section. Levels may have changed since initially quoted; click here for the latest levels. SqueezeMetrics Dark Pool Index (DIX) and Gamma (GEX) calculations are based on where the prior day’s reading falls with respect to the MAX and MIN of all occurrences available. A higher DIX is bullish. At the same time, the lower the GEX, the more (expected) volatility. Learn the implications of volatility, direction, and moneyness. SHIFT data used for S&P 500 (INDEX: SPX) options activity. Note that options flow is sorted by the call premium spent; if more positive, then more was spent on call options. Breadth reflects a reading of the prior day’s NYSE Advance/Decline indicator. VIX reflects a current reading of the CBOE Volatility Index (INDEX: VIX) from 0-100.

What To Expect

Fundamental: Let’s keep it short and to the point.

As talked about, yesterday, the FOMC is expected to raise rates by 75 basis points in light of new data. Per Bloomberg, “Powell will argue that a supersized move is needed to preempt inflation expectations from unanchoring.”

Graphic: Via CME Group Inc’s (NASDAQ: CME) FedWatch Tool.

The peak in rates is somewhere in the 3.75-4.00% range out in early-to-mid 2023. Into that date range, there is a 100% the Fed will hike.

Graphic: Via Federal Home Loan Mortgage Corporation (OTC: FMCC). “The housing market is incredibly rate-sensitive, so as mortgage rates increase suddenly, demand again is pulling back.”

On the quantitative tightening (QT) side of things, which is the direct (out) flow of capital from capital markets, the Fed will stop reinvesting the proceeds of maturing Treasuries for the first time since the start of quantitative easing (QE).

Per the Financial Times, in May, FOMC members agreed to cap their monthly balance-sheet run-off at $30 billion in U.S. Treasuries (UST) and $17.5 billion for agency mortgage-backed securities (MBS). 

This will have an effect on prices “as liquidity – the ease with which investors can buy and sell assets – deteriorates as markets grapple with a larger amount of bond supply to absorb.”

Moreover, in the recent sale of bonds, liquidity was “worse than it was leading up to Lehman,” and, accordingly, this has played into repo dislocations.

“As customers sell their position to dealers, there’s limited liquidity in the off-the-run markets so the dealers short-sell currents,” Scott Skyrm of Curvature Securities says on increased buys and sells leading to more settlement activity, which plays into more fails.

“Market participants reduce their investments and leverage and go into ‘cash,’ leaving more actual cash in the repo market.”

Therefore, Treasury securities, across all tenors, have traded below the rate on overnight general collateral repurchase agreements. 

This could “be a sign of another shortage of collateral and that another systemic risk event might come up in the future,” as Fabian Wintersberger well explained in his newsletter.

Graphic: Via Fabian Wintersberger. Data from Bloomberg. 

Wintersberger adds: “All those things suggest that the storm we are currently facing in markets is just the beginning. The war in Ukraine, a rising interest rate environment, energy costs that subdue the outlook for the real economy, and finally, signals of stress in financial markets imply that there might be tough times ahead.”

Positioning: The divergence in volatility implied (IVOL) by participants’ options activity, versus that which the market realizes (RVOL) was resolved.

Graphic: Taken by Physik Invest from Interactive Brokers Group Inc (NASDAQ: IBKR).

As I wrote in my commentary for options data and analysis platform SpotGamma, yesterday, pursuant to remarks made in Physik Invest’s recent letters, volatility repriced and that was a boon for participants who bought into the implied skew convexity idea.

Graphic: Taken by Physik Invest from Interactive Brokers Group Inc (NASDAQ: IBKR).

Moreover, $3,700.00 SPX is a key level, per SpotGamma. This is because there is sizeable interest at that level expiring June 17, after FOMC. These options have little time to expiry and, thus, their gamma (options sensitivity to direction) grows rather large, at near-the-money strikes.

Graphic: Text taken from Exotic Options and Hybrids: A Guide to Structuring, Pricing and Trading. 

In theory, we see participants as owning protection against their stock exposures. Therefore, the counterparties are short puts (positive delta) and short stock or futures (negative delta).

As the time to expiry narrows, above the strike in question delta decays, and counterparts buy back their static delta hedges. 

As the time to expiry narrows, below the strike in question delta expands and counterparts sell more static delta to hedge.

Graphic: Text taken from Exotic Options and Hybrids: A Guide to Structuring, Pricing and Trading.

That means, depending on what happens with FOMC, if below $3,700.00, associated hedging, less any new reach for protection would pressure markets lower. If above $3,700.00, hedging, less any new sale of protection, would bolster markets higher.

Graphic: Taken by Physik Invest from Interactive Brokers Group Inc (NASDAQ: IBKR).

If lower, all else equal, the June 17 options expiration will coincide with the removal of the in-the-money options exposures in question. This opens a window during which markets may have less pressure to rally against.

Technical: As of 6:30 AM ET, Wednesday’s regular session (9:30 AM – 4:00 PM ET), in the S&P 500, will likely open in the lower part of a positively skewed overnight inventory, inside of prior-range and -value, suggesting a limited potential for immediate directional opportunity.

In the best case, the S&P 500 trades higher; activity above the $3,768.25 HVNode puts in play the $3,808.50 HVNode. Initiative trade beyond the $3,808.50 HVNode could reach as high as the $3,836.25 LVNode and $3,863.25 LVNode, or higher.

In the worst case, the S&P 500 trades lower; activity below the $3,768.25 HVnode puts in play the $3,727.75 HVNode. Initiative trade beyond the $3,727.75 HVNode could reach as low as the $3,688.75 and $3,664.25 HVNode, or lower.

Click here to load today’s key levels into the web-based TradingView charting platform. Note that all levels are derived using the 65-minute timeframe. New links are produced, daily.
Graphic: 65-minute profile chart of the Micro E-mini S&P 500 Futures. Updated: 6/14/2022.

Definitions

Should the market trend for long periods of time, it will lack sound structure, identified as low volume areas (LVNodes). LVNodes denote directional conviction and ought to offer support on any test. 

If participants were to auction and find acceptance into areas of prior low volume (LVNodes), then future discovery ought to be volatile and quick as participants look to HVNodes for favorable entry or exit.

Point Of Control: POCs are valuable as they denote areas where two-sided trade was most prevalent in a prior day session. Participants will respond to future tests of value as they offer favorable entry and exit.

Micro Composite Point Of Control: POCs are valuable as they denote areas where two-sided trade was most prevalent over numerous day sessions. Participants will respond to future tests of value as they offer favorable entry and exit.

Volume-Weighted Average Prices (VWAPs): A metric highly regarded by chief investment officers, among other participants, for quality of trade. Additionally, liquidity algorithms are benchmarked and programmed to buy and sell around VWAPs.

About

After years of self-education, strategy development, mentorship, and trial-and-error, Renato Leonard Capelj began trading full-time and founded Physik Invest to detail his methods, research, and performance in the markets.

Capelj also develops insights around impactful options market dynamics at SpotGamma and is a Benzinga reporter.

Some of his works include conversations with ARK Invest’s Catherine Wood, investors Kevin O’Leary and John Chambers, FTX’s Sam Bankman-Fried, Kai Volatility’s Cem Karsan, The Ambrus Group’s Kris Sidial, among many others.

Disclaimer

In no way should the materials herein be construed as advice. Derivatives carry a substantial risk of loss. All content is for informational purposes only.

Categories
Commentary

Daily Brief For November 24, 2021

What Happened

Overnight, equity index futures auctioned within the confines of Tuesday’s range, unable to follow through on attempts higher or lower. This comes as there was a clear validation of Monday’s knee-jerk selling.

This sideways-to-lower price action in the index products is happening alongside a sell-off in new issues and richly priced technology stocks. Part of the weakness may have something to do with investors booking capital losses to lower their capital gains. 

The other part of it, according to Bloomberg, is an exodus among professional investors who were counting on high-flyers to salvage their year. 

“There was a desire to kind of keep up with the broader index. And there was definitely a view that those are higher-beta assets and that’s a way to try and play a little bit of catch-up,” Barclays Plc’s (NYSE: BCS) Todd Sandoz said. “When the market turns and it’s not working, you need to take risks down. And everybody’s in those names, so you also probably have a view to try to cut things faster.”

With indices pinned and heavily weighted constituents sideways to higher, there is only one form of reconciliation – a decline in correlation. Nonetheless, fundamentals are no different; investors may be able to buy quality stocks at a discount amidst the market’s entry into a seasonally bullish period. 

Buybacks and increased retail engagement, resilient activity, and macro metrics, as well as excess liquidity, in the face of central bank cautiousness, suggest “dips should be bought,” according to Barclays.

Ahead is data on jobless claims, GDP, durable and core capital goods orders, and trade in goods (8:30 AM ET). Thereafter is data on personal and disposable income, consumer spending, core inflation, home sales, sentiment, and 5-year inflation expectations (10:00 AM ET). FOMC minutes come later (2:00 PM ET). 

Graphic updated 6:00 AM ET. Sentiment Neutral if expected /ES open is inside of the prior day’s range. /ES levels are derived from the profile graphic at the bottom of the following section. Levels may have changed since initially quoted; click here for the latest levels. SqueezeMetrics Dark Pool Index (DIX) and Gamma (GEX) calculations are based on where the prior day’s reading falls with respect to the MAX and MIN of all occurrences available. A higher DIX is bullish. At the same time, the lower the GEX, the more (expected) volatility. Learn the implications of volatility, direction, and moneyness. SHIFT data used for S&P 500 (INDEX: SPX) options activity. Note that options flow is sorted by the call premium spent; if more positive then more was spent on call options. Breadth reflects a reading of the prior day’s NYSE Advance/Decline indicator. VIX reflects a current reading of the CBOE Volatility Index (INDEX: VIX) from 0-100.

What To Expect

On divergent intraday breadth and market liquidity metrics, the worst-case outcome occurred, evidenced by an acceptance of Monday’s knee-jerk, high-tempo selling.

Though this activity marks a potential willingness to start trending lower, the nature of Monday’s liquidation, as well as the failure to follow-through (i.e., expand the range to the downside) forces us to question whether participants have it in them to push indices lower. 

In light of the activity we’re seeing, it’s tough to pick a direction and stick with it; the higher odds play, in light of the divergences we’re seeing in breadth metrics between exchanges, as well as market liquidity (below), is to responsively buy dips and sell rips.

Key levels to trade against are the high volume areas (HVNodes) at $4,691.25 and $4,647.25. The latter level corresponds with the 20-day simple moving average.

These levels are the clearest ways to measure risk, given the mechanical responses in prior trade. Should participants manage to break past either level, then conditions have changed. Follow-through is likely. Reason being? Those visual levels are acted on by short-term, technically-driven market participants who generally are unable to defend retests.
Graphic: Divergent delta (i.e., non-committed selling as measured by volume delta or buying and selling power as calculated by the difference in volume traded at the bid and offer) in SPDR S&P 500 ETF Trust (NYSE: SPY), one of the largest ETFs that track the S&P 500 index, via Bookmap. The readings are supportive of responsive trade (i.e., rotational trade that suggests current prices offer favorable entry and exit; the market is in balance).

Context: Keeping this section very short.

We saw the CBOE Volatility Index (INDEX: VIX) end higher, yesterday. 

However, supply came in across the entire area of the VIX futures term structure. That, with the long-gamma environment (defined below), suggests participants are not reaching for hedges.

For the time being, that’s stabilizing, cognizant of the fact that exuberance in individual stocks, over the past weeks, fed into the stock indices themselves.

Further, the price action we’re seeing is likely the resolve of some of that weak breadth we were seeing, recently, in addition to some of the topics discussed at the beginning of this newsletter.

Graphic: Divergences in breadth. SPX versus % of SPX stocks above the 200-day average.

In short, however, should volatility continue to pick up, those participants (who were once exuberant) may reach for protection forcing dealers to reflexively hedge in a destabilizing manner.

Once that protection rolls off the table (expires and/or is monetized), dealers will reverse and support the market, buying-to-close existing stock/futures hedges to negative gamma positions. 

This flow is stabilizing and may support a seasonally-aligned rally into Christmas.

Expectations: As of 6:00 AM ET, Wednesday’s regular session (9:30 AM – 4:00 PM ET), in the S&P 500, will likely open in the middle part of a negatively skewed overnight inventory, inside of prior-range and -value, suggesting a limited potential for immediate directional opportunity.

Spike Scenario In Play: A spike marks the beginning of a break from value. Spikes higher (lower) are validated by trade at or above (below) the spike base (i.e., the origin of the spike).

The spike may also be looked at as a pivot; in today’s case, the spike base is $4,697.50.

In the best case, the S&P 500 trades sideways or higher; activity above the $4,691.25 high volume area (HVNode) puts in play the $4,711.00 untested point of control (VPOC). Initiative trade beyond the VPOC could reach as high as the $4,740.50 minimal excess high and $4,765.25 Fibonacci, or higher.

In the worst case, the S&P 500 trades lower; activity below the $4,691.25 HVNode puts in play the $4,674.25 micro composite point of control (MCPOC). Initiative trade beyond the MCPOC could reach as low as the $4,647.25 HVNode and $4,619.00 VPOC, or lower.

Click here to load today’s updated key levels into the web-based TradingView charting platform. Note that all levels are derived using the 65-minute timeframe. New links are produced, daily.
Graphic: 65-minute profile chart of the Micro E-mini S&P 500 Futures. Learn about the profile.

Charts To Watch

What People Are Saying

Definitions

Overnight Rally Highs (Lows): Typically, there is a low historical probability associated with overnight rally-highs (lows) ending the upside (downside) discovery process.

Volume Areas: A structurally sound market will build on areas of high volume (HVNodes). Should the market trend for long periods of time, it will lack sound structure, identified as low volume areas (LVNodes). LVNodes denote directional conviction and ought to offer support on any test. 

If participants were to auction and find acceptance into areas of prior low volume (LVNodes), then future discovery ought to be volatile and quick as participants look to HVNodes for favorable entry or exit.

Gamma: Gamma is the sensitivity of an option to changes in the underlying price. Dealers that take the other side of options trades hedge their exposure to risk by buying and selling the underlying. When dealers are short-gamma, they hedge by buying into strength and selling into weakness. When dealers are long-gamma, they hedge by selling into strength and buying into weakness. The former exacerbates volatility. The latter calms volatility.

POCs: POCs are valuable as they denote areas where two-sided trade was most prevalent in a prior day session. Participants will respond to future tests of value as they offer favorable entry and exit.

MCPOCs: POCs are valuable as they denote areas where two-sided trade was most prevalent over numerous day sessions. Participants will respond to future tests of value as they offer favorable entry and exit.

About

After years of self-education, strategy development, and trial-and-error, Renato Leonard Capelj began trading full-time and founded Physik Invest to detail his methods, research, and performance in the markets.

Additionally, Capelj is a Benzinga finance and technology reporter interviewing the likes of Shark Tank’s Kevin O’Leary, JC2 Ventures’ John Chambers, and ARK Invest’s Catherine Wood, as well as a SpotGamma contributor, developing insights around impactful options market dynamics.

Disclaimer

At this time, Physik Invest does not manage outside capital and is not licensed. In no way should the materials herein be construed as advice. Derivatives carry a substantial risk of loss. All content is for informational purposes only.