The daily brief is a free glimpse into the prevailing fundamental and technical drivers of U.S. equity market products. Join the 900+ that read this report daily, below!
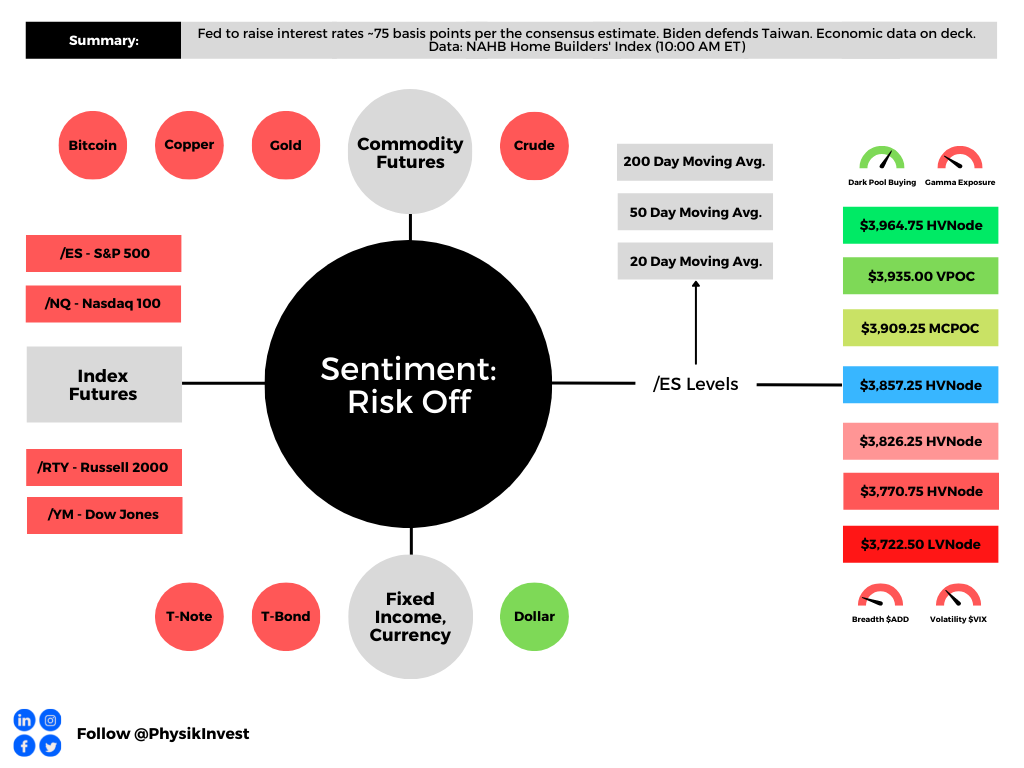
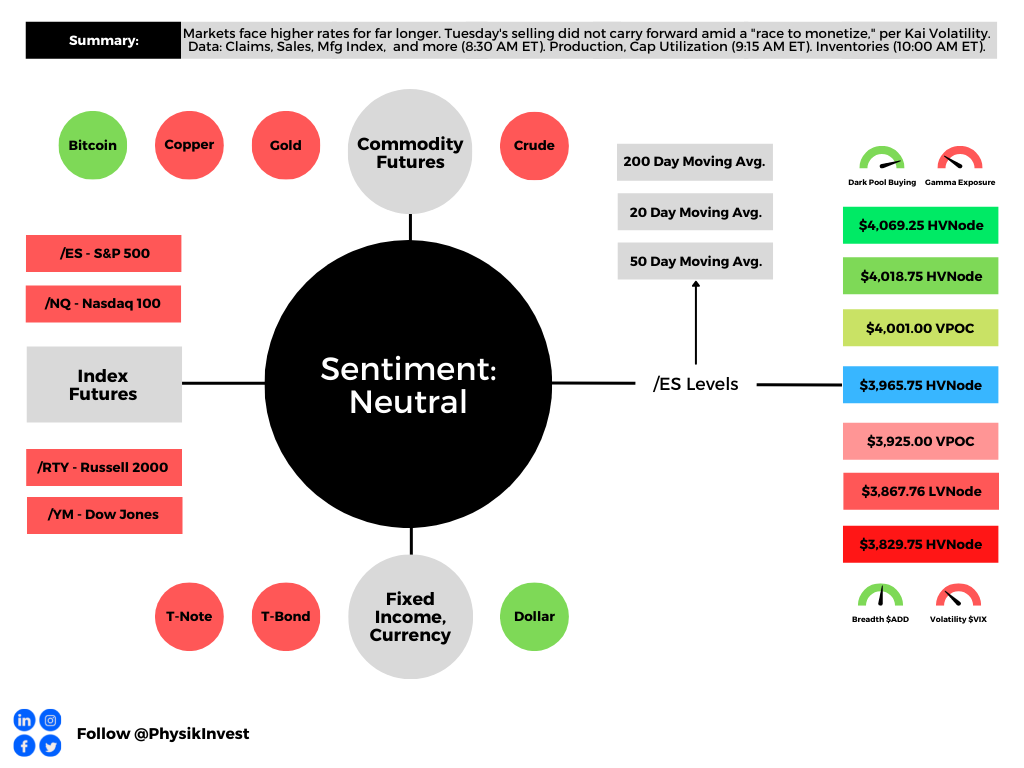
Graphic updated 6:45 AM ET. Sentiment Risk-Off if expected /ES open is below the prior day’s range. /ES levels are derived from the profile graphic at the bottom of the following section. Levels may have changed since initially quoted; click here for the latest levels. SqueezeMetrics Dark Pool Index (DIX) and Gamma (GEX) calculations are based on where the prior day’s reading falls with respect to the MAX and MIN of all occurrences available. A higher DIX is bullish. At the same time, the lower the GEX, the more (expected) volatility. Learn the implications of volatility, direction, and moneyness. Breadth reflects a reading of the prior day’s NYSE Advance/Decline indicator. VIX reflects a current reading of the CBOE Volatility Index (INDEX: VIX) from 0-100.
Administrative
Slow start to the week with some color on statements made in last week’s detailed newsletters, like the one published on September 16, 2022.
As an aside, some updates are coming to this letter’s format and you will be in the loop on what those are and why, shortly.
Fundamental
This is the season for volatility. The S&P 500’s (INDEX: SPX) monthly realized volatility, over a period spanning 1928 to 2021, has historically been high during this part of the year.
Graphic: Retrieved from The Market Ear. Via Goldman Sachs Group Inc (NYSE: GS).
Adding to the volatility are uncertainties with respect to the macro environment. For example, last week we discussed the implementation of contractionary monetary policies for reducing inflation and growth.
Read the Daily Brief for September 16, 2022, for detail on rates, quantitative tightening (and its impact on lending and market liquidity), as well as positioning and beyond.
Given the lagging data policymakers input into their decision-making, versus what non-lagging indicators are showing the likes of Catherine Wood and Elon Musk, “deflation is in the pipeline,” and the Fed may hike into a “deep recession,” as BlackRock Inc (NYSE: BLK) strategists put.
Per Andreas Steno Larsen, in the latest Consumer Price Index (CPI) report, which had traders pricing increased odds of a 100 basis point hike to interest rates, shelter costs did much of the “heavy lifting.”
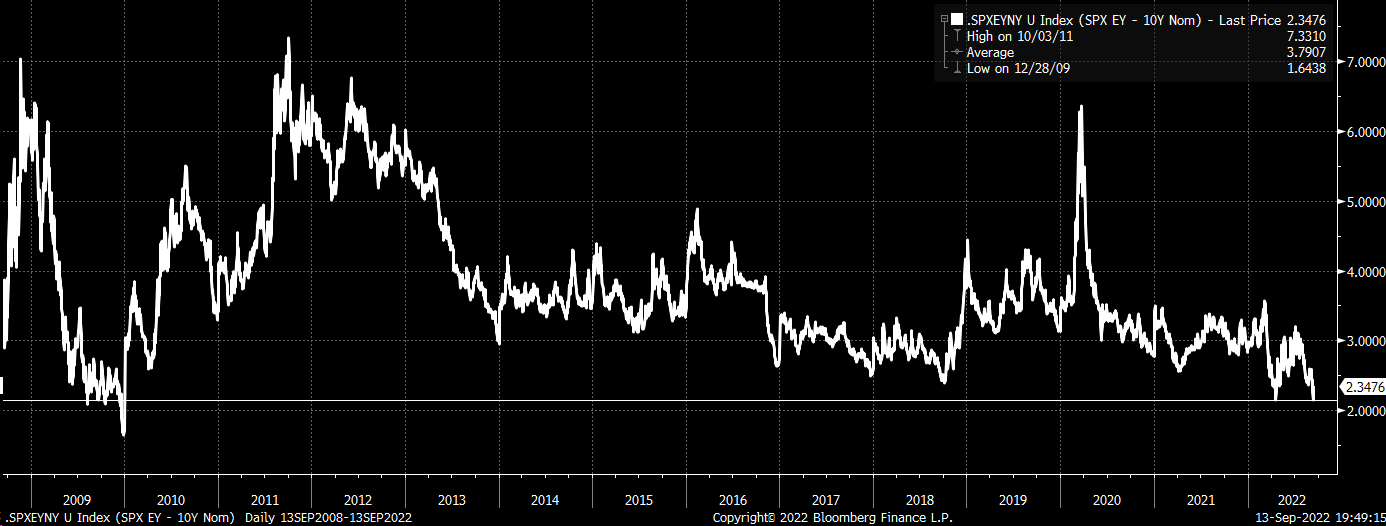
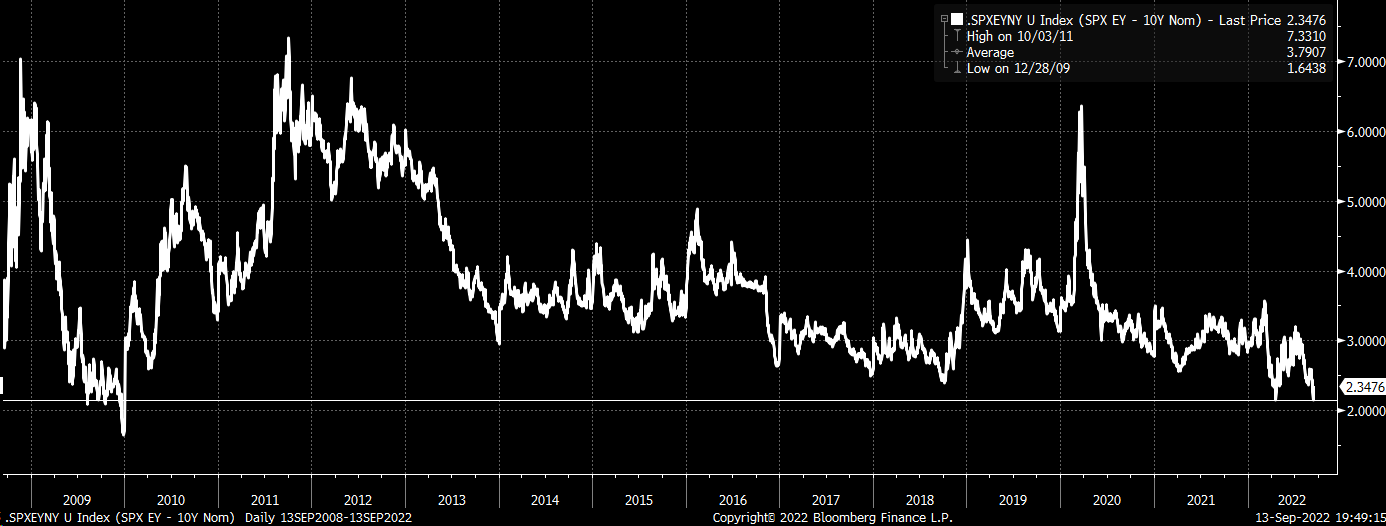
Graphic: Retrieved from Bloomberg via Michael J. Kramer. Based on where rates are at, the market may still be too expensive.
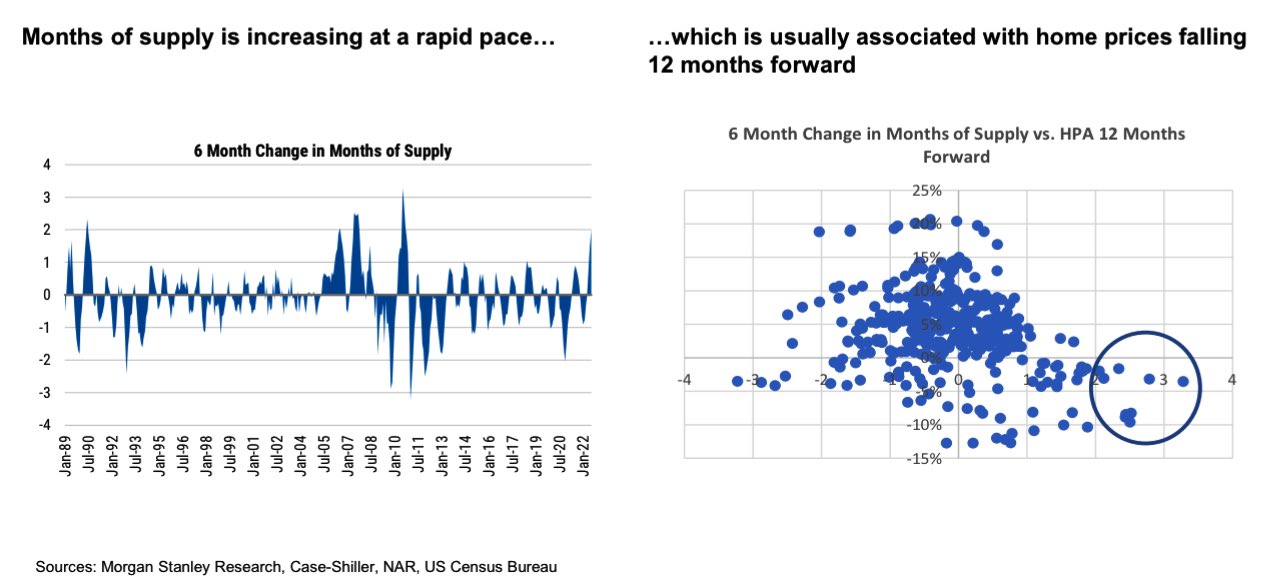
The MoM shelter costs were up in excess of 0.7%. Notwithstanding, the “[c]ost of shelter is the most lagging variable in the basket,” all the while the “shelter index in the CPI basket lags the housing price development by up to 18 months.”
As a result, this means drops in rents and home prices could “take more than a year for the CPI methodology to” account.
Graphic: Via Morgan Stanley (NYSE: MS) research.
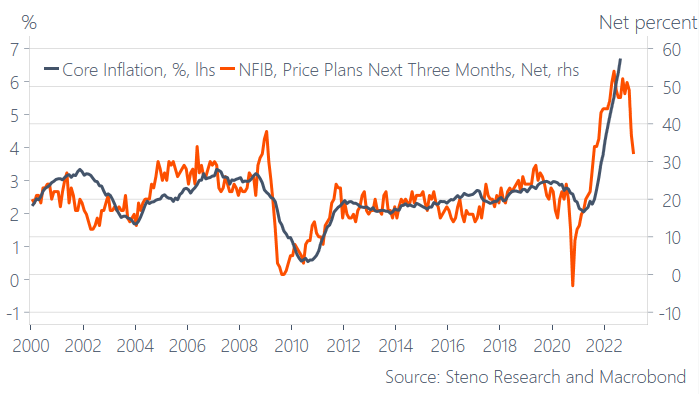
These aforementioned comments, coupled with reports issued by the National Federation of Independent Business, boost the cases of those claiming inflation has peaked, such as Musk and Wood.
Steno Larsen puts forth that “most analysts and newsletter-sellers … missed the most important inflation print of the week, namely the NFIB price plan survey” which bolsters the case for prices reaching their “new highs in YoY terms.”
Pointing readers back to the September 16, 2022 letter for contexts on the positioning.
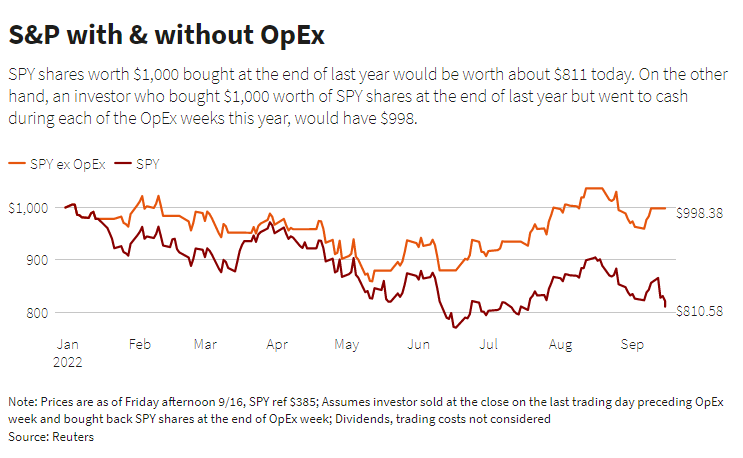
Further, it is essentially the case that “2022 is a put-weighted regime [and] returns are negative into options expiration (OPEX) and positive after,” explained SpotGamma on Sunday.
The impact of OPEX is so staggering that “flipping to cash” the week of expiry nets far better returns than holding S&P 500 without any adjustments.
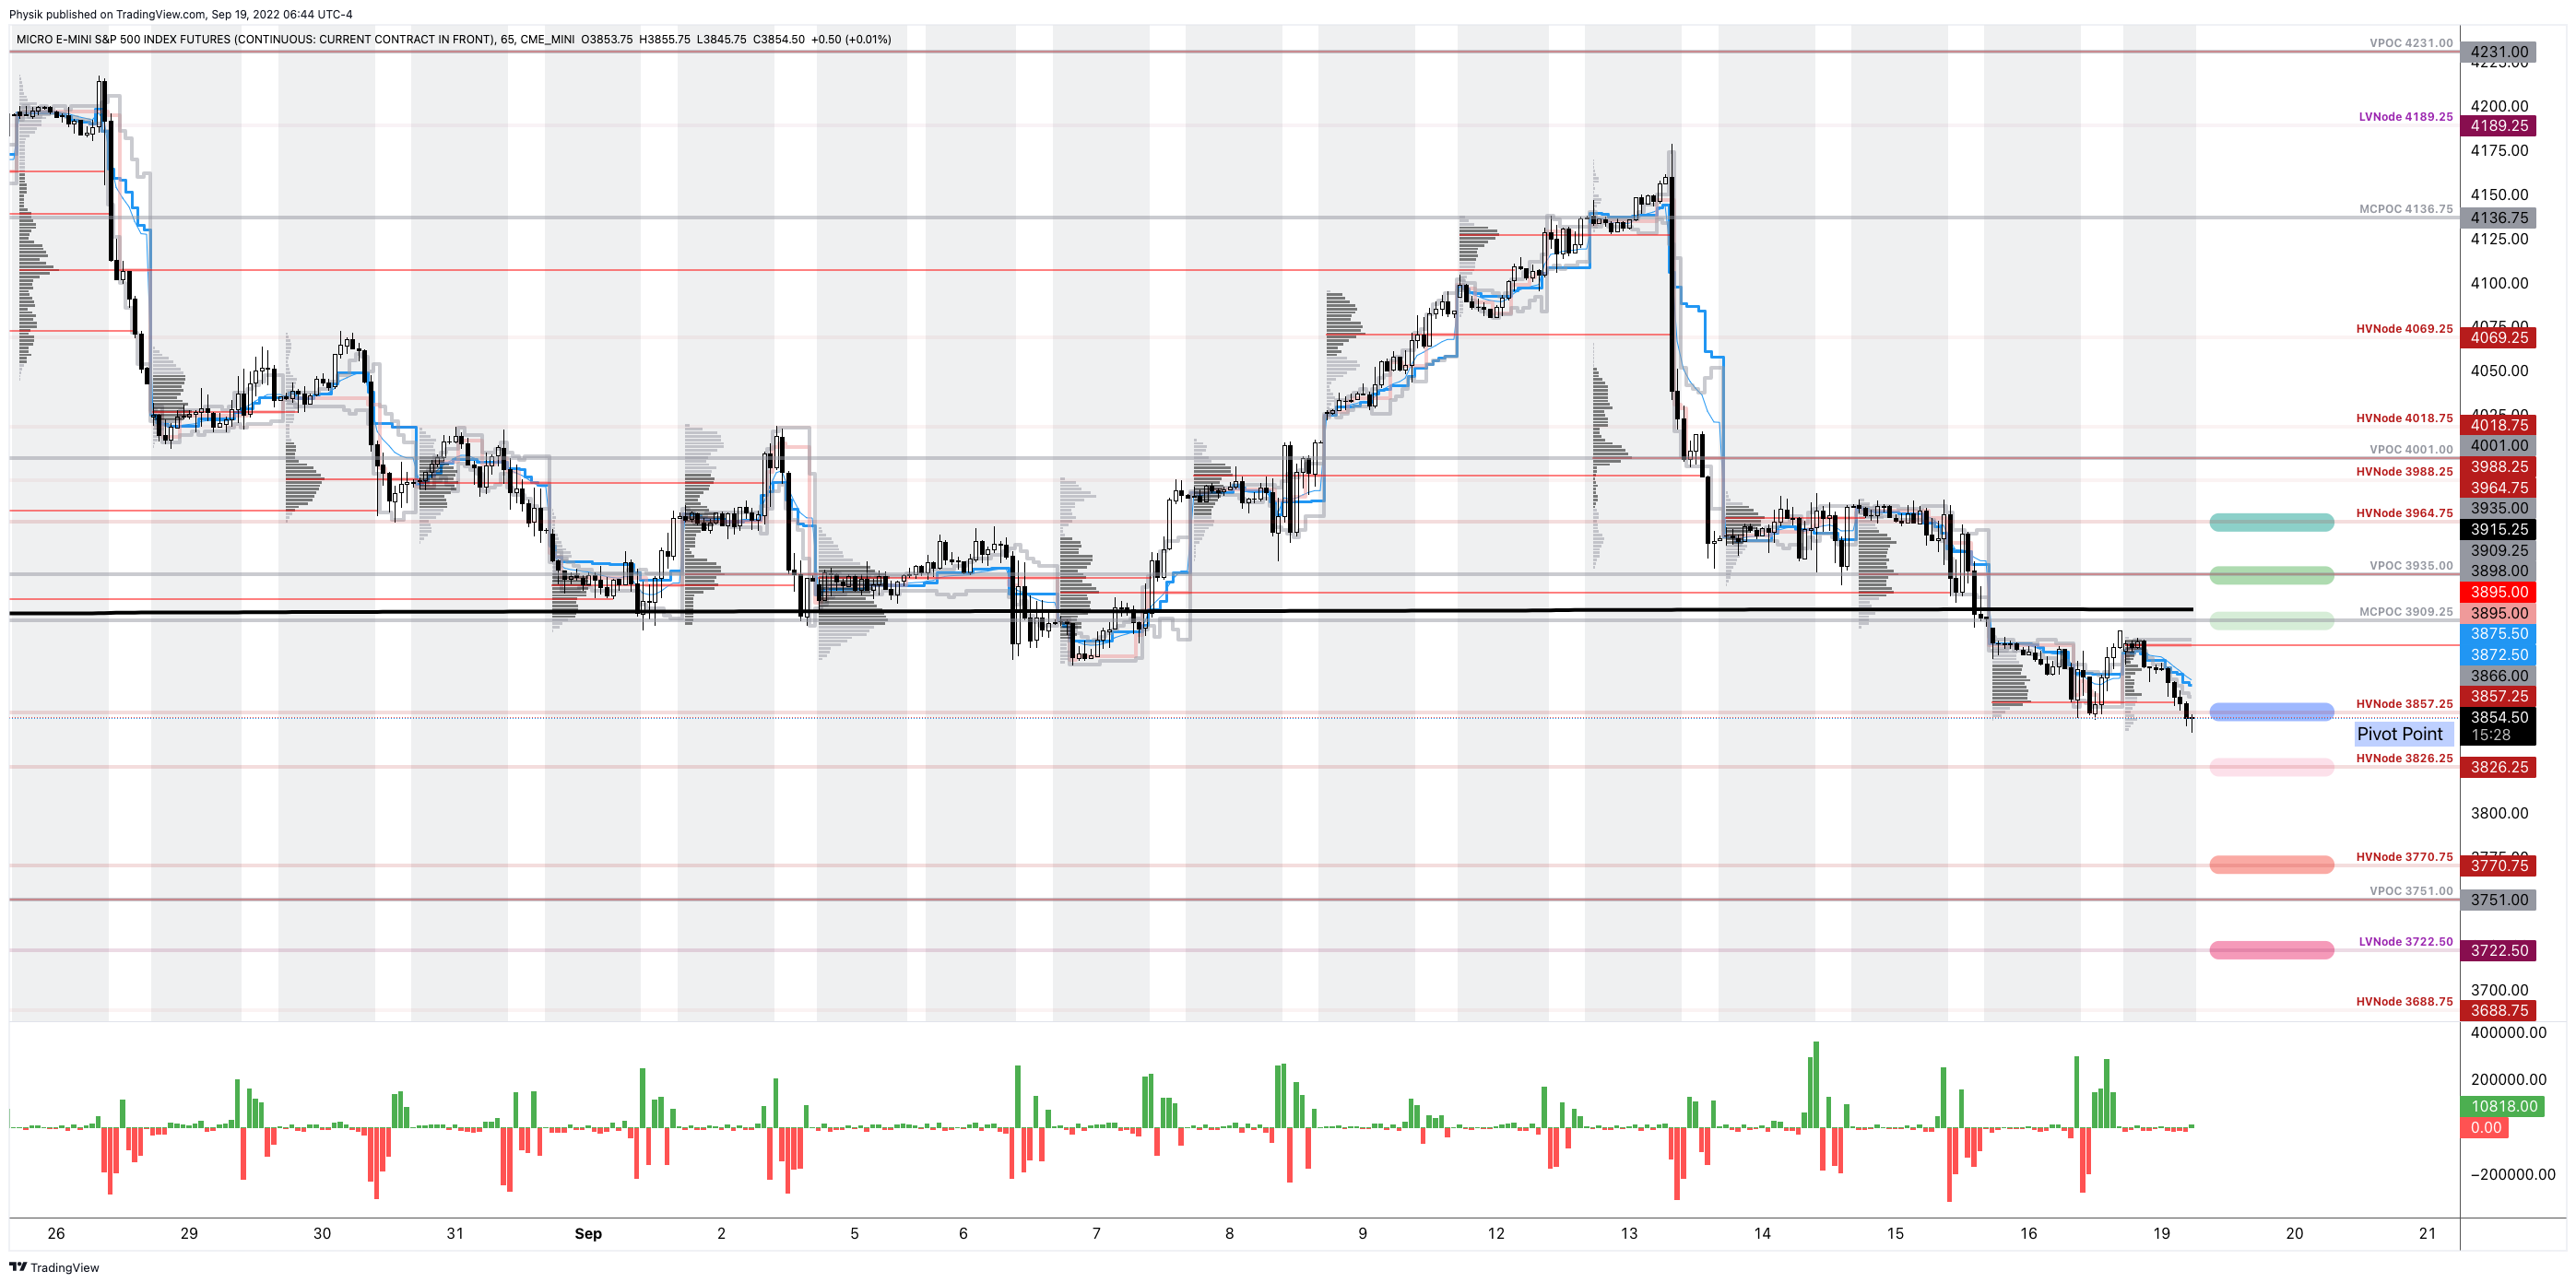
As of 6:45 AM ET, Monday’s regular session (9:30 AM – 4:00 PM ET), in the S&P 500, is likely to open in the lower part of a negatively skewed overnight inventory, outside of prior-range and -value, suggesting a limited potential for immediate directional opportunity.
In the best case, the S&P 500 trades higher.
Any activity above the $3,857.25 HVNode puts into play the $3,909.25 MCPOC. Initiative trade beyond the MCPOC could reach as high as the $3,935.00 VPOC and $3,964.75 HVNode, or higher.
In the worst case, the S&P 500 trades lower.
Any activity below the $3,857.25 HVNode puts into play the $3,826.25 HVNode. Initiative trade beyond the latter could reach as low as the $3,770.75 HVNode and $3,722.50 LVNode, or lower.
Click here to load today’s key levels into the web-based TradingView charting platform. Note that all levels are derived using the 65-minute timeframe. New links are produced, daily.
Graphic: 65-minute profile chart of the Micro E-mini S&P 500 Futures.
Considerations: A feature of this 2022 down market was responsiveness near key-technical areas (that are discernable visually on a chart). This suggested to us that technically-driven traders with shorter time horizons were very active.
Such traders often lack the wherewithal to defend retests and, additionally, the type of trade may be indicative of the other time frame participants waiting for more information to initiate trades.
That’s changing. The key levels, quoted above, are snapping far easier and are not as well respected. That means other time frame participants with wherewithal are initiating trades.
Those are the participants you should not fade.
Definitions
Volume Areas: A structurally sound market will build on areas of high volume (HVNodes). Should the market trend for long periods of time, it will lack sound structure, identified as low volume areas (LVNodes). LVNodes denote directional conviction and ought to offer support on any test.
If participants were to auction and find acceptance into areas of prior low volume (LVNodes), then future discovery ought to be volatile and quick as participants look to HVNodes for favorable entry or exit.
POCs: POCs are valuable as they denote areas where two-sided trade was most prevalent in a prior day session. Participants will respond to future tests of value as they offer favorable entry and exit.
MCPOCs: POCs are valuable as they denote areas where two-sided trade was most prevalent over numerous day sessions. Participants will respond to future tests of value as they offer favorable entry and exit.
About
After years of self-education, strategy development, mentorship, and trial-and-error, Renato Leonard Capelj began trading full-time and founded Physik Invest to detail his methods, research, and performance in the markets.
Capelj also develops insights around impactful options market dynamics at SpotGamma and is a Benzinga reporter.
In no way should the materials herein be construed as advice. Derivatives carry a substantial risk of loss. All content is for informational purposes only.
The daily brief is a free glimpse into the prevailing fundamental and technical drivers of U.S. equity market products. Join the 900+ that read this report daily, below!
Graphic updated 7:45 AM ET. Sentiment Neutral if expected /ES open is inside of the prior day’s range. /ES levels are derived from the profile graphic at the bottom of the following section. Levels may have changed since initially quoted; click here for the latest levels. SqueezeMetrics Dark Pool Index (DIX) and Gamma (GEX) calculations are based on where the prior day’s reading falls with respect to the MAX and MIN of all occurrences available. A higher DIX is bullish. At the same time, the lower the GEX, the more (expected) volatility. Learn the implications of volatility, direction, and moneyness. Breadth reflects a reading of the prior day’s NYSE Advance/Decline indicator. VIX reflects a current reading of the CBOE Volatility Index (INDEX: VIX) from 0-100.
Administrative
Apologies – yesterday the above graphic was not properly updated. The sentiment reading was incorrect, as were a couple of other figures. Separately, a lighter note, today, followed by more in-depth stuff currently being worked on in the coming sessions. Thanks!
Fundamental
First – going to refer everyone to yesterday’s letter, a conversation between Joseph Wang and Andy Constan, as well as some updates Cem Karsan of Kai Volatility made. That is, in part, a primer for what we will be talking more about, soon.
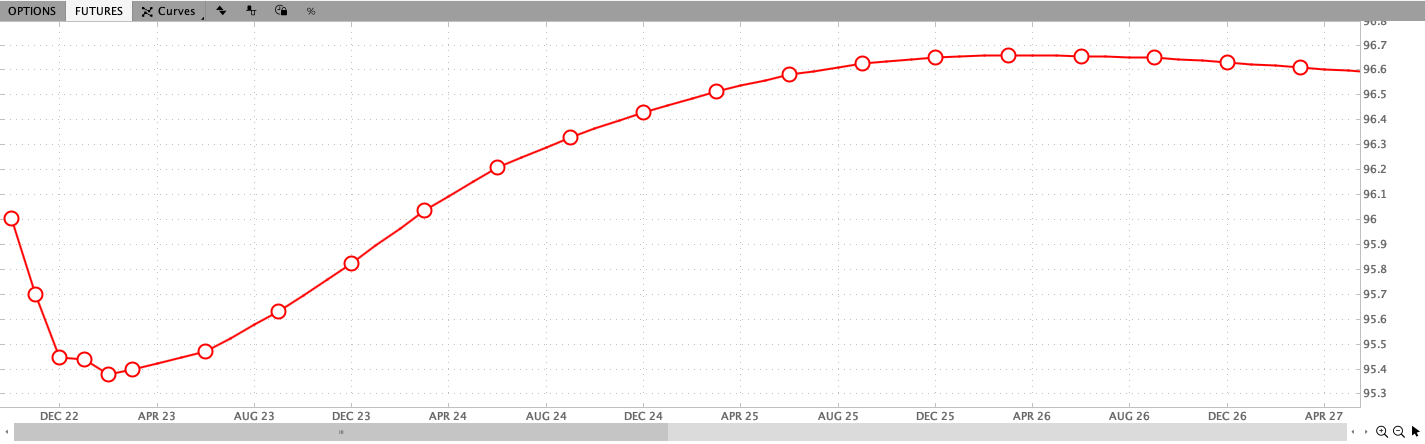
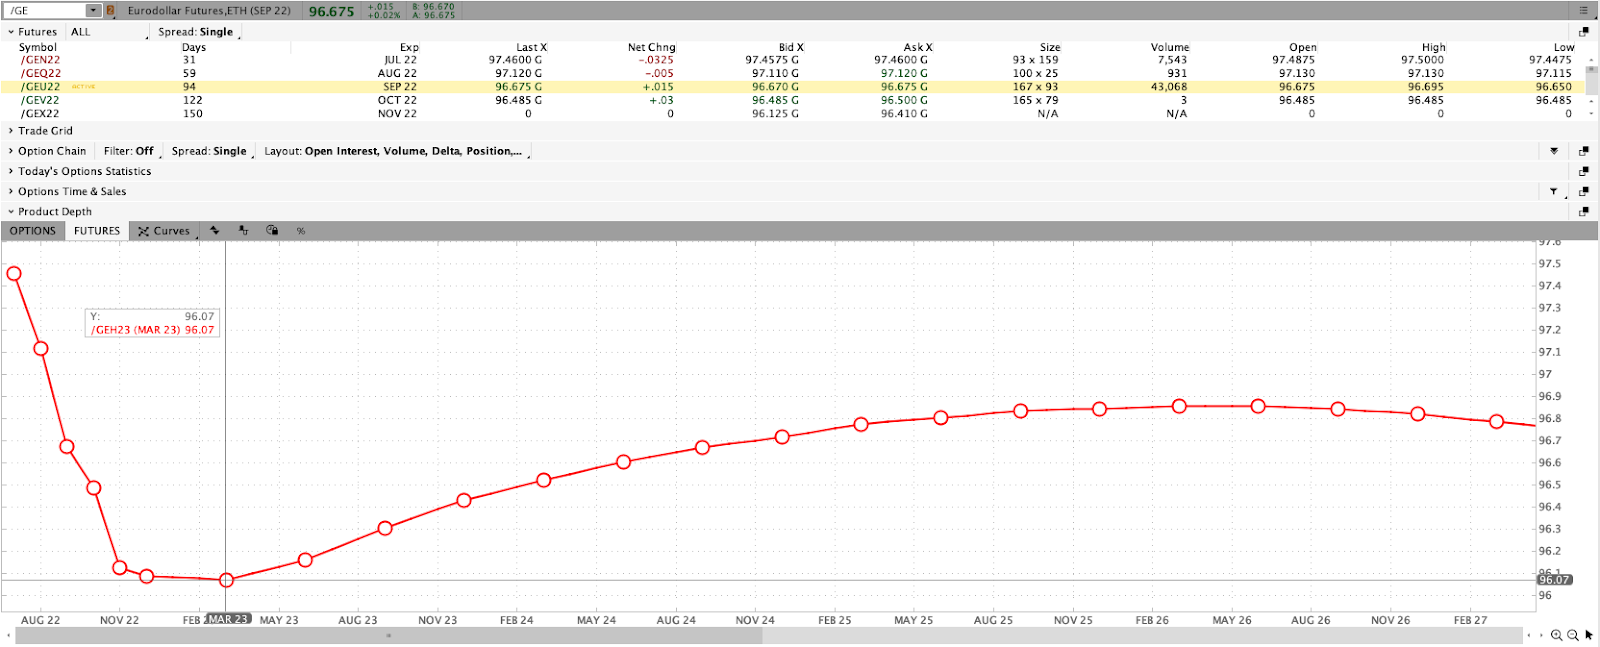
Next – we have futures markets pricing rate a peak in the overnight rate at ~4.6% in February of 2023. From thereon, rate cuts are implied.
Graphic: Via Charles Schwab Corporation’s (NYSE: SCHW) TD Ameritrade thinkorswim. Observed is the Eurodollar, the interest offered on U.S. dollar-denominated deposits held at banks outside of the U.S. (i.e., participants’ outlook on interest rates).
It’s becoming the consensus that “[f]or hikes to reduce inflation, they need to hurt growth,” Jean Boivin and Alex Brazier of BlackRock Inc (NYSE: BLK) explained.
“There is no way around this,” they add. “We estimate it would require a deep recession in the U.S., with around as much as 2% hit to growth in the U.S., and 3 million more unemployed, and an even deeper recession in Europe.”
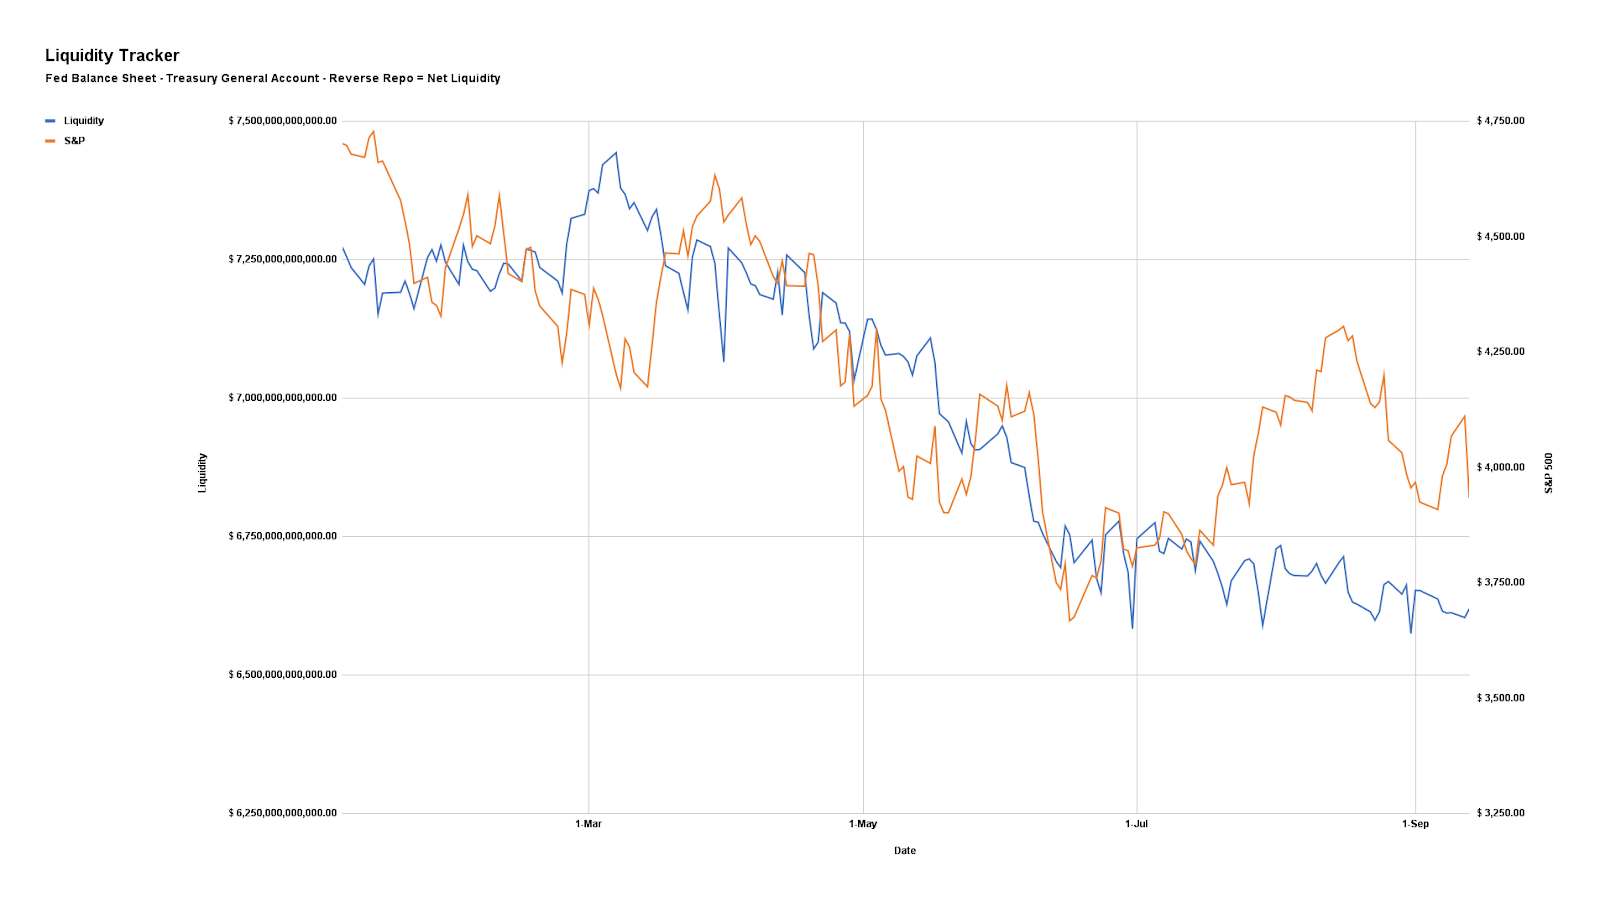
It’s the impact of rising rates and quantitative tightening (the latter which will compound the impacts of the former) that are part of the toolkit used to cool the sticky inflation.
Graphic: Via Physik Invest. Data compiled by @jkonopas623. Fed Balance Sheet data, here. Treasury General Account Data, here. Reverse Repo data, here. NL = BS – TGA – RRP.
Ray Dalio, of Bridgewater Associates LP, said that rates rising “toward the higher end of the 4.5% to 6% range … will bring private sector credit growth down, which will bring private sector spending and, hence, the economy down with it.”
Accordingly, equity prices could plunge upwards of 20%, as a result.
Graphic: Retrieved from Bloomberg via Michael J. Kramer. “What is amazing is how expensive this market is relative to rates. The spread between the S&P 500 Earnings yield and the 10-Yr nominal rate is at multi-year lows.”
Further, per Bloomberg’s John Authers, it’s the case that “[a]ll major global synchronized crises ended with moderate inflation and low growth; that hasn’t been reached yet.” Separately, a peak in inflation “doesn’t come close to guaranteeing equity gains.”
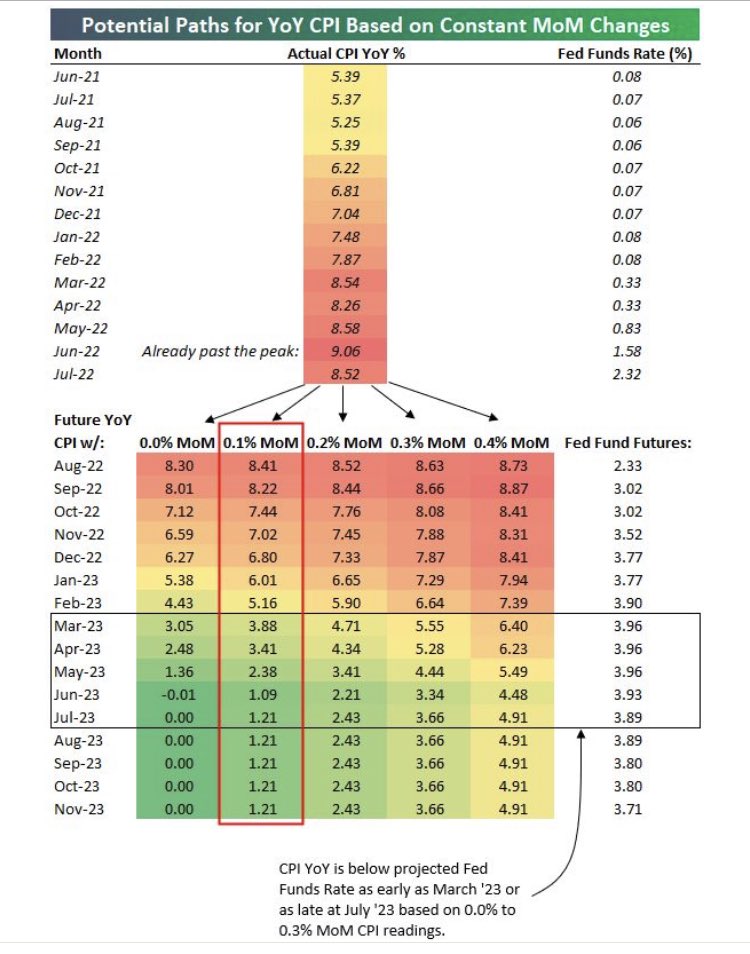
The pivot will come when there’s a “sustainable path to 2% (not 3 or 4%) inflation” and a “fed funds that is greater than CPI for a few quarters,” explained Alfonso Peccatiello of The Macro Compass.
“The timing mostly depends [on] the MoM CPI ahead,” he added, pointing to a graphic that suggests “there is no ‘pivot’ earlier than mid-2023, and it could well be later. Looking at the SOFR curve, that’s also what’s roughly priced in.”
Graphic: Retrieved from Bespoke Investment Group via Alfonso Peccatiello.
Positioning
Ahead of a multi-derivative expiry, markets are trading sideways to lower. Demands to protect equity downside (with puts), compounded macro-type selling earlier this week.
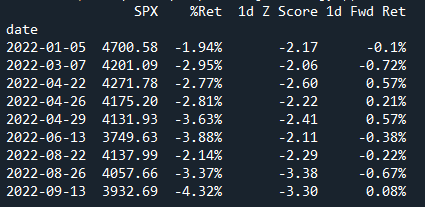
Now, with traders well hedged, Kai Volatility’s Cem Karsan put forth that there is a “race to monetize,” which is lending to “relatively flat” trade and “lack of follow-through.”
Graphic: Retrieved from Pat Hennessy. “Every large down move in SPX this year (quantified by <= -2 Zscore) has been followed by a relatively flat day/lack of follow through. Any ideas as to why this is?”
From hereon, as we said, a lot of the exposure demanded is short-dated. Should that exposure not be rolled forward in time, and allowed to expire, “SPX/ES dealers [who] are well hedged,” will unwind their hedges which may drive bullishness “through OpEx,” added Karsan.
Notwithstanding, this “has [the] potential to drive a tail post” OpEx. In [the] tech/meme market melt-up of 2020-2021, positioning was [the] exact opposite.”
Technical
As of 7:45 AM ET, Thursday’s regular session (9:30 AM – 4:00 PM ET), in the S&P 500, is likely to open in the middle part of a balanced overnight inventory, inside of prior-range and -value, suggesting a limited potential for immediate directional opportunity.
In the best case, the S&P 500 trades higher.
Any activity above the $3,965.75 HVNode puts into play the $4,001.00 VPOC. Initiative trade beyond the VPOC could reach as high as the $4,018.75 and $4,069.25 HVNodes, or higher.
In the worst case, the S&P 500 trades lower.
Any activity below the $3,965.75 HVNode puts into play the $3,925.00 VPOC. Initiative trade beyond the VPOC could reach as low as the $3,867.75 LVNode and $3,829.75 HVNode, or lower.
Click here to load today’s key levels into the web-based TradingView charting platform. Note that all levels are derived using the 65-minute timeframe. New links are produced, daily.
Graphic: 65-minute profile chart of the Micro E-mini S&P 500 Futures.
Definitions
Volume Areas: A structurally sound market will build on areas of high volume (HVNodes). Should the market trend for long periods of time, it will lack sound structure, identified as low volume areas (LVNodes). LVNodes denote directional conviction and ought to offer support on any test.
If participants were to auction and find acceptance into areas of prior low volume (LVNodes), then future discovery ought to be volatile and quick as participants look to HVNodes for favorable entry or exit.
POCs: POCs are valuable as they denote areas where two-sided trade was most prevalent in a prior day session. Participants will respond to future tests of value as they offer favorable entry and exit.
MCPOCs: POCs are valuable as they denote areas where two-sided trade was most prevalent over numerous day sessions. Participants will respond to future tests of value as they offer favorable entry and exit.
About
After years of self-education, strategy development, mentorship, and trial-and-error, Renato Leonard Capelj began trading full-time and founded Physik Invest to detail his methods, research, and performance in the markets.
Capelj also develops insights around impactful options market dynamics at SpotGamma and is a Benzinga reporter.
In no way should the materials herein be construed as advice. Derivatives carry a substantial risk of loss. All content is for informational purposes only.
The daily brief is a free glimpse into the prevailing fundamental and technical drivers of U.S. equity market products. Join the 900+ that read this report daily, below!
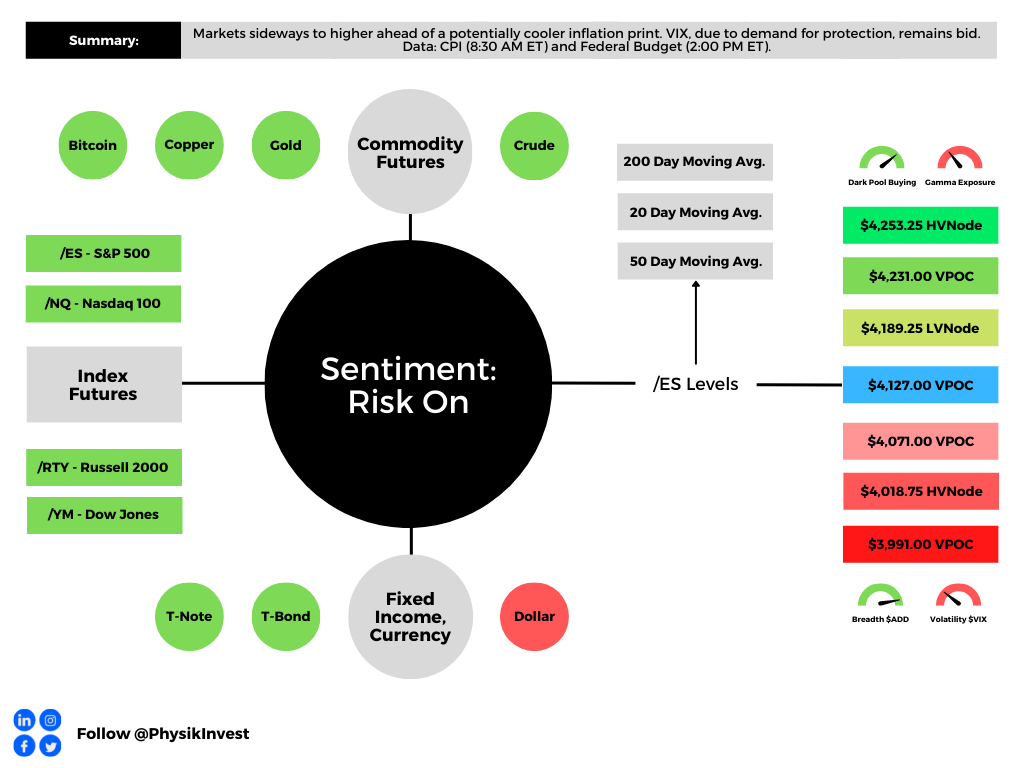
Graphic updated 7:45 AM ET. Sentiment Risk-On if expected /ES open is above the prior day’s range. /ES levels are derived from the profile graphic at the bottom of the following section. Levels may have changed since initially quoted; click here for the latest levels. SqueezeMetrics Dark Pool Index (DIX) and Gamma (GEX) calculations are based on where the prior day’s reading falls with respect to the MAX and MIN of all occurrences available. A higher DIX is bullish. At the same time, the lower the GEX, the more (expected) volatility. Learn the implications of volatility, direction, and moneyness. Breadth reflects a reading of the prior day’s NYSE Advance/Decline indicator. VIX reflects a current reading of the CBOE Volatility Index (INDEX: VIX) from 0-100.
Fundamental
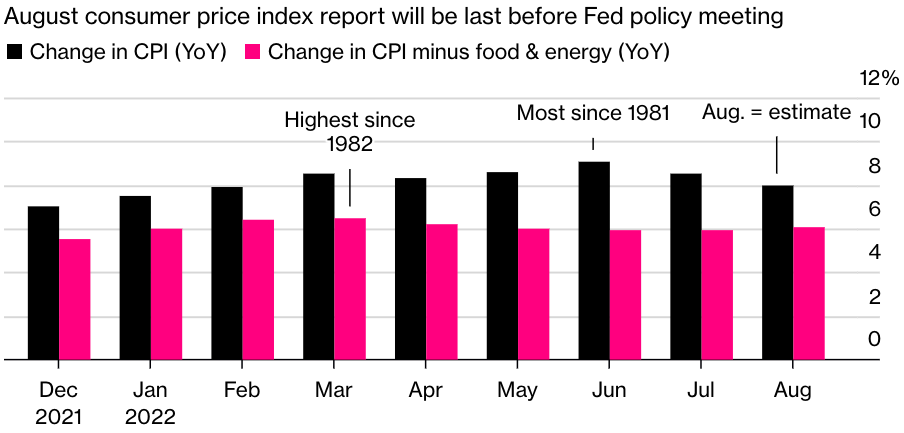
Today, traders get inflation updates. These will help drive perceptions regarding monetary policy.
Expected is an 8.1% rise year-over-year (YoY) and 0.1% fall month-over-month (MoM). In July, these numbers were 8.5% and 0.0%, respectively.
Core CPI (which excludes food and energy) is expected to rise by a rate higher than in July, 6.1% YoY and 0.3% MoM, respectively.
Mattering most is core inflation, which the Fed has more control over. If lower than expected, that may warrant some appetite for risk.
Notwithstanding, prior to July’s release, the average movement in the S&P 500, after CPI, was -1.27%. Still, though, the expectation is that August data will show improvement.
“The market has concluded that both the ECB and even the Fed, despite their protestations otherwise, are both being viewed as data-dependent,” Peter Tchir of Academy Securities said.
“I cannot see any scenario where the market doesn’t decide that CPI is heading the right direction and … [this] should allow markets to continue to enjoy the strength.”
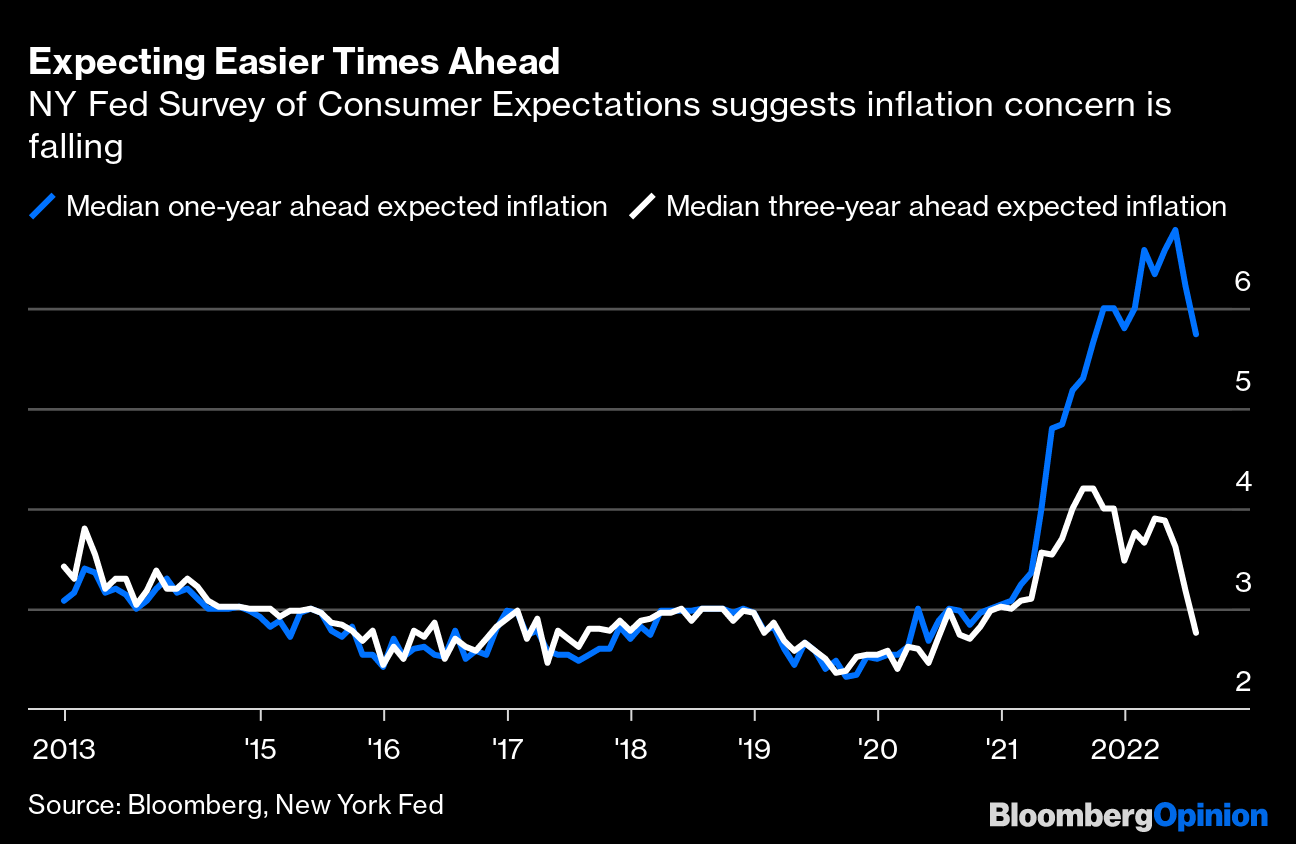
Graphic: Retrieved from Bloomberg. “Stronger evidence that a wage-price spiral can indeed be avoided came from Monday’s publication of the New York Fed’s latest Survey of Consumer Expectations.”
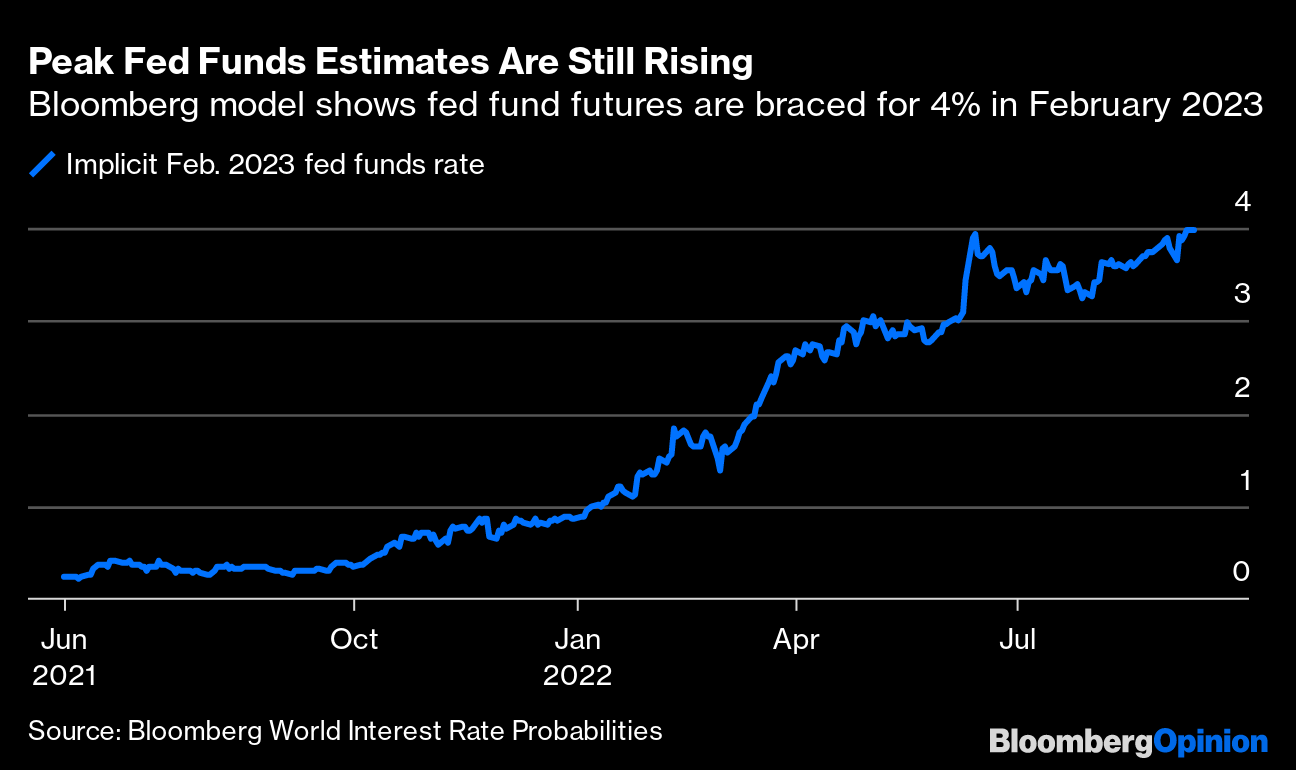
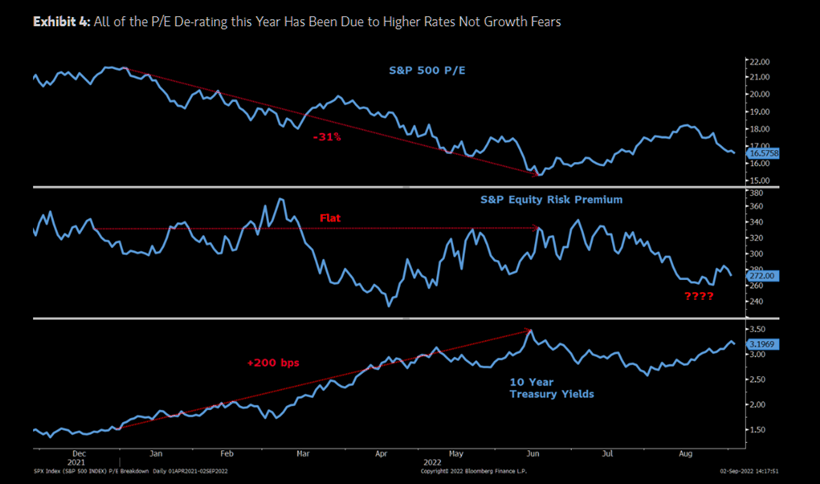
At this point, in spite of the prospects of inflation continuing to cool, expectations regarding Fed (Federal Reserve) action remain sticky with the fed funds futures pricing a peak in rates of 4%.
Graphic: Retrieved from Bloomberg.
Unchanged, all else equal, this means markets have accounted for the rise in interest rates and their impact on valuations. From hereon, further de-rating is not out of the question, particularly if inflation continues to rise and/or growth fears materialize, as some like Fitch Ratings believe.
Graphic: Retrieved from The Market Ear. Via Morgan Stanley (NYSE: MS). “MS Research thinks the lows for this bear market will likely arrive in the fourth quarter with 3,400 the minimum downside and 3,000 the low if a recession arrives.”
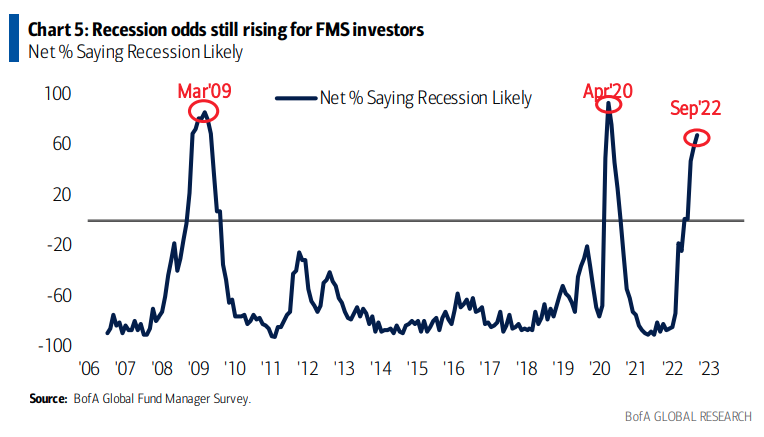
According to Fitch, a decline in corporate profits is likely to speed up in the coming quarters, and this will highlight economic slowing (below-trend GDP growth) that leads to a 2023 recession.
Graphic: Retrieved from Bloomberg, via Bank of America Corporation (NYSE: BAC). “Bank of America … remains ‘fundamentally and patiently bearish.’”
To quote CFO Dive, “Downward revisions to consensus expectations for earnings next year ‘will likely accelerate as monetary tightening continues to reduce inflation and growth slows.’”
Thus far, the economy has shrunk 0.6% in the second quarter, after slumping 1.6% in the first, which is “the common definition of a recession” despite the continued growth of the economy as shown by other metrics like “nonfarm employment, consumer spending, industrial production, and weekly hours worked.”
Positioning
As of 7:45 AM ET, Tuesday’s expected volatility, via the Cboe Volatility Index (INDEX: VIX), sits at ~1.24%. Net gamma exposures increasing may promote some market stability.
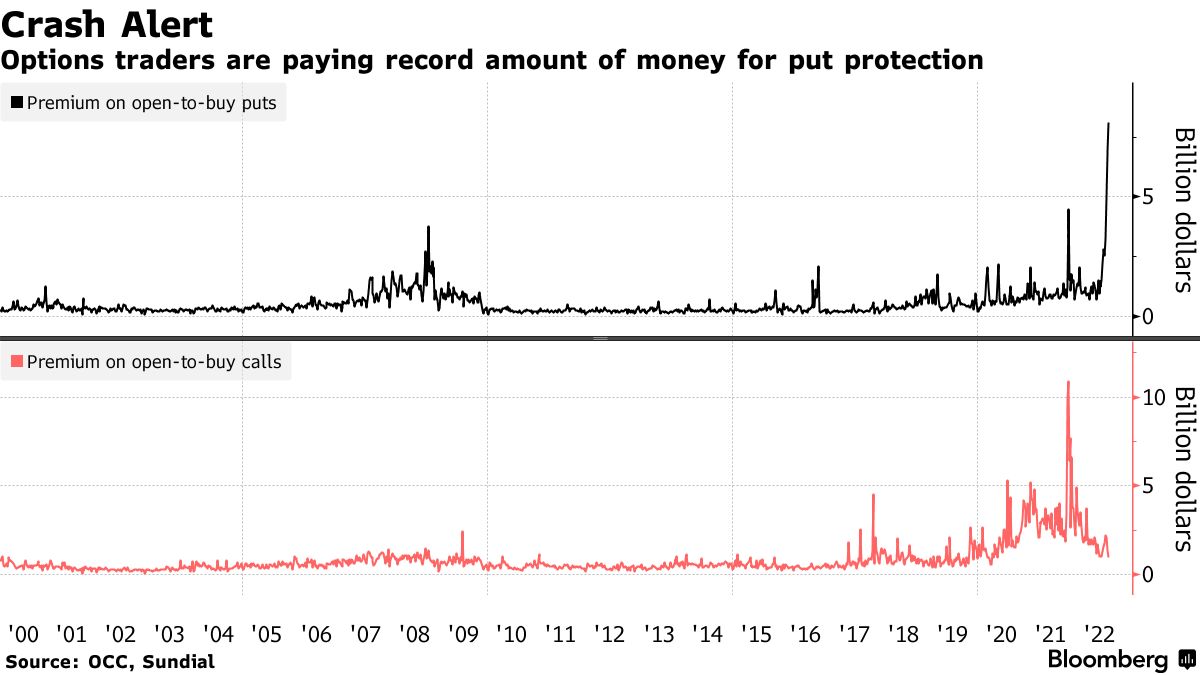
It’s the case that there is this trend in demand for equity downside put options protection. This is evidenced by figures of open interest, volume, as well as bid implied volatility (IVOL) metrics like the Cboe Volatility Index (INDEX: VIX).
“They’re buying protection against a crash at a pace unlike anything the market has ever seen,” said Jason Goepfert, chief research officer at Sundial. This is as Nomura Holdings Inc’s (NYSE: NMR) Charlie McElligott says more traders are taking shots amid “hawkish global central bank escalations,” and tightening measures of liquidity, among other things.
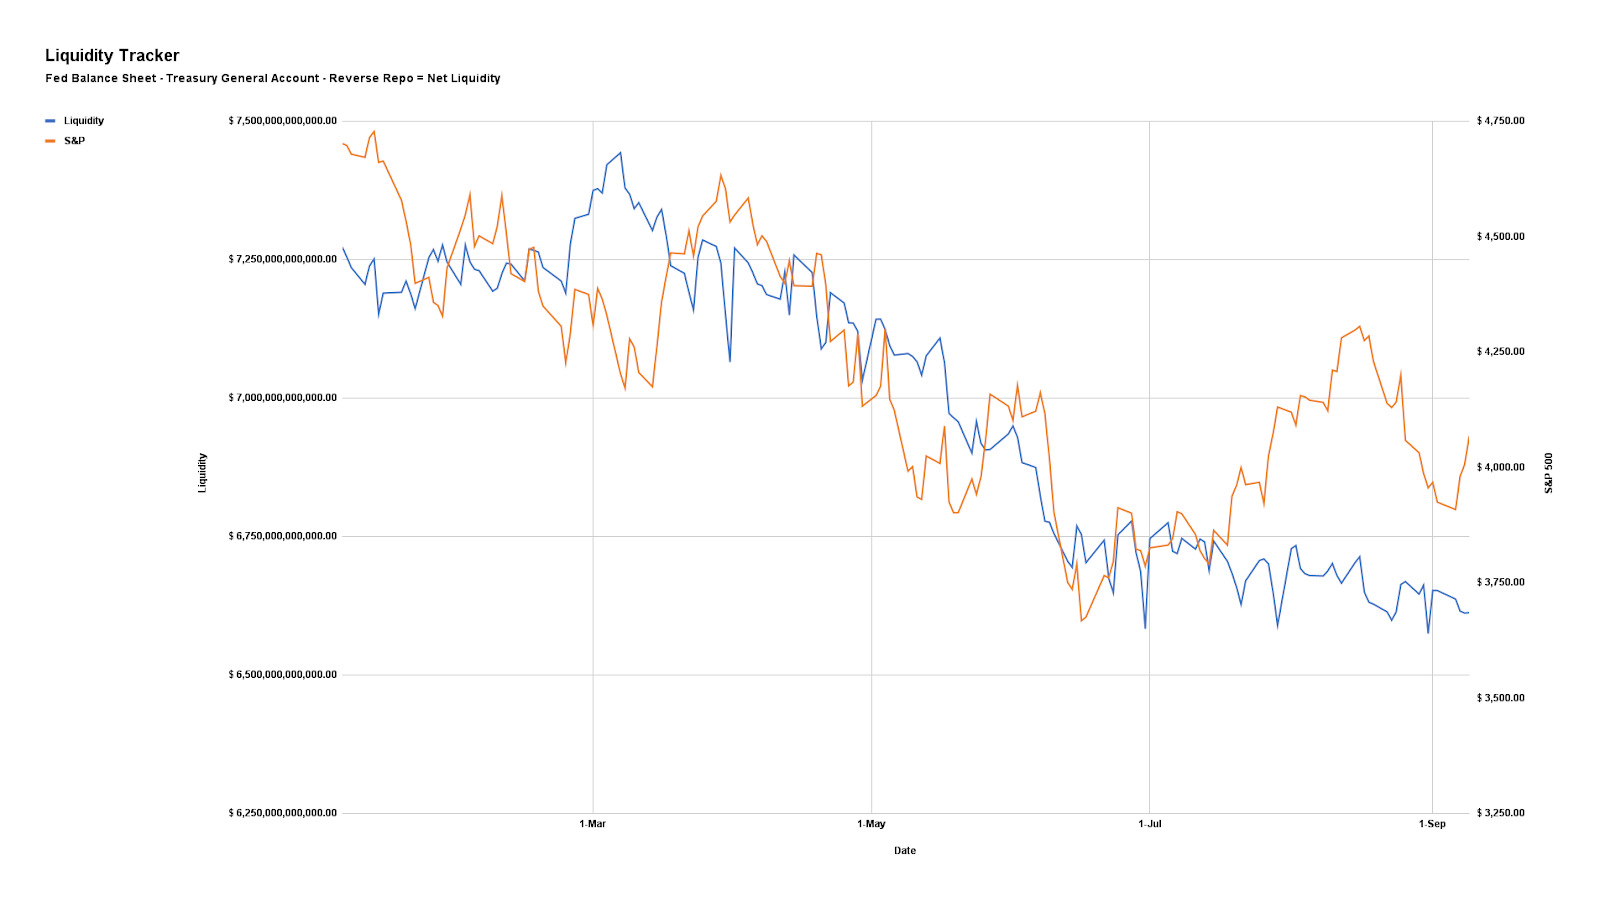
Graphic: Via Physik Invest. Data compiled by @jkonopas623. Fed Balance Sheet data, here. Treasury General Account Data, here. Reverse Repo data, here. NL = BS – TGA – RRP.
Goepfert adds that the “massive hedging activity” feels “unsettling.” That has to do with what the reaction to that protection entails should markets drop lower and IVOL increase, accordingly.
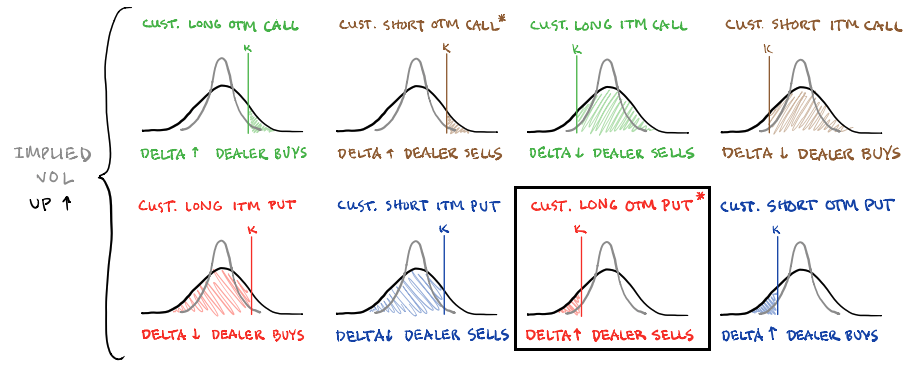
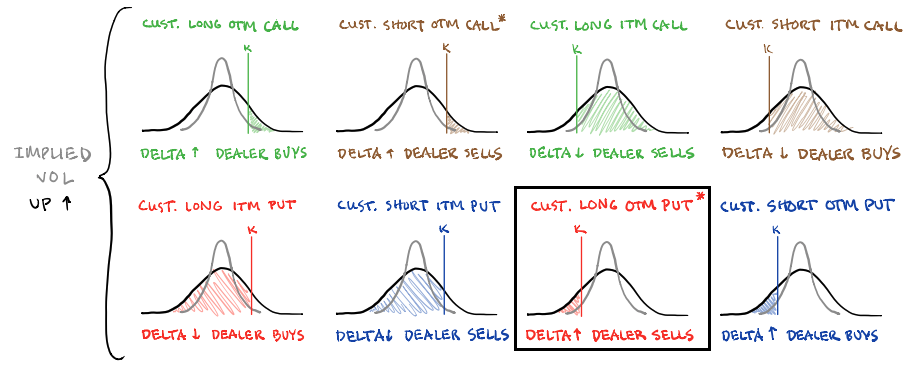
Graphic: Retrieved from SqueezeMetrics. Learn the implications of volatility, direction, and moneyness.
Notwithstanding, should nothing bad happen, the activity, which is structured in soon-to-expire options, will quickly fall out of favor (as will the probability of those options paying out). Liquidity providers, on the other side of those trades, will reduce their negative Delta (short futures and stock) hedges which may further add support to markets.
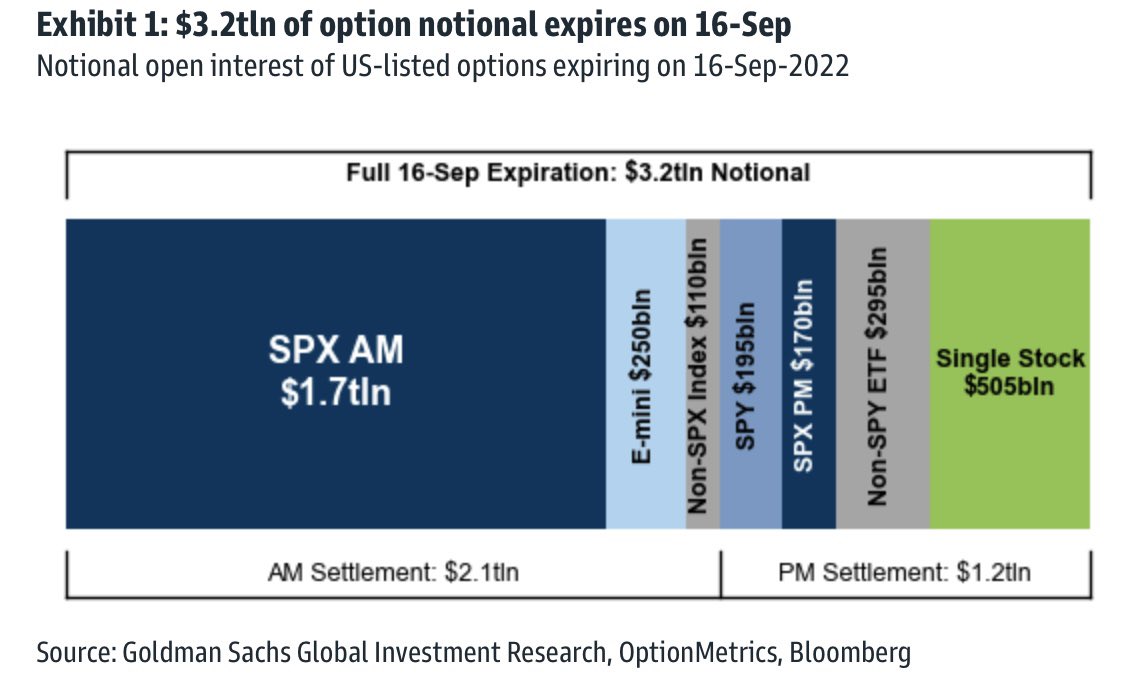
Graphic: Retrieved from Goldman Sachs Group Inc (NYSE: GS).
The concern is that soon after this big options expiration passes, new fear and demand for protection may feed into another bout of weakness as traders rush to re-protect and liquidity providers add pressure in their hedging, accordingly.
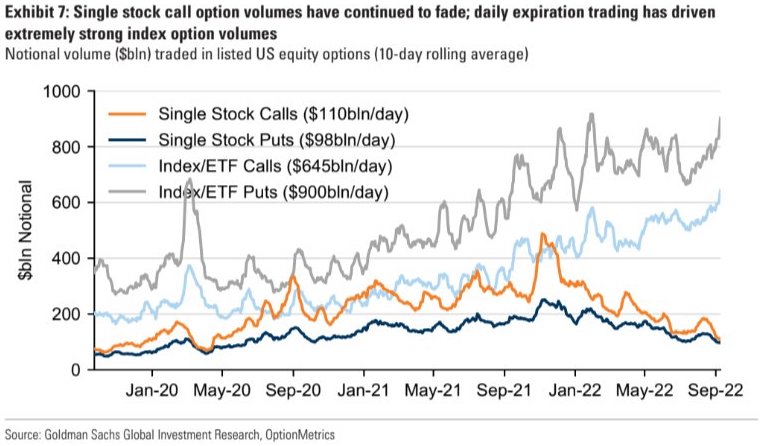
Graphic: Retrieved from Goldman Sachs Group Inc (NYSE: GS).
Technical
As of 7:00 AM ET, Tuesday’s regular session (9:30 AM – 4:00 PM ET), in the S&P 500, is likely to open in the upper part of a positively skewed overnight inventory, outside of prior-range and -value, suggesting a potential for immediate directional opportunity.
In the best case, the S&P 500 trades higher.
Any activity above the $4,127.00 VPOC puts into play the $4,189.25 LVNode. Initiative trade beyond the LVNode could reach as high as the $4,231.00 VPOC and $4,253.25 HVNode, or higher.
In the worst case, the S&P 500 trades lower.
Any activity below the $4,127.00 VPOC puts into play the $4,071.00 VPOC. Initiative trade beyond the VPOC could reach as low as the $4,018.75 HVNode and $3,991.00 VPOC, or lower.
Click here to load today’s key levels into the web-based TradingView charting platform. Note that all levels are derived using the 65-minute timeframe. New links are produced, daily.
Graphic: 65-minute profile chart of the Micro E-mini S&P 500 Futures.
Definitions
Volume Areas: A structurally sound market will build on areas of high volume (HVNodes). Should the market trend for long periods of time, it will lack sound structure, identified as low volume areas (LVNodes). LVNodes denote directional conviction and ought to offer support on any test.
If participants were to auction and find acceptance into areas of prior low volume (LVNodes), then future discovery ought to be volatile and quick as participants look to HVNodes for favorable entry or exit.
POCs: POCs are valuable as they denote areas where two-sided trade was most prevalent in a prior day session. Participants will respond to future tests of value as they offer favorable entry and exit.
MCPOCs: POCs are valuable as they denote areas where two-sided trade was most prevalent over numerous day sessions. Participants will respond to future tests of value as they offer favorable entry and exit.
About
After years of self-education, strategy development, mentorship, and trial-and-error, Renato Leonard Capelj began trading full-time and founded Physik Invest to detail his methods, research, and performance in the markets.
Capelj also develops insights around impactful options market dynamics at SpotGamma and is a Benzinga reporter.
In no way should the materials herein be construed as advice. Derivatives carry a substantial risk of loss. All content is for informational purposes only.
Investors foresaw weakness before the 2022 equity market decline in response to the coming monetary tightening. They repositioned and hedged their equity downside with allocations to commodities and options, colloquially referred to as volatility.
The commodity exposure worked well, while the volatility exposure did not. Consequently, the 2022 equity market decline was unlike many before. The monetization and counterparty hedging of existing customer options hedges and the sale of short-dated options, particularly in some single names where implied volatility or IVOL was rich, lent to lackluster volatility performance. Some may have observed tameness among IVOL measures such as the Cboe Volatility Index or VIX.
“One-year variance swaps or implied volatility on an at-the-money S&P 500 put option would trade somewhere in the neighborhood of 25 to 30%,” said Michael Green of Simplify Asset Management. “That implies a level of daily price movement that is difficult to achieve.”
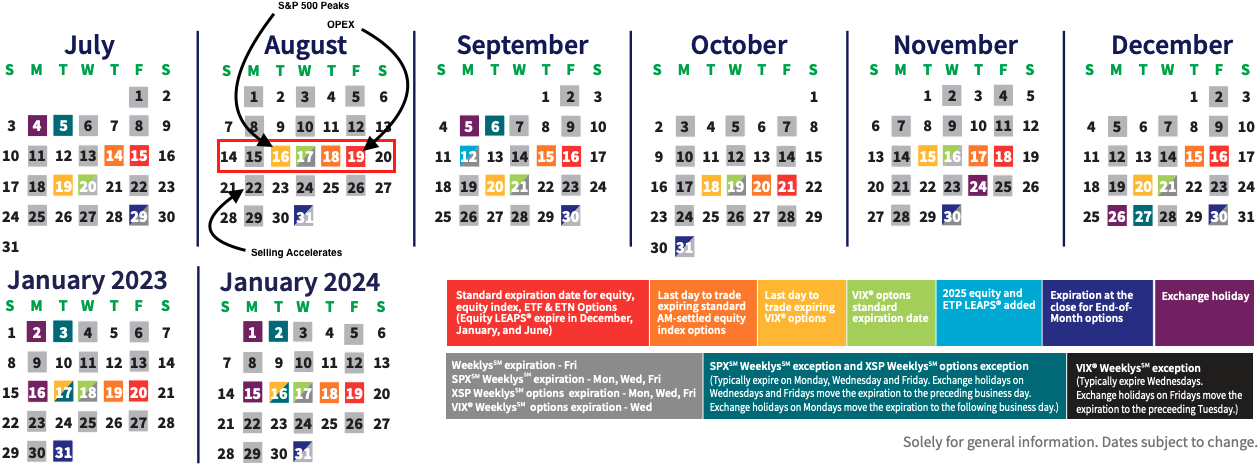
Eventually, entering August 2022, entities were getting squeezed out of these trades that did not work. The market advanced as participants rotated out of options and commodities; a macro-type re-leveraging ensued on improvements in inflation data, an earnings season that was better than expected, and “crazy tax receipts,” among other things. In August 2022, the advance climaxed the week of monthly options expiry or OpEx, as shown below.
Graphic: Retrieved from Cboe Global Markets Inc (BATS: CBOE).
Why did the advance climax the week of OpEx? Well, heading into that particular week of OpEx, markets were rising quickly, and call options (i.e., bets on the market upside) were highly demanded.
Graphic: Updated 8/15/2022. Retrieved from SqueezeMetrics.
Those on the other side of the call option trades (i.e., counterparties) thus hedged in a supportive manner (i.e., counterparties sell calls to customers and buy underlying to hedge exposure).
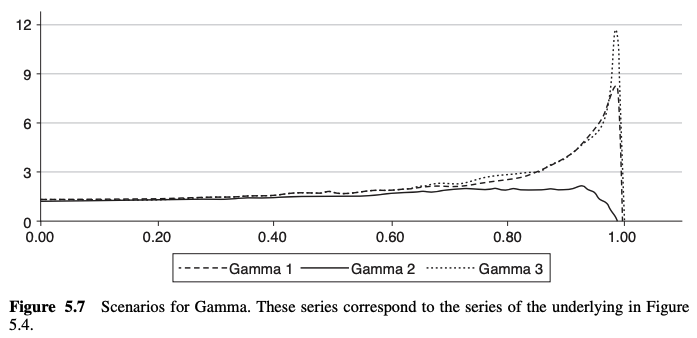
Eventually, traders’ activity in soon-to-expire options concentrated at specific strikes – particularly $4,300.00 in the S&P 500 – while IVOL trended lower. The counterparty’s response, then, did more to support prices and reduce movement. That is because, with time passing and volatility declining, options Gamma (i.e., the sensitivity of an option to direction) became more positive; the range of spot prices across which Delta (i.e., options exposure to direction) shifts rapidly shrunk. When options Gamma exposure is more positive, market movements may positively impact the counterparty’s position (i.e., movement benefits them). However, if the counterparty is not interested in realizing that benefit, it may hedge in a manner that dulls the market’s movement. This is partly what happened in the late stages of the August rally. After the S&P 500 hit $4,300.00, the near-vertical price rise sputtered. Soon, follow-on support, from a fundamental (e.g., liquidity) and volatility perspective, would worsen following OpEx.
Graphic: Via Physik Invest. Fed Balance Sheet data, here. Treasury General Account Data, here. Reverse Repo data, here.
Why the removal/weakening of support? OpEx would trigger “a big shift in market positioning,” Nomura Holdings Inc’s (NYSE: NMR) Charlie McElligott explained at the time.
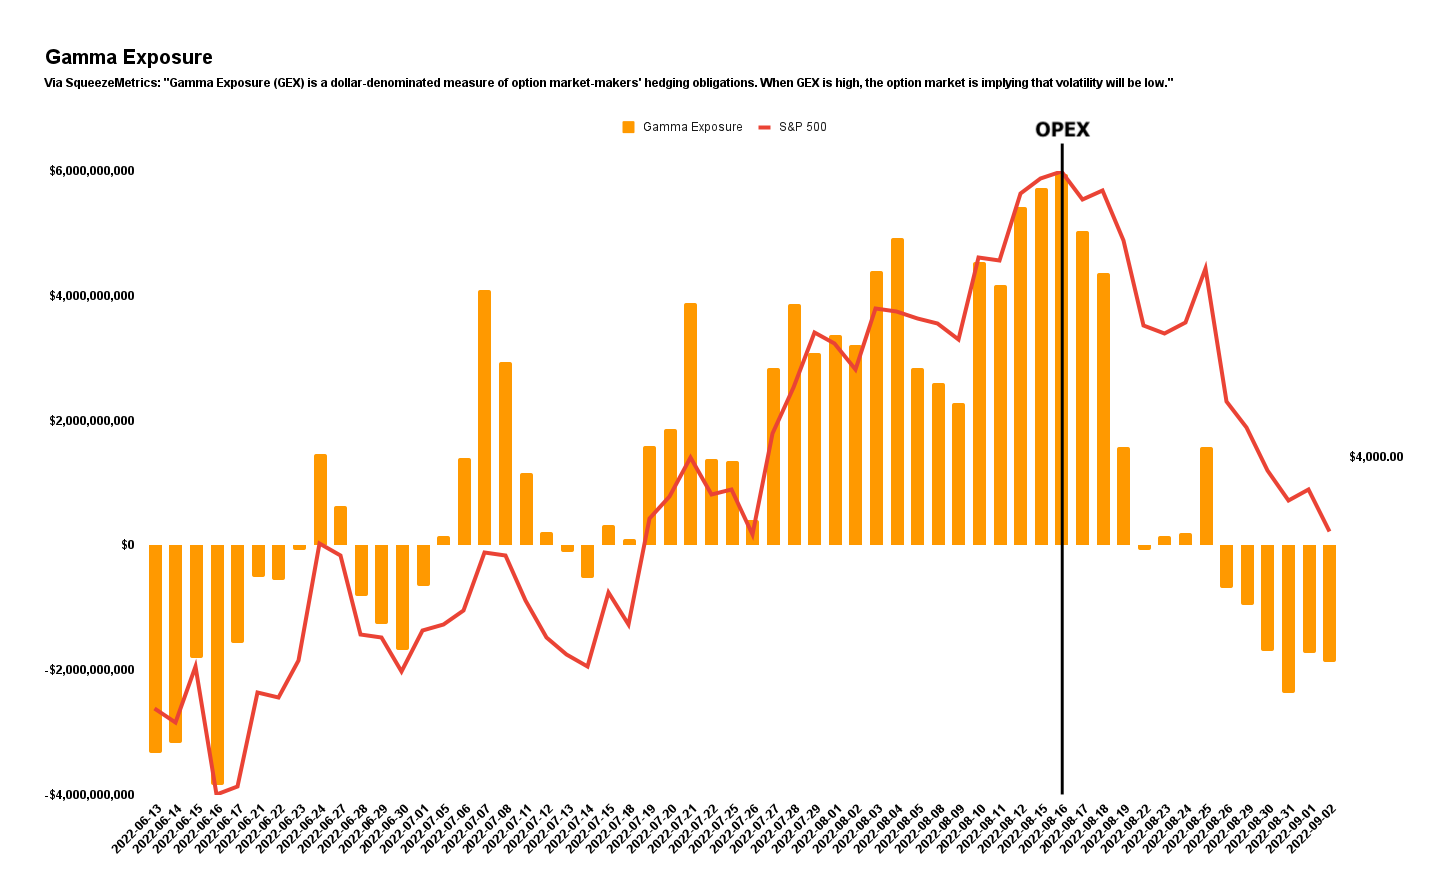
In short, participants’ failure to roll forward their expiring bets on market upside coincided with a message that the Federal Reserve (Fed) would stay tough on inflation. After OpEx, those same bets prompting counterparties to stem volatility and bolster equity upside were removed (i.e., expire). We can visualize this by the drop in Gamma exposures post-OpEx, as shown below.
Graphic: Created by Physik Invest. Data by SqueezeMetrics.
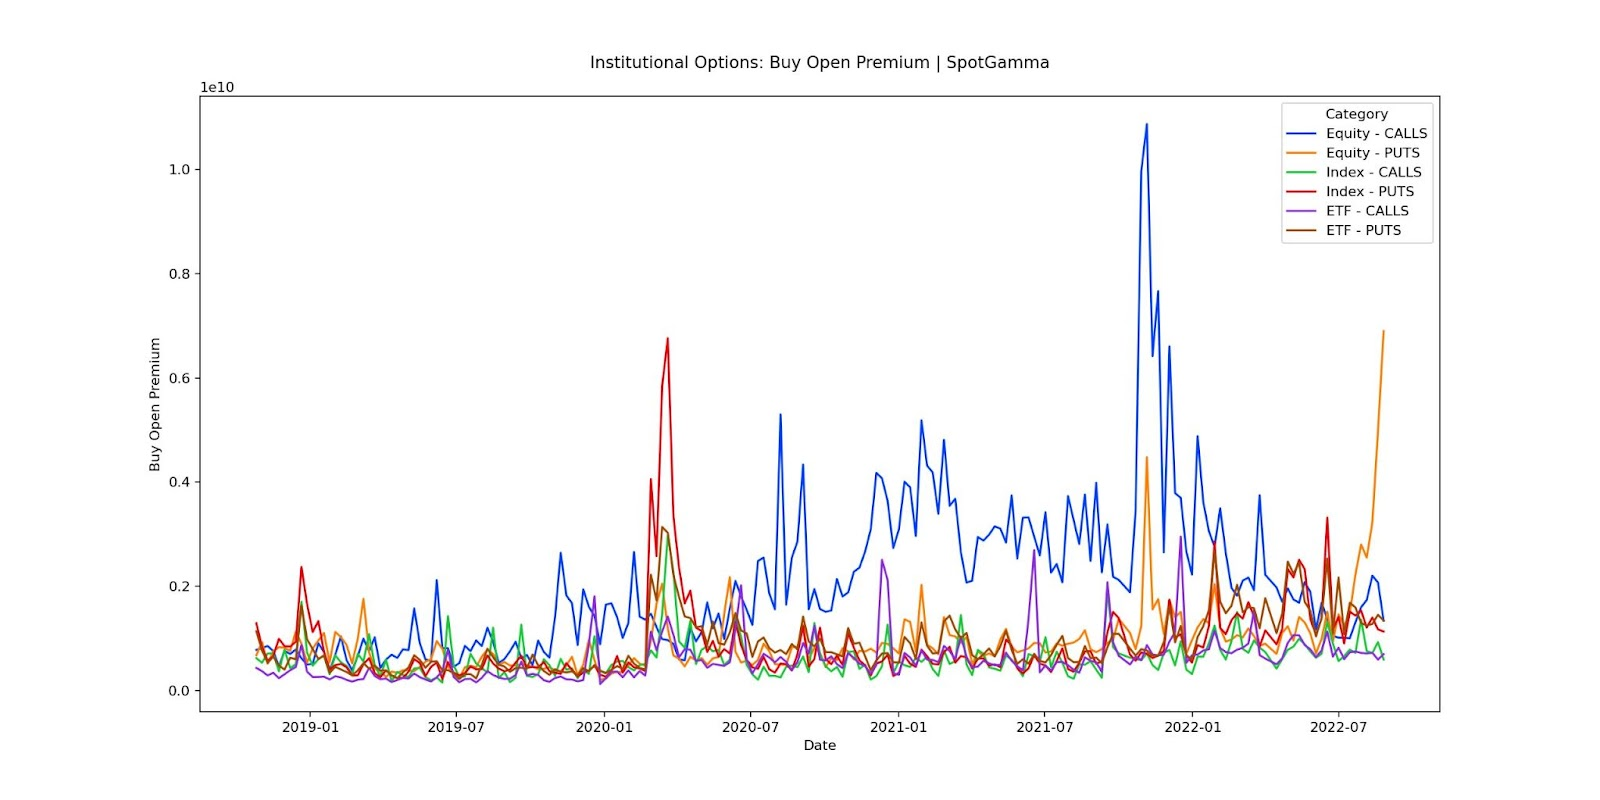
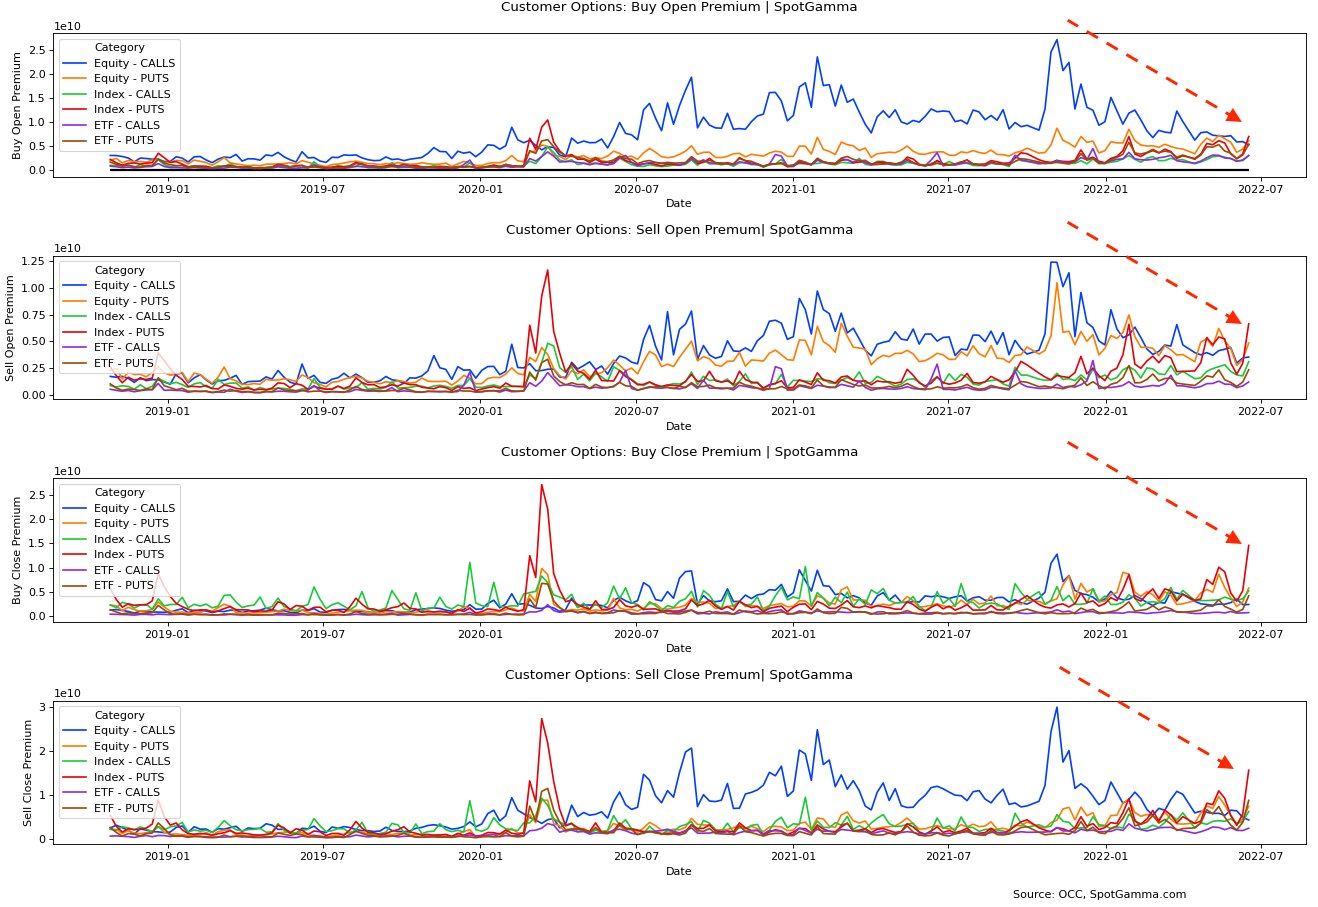
Accordingly, August OpEx, combined with technical and fundamental contexts prompting funds to “reload[] on short sales,” shocked the market into a higher volatility and negative Gamma environment. In this negative Gamma environment, put options, through which the vast majority of participants speculate on lower prices and protect their downside, solicited far more pressure from counterparties. If markets continued trading lower, traders would likely continue rotating into those put options, further bolstering pressure from counterparties. This happened, as shown below.
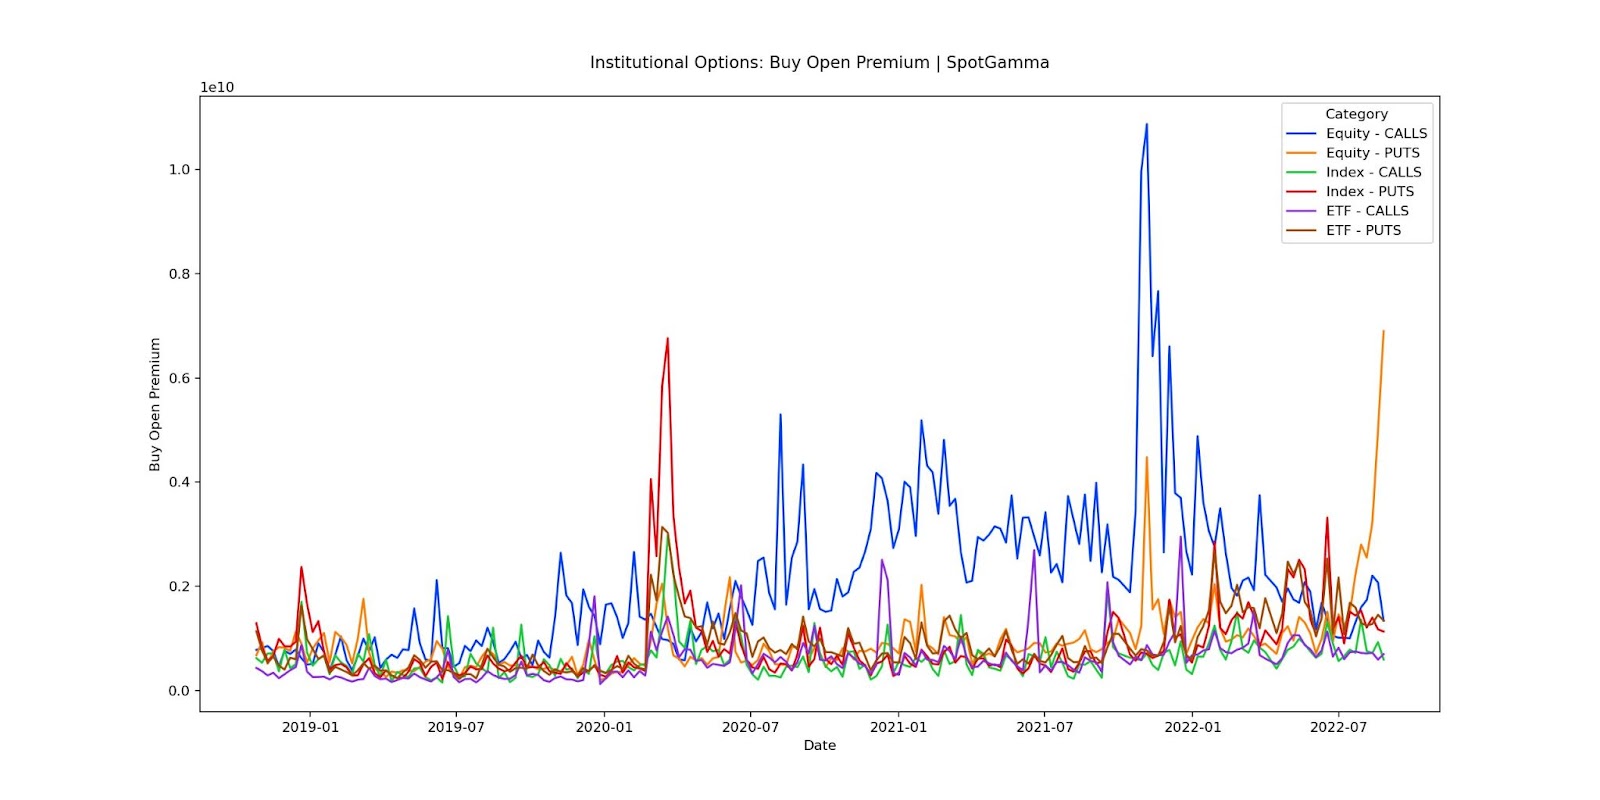
Graphic: Retrieved from SpotGamma. “There was a huge surge in large trader put buying in the equities space last week as per the OCC data.”
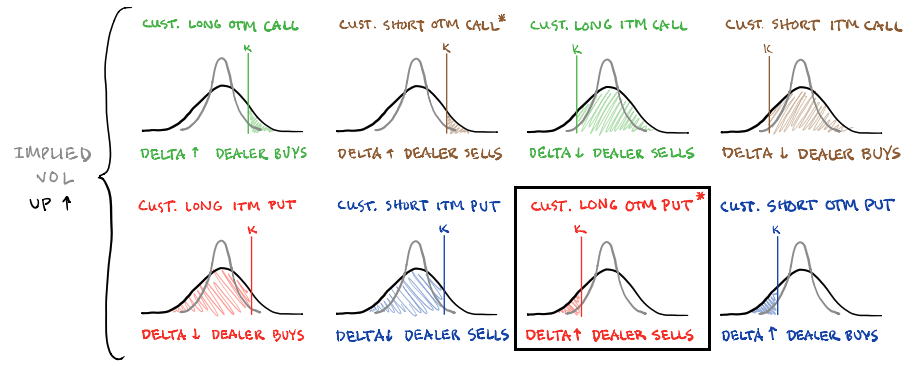
Demand for put options protection was bid IVOL. To hedge against this demand for protection and rising IVOL, counterparties sold underlying, compounding bearish fundamental flows.
Graphic: Retrieved from SqueezeMetrics. Learn the implications of volatility, direction, and moneyness.
In late August, new data suggested September would have “a very large options position as it is a quarterly OpEx,” SpotGamma said. With positioning “put heavy,” a slide lower, and an increase in IVOL was likely to drive continued counterparty “shorting” with little “relief until Jackson Hole.”
Based on this information, Physik Invest sought to initiate trades, expecting markets to trade lower and more volatile.
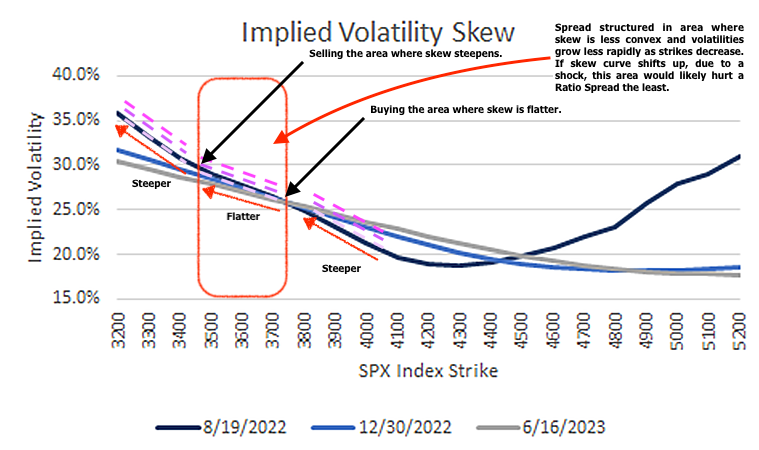
Call option premiums appeared attractive in mid-August, partly due to interest rates, while IVOL metrics seemingly hit a lower bound. This was observable via a quick check of skew, a plot of IVOL for options across different strike prices. Usually, skew, on the S&P 500, shows a smirk, not a smile. This meant it was likely that short-dated, wide Put Ratio Spreads had little to lose in a sideways-to-higher market environment. Additionally, call Vertical Spreads above the market were relatively more expensive.
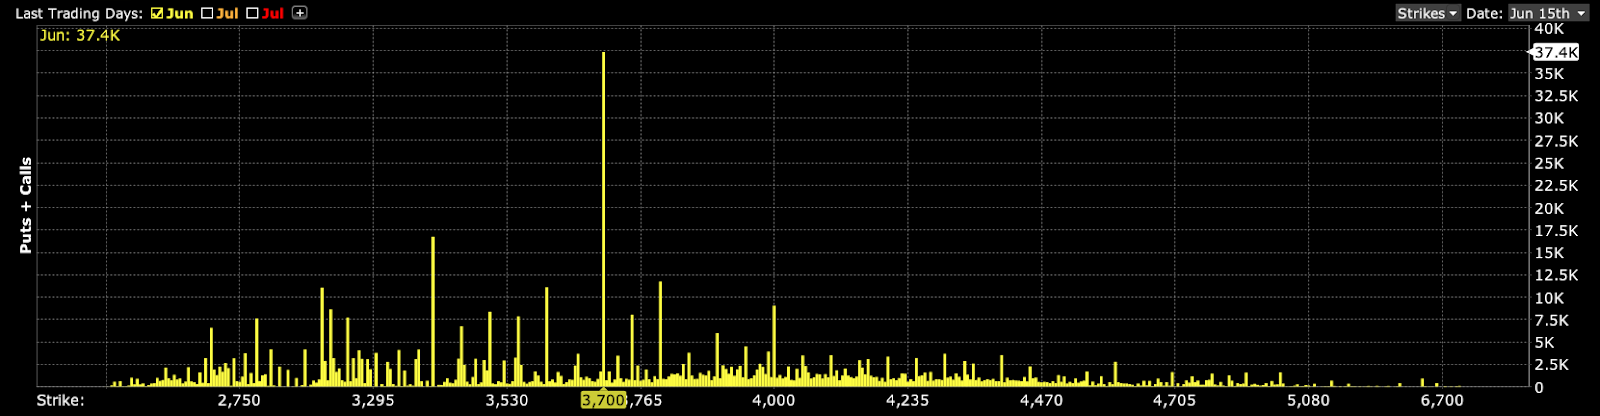
Graphic: Retrieved from Cboe Global Markets Inc (BATS: CBOE). Updated August 17, 2022. Skew steepened into $3,700.00 and below $3,500.00 in the S&P 500.
Given the above context, the following analysis unpacks how Physik Invest traded options tied to the S&P 500 leading up to and through the August 19 OpEx into the Jackson Hole Economic Symposium.
Note: Click here to view all transactions for all accounts involved.
Sequence 1:
Through August 12, 2022, after a volatility skew smile was observed, the following positions were initiated while the S&P 500 was still trending higher for a net $7,616.68 credit.
Positions were structured in a way that would potentially net higher credits had the index moved lower.
SOLD 10 1/2 BACKRATIO SPX 100 (Weeklys) 26 AUG 22 3700/3500 PUT @ ~$0.13 Credit
SOLD 3 VERTICAL SPX 100 21 OCT 22 [AM] 4300/4350 CALL @ ~$25.10 Credit
Sequence 2:
While the S&P 500 was trading near $4,300.00 resistance, by 8/19/2022, all aforementioned Ratio Put Spread positions were rolled forward for a $452.26 credit.
The trades netted a $15,032.78 profit after commissions and fees.
The max loss (absent some unforeseen events) sat at ~$6,790.00 if the S&P 500 closed above $4,350.00 in October. Because the Ratio Put Spreads were initiated at no cost, any loss would have resulted from the trade’s Vertical Spread component if the market went higher.
Overall, this trade netted more than a 200% return; its profit was more than two times the initial debit risk, making it a multi-bagger.
Reflection:
Heading into the trades, it was the case that IVOL performed poorly during much of the 2022 decline. This would likely remain the case on any subsequent drop; hence, the ultra-wide and short-dated Ratio Put Spread.
Despite the Ratio Put Spread exposing the position to negative Delta and positive Gamma (i.e., the trade makes money if the market moves lower, all else equal), if implied skew became more convex (i.e., implied volatilities grow more rapidly as strike prices decrease), the position could have been a giant loser. So, if the flatter part of the skew curve (where the position was structured) became more convex (i.e., rose), which is not something that was anticipated would happen, then the only recourse would have been to (1) close the position or (2) sell (i.e., add static negative Delta in) futures and correlated ETFs. In the second case, the trade would have allowed time to work (i.e., let Theta work) and become a potential winner.
Additionally, under Physik Invest’s risk protocol, more Short Put Ratio Spread units could have been initiated on the transition into Sequence 2. These units could have been held through Labor Day and monetized for up to an additional ~$4.00 credit per unit.
Though additional units of the Vertical Spreads could not have been added due to the strict limits to debit risks, there were still months left to that particular trade component. With lower prices expected, there was little reason the Verticals should have been removed fast.
In the future, should the context from a fundamental and volatility perspective remain the same, Physik Invest could potentially re-enter a similar position only on a rally.
The daily brief is a free glimpse into the prevailing fundamental and technical drivers of U.S. equity market products. Join the 850+ that read this report daily, below!
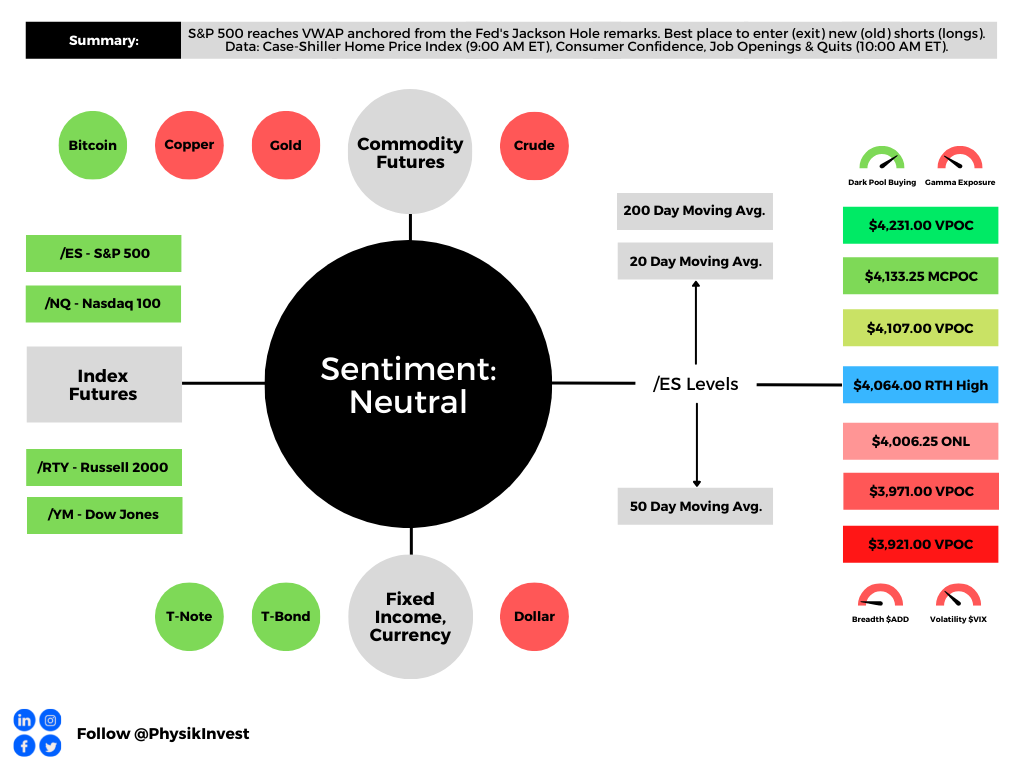
Graphic updated 8:30 AM ET. Sentiment Neutral if expected /ES open is inside of the prior day’s range. /ES levels are derived from the profile graphic at the bottom of the following section. Levels may have changed since initially quoted; click here for the latest levels. SqueezeMetrics Dark Pool Index (DIX) and Gamma (GEX) calculations are based on where the prior day’s reading falls with respect to the MAX and MIN of all occurrences available. A higher DIX is bullish. At the same time, the lower the GEX, the more (expected) volatility. Learn the implications of volatility, direction, and moneyness. Breadth reflects a reading of the prior day’s NYSE Advance/Decline indicator. VIX reflects a current reading of the CBOE Volatility Index (INDEX: VIX) from 0-100.
Positioning
In our last letter, it was put forth that markets were stretched after a ~20% multi-month advance on macro-type re-leveraging flows (given such things as a strong earnings season) and rotation out of volatility and commodity hedges.
To continue the advance, needed was more macro re-leveraging and demand for positive Delta exposure via equity or options, lower prints of consumer price data, as well as maintenance of a dovish Federal Reserve (Fed) undertone, among other things.
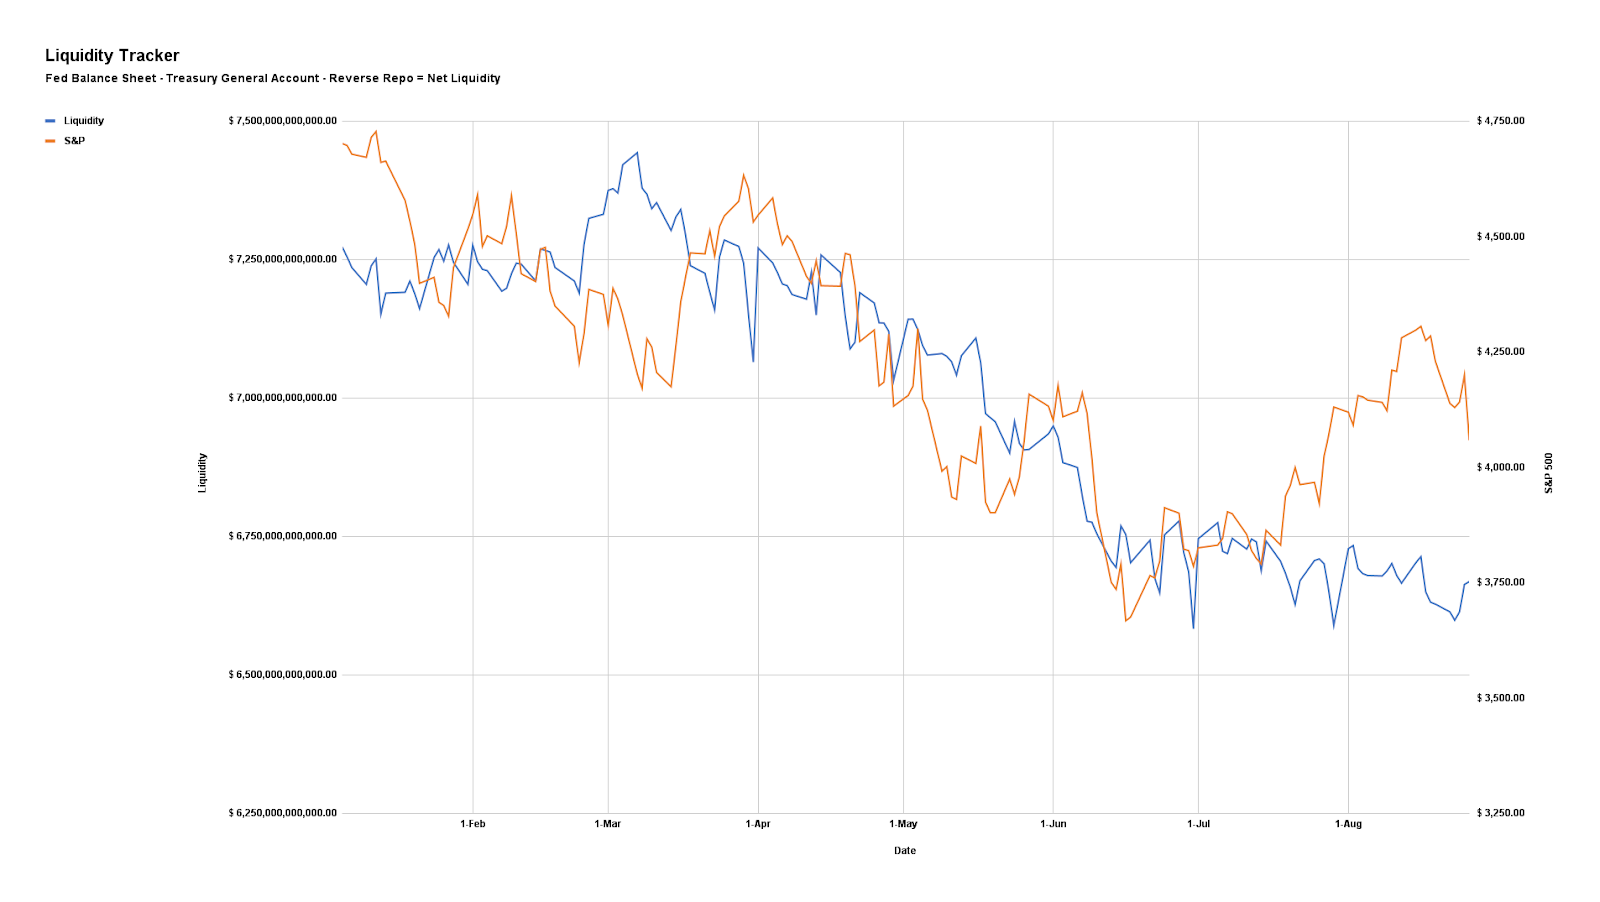
As an aside, participants’ dumping of poor-performing hedges (which we talked about in our last letter) left them “less hedged” and markets far more susceptible to “core macro factors” like “the incremental effects” of liquidity, a negative at present, particularly after OPEX or August monthly options expiration.
Graphic: Via Physik Invest. Data compiled by @jkonopas623. Fed Balance Sheet data, here. Treasury General Account Data, here. Reverse Repo data, here. NL = BS – TGA – RRP. According to The Macro Compass’ Alfonso Peccatiello, “QT is about to accelerate and the friendly dynamics behind the Fed balance sheet composition which helped risk assets stage a comeback rally in July are likely to fade away in Q4.”
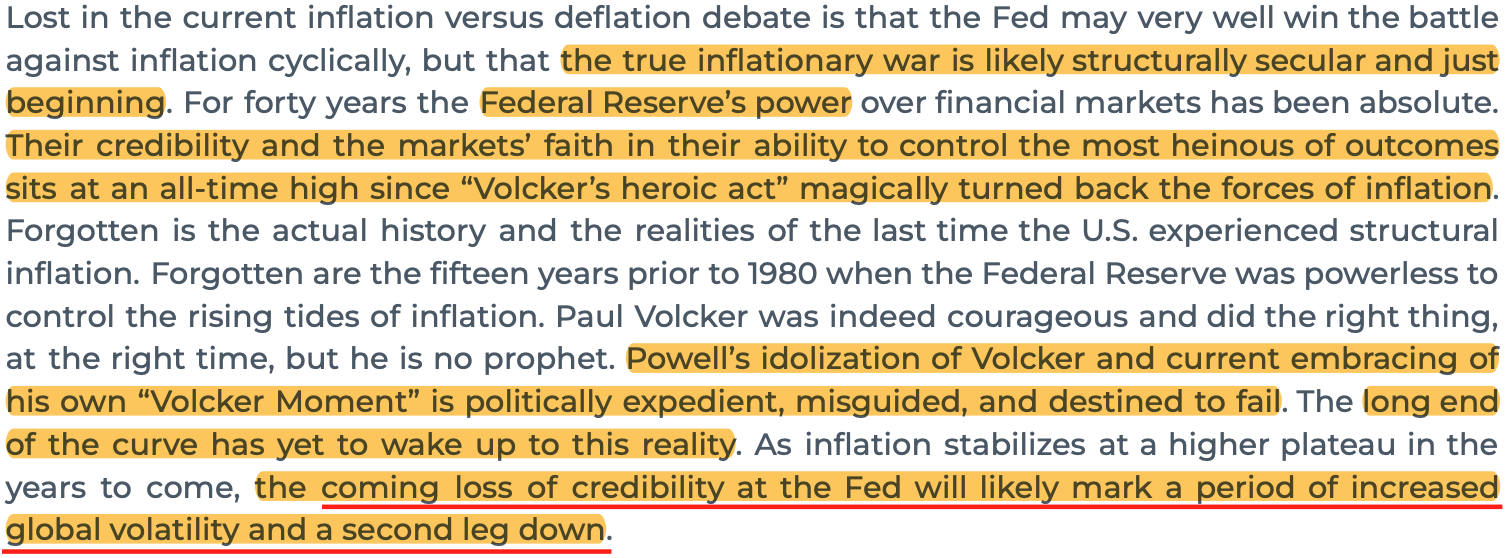
And so, when the Fed’s Jerome Powell gave a message that they would stay tough on the war against inflation, the context was set for much larger trading ranges and increased potential for downside volatility.
Graphic: Text retrieved from Kai Volatility’s Second Quarter (2022) Market Commentary And Outlook. Annotated by Physik Invest’s Renato Leonard Capelj. Read about the second leg down phenomenon, here.
During the subsequent rollover, the shock from Fed comments bolstered demand for protection (i.e., options) and boosted implied volatility, accordingly.
Graphic: Retrieved from SpotGamma. “There was a huge surge in large trader put buying in the equities space last week as per the OCC data.”
The reason being is that in a falling market, characterized by demand for put options, those who are on the other side of options trades, hedge in a manner that may pressure the market (i.e., the theory is that if customers buy puts, then counterparties sell puts + sell stock to hedge).
Graphic: Retrieved from SqueezeMetrics. Learn the implications of volatility, direction, and moneyness.
In our August 18, 2022 letter, we suggested wide Short Ratio Put Spreads would offer traders cheap but efficient exposure across very short time horizons. That trade panned out and, now, traders should be looking to monetize (i.e., turn to cash) these bets into any further declines.
Technical
As of 8:30 AM ET, Tuesday’s regular session (9:30 AM – 4:00 PM ET), in the S&P 500, is likely to open in the upper part of a positively skewed overnight inventory, just inside of prior-range and -value, suggesting a limited potential for immediate directional opportunity.
In the best case, the S&P 500 trades higher.
Any activity above the $4,064.00 RTH High pivot puts into play the $4,107.00 VPOC. Initiative trade beyond the VPOC could reach as high as the $4,133.25 and $4,231.00 POCs, or higher.
In the worst case, the S&P 500 trades lower.
Any activity below the $4,064.00 RTH High pivot puts into play the $4,006.25 ONL. Initiative trade beyond the ONL could reach as low as the $3,971.00 and $3,921.00 POCs, or lower.
Click here to load today’s key levels into the web-based TradingView charting platform. Note that all levels are derived using the 65-minute timeframe. New links are produced, daily.
Graphic: 65-minute profile chart of the Micro E-mini S&P 500 Futures.
Definitions
Overnight Rally Highs (Lows): Typically, there is a low historical probability associated with overnight rally-highs (lows) ending the upside (downside) discovery process.
Volume Areas: A structurally sound market will build on areas of high volume (HVNodes). Should the market trend for long periods of time, it will lack sound structure, identified as low volume areas (LVNodes). LVNodes denote directional conviction and ought to offer support on any test.
If participants were to auction and find acceptance into areas of prior low volume (LVNodes), then future discovery ought to be volatile and quick as participants look to HVNodes for favorable entry or exit.
Gamma: Gamma is the sensitivity of an option to changes in the underlying price. Dealers that take the other side of options trades hedge their exposure to risk by buying and selling the underlying. When dealers are short-gamma, they hedge by buying into strength and selling into weakness. When dealers are long-gamma, they hedge by selling into strength and buying into weakness. The former exacerbates volatility. The latter calms volatility.
POCs: POCs are valuable as they denote areas where two-sided trade was most prevalent in a prior day session. Participants will respond to future tests of value as they offer favorable entry and exit.
MCPOCs: POCs are valuable as they denote areas where two-sided trade was most prevalent over numerous day sessions. Participants will respond to future tests of value as they offer favorable entry and exit.
Volume-Weighted Average Prices (VWAPs): A metric highly regarded by chief investment officers, among other participants, for quality of trade. Additionally, liquidity algorithms are benchmarked and programmed to buy and sell around VWAPs.
About
After years of self-education, strategy development, mentorship, and trial-and-error, Renato Leonard Capelj began trading full-time and founded Physik Invest to detail his methods, research, and performance in the markets.
Capelj also develops insights around impactful options market dynamics at SpotGamma and is a Benzinga reporter.
In no way should the materials herein be construed as advice. Derivatives carry a substantial risk of loss. All content is for informational purposes only.
The daily brief is a free glimpse into the prevailing fundamental and technical drivers of U.S. equity market products. Join the 600+ that read this report daily, below!
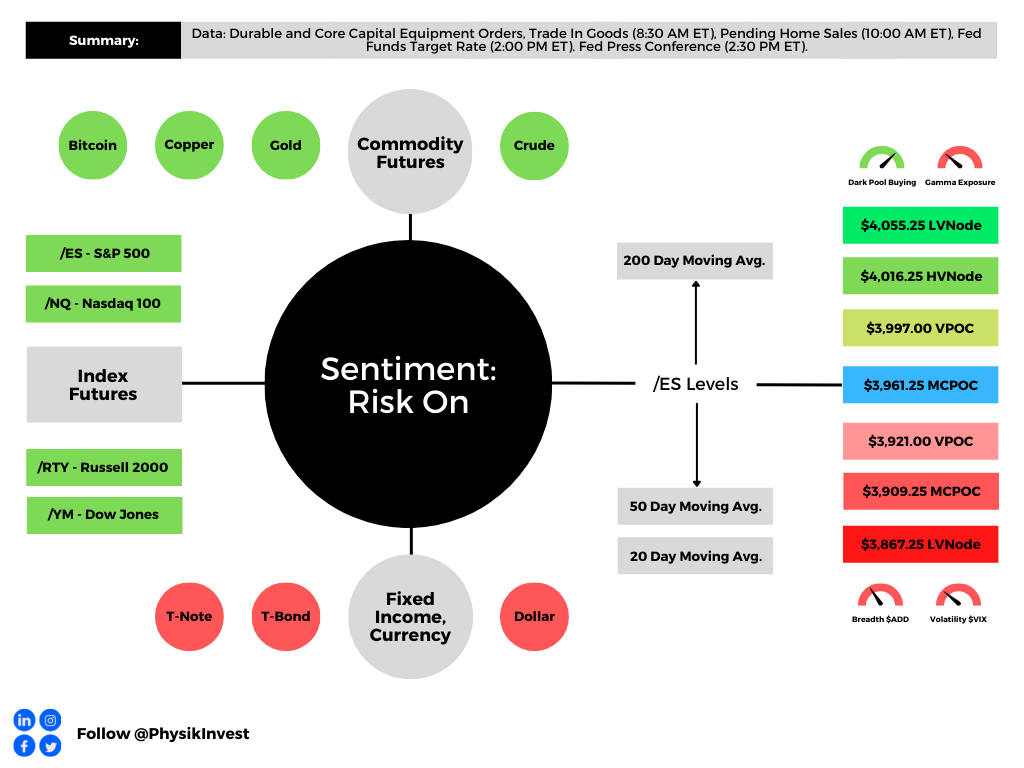
Graphic updated 6:55 AM ET. Sentiment Risk-On if expected /ES open is above the prior day’s range. /ES levels are derived from the profile graphic at the bottom of the following section. Levels may have changed since initially quoted; click here for the latest levels. SqueezeMetrics Dark Pool Index (DIX) and Gamma (GEX) calculations are based on where the prior day’s reading falls with respect to the MAX and MIN of all occurrences available. A higher DIX is bullish. At the same time, the lower the GEX, the more (expected) volatility. Learn the implications of volatility, direction, and moneyness. Breadth reflects a reading of the prior day’s NYSE Advance/Decline indicator. VIX reflects a current reading of the CBOE Volatility Index (INDEX: VIX) from 0-100.
Fundamental
We shall unpack details from the Federal Open Market Committee (FOMC) event in the coming sessions, stay tuned.
Positioning
As of 6:40 AM ET, Wednesday’s expected volatility, via the Cboe Volatility Index (INDEX: VIX), sits at ~1.27%. Net gamma exposures lightly decreasing may promote larger trading ranges.
Graphic: Via Physik Invest. Data retrieved from SqueezeMetrics.
Should fears with respect to the Federal Open Market Committee (FOMC) announcement be assuaged, then compression in volatility may do more to support current equity price levels.
Graphic: Updated July 26, 2022. Retrieved from Interactive Brokers Group Inc’s (NASDAQ: IBKR) Trader Workstation. Posted by SpotGamma. Short-dated, pre-FOMC, volatility is sold. Longer-dated, post-FOMC volatility is bid. “Traders have likely shorting implied volatility for pre-FOMC expirations which has been supportive of equities.”
Notwithstanding, let’s unpack some trends and how they may feed into a volatility “untethering.”
In the Daily Brief for March 31, 2022, we discussed participants’ aversion to selling short-term variance. This, which did more to assuage our fear of crash risk, as well explained in the Daily Brief for March 30, 2022, was, in part, the result of COVID-era volatility that forced participants, out on the risk curve, to deleverage en masse.
As stated in March, per Banco Santander SA’s (NYSE: SAN) research, the “supply of volatility remains very subdued in a trend that has continued since the pandemic.”
“We did observe some activity in 4Q21 and 1Q this year, but almost all of that was unwinding of existing positions from earlier, and these were not new trades.”
Graphic: Via Goldman Sachs Group Inc (NYSE: GS).
However, despite all of the “uncertainty from geopolitics and central banks,” we still saw broad equity implied volatility (IVOL) measures subdued, relative to those in rates and FX.
Graphic: Retrieved from QVR Advisors’ Benn Eifert.
Let’s unpack that muted response, further.
Well, as explained in the Daily Brief for July 21, 2022, heading into the 2022 decline, institutions repositioned and hedged, even allocating to “commodity trend following,” per our Daily Brief for July 15, 2022, which worked well the first two quarters.
The monetization and counterparty hedging of existing customer hedges, as well as the sale of short-dated volatility, particularly in some of the single names where there was “rich” volatility, into the fall, lent to lackluster performance in implied volatility and index mean reversion.
Graphic: Retrieved from Rob Emrich III. Via Goldman Sachs Group Inc (NYSE: GS).
This trend is set to come to an end as entities are squeezed out of trades that aren’t working (i.e., participants rotate out of volatility and commodities).
Graphic: Retrieved from SpotGamma. S&P 500 $3,500.00 put option values. “Like with the Boy Who Cried Wolf, people grew tired of false alarms. This year put buyers have been waiting for the wolf, but after June OPEX the villagers stopped listening.”
Per Kai Volatility’s Cem Karsan, as “volatility itself, on the equity side, becomes less and less hedged on the customer level, … [the] market can really begin to respond to the core macro factors.”
Should markets experience a shock, or trade substantially lower, the demand for hedges may result in an “untethering” in implied volatility, which was “one of the most supportive things into the decline,” Karsan said, adding that now is the best time to rotate into call options which are outperforming “their delta to the upside.”
Graphic: Time-lapse skew on the S&P 500 (INDEX: SPX) for July 25 and July 26, 2022. Retrieved from Interactive Brokers Group Inc’s (NASDAQ: IBKR) Trader Workstation.
Accordingly, given the macro risk, IVOL is likely at a lower bound and, per The Ambrus Group’s Kris Sidial, “if you wanted to go out and hedge, the opportunity is still there in the equity space.”
Technical
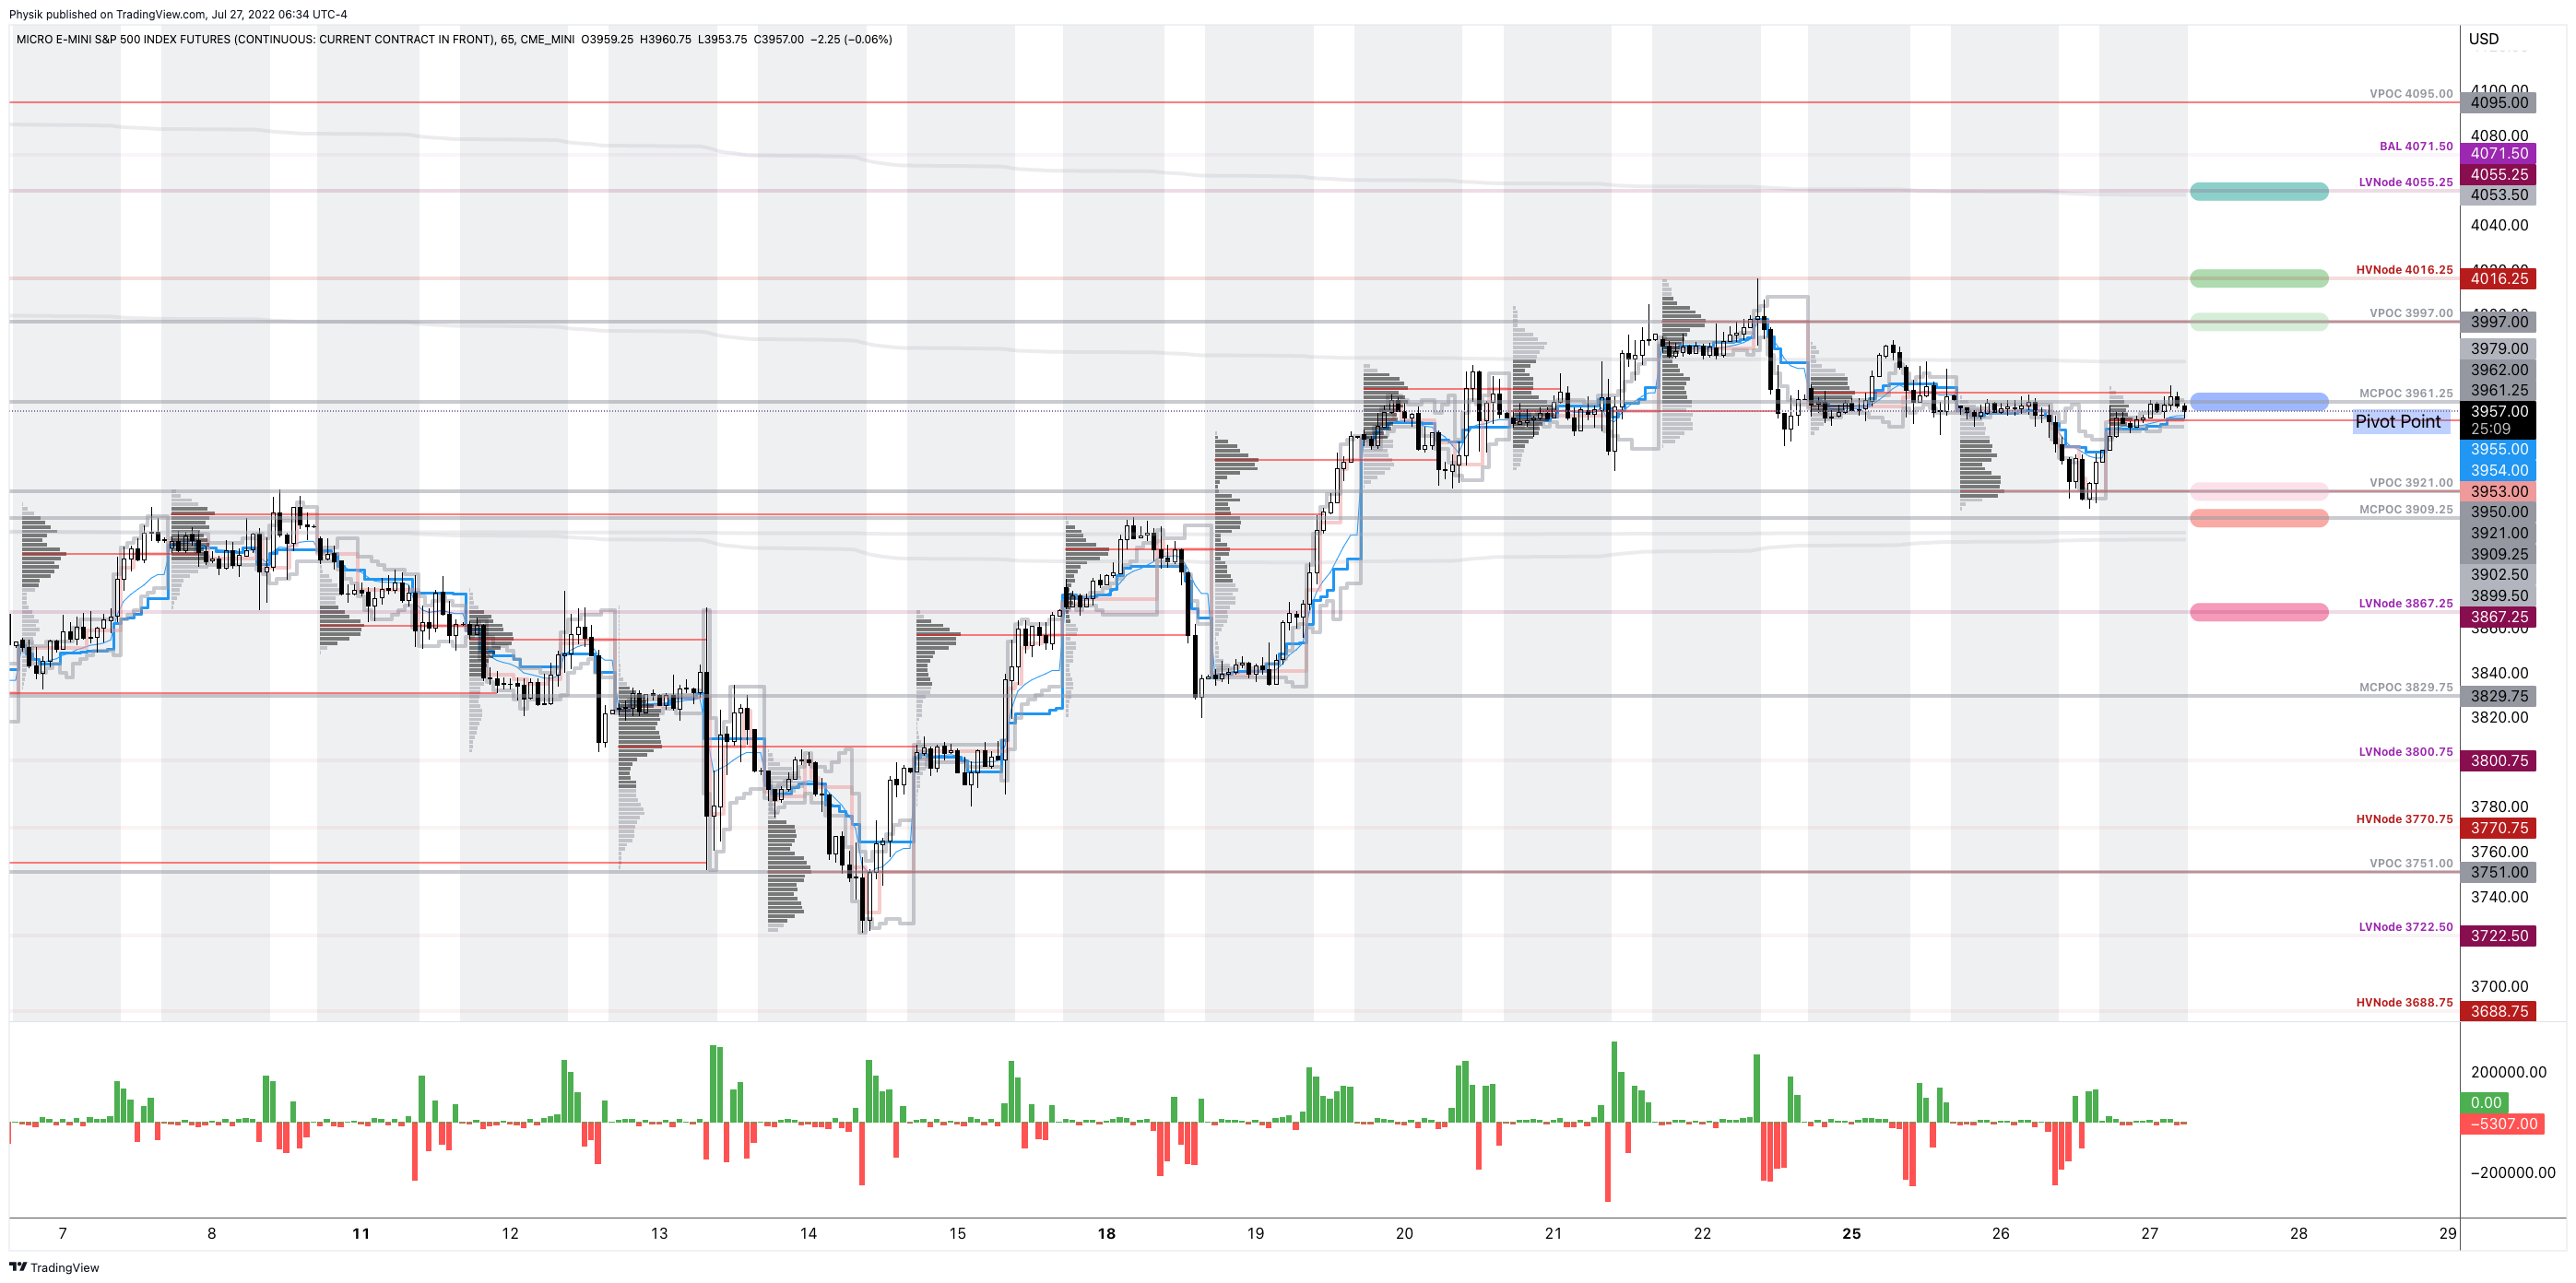
As of 6:30 AM ET, Wednesday’s regular session (9:30 AM – 4:00 PM ET), in the S&P 500, is likely to open in the upper part of a positively skewed overnight inventory, just outside of prior-range and -value, suggesting a potential for immediate directional opportunity.
In the best case, the S&P 500 trades higher.
Any activity above the $3,961.25 MCPOC puts into play the $3,997.00 VPOC. Initiative trade beyond the VPOC could reach as high as the $4,016.25 HVNode and $4,055.25 LVNode, or higher.
In the worst case, the S&P 500 trades lower.
Any activity below the $3,961.25 MCPOC puts into play the $3,921.00 VPOC. Initiative trade beyond the VPOC could reach as low as the $3,909.25 MCPOC and $3,867.25 LVNode, or lower.
Click here to load today’s key levels into the web-based TradingView charting platform. Note that all levels are derived using the 65-minute timeframe. New links are produced, daily.
Graphic: 65-minute profile chart of the Micro E-mini S&P 500 Futures.
Definitions
Volume Areas: A structurally sound market will build on areas of high volume (HVNodes). Should the market trend for long periods of time, it will lack sound structure, identified as low volume areas (LVNodes). LVNodes denote directional conviction and ought to offer support on any test.
If participants were to auction and find acceptance into areas of prior low volume (LVNodes), then future discovery ought to be volatile and quick as participants look to HVNodes for favorable entry or exit.
POCs: POCs are valuable as they denote areas where two-sided trade was most prevalent in a prior day session. Participants will respond to future tests of value as they offer favorable entry and exit.
MCPOCs: POCs are valuable as they denote areas where two-sided trade was most prevalent over numerous day sessions. Participants will respond to future tests of value as they offer favorable entry and exit.
Volume-Weighted Average Prices (VWAPs): A metric highly regarded by chief investment officers, among other participants, for quality of trade. Additionally, liquidity algorithms are benchmarked and programmed to buy and sell around VWAPs.
About
After years of self-education, strategy development, mentorship, and trial-and-error, Renato Leonard Capelj began trading full-time and founded Physik Invest to detail his methods, research, and performance in the markets.
Capelj also develops insights around impactful options market dynamics at SpotGamma and is a Benzinga reporter.
In no way should the materials herein be construed as advice. Derivatives carry a substantial risk of loss. All content is for informational purposes only.
The daily brief is a free glimpse into the prevailing fundamental and technical drivers of U.S. equity market products. Join the 300+ that read this report daily, below!
Overnight, equity index and commodity futures were sideways to lower all the while bonds and volatility were bid.
This is after participants, based on metrics included later in the letter, took the advance as an opportunity to sell at higher prices. Demanded was protection, and this bid implied volatility.
Big headlines include China sending warplanes near Taiwan after the U.S. rejected its strait claims. The Taiwanese Foreign Minister Joseph Wu wrote that the threat was “more serious than ever.” This is, also, ahead of Taiwan and U.S. officials talking about arms sales.
In other news, Congress was called on to pass a $0.184 per gallon gasoline tax holiday. Growth in job postings slowed as Q2 GDP forecasts have been revised lower, Chinese manufacturing orders declined by 20-30%, U.K. inflation hit a 40-year record, and sellers of homes are cutting prices in some of the hottest markets while the demand for adjustable-rate mortgages surges.
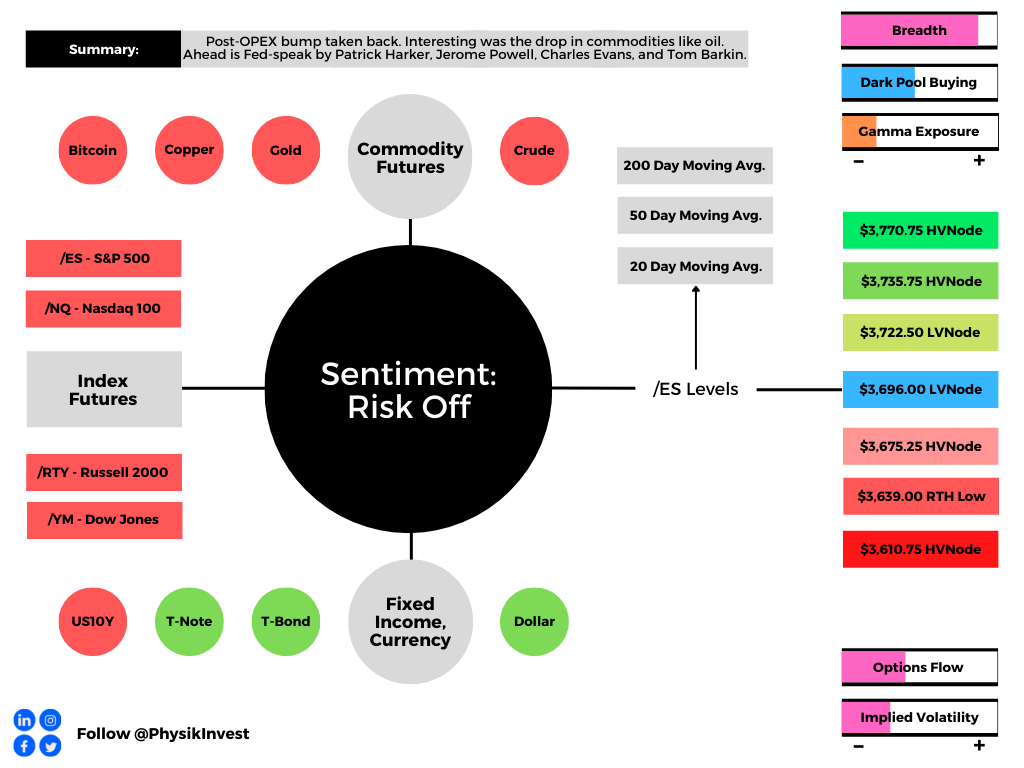
Ahead, the Federal Reserve’s (Fed) Patrick Harker speaks at 9:00 AM ET. Then, Jerome Powell testifies to the Senate Banking Committee at 9:30 AM ET. Later, Charles Evans speaks at 12:50 PM ET, followed by Harker and Barkin, again, at 1:30 PM ET.
Graphic updated 6:30 AM ET. Sentiment Risk-Off if expected /ES open is below the prior day’s range. /ES levels are derived from the profile graphic at the bottom of the following section. Levels may have changed since initially quoted; click here for the latest levels. SqueezeMetrics Dark Pool Index (DIX) and Gamma (GEX) calculations are based on where the prior day’s reading falls with respect to the MAX and MIN of all occurrences available. A higher DIX is bullish. At the same time, the lower the GEX, the more (expected) volatility. Learn the implications of volatility, direction, and moneyness. SHIFT data used for S&P 500 (INDEX: SPX) options activity. Note that options flow is sorted by the call premium spent; if more positive, then more was spent on call options. Breadth reflects a reading of the prior day’s NYSE Advance/Decline indicator. VIX reflects a current reading of the CBOE Volatility Index (INDEX: VIX) from 0-100.
What To Expect
Fundamental: For what it is worth when it comes to talking of theory and the economy, ARK Invest’s Cathie Wood has been spot on, in many ways.
Somewhat pursuant to our detailed analysis on May 18, 2022, which talked about the impact of reduced liquidity and credit on the real economy and asset prices, Wood explained that the U.S. fell into a recession during the first quarter.
“If massive inventor[ies] bloat real GDP in the second quarter, they will unwind and hurt growth for the rest of the year,” she said. Last year, though badly timed, Wood said that inflation would be on its way out due in part to excess inventory which would be reflected in commodity prices.
Read: Walmart Inc’s (NYSE: WMT) inventory glut to reduce in a “couple of quarters” and how Target Corporation’s (NYSE: TGT) oversupply problem should scare all retailers.
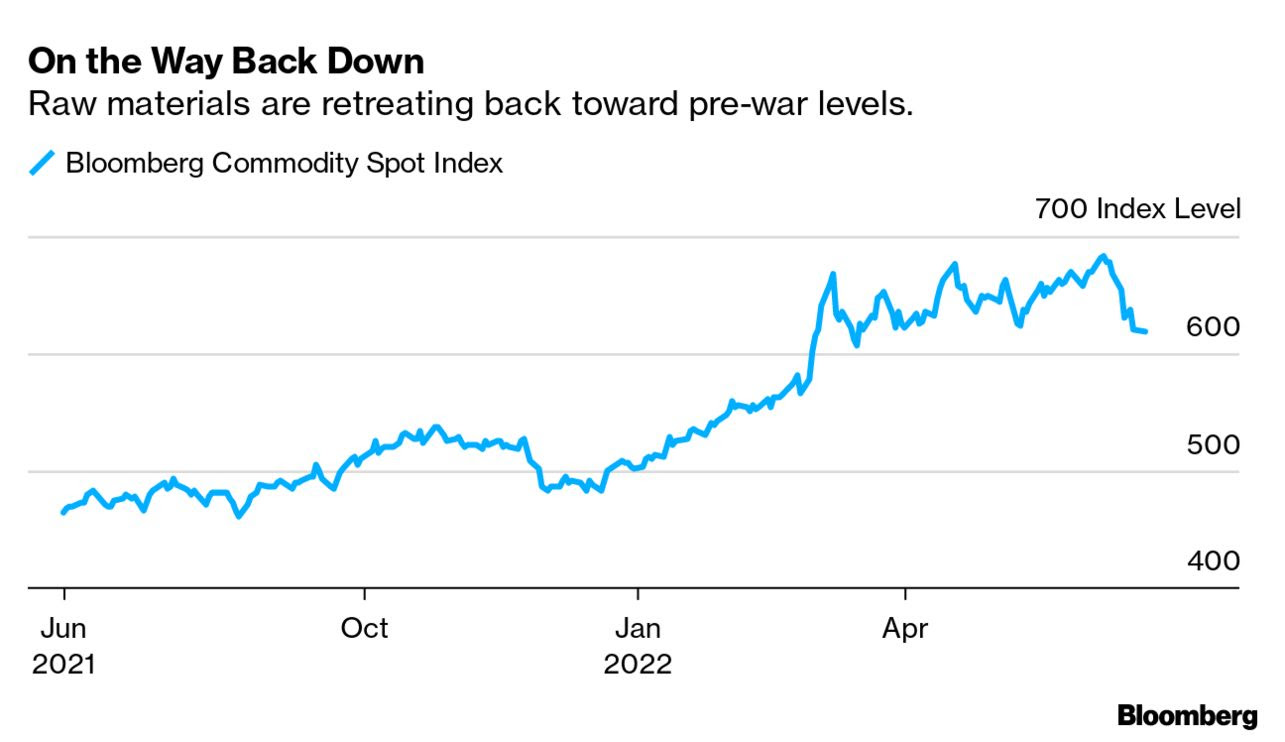
Graphic: Via Bloomberg. “The hot commodities rally is cooling off fast as recession fears again ground and cloud the outlook for demand.”
“If inventories and stock prices are leading indicators for employment and wages, … then fears of cost-push inflation a la 1970’s should disappear during the next six months.”
To put it briefly, as we’ve talked about in the past, the recent market rout is a recession and the direct reflection of the unwind of carry. It is the manifestation of a deflationary shock, and today’s sentiment and reducing demand for goods, among other things, reflect this.
And, with that, after a period during which capital was misallocated, the Fed is not in a position to control price stability “without bringing down the markets,” per Kai Volatility’s Cem Karsan.
“Bonds are not acting as a hedge and appear to be becoming less ‘money’ like due persistent declines in price and elevated rate vol,” as Joseph Wang, who was a trader at the Fed, puts it.
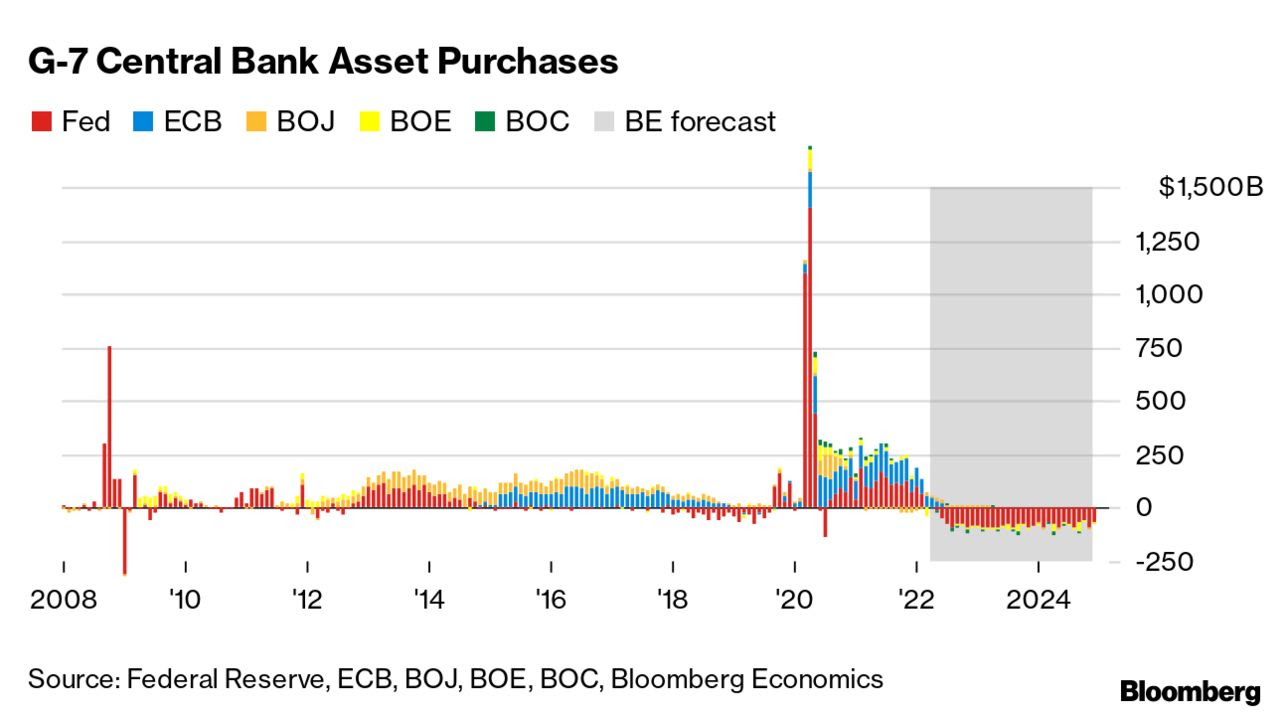
Bank deposits are to drain about $1 trillion or so by year-end, prompting investors to “continue to lower their selling prices to compete for the cash they want.”
Graphic: Per Bloomberg, “[E]very $1 trillion of QT will equate to a decline of roughly 10% in stocks over the next 12 months or so.”
If it provides any solace, per comments by Credit Suisse Group AG’s (NYSE: CS) Zoltan Pozsar, the Fed, which “can only deal with nominal [and] not real chokepoints,” is likely to change course.
This is as “nominal balance sheet and liquidity trends will, at some point, clash with the realities of a garden variety of supply chain issues.”
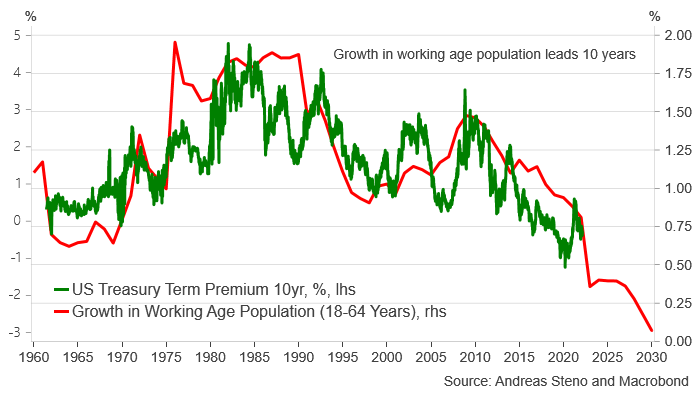
Likewise, Andreas Steno Larsen explains that bond yields remain governed by demographics, and this is good news for stocks, in general.
“Just look at the growth rate of the working-age population (10 years forward) versus the term premium of US Treasury bonds. The current bond bear market is not standing on structural pillars.”
Graphic: Via Andreas Steno Larsen. “Bond yields remain governed by demographics over the medium-term. Low(er) for longer.”
Moving on. So, last week, we had a large monthly options expiration (OPEX). After this, liquidity providers’ re-hedging flows supported the market.
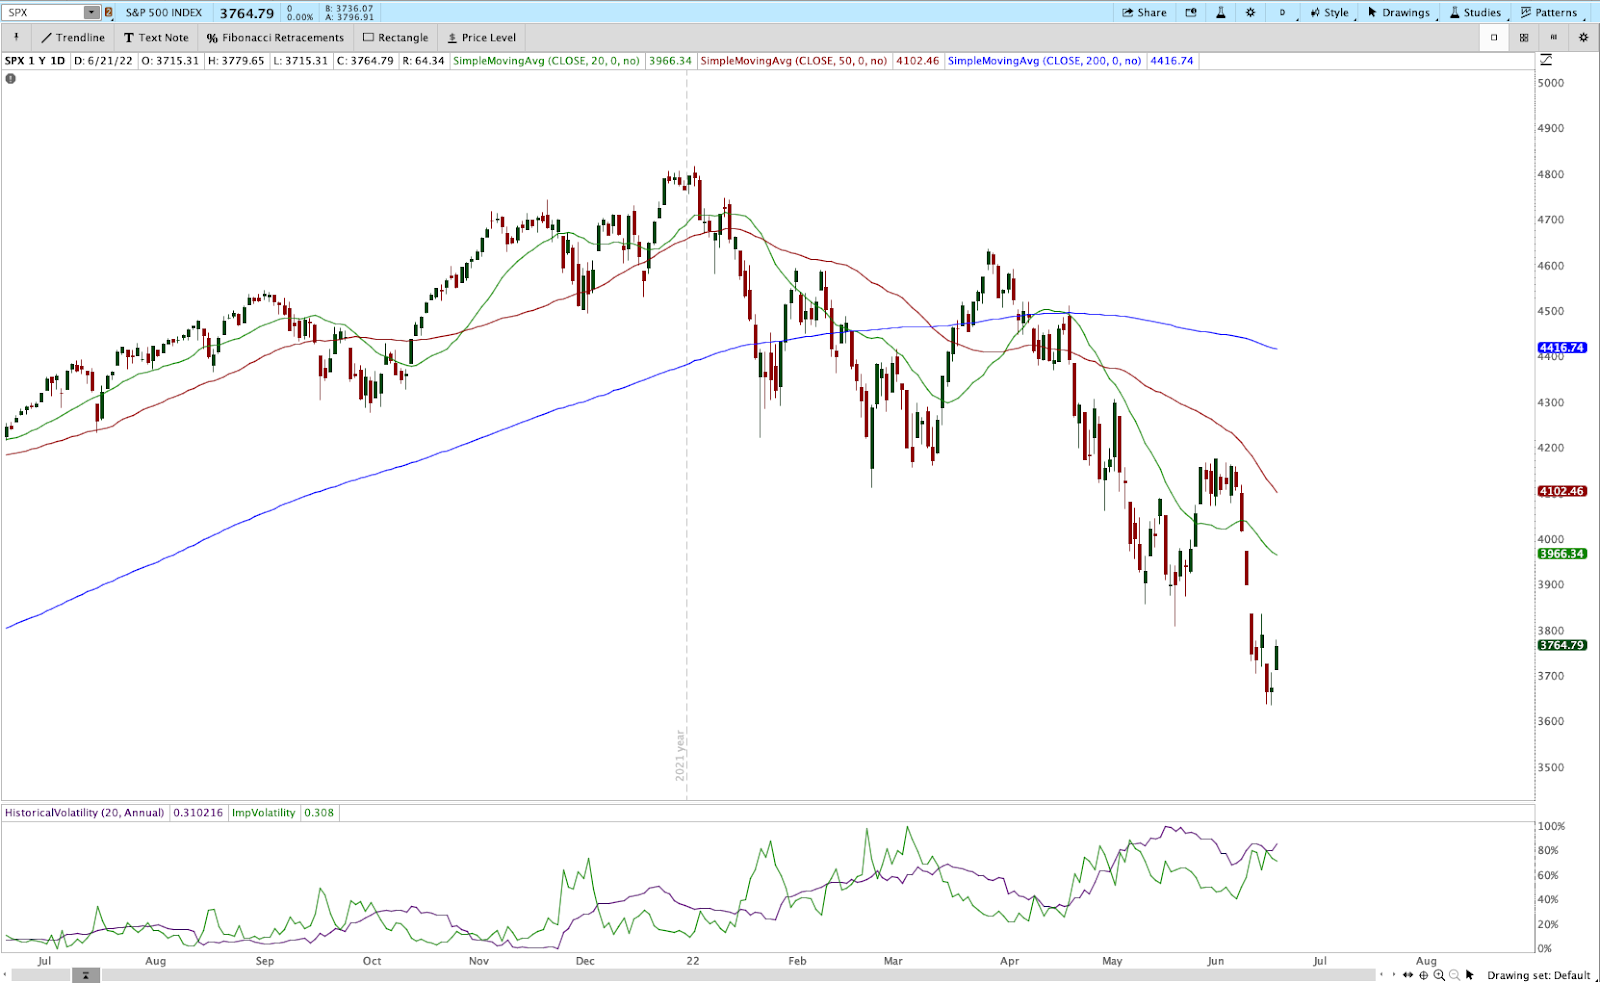
Over the weekend, into Tuesday’s U.S. close, equities, then, traded higher. The rally, however, was not confidence-inspiring and was indicative of short-covering.
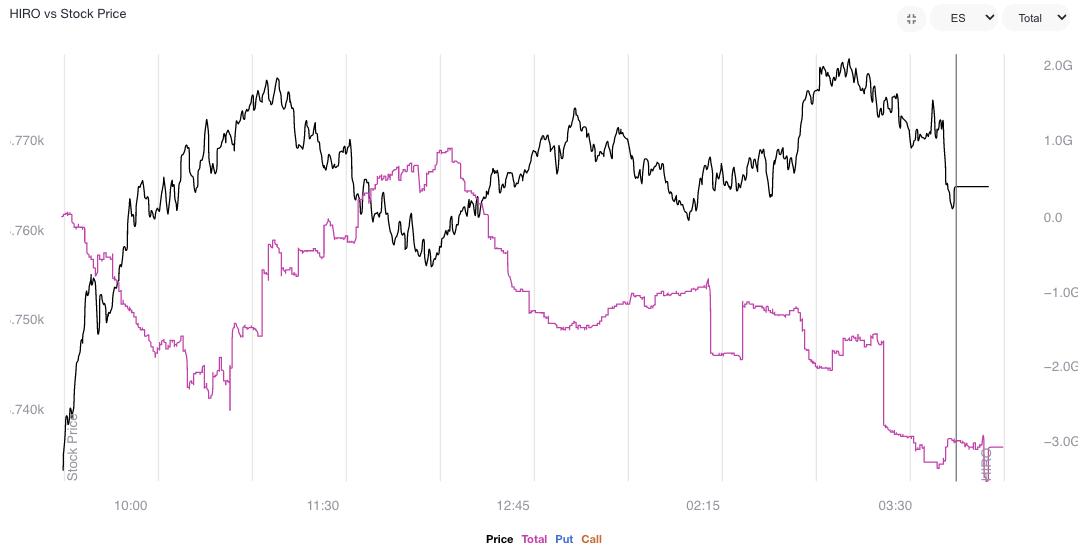
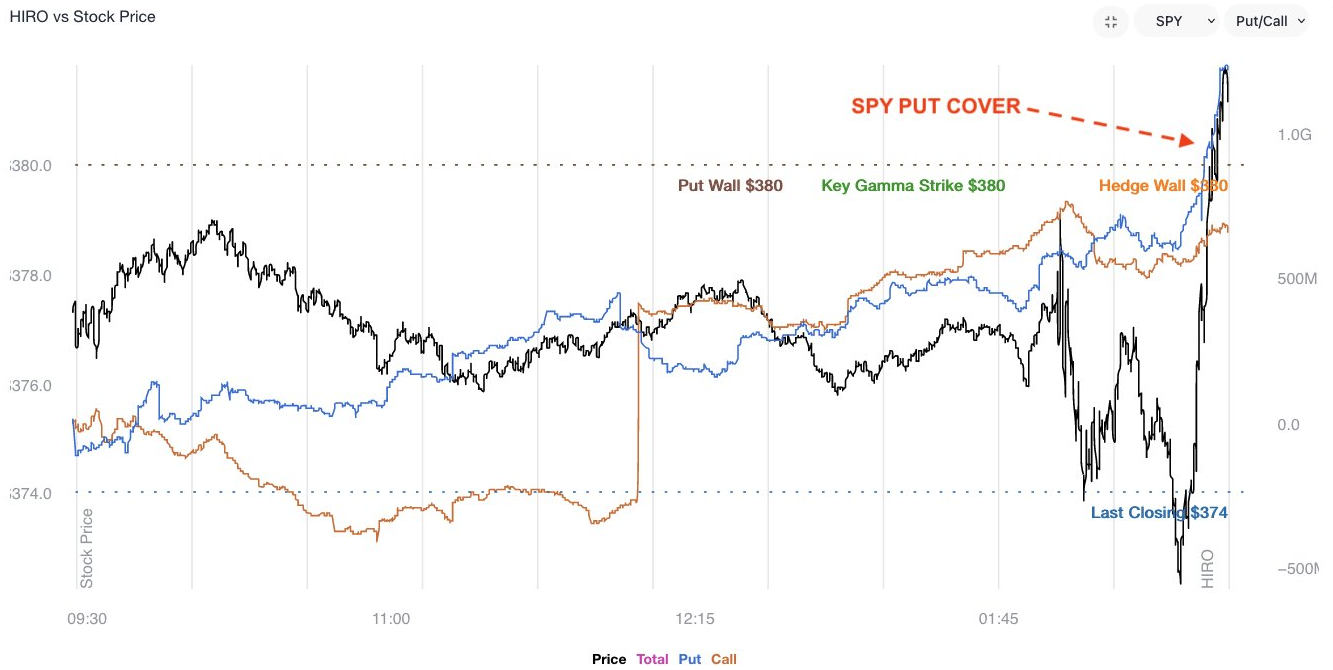
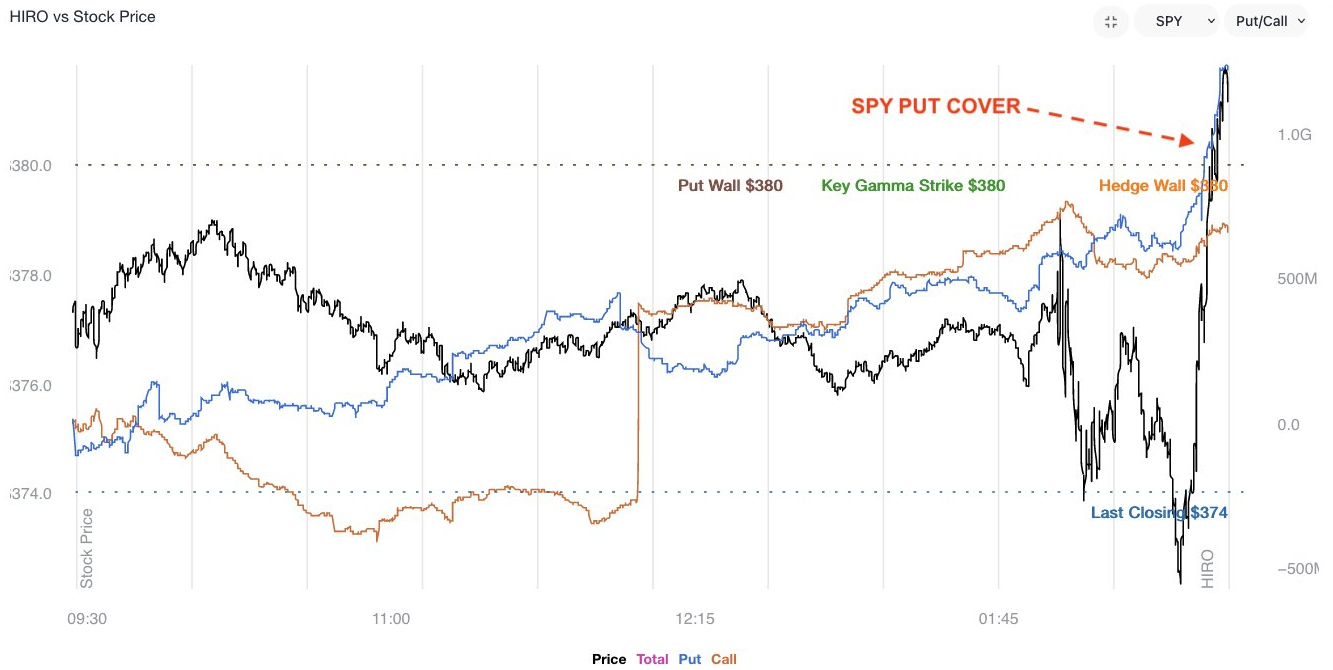
Per SpotGamma’s Hedging Impact of Real-Time Options (HIRO) indicator, participants took the relief rally “as an opportunity to hedge/sell,” as I wrote for SpotGamma, yesterday.
Graphic: SpotGamma’s combined HIRO reading for the S&P 500 (INDEX: SPX) and SPDR S&P 500 ETF Trust (NYSE: SPY). Trade was responsive (i.e., buy dip, sell rip) up until 2:00 PM ET when demand for negative delta (i.e., put buying, call selling) outweighed that for positive delta.
This ultimately showed up in broad measures of implied volatility. As The Ambrus Group’s Kris Sidial said: “[I]n the final hour, spot [and] vol up.”
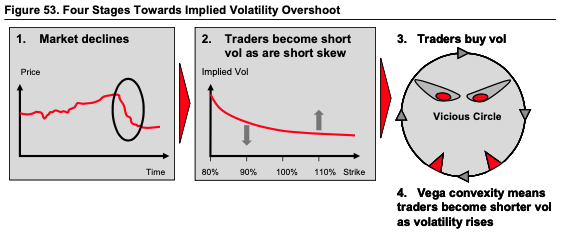
This plays into decreased odds for a far-reaching rally. Participants are positioned out in strikes that are lower and the activity in those strikes plays into a change in tone with respect to the non-linearity and strength of volatility and skew with respect to linear changes in asset prices.
As Karsan spoke to, last week, the spikes in short-dated -sticky skew – the “first we’ve seen since [the] secular decline began” – hints at a “critical change in dealer positioning.”
“We’re transitioning to a fat left tail, right-based distribution,” Karsan adds.
So why does any of this matter?
There still appears to be a heavy supply of options, particularly those with less time to maturity, and skew remains poor-performing (hence comments in prior letters on the benefit of buying into implied skew convexity should volatility reprice).
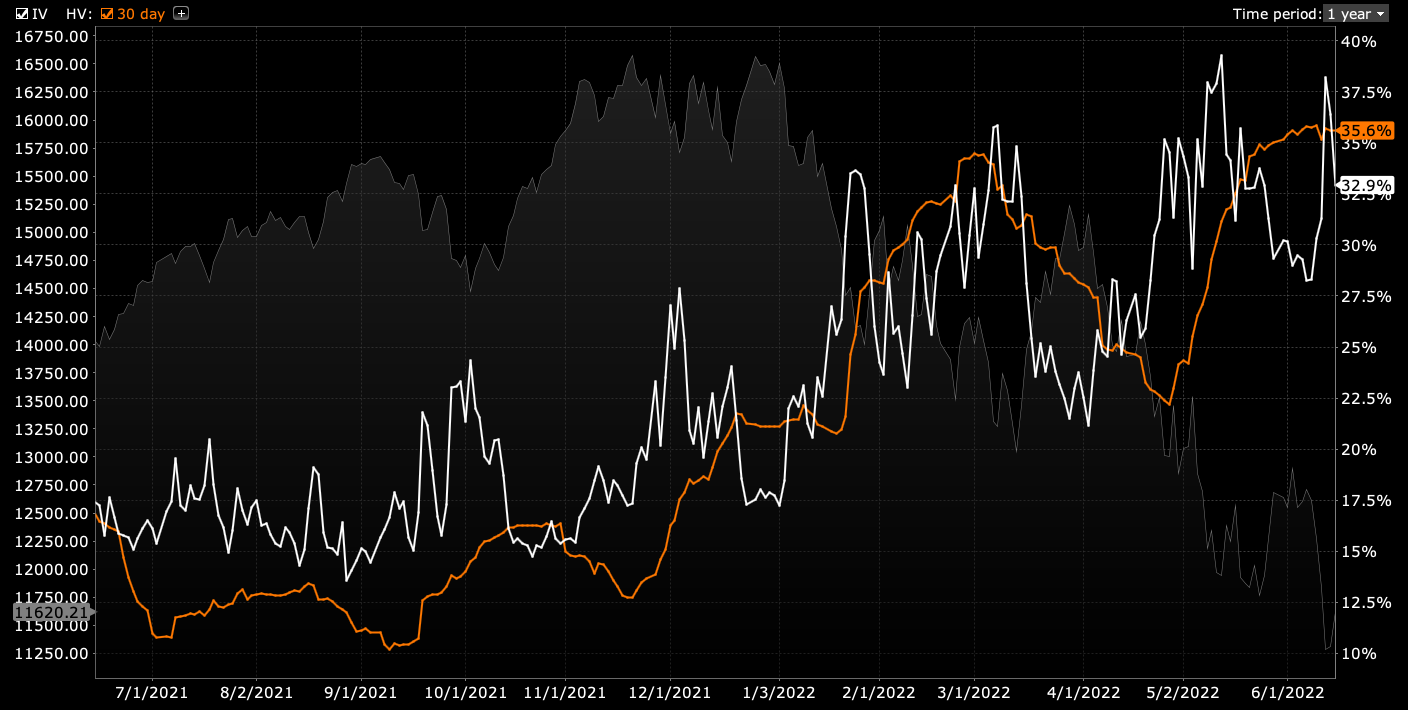
Graphic: Via Charles Schwab Corporation-owned (NYSE: SCHW) TD Ameritrade’s Thinkorswim. Note historical or realized volatility (RVOL) versus that which is implied (IVOL).
Basically, participants are hedged and volatility remains well-supplied.
If there was to be forced selling or demand for protection by a greater share of the market in ways not recently seen, then the repricing of the aforementioned structures would be a boon for those who own them.
Graphic: Via Banco Santander SA (NYSE: SAN) research.
Options have a “non-zero second-order price sensitivity (or convexity) to a change in volatility,” as Mohamed Bouzoubaa et al explain well in the book Exotic Options and Hybrids.
“ATM vanillas are [not] convex in the underlying’s price, … but OTM vanillas do have vega convexity … [so], when the holder of an option is long vega convexity, we say she is long vol-of-vol.”
In other words, by owning that protection – e.g., butterfly and back spreads – you are positioned to monetize on a continued non-linear repricing of volatility. The difficult part is cutting the decay of those spreads when nothing happens.
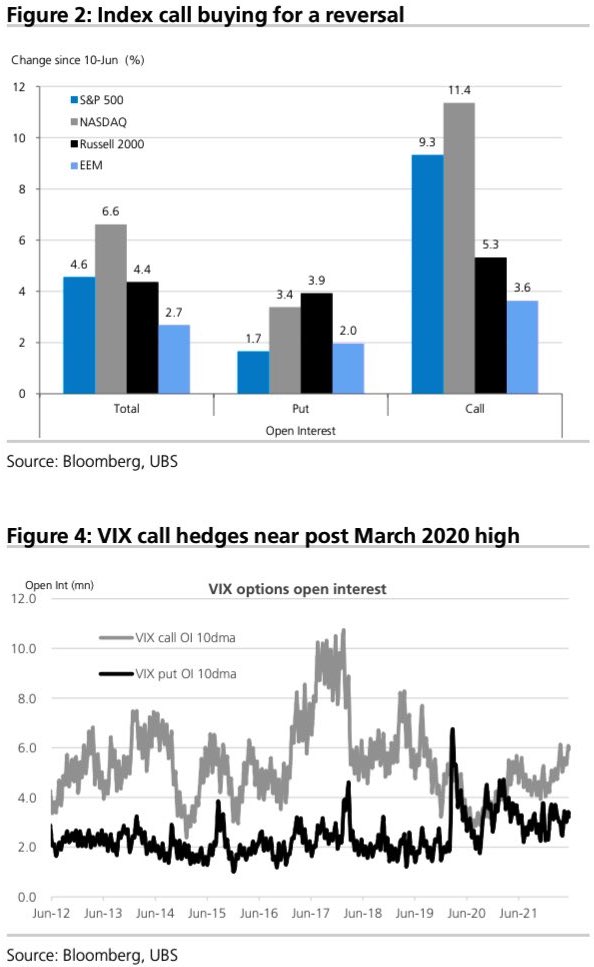
As an aside, despite the bearish tilt in positioning, there has been a notable uptick in index call buying per UBS Group AG (NYSE: UBS), presumably so that participants don’t miss out on a vicious reversal, should one transpire.
Graphic: Via UBS Group AG.
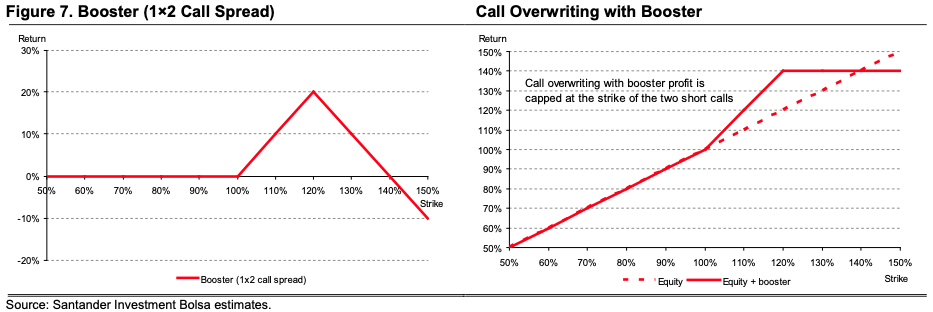
Adding, the “high starting point” in IVOL makes it possible to put on zero- and low-cost bets that deliver asymmetric payouts in case of violent and short-lived reversals.
Graphic: Via Banco Santander SA (NYSE: SAN) research, the return profile, at expiry, of a classic 1×2 (long 1, short 2 further away) ratio spread (the inverse of a back spread).
Technical: As of 6:30 AM ET, Wednesday’s regular session (9:30 AM – 4:00 PM ET), in the S&P 500, will likely open in the lower part of a negatively skewed overnight inventory, inside of prior-range and -value, suggesting a limited potential for immediate directional opportunity.
In the best case, the S&P 500 trades higher; activity above the $3,696.00 low volume area (LVNode) puts in play the $3,722.50 LVNode. Initiative trade beyond the LVNodes could reach as high as the $3,735.75 and $3,770.75 high volume areas (HVNodes), or higher.
In the worst case, the S&P 500 trades lower; activity below the $3,696.00 LVNode puts in play the $3,675.25 HVNode. Initiative trade beyond the HVNode could reach as low as the $3,639.00 RTH Low and $3,610.75 HVNode, or lower.
Click here to load today’s key levels into the web-based TradingView charting platform. Note that all levels are derived using the 65-minute timeframe. New links are produced, daily.
Graphic: 65-minute profile chart of the Micro E-mini S&P 500 Futures.
Considerations: Gap scenarios are in play, today.
Gaps ought to fill quickly. Should they not, that’s a signal of strength; do not fade. Leaving value behind on a gap-fill or failing to fill a gap (i.e., remaining outside of the prior session’s range) is a go-with indicator.
Auctioning and spending at least 1-hour of trade back in the prior range suggests a lack of conviction; in such a case, do not follow the direction of the most recent initiative activity.
Definitions
A structurally sound market will build on areas of high volume (HVNodes). Should the market trend for long periods of time, it will lack sound structure, identified as low volume areas (LVNodes). LVNodes denote directional conviction and ought to offer support on any test.
If participants were to auction and find acceptance into areas of prior low volume (LVNodes), then future discovery ought to be volatile and quick as participants look to HVNodes for favorable entry or exit.
About
After years of self-education, strategy development, mentorship, and trial-and-error, Renato Leonard Capelj began trading full-time and founded Physik Invest to detail his methods, research, and performance in the markets.
Capelj also develops insights around impactful options market dynamics at SpotGamma and is a Benzinga reporter.
In no way should the materials herein be construed as advice. Derivatives carry a substantial risk of loss. All content is for informational purposes only.
The daily brief is a free glimpse into the prevailing fundamental and technical drivers of U.S. equity market products. Join the 300+ that read this report daily, below!
Overnight, the equity index and commodity futures were bid, all the while bonds and the dollar edged lower. This is after a week-long or so de-rate on tougher monetary policies.
Big headlines include the White House’s mulling of a U.S. gas tax suspension, Russia’s status as a top exporter of crude to China, Goldman Sachs Group Inc’s (NYSE: GS) recession warning, Elon Musk’s intent to cut Tesla Inc’s (NASDAQ: TSLA) workforce, and falling Iron ore prices on China’s building downturn.
Interesting reads from over the weekend include Dr. Pippa Malmgren’s letter on the market’s “nosedive” which is likely to be “followed by a newfound understanding of what is possible,” and how that plays into economic strength and military superiority.
Adding, timely was a Sohn 2022 conversation with Stanley Druckenmiller on his experiences and the current market environment.
Ahead is data on the Chicago Fed National Activity Index (8:30 AM ET), existing-home sales (10:00 AM ET), as well as Fed-speak by Loretta Mester (12:00 PM ET) and Tom Barkin (3:30 PM ET).
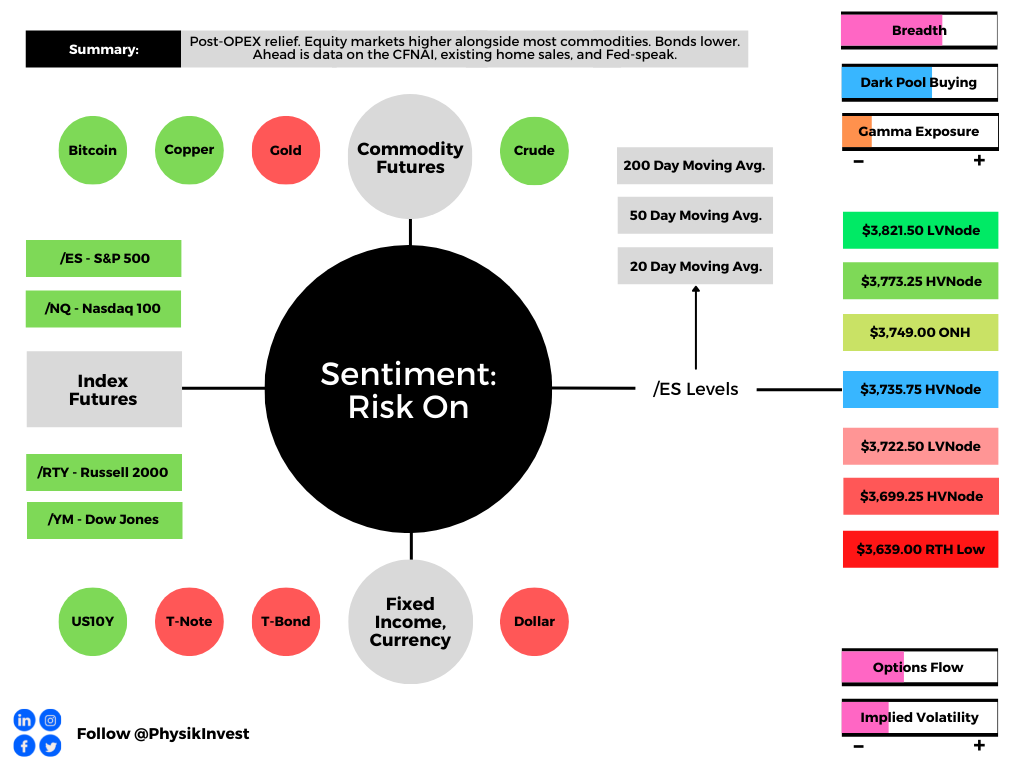
Graphic updated 6:30 AM ET. Sentiment Risk-On if expected /ES open is above the prior day’s range. /ES levels are derived from the profile graphic at the bottom of the following section. Levels may have changed since initially quoted; click here for the latest levels. SqueezeMetrics Dark Pool Index (DIX) and Gamma (GEX) calculations are based on where the prior day’s reading falls with respect to the MAX and MIN of all occurrences available. A higher DIX is bullish. At the same time, the lower the GEX, the more (expected) volatility. Learn the implications of volatility, direction, and moneyness. SHIFT data used for S&P 500 (INDEX: SPX) options activity. Note that options flow is sorted by the call premium spent; if more positive, then more was spent on call options. Breadth reflects a reading of the prior day’s NYSE Advance/Decline indicator. VIX reflects a current reading of the CBOE Volatility Index (INDEX: VIX) from 0-100.
What To Expect
Fundamental: Keeping this letter brief, today.
The sale of both bonds and equities worsened in part due to the implications of inflation and the Federal Reserve’s (Fed) response to that inflation.
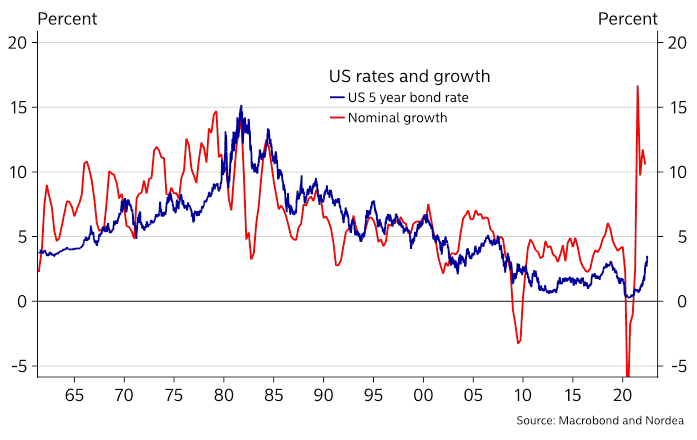
Graphic: Via Nordea Bank’s (OTC: NRDBY) research. “We suspect that the real economy will be less sensitive to a rise in interest rates this time, which means that the Fed could have to move rates more-than-expected before policy gets restrictive. The strongest argument is that the household balance sheets are in a much better shape to sustain their level of spending as the massive injections of money and credit through both monetary and fiscal stimulus have changed household balance sheets dramatically.”
Essentially, as Joseph Wang, who was a trader at the Fed, puts it, “[b]onds are not acting as a hedge and appear to be becoming less ‘money’ like due persistent declines in price and elevated rate vol.”
“Investors in both bonds and stocks are reaching for cash by selling their assets, driving further asset price declines. For non-bank investors, ‘cash’ means bank deposits.”
Ultimately, an increase in the RRP (reverse repo) and QT (which is a direct flow of capital to capital markets) “would drain the pool of bank deposits by ~$1t by year-end,” and this may prompt investors to “continue to lower their selling prices to compete for the cash they want.”
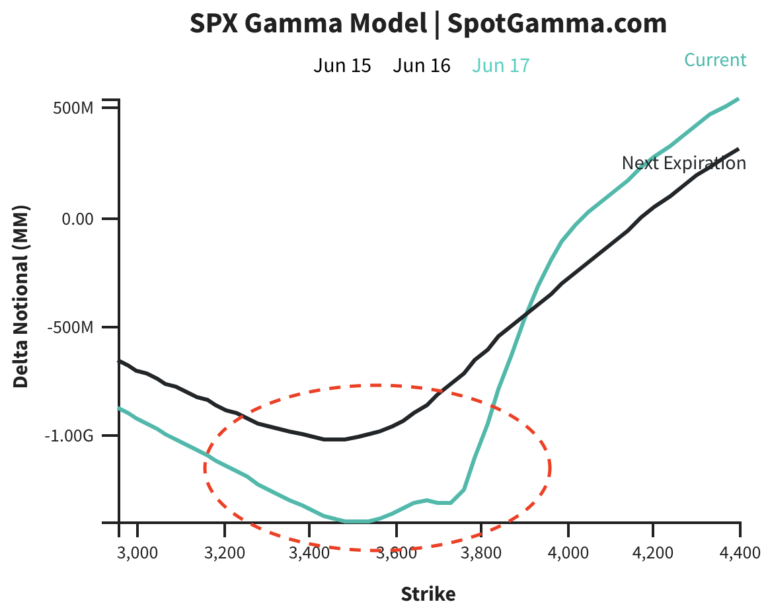
Positioning: Detailed was Friday, June 17’s commentary that honed in on some of the implications of pre- and post-Federal Reserve meeting positioning.
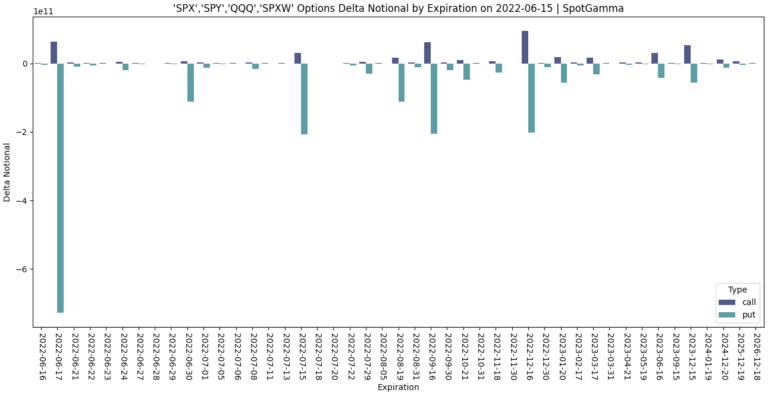
Essentially, with the June monthly options expiration (OPEX), there was a roll-off of a large amount of customer negative delta exposure (via put options they owned).
Graphic: Via SpotGamma’s S&P 500 Index (INDEX: SPX) Gamma Model. Updated June 17, 2022.
With expiration, liquidity providers (who were short these put options, as well as underlying to hedge) re-hedged (bought back some of their static short-delta), and this removes pressure.
“The SPX index quarterly option notional is higher than usual, but the market is below the concentration of risk given the recent selloff,” said Tanvir Sandhu, chief global derivatives strategist at Bloomberg Intelligence, who we quoted last week.
“Price action will reflect the economic context, but flows from expiring in-the-money hedges may support the market.”
Accordingly, markets are off their lows. However, in the above text, we made little mention of participants’ rolling forward of their options bets to lower strikes, further out in time, as well as the impact of customers still maintaining a “sizable short put position,” a dynamic we’ve talked about before.
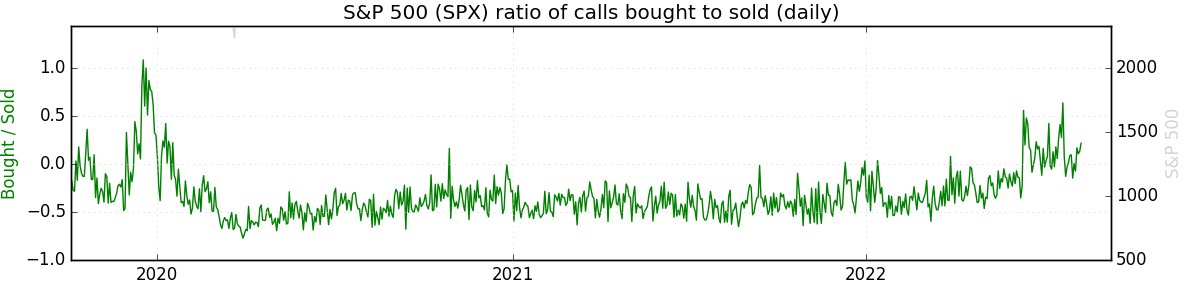
Graphic: Via SpotGamma. “Options flow, last week, was unsurprisingly dominated by index puts (red lines). Most interesting was index puts bought to cover (third chart) indicating there was a fairly sizable short put position heading into last week.”
Taken together, coupled with what SpotGamma observes is “anemic” call buying (viewed as the blue line in the top chart above), participants are hedged and volatility remains well-supplied.
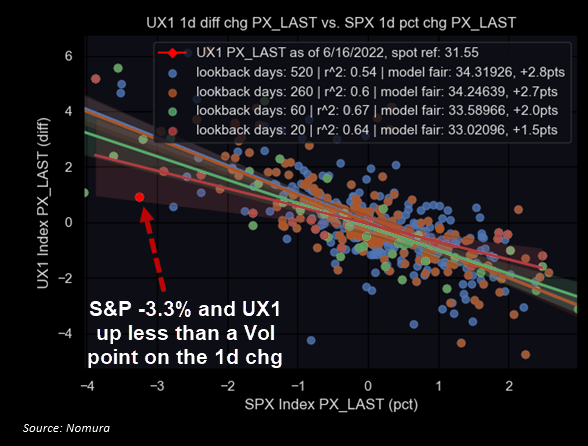
Graphic: Via Nomura Holdings Inc (NYSE: NMR). Taken from The Market Ear. “The ‘muted’ VIX narrative goes on. The VIX vs SPX gap remains rather wide here. The second chart shows just how ‘depressed’ VIX remains vs the underlying px action. Most people have been stopped out/de-grossed risk, so there isn’t much demand to hedge exposure.”
Despite being stretched from a technical perspective, positioning-wise, lower prices are sticky and the context for a far-reaching bounce, all else equal, is not there.
We shall provide updates to this, later in the week. Read the Daily Brief for June 17, 2022, for more on how to position in light of the above information.
Technical: As of 6:30 AM ET, Tuesday’s regular session (9:30 AM – 4:00 PM ET), in the S&P 500, will likely open in the upper part of a positively skewed overnight inventory, outside of prior-range and -value, suggesting a potential for immediate directional opportunity.
In the best case, the S&P 500 trades higher; activity above the $3,735.75 HVNode puts in play the $3,749.00 ONH. Initiative trade beyond the ONH could reach as high as the $3,773.25 HVNode and $3,821.50 LVNode, or higher.
In the worst case, the S&P 500 trades lower; activity below the $3,735.75 HVNode puts in play the $3,722.50 LVNode. Initiative trade beyond the $3,722.50 LVNode could reach as low as the $3,690.25 HVNode and $3,639.00 RTH Low, or lower.
Click here to load today’s key levels into the web-based TradingView charting platform. Note that all levels are derived using the 65-minute timeframe. New links are produced, daily.
Graphic: 65-minute profile chart of the Micro E-mini S&P 500 Futures.
Definitions
Volume Areas: Should the market trend for long periods of time, it will lack sound structure, identified as low volume areas (LVNodes). LVNodes denote directional conviction and ought to offer support on any test.
If participants were to auction and find acceptance into areas of prior low volume (LVNodes), then future discovery ought to be volatile and quick as participants look to HVNodes for favorable entry or exit.
Overnight Rally Highs (Lows): Typically, there is a low historical probability associated with overnight rally-highs (lows) ending the upside (downside) discovery process.
About
After years of self-education, strategy development, mentorship, and trial-and-error, Renato Leonard Capelj began trading full-time and founded Physik Invest to detail his methods, research, and performance in the markets.
Capelj also develops insights around impactful options market dynamics at SpotGamma and is a Benzinga reporter.
In no way should the materials herein be construed as advice. Derivatives carry a substantial risk of loss. All content is for informational purposes only.
The daily brief is a free glimpse into the prevailing fundamental and technical drivers of U.S. equity market products. Join the 300+ that read this report daily, below!
Update: Technicals section now reflects the proper overnight inventory stat.
After a week-long or so de-rate to reflect the impact of higher inflation and harsher monetary policies, equity index futures are trading in a responsive fashion.
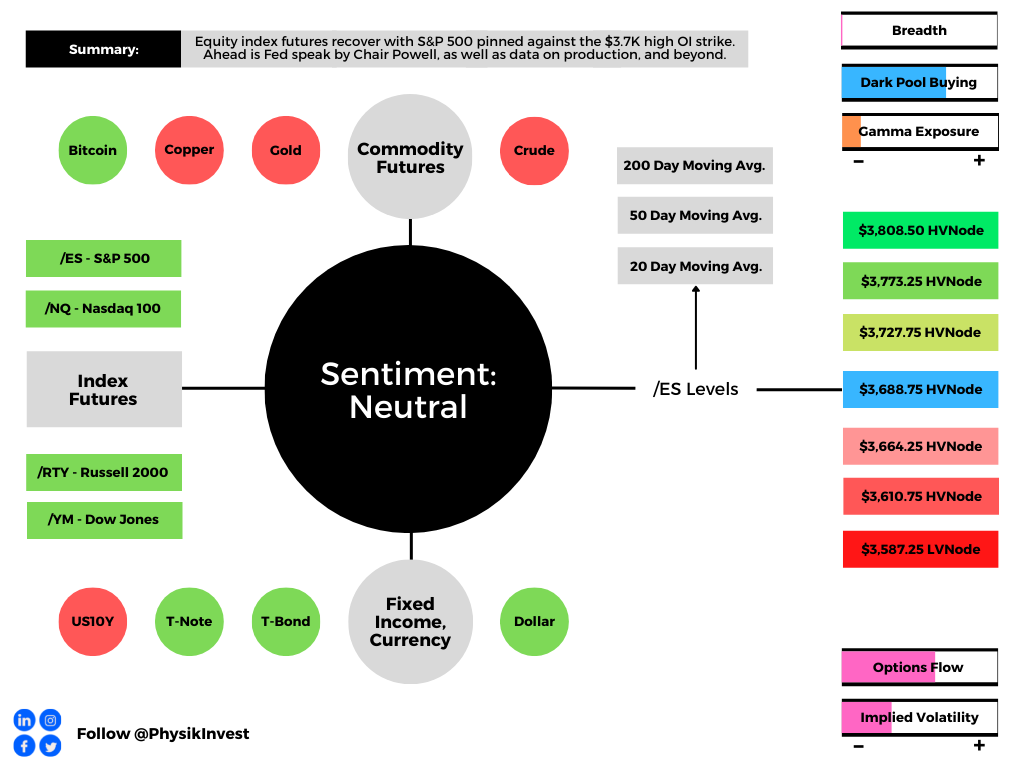
The S&P 500, in particular, lies pinned against the $3,700.00 high options open interest strike. The large June monthly options expiration has implications on the expansion of the range, as noted in prior letters.
The newsflow remains depressing. Taken alone, you’d think the Federal Reserve (Fed) would be “soft[ly] landing” us into a depression, just in time for WWIII to help us get out of it.
Kidding. The utmost sympathy for those negatively affected by war and economic hardship.
The distinction between the economy and the market is blurred and the drop is the recession. The equity markets are a mechanism pricing the implications of all the points we talk about, in real-time, months (6-12) in advance.
Given that, there are better measures to assess whether a de-rate has played out, fully. In the last session, information, generated by the market – internals, volatility measures, and the like – suggested to us that more selling was in store, all the while there was a definite change in tone in the non-linear strength of volatility and skew with respect to linear changes in price of assets.
Should you care for the narratives in news, then here it is:
The Bank of England (BOE) pointed to the potential for a more aggressive rate hike schedule if data were to reflect a wage spiral. The Swiss National Bank (SNB) upped rates an unexpected 50 basis points. The White House weighed fuel-export limits. Both residential permitting and housing starts plummeted with the 30-year fixed-rate breaching 6.00%.
Adding, U.S. junk bond spreads topped 500 basis points for the first time since 2020, and China, also, launched its third most modern aircraft carrier.
Ahead, Fed Chair Jerome Powell speaks at 8:45 AM ET. Then updates on industrial production and capacity utilization (9:15 AM ET), as well as leading economic indicators (10:00 AM ET).
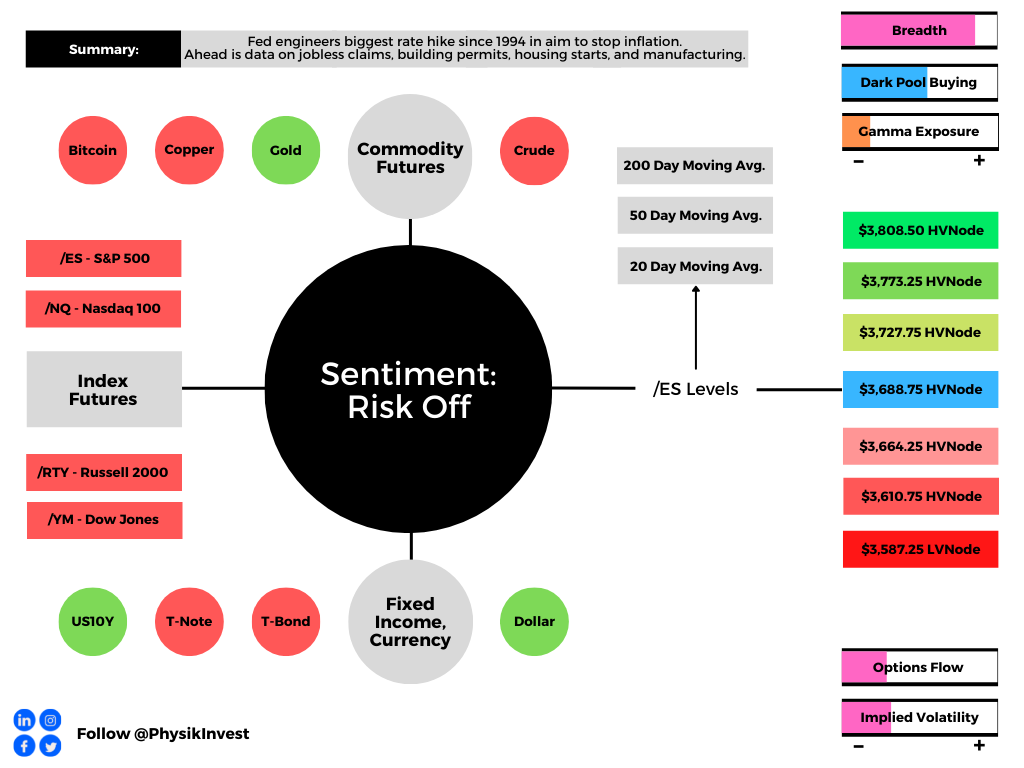
Graphic updated 6:30 AM ET. Sentiment Neutral if expected /ES open is inside of the prior day’s range. /ES levels are derived from the profile graphic at the bottom of the following section. Levels may have changed since initially quoted; click here for the latest levels. SqueezeMetrics Dark Pool Index (DIX) and Gamma (GEX) calculations are based on where the prior day’s reading falls with respect to the MAX and MIN of all occurrences available. A higher DIX is bullish. At the same time, the lower the GEX, the more (expected) volatility. Learn the implications of volatility, direction, and moneyness. SHIFT data used for S&P 500 (INDEX: SPX) options activity. Note that options flow is sorted by the call premium spent; if more positive, then more was spent on call options. Breadth reflects a reading of the prior day’s NYSE Advance/Decline indicator. VIX reflects a current reading of the CBOE Volatility Index (INDEX: VIX) from 0-100.
What To Expect
Team. We’re going to have to keep it a bit shorter, today, and leave out the fundamentals section. Sorry!
In a nutshell, and this is borrowing from a past post-Federal Open Market Committee (FOMC) event letter, as well put forth by Kai Volatility’s Cem Karsan, on a Fed day, “the first move tends to be structural. A function of the inevitable rebalancing of dealer inventory post-event.”
Graphic: Via SpotGamma’s Hedging Impact of Real-Time Options (HIRO) indicator alluded to counterparty buyback of static short delta hedges to positive delta options exposures.
“The second move and final resolution, if you wait for it, is usually tied to the incremental effects on liquidity (QE/QT).”
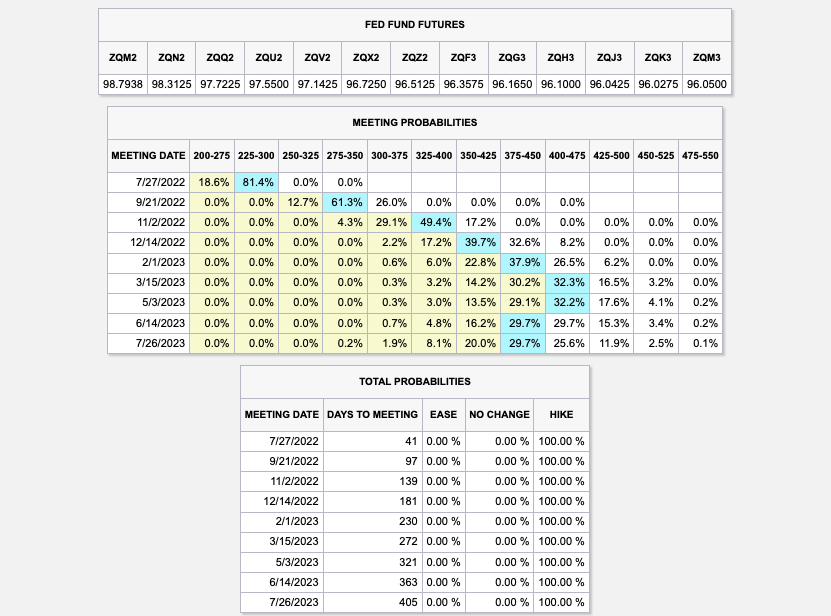
Essentially, the baseline bear trend held because, essentially, the Fed is, indeed, expected to continue raising rates and withdrawing liquidity. This will prompt a continued de-rate with QT being “a direct flow of capital to capital markets.”
Graphic: Via Charles Schwab Corporation-owned (NYSE: SCHW) TD Ameritrade’s Thinkorswim. The Eurodollar (FUTURE: /GE) futures curve is a reflection of participants’ outlook on interest rates. The peak of the Fed-rate-hike cycle – terminal rate – is around March 2023.
Great, moving on. What’s next?
Essentially, with the June monthly options expiration (OPEX), expected is a roll-off of a large amount of customer negative delta exposure (via put options they own). Taken in a vacuum, with expiration, liquidity providers (who are short put options and short underlying to hedge) will re-hedge (buyback static short-delta, among other things), and this is taken as bullish.
Graphic: Via SpotGamma. “While many of these put positions could be paired off with other offsetting positions (i.e. netting out some of this delta), we remain of the opinion that a lot of these put positions are investor short hedges which will be rolled out and down on OPEX. This means that large ITM puts will be exchanged for OTM puts, which creates a short delta hedge imbalance for dealers (i.e. they need to cover short futures). This is what may drive the OPEX-related rally.
However, this is definitely discounting the impact on delta from participants rolling forward their bets on direction.
Graphic: Via Shift Search. Participants, mainly sell to close their short-dated bets on the downside while buying to open those that are further out in time and lower in price.
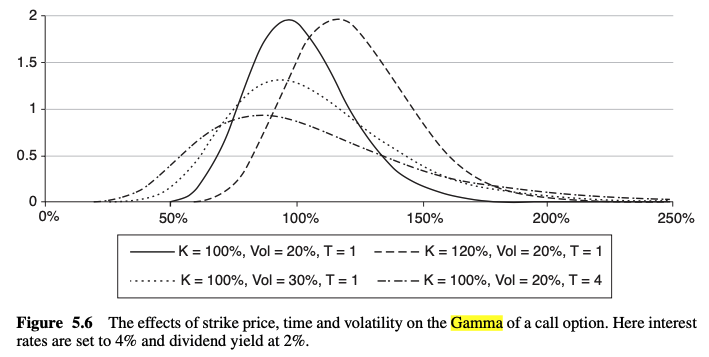
As talked about yesterday, we were to gauge the delta impact by how far below the high open interest strikes the equity indexes were to travel. As stated, these options, have little time to expiry and, thus, their gamma (the sensitivity of the option to change indirection) grows rather large, at near-the-money strikes.
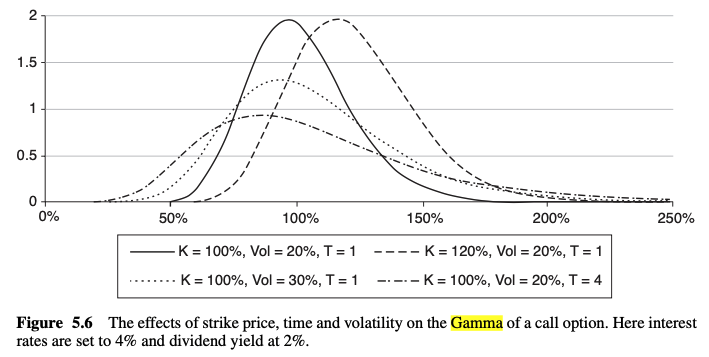
Graphic: Text taken from Exotic Options and Hybrids: A Guide to Structuring, Pricing and Trading.
As the time to expiry narrows, above the strike in question delta decays, and counterparts buy back their static delta hedges.
As the time to expiry narrows, below the strike in question delta expands and counterparts sell more static delta to hedge.
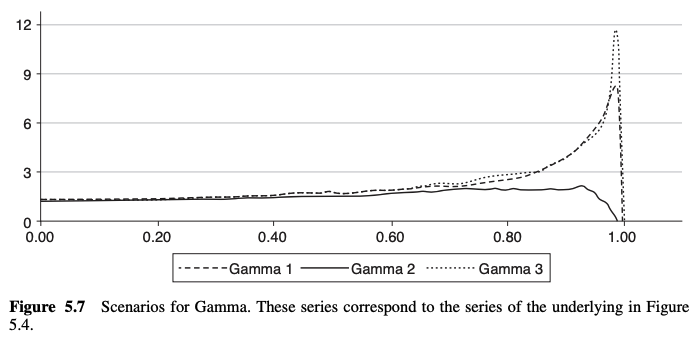
Graphic: Text taken from Exotic Options and Hybrids: A Guide to Structuring, Pricing and Trading.
This means that if far below these high-interest strikes, associated hedging, less any new reach for protection would keep markets pressured. If above, hedging, less new sales of protection, would bolster markets higher.
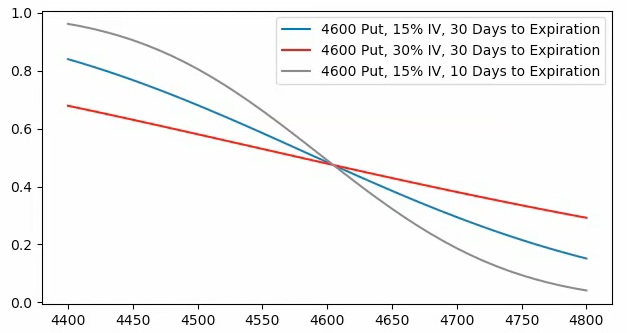
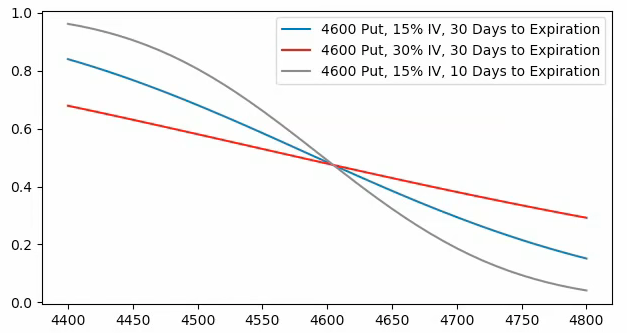
Graphic: Via SpotGamma. “SPX prices X-axis. Option delta Y-axis. When the factors of implied volatility and time change, hedging ratios change. For instance, if SPX is at $4,700.00 and IV jumps 15% (all else equal), the dealer may sell an additional 0.2 deltas to hedge their exposure to the addition of a positive 0.2 delta. The graphic is for illustrational purposes, only.”
Ultimately, if lower, all else equal, the June 17 OPEX will coincide with the removal of the in-the-money options exposures in question. Negating the rollover of exposures and leaving the door open to some delta imbalance (need to buy to re-hedge exposure) suggests that after this expiration, markets may have less pressure to rally against.
“The SPX index quarterly option notional is higher than usual, but the market is below the concentration of risk given the recent selloff,” Tanvir Sandhu, chief global derivatives strategist at Bloomberg Intelligence, wrote in a note. “Price action will reflect the economic context, but flows from expiring in-the-money hedges may support the market.”
What do you do with this information?
Well, recall that we’ve talked ad nauseam about the supply and demand of volatility, as well as how that impacted the volatility realized (RVOL) and implied (IVOL) by the market.
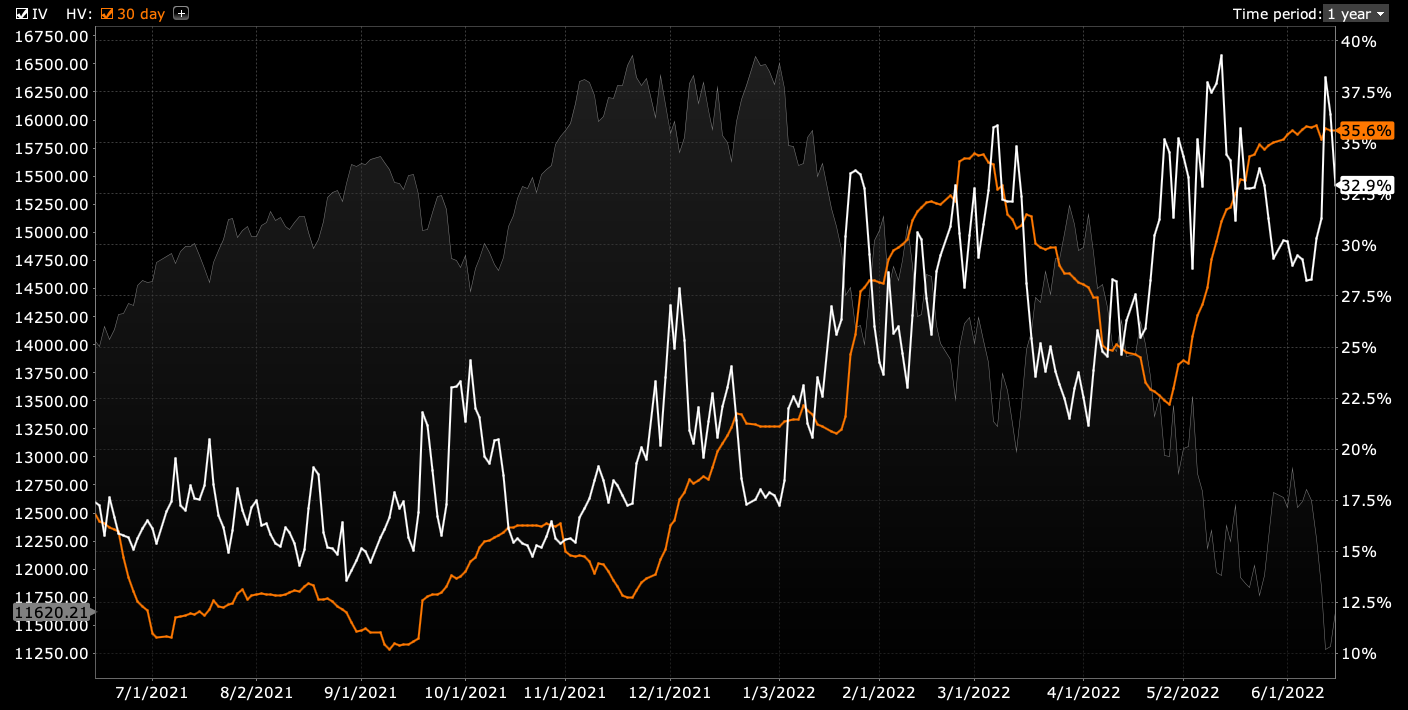
Graphic: Taken by Physik Invest from Interactive Brokers Group Inc (NASDAQ: IBKR). The divergence in volatility implied (IVOL) by participants’ options activity, versus that which the market realizes (RVOL) resurfaced on June 15, 2022, in the Nasdaq 100 (INDEX: NDX).
Essentially there was an “absolute slamming” (i.e., sale of options), particularly in shorter-dated tenors and this played into the generally poor performance in skew, hence our comments on the benefit to buying into implied skew convexity should volatility reprice.
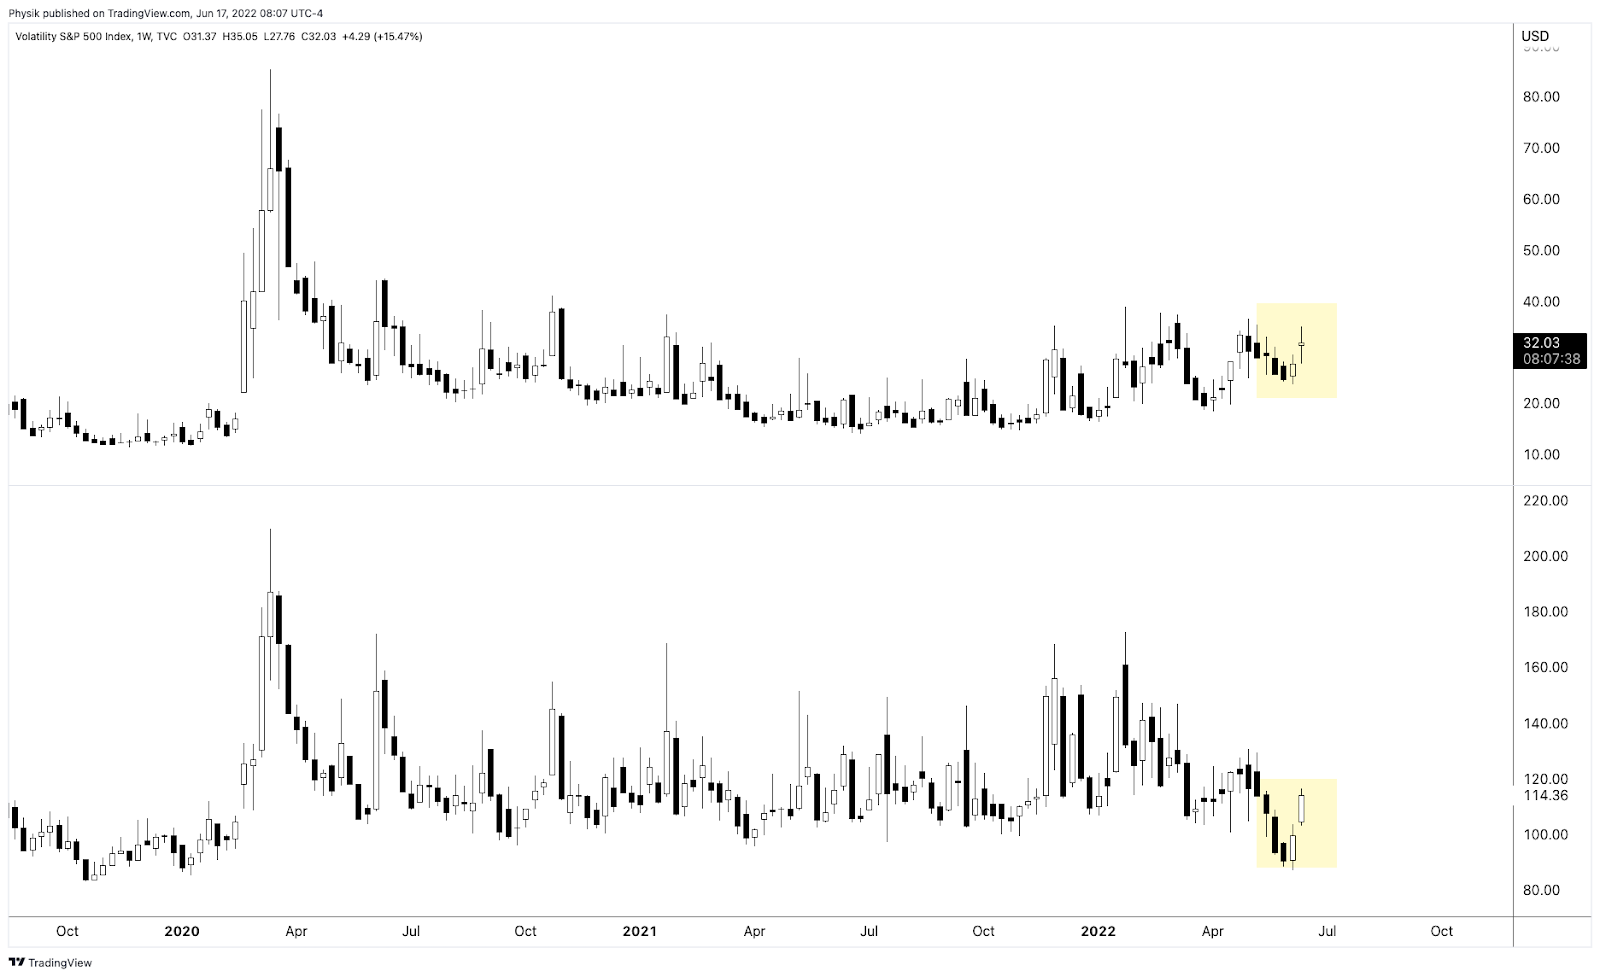
Graphic: Via TradingView. Taken by Physik Invest. The Cboe VVIX Index (INDEX: VVIX), the expected volatility of the 30-day forward price of the VIX, or the volatility of volatility (a naive but useful measure of skew), was very depressed, too, in comparison to the VIX, itself.
Basically, participants are hedged and volatility remains well-supplied.
To hedge or capitalize on a potential reach for protection, amid forced selling or demand for protection by a greater share of the market in ways not recently seen, then the repricing in those structures would be a boon to those that own them.
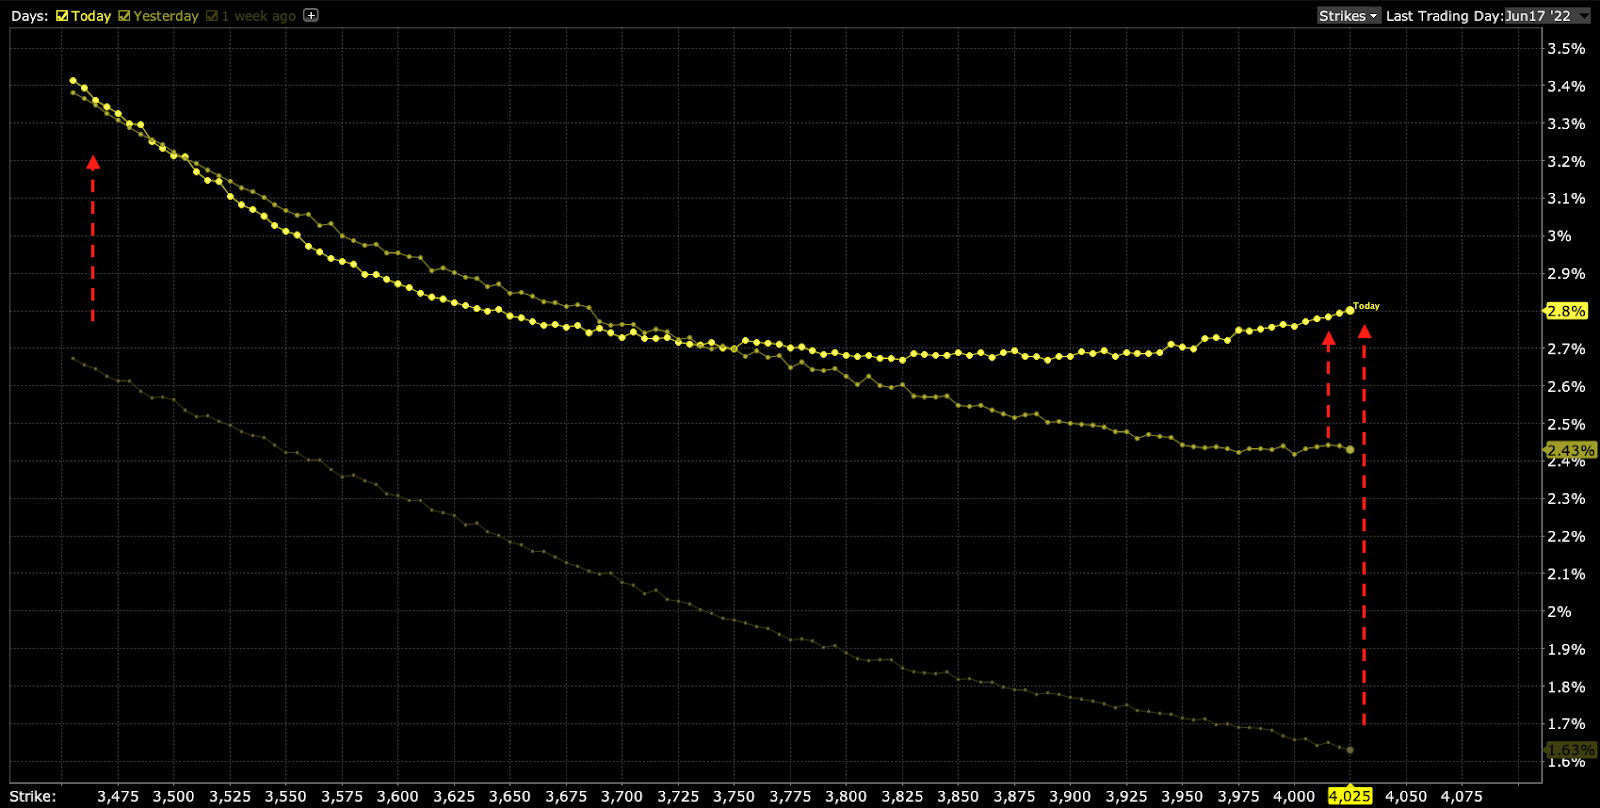
Graphic: Taken by Physik Invest from Interactive Brokers Group Inc (NASDAQ: IBKR).
To quote Benn Eifert of QVR Advisors: “Skew goes up if vol outperforms the skew curve a lot on a selloff.”
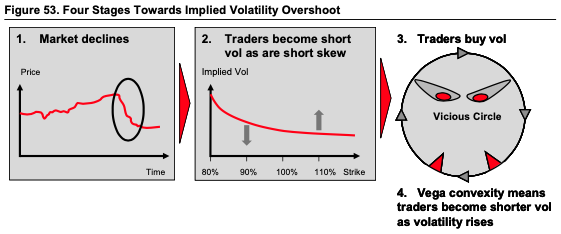
Graphic: Via Banco Santander SA (NYSE: SAN) research.
And, as touched on in this morning’s introduction, there was a definite change in tone in the non-linear strength of volatility and skew with respect to linear changes in the price of assets.
Personally, I, along with a partner who I trade closely with, saw increases in the prices of ratio structures (long or short one option near-the-money, short or long two or more further out-of-the-money) by hundreds of percent for only a few basis points of change in the indexes.
As Karsan explained online, there was “a spike in short-dated -sticky skew, [the] first we’ve seen since [the] secular decline began and it hints [at] a potentially critical change in dealer positioning [and] the distribution of underlying outcomes.”
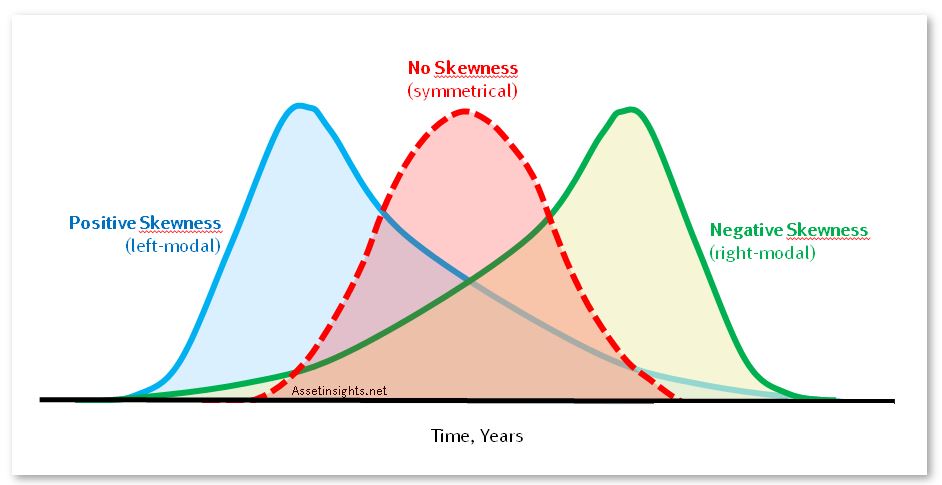
“We’re transitioning to a fat left tail, right-based distribution.”
Graphic: Via English Stack Exchange. Visualizing the transition to a fat left tail and right-based distribution that is skewed negative (i.e., the green distribution).
So why does any of this matter?
This is a validation of our perspectives on how one should position, given what the supply and demand of volatility looked like prior.
Options have a “non-zero second-order price sensitivity (or convexity) to a change in volatility,” as Mohamed Bouzoubaa et al explain well in the book Exotic Options and Hybrids.
“ATM vanillas are [not] convex in the underlying’s price, … but OTM vanillas do have vega convexity … [so], when the holder of an option is long vega convexity, we say she is long vol-of-vol.”
In other words, by owning that protection, you are positioned to monetize on a continued non-linear repricing of volatility. However, doing this in a manner that cuts decay (when nothing happens) is the difficult part.
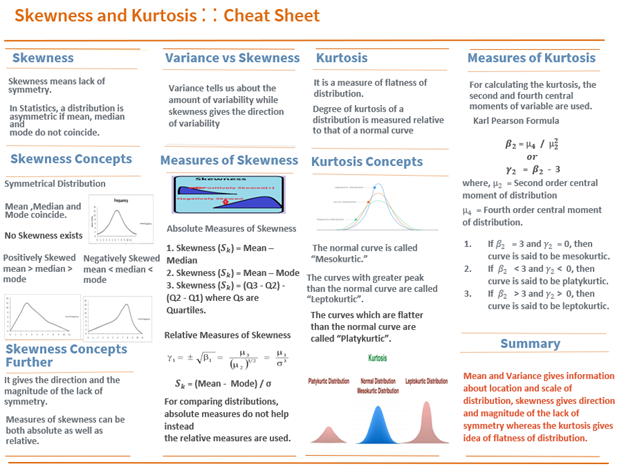
Graphic: Sourced via Towards AI. Skewness and kurtosis cheat sheet.
Technical: As of 6:30 AM ET, Friday’s regular session (9:30 AM – 4:00 PM ET), in the S&P 500, will likely open in the lower part of a positively skewed overnight inventory, inside of prior-range and -value, suggesting a potential for immediate directional opportunity.
In the best case, the S&P 500 trades higher; activity above the $3,688.75 HVNode puts in play the $3,727.75 HVNode. Initiative trade beyond the $3,727.75 HVNode could reach as high as the $3,773.25 HVNode and $3,808.50 HVNode, or higher.
In the worst case, the S&P 500 trades lower; activity below the $3,688.75 HVNode puts in play the $3,664.25 HVNode. Initiative trade beyond the $3,664.25 HVNode could reach as low as the $3,610.75 HVNode and $3,587.25 LVNode, or lower.
Click here to load today’s key levels into the web-based TradingView charting platform. Note that all levels are derived using the 65-minute timeframe. New links are produced, daily.
Graphic: 65-minute profile chart of the Micro E-mini S&P 500 Futures.
Definitions
Should the market trend for long periods of time, it will lack sound structure, identified as low volume areas (LVNodes). LVNodes denote directional conviction and ought to offer support on any test.
If participants were to auction and find acceptance into areas of prior low volume (LVNodes), then future discovery ought to be volatile and quick as participants look to HVNodes for favorable entry or exit.
About
After years of self-education, strategy development, mentorship, and trial-and-error, Renato Leonard Capelj began trading full-time and founded Physik Invest to detail his methods, research, and performance in the markets.
Capelj also develops insights around impactful options market dynamics at SpotGamma and is a Benzinga reporter.
In no way should the materials herein be construed as advice. Derivatives carry a substantial risk of loss. All content is for informational purposes only.
The daily brief is a free glimpse into the prevailing fundamental and technical drivers of U.S. equity market products. Join the 300+ that read this report daily, below!
Overnight, equity index futures took back the post-Federal Open Market Committee (FOMC) bump. Bonds and most commodity products (less gold) followed suit.
The Federal Reserve (Fed) admitted to run-away prices and committed to slaying inflation via tougher action. Accordingly, the central bank upped interest rates by 75 basis points. This was the largest increase since 1994 and, as the Fed commented, another 75 basis point hike may be in store at the next meeting in July.
In other news, the Celsius Network (CRYPTO: CEL), a crypto favorite that amassed in excess of $20 billion in assets, froze withdrawals to stop what some say was a potential bank run. Private equity is facing a so-called “crisis of value” given over inflated prices in that market.
We shall unpack the latter, below, a bit.
Also, U.S. retail sales posted their first drop in five months, the Bank of England raised its rates along with the Swiss central bank which surprised with its first hike since 2007.
This is all the while Goldman Sachs Group Inc’s (NYSE: GS) buyback desk was flooded with volumes about 3 times last year’s daily average. This could be construed as companies viewing the latest selloff as an “opportunity to repurchase shares rather than retrenching.”
Ahead is data on jobless claims, building permits, housing starts, as well as the Philadelphia Fed’s manufacturing index (8:30 AM ET).
Graphic updated 6:30 AM ET. Sentiment Risk-Off if expected /ES open is below the prior day’s range. /ES levels are derived from the profile graphic at the bottom of the following section. Levels may have changed since initially quoted; click here for the latest levels. SqueezeMetrics Dark Pool Index (DIX) and Gamma (GEX) calculations are based on where the prior day’s reading falls with respect to the MAX and MIN of all occurrences available. A higher DIX is bullish. At the same time, the lower the GEX, the more (expected) volatility. Learn the implications of volatility, direction, and moneyness. SHIFT data used for S&P 500 (INDEX: SPX) options activity. Note that options flow is sorted by the call premium spent; if more positive, then more was spent on call options. Breadth reflects a reading of the prior day’s NYSE Advance/Decline indicator. VIX reflects a current reading of the CBOE Volatility Index (INDEX: VIX) from 0-100.
Now, it appears the rate will surpass 3% after the FOMC affirmed its commitment “to returning inflation to its 2% objective.” Participants reacted, pricing in the potential for a rate peak in the range of 4.00-4.75% early-to-mid 2023, after which the easing cycle is to likely take place.
Graphic: Via CME Group Inc’s (NASDAQ: CME) FedWatch Tool.
The overnight rate is expected to peak near 4.23% by mid-2023. This is a given via a quick check of the Eurodollar (FUTURE: /GE) futures curve, a reflection of participants’ outlook on interest rates. The peak of the Fed-rate-hike cycle – terminal rate – is around March 2023 (previously it was June).
For context, the price of /GE reflects the interest offered on U.S. dollar-denominated deposits at banks outside of the U.S. With that, they’re “expressed numerically using 100 minus the implied 3-month U.S. dollar LIBOR interest rate,” per Investopedia. This means that at current March 2023 prices (95.775), this reflects an implied interest rate settlement rate of 4.225%.
As stated in this morning’s introduction (above), these policy adjustments are inflicting damage on some inflated areas of the market like crypto and private equity.
Recall that prevailing monetary policies made it easier to borrow and make longer-duration bets on ideas with a lot of promise in the future. Central banks, too, underwrote losses of this regime and encouraged continued growth. This had consequences on the real economy and asset prices which rose and kept deflationary pressures at bay.
Credit default swaps seem to be corroborating Jamie’s “hurricane” and Elon’s “super bad feeling” about the economy. As measured by Markit, they have nearly doubled this year, surpassing their Q4’18 highs and heading toward COVID-crisis levels, a deflationary signal.
As well put forth in our May 18, 2022 commentary, the recent market rout is a recession and the direct reflection of the unwind of carry. Capital was “misallocated” and the Fed’s move to control price stability is “completely unreasonable” as they’re not in a position to do it “without bringing down the markets,” per Kai Volatility’s Cem Karsan.
As Lyn Alden of Lyn Alden Investment Strategy put forth, “unfortunately for the Fed, the U.S. economic growth rate is already decelerating” and, to cut inflation, it must reduce demand for goods. Indeed, this is recessionary and is already reflected by slowing retail sales.
Graphic: Via Bloomberg. “As price pressures become more entrenched in the economy, spending will likely ebb either due to higher prices, higher interest rates, or both.”
As Bloomberg explains, spending has shifted and is supported by consumers spending down their savings and leveraging credit cards.
Graphic: Via Bloomberg. This “could be concerning if Americans fail to keep up on payments. That could ultimately mean a slowdown in the pace of inflation-adjusted consumption.”
“If this credit bubble ever pops, it’s going to be the most catastrophic market failure that anyone has ever read about — but let’s hope that doesn’t happen,” Mark Spitznagel, Miami-based Universa’s CIO, said in early June. “We’ve gotten ourselves into a tough spot.”
Perspectives: “The move in markets prices in more than enough recession risk, and we believe a near-term recession will ultimately be avoided thanks to consumer strength, Covid reopening/recovery, and policy stimulus in China,” JPMorgan Chase & Co’s (NYSE: JPM) Marko Kolanovic and his team said.
Positioning: Measures of implied volatility had come in, yesterday, and that was significant in that participants have a lot of exposure to put options.
Graphic: Via SpotGamma’s Hedging Impact of Real-Time Options (HIRO) indicator.
Further, (naively) we see it as liquidity providers being short those puts. As volatility continues to come in, the exposure of those options to direction (delta) compresses.
As a result, liquidity providers cut some of their negative (static) delta hedges to that positive delta put position.
Graphic: Via SpotGamma. “SPX prices X-axis. Option delta Y-axis. When the factors of implied volatility and time change, hedging ratios change. For instance, if SPX is at $4,700.00 and IV jumps 15% (all else equal), the dealer may sell an additional 0.2 deltas to hedge their exposure to the addition of a positive 0.2 delta. The graphic is for illustrational purposes, only.”
This means that the potential options expiration (OPEX) related bullishness, so to speak, was pulled forward and, now, markets, being markedly lower than they were immediately after the FOMC event, are at risk of trading into (and below) the sizeable interest down below.
Graphic: Taken by Physik Invest from Interactive Brokers Group Inc (NASDAQ: IBKR). Updated 6/15/2022.
As stated, yesterday, these options, down below, have little time to expiry and, thus, their gamma (options sensitivity to direction) grows rather large, at near-the-money strikes.
Graphic: Text taken from Exotic Options and Hybrids: A Guide to Structuring, Pricing and Trading.
As the time to expiry narrows, above the strike in question delta decays, and counterparts buy back their static delta hedges.
As the time to expiry narrows, below the strike in question delta expands and counterparts sell more static delta to hedge.
Graphic: Text taken from Exotic Options and Hybrids: A Guide to Structuring, Pricing and Trading.
This means that if below these high-interest strikes, associated hedging, less any new reach for protection would pressure markets lower. If above, hedging, less new sales of protection, would bolster markets higher.
Ultimately, if lower, all else equal, the June 17 OPEX will coincide with the removal of the in-the-money options exposures in question. This opens a window during which markets may have less pressure to rally against.
Bonus: As SpotGamma explains, “[g]iven the supply and demand of volatility, as well as divergences in the volatility that the market realizes and implies from options activity, there’s a case to be made for maintaining positive exposure to direction via long volatility.”
Graphic: Taken by Physik Invest from Interactive Brokers Group Inc (NASDAQ: IBKR). The divergence in volatility implied (IVOL) by participants’ options activity, versus that which the market realizes (RVOL) resurfaced on June 15, 2022, in the Nasdaq 100 (INDEX: NDX).
Technical: As of 6:30 AM ET, Thursday’s regular session (9:30 AM – 4:00 PM ET), in the S&P 500, will likely open in the lower part of a negatively skewed overnight inventory, outside of prior-range and -value, suggesting a potential for immediate directional opportunity.
In the best case, the S&P 500 trades higher; activity above the $3,688.75 HVNode puts in play the $3,727.75 HVNode. Initiative trade beyond the $3,727.75 HVNode could reach as high as the $3,773.25 HVNode and $3,808.50 HVNode, or higher.
In the worst case, the S&P 500 trades lower; activity below the $3,688.75 HVNode puts in play the $3,664.25 HVNode. Initiative trade beyond the $3,664.25 HVNode could reach as low as the $3,610.75 HVNode and $3,587.25 LVNode, or lower.
Click here to load today’s key levels into the web-based TradingView charting platform. Note that all levels are derived using the 65-minute timeframe. New links are produced, daily.
Graphic: 65-minute profile chart of the Micro E-mini S&P 500 Futures.
Should the market trend for long periods of time, it will lack sound structure, identified as low volume areas (LVNodes). LVNodes denote directional conviction and ought to offer support on any test.
If participants were to auction and find acceptance into areas of prior low volume (LVNodes), then future discovery ought to be volatile and quick as participants look to HVNodes for favorable entry or exit.
About
After years of self-education, strategy development, mentorship, and trial-and-error, Renato Leonard Capelj began trading full-time and founded Physik Invest to detail his methods, research, and performance in the markets.
Capelj also develops insights around impactful options market dynamics at SpotGamma and is a Benzinga reporter.
In no way should the materials herein be construed as advice. Derivatives carry a substantial risk of loss. All content is for informational purposes only.