Market Commentary
Equity index futures trade sideways to lower. Yields lead lower.
- China tension, infrastructure, COVID talk.
- Ahead are new home sales and earnings.
- S&P plays with a potential auction failure.
What Happened: U.S. stock index futures auctioned sideways to lower overnight alongside narratives surrounding a U.S. and China stalemate, progress on infrastructure, as well as the spread of COVID-19 variants.
On COVID-19, Nordea analysts conclude: “Delta is a cause for concern around the globe, but judging from the case to hospitalization ratio, it seems as if the crisis is already mostly over. Central banks will conclude the same soon, even if the initial reaction to Delta is clearly dovish.”
Moreover, ahead is data on new home sales, as well as earnings reports by Tesla Inc (NASDAQ: TSLA) and Lockheed Martin Corporation (NYSE: LMT), among other companies.
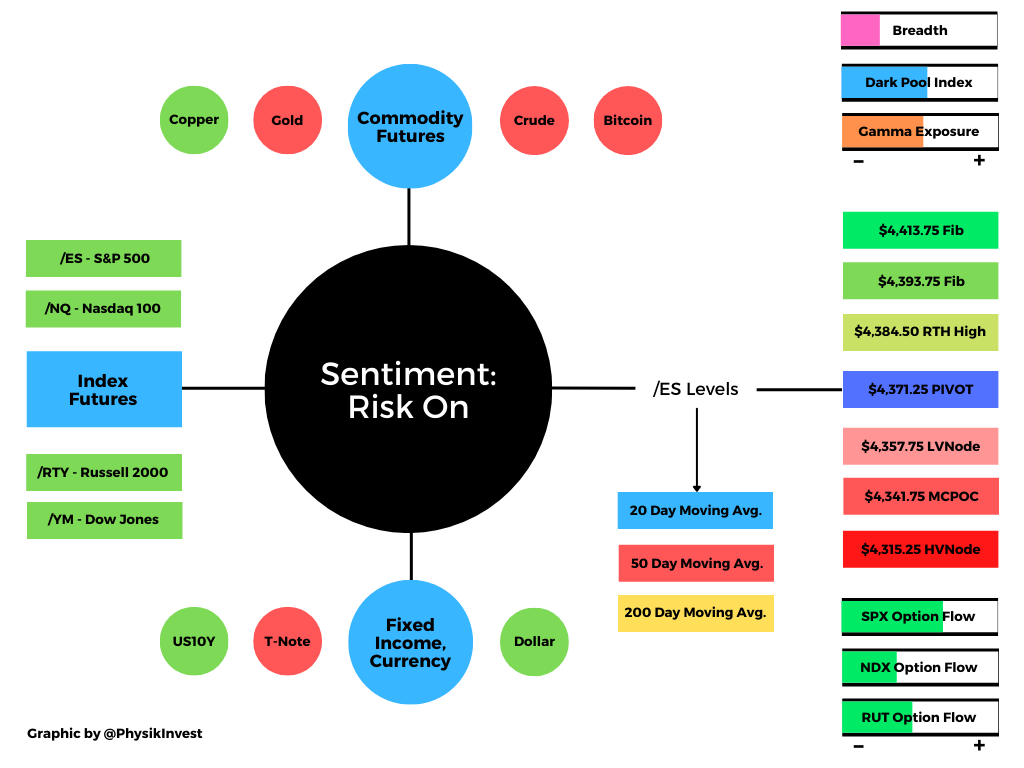
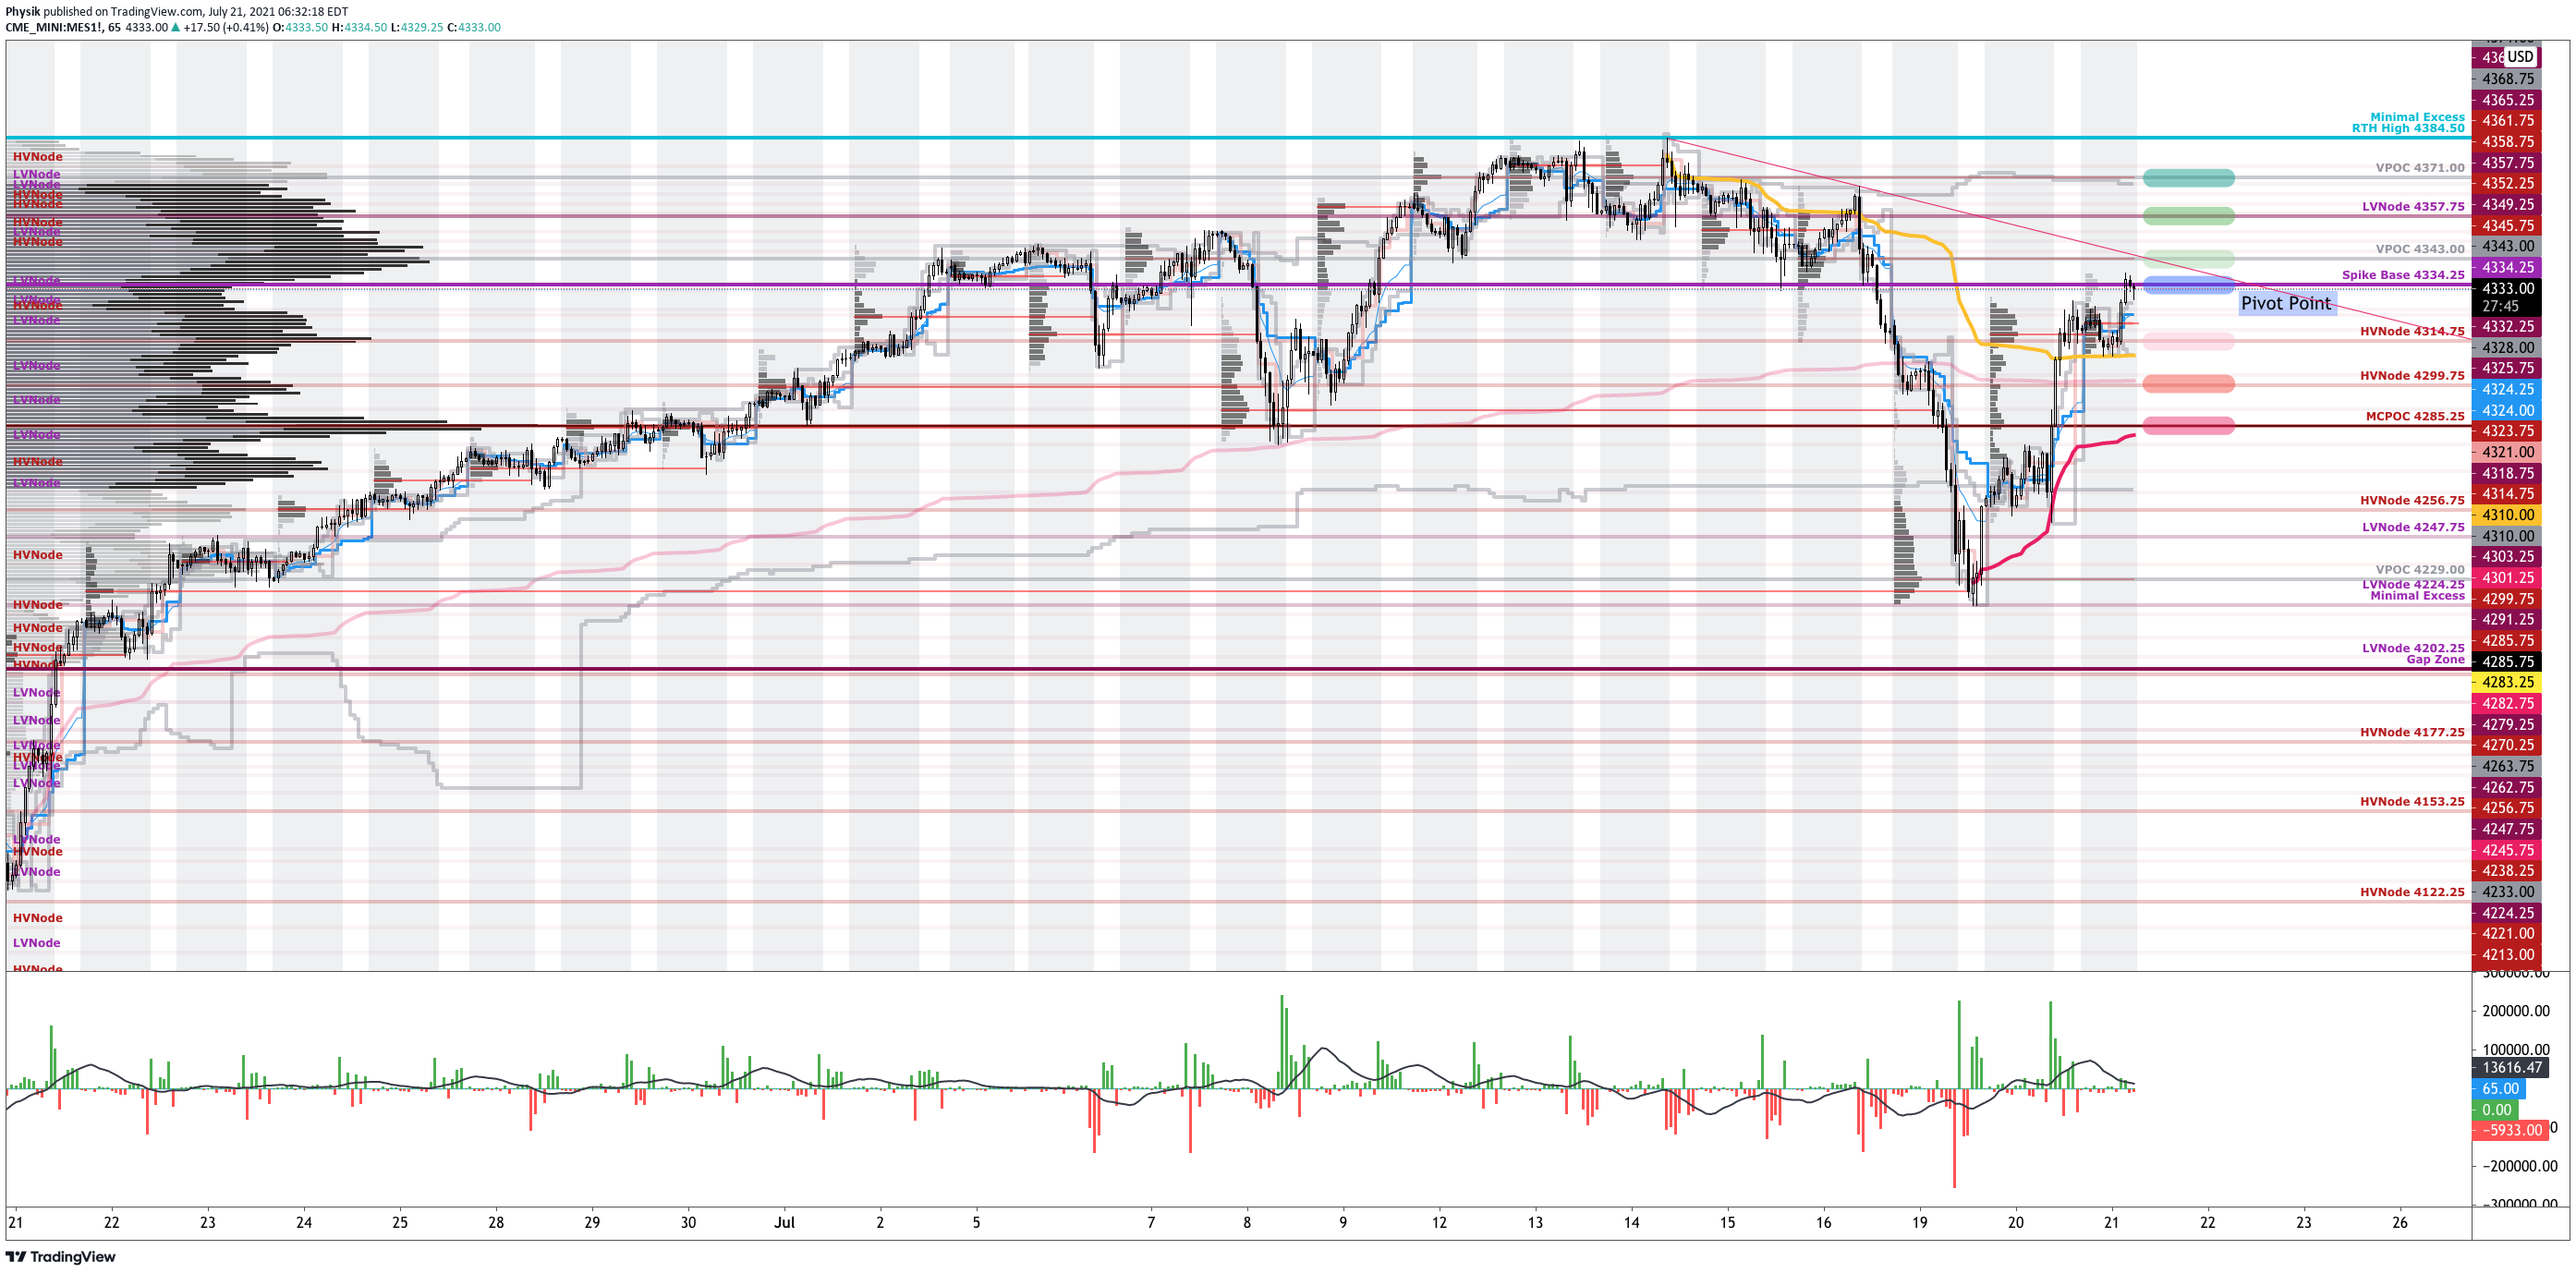
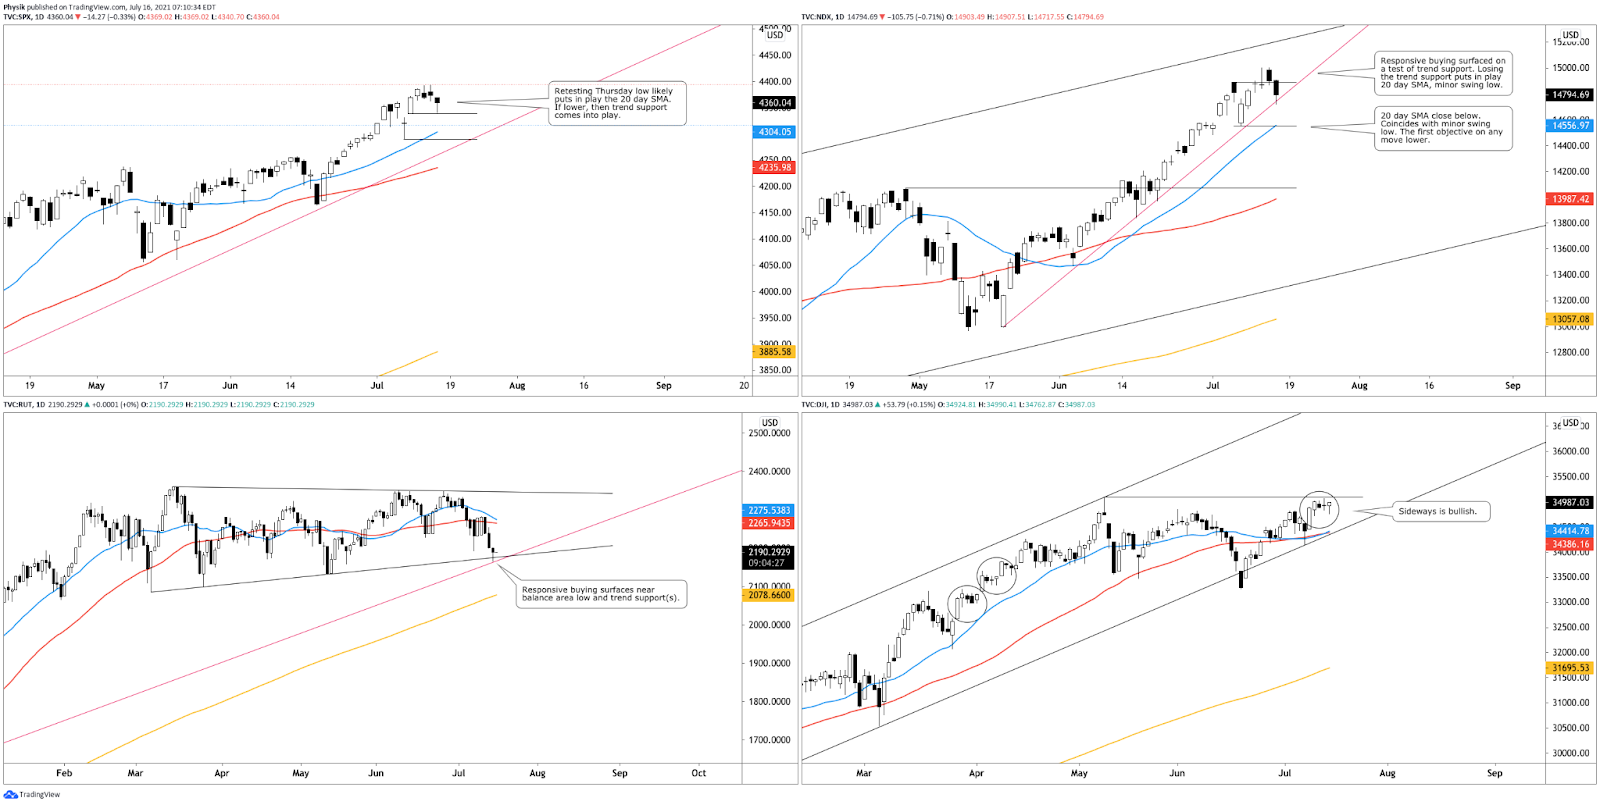
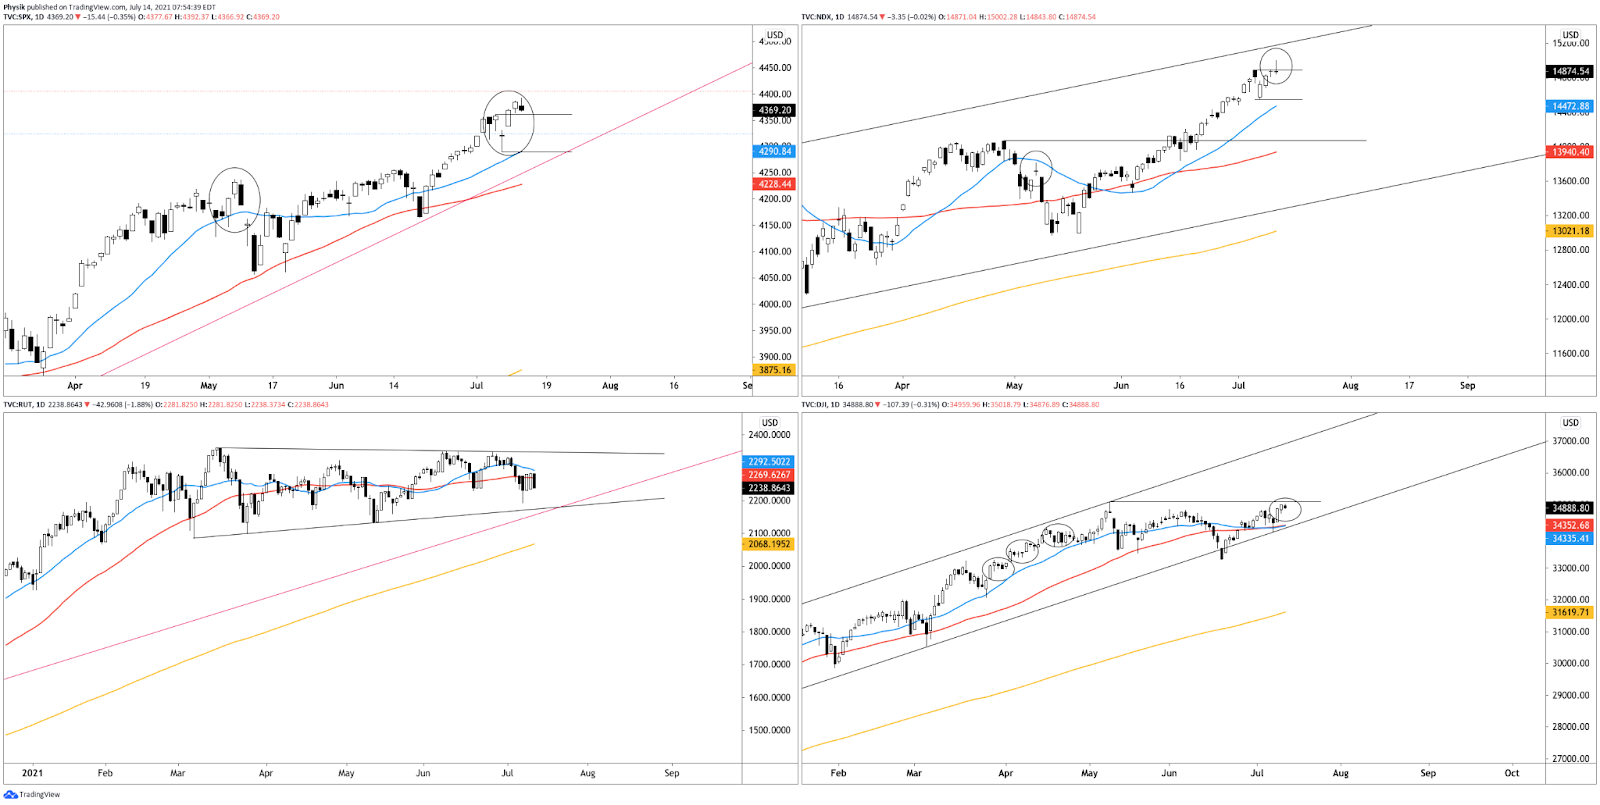
What To Expect: As of 6:40 AM ET, Monday’s regular session (9:30 AM – 4:00 PM EST) in the S&P 500 will likely open inside of prior-range and -value, suggesting a limited potential for immediate directional opportunity.
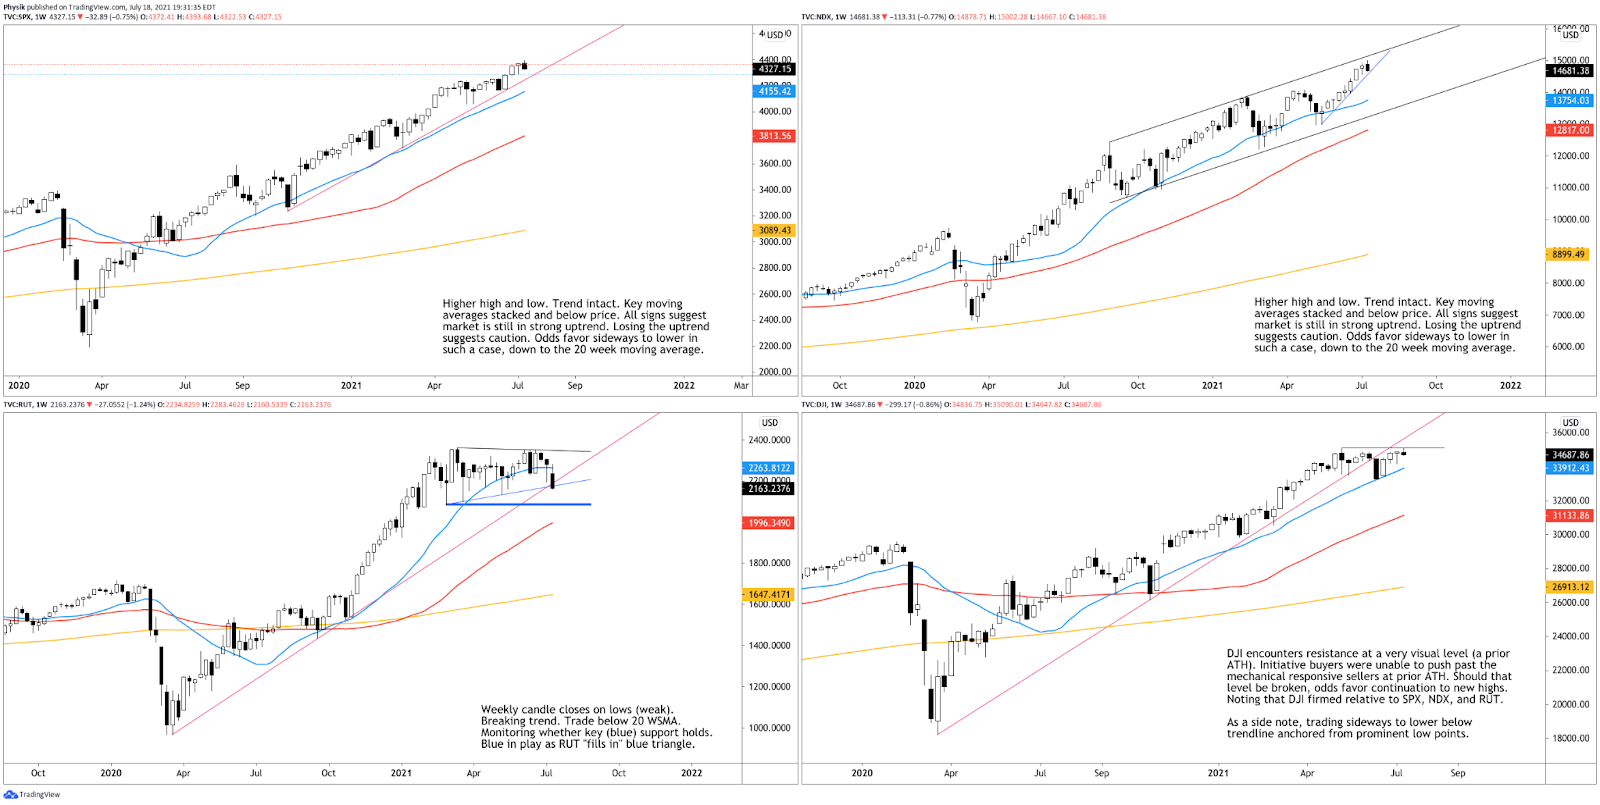
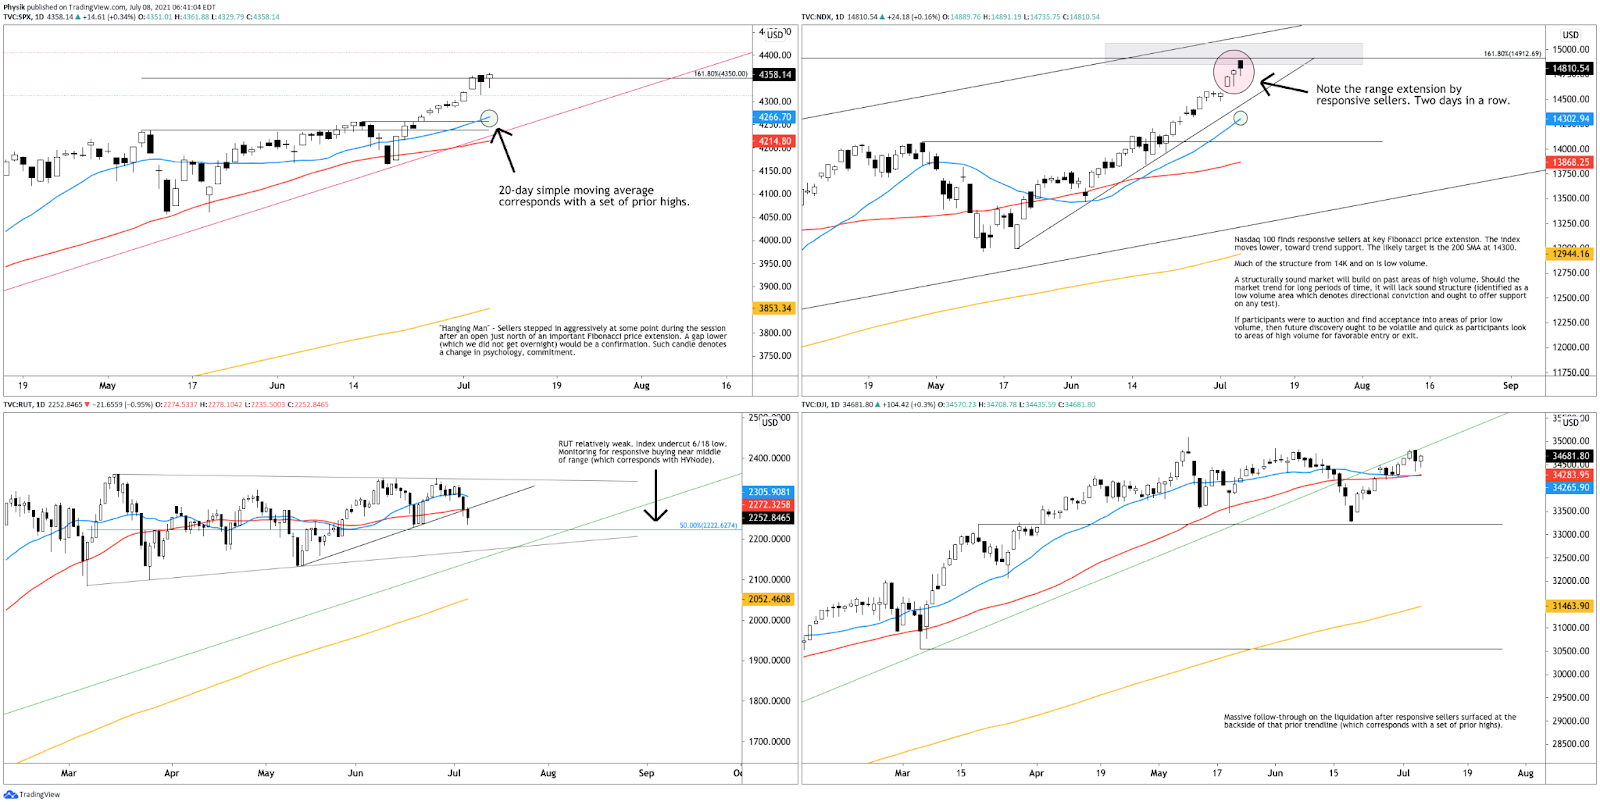
Adding, during Friday’s trade, the best case outcome occurred, evidenced by trade above $4,384.50, a prior all-time high (ATH) and balance-area high (BAH).
Balance (Two-Timeframe Or Bracket): Rotational trade in which current prices offer favorable entry and exit. Balance-areas make it easy to spot a change in the market (i.e., the transition from two-time frame trade, or balance, to one-time frame trade, or trend).
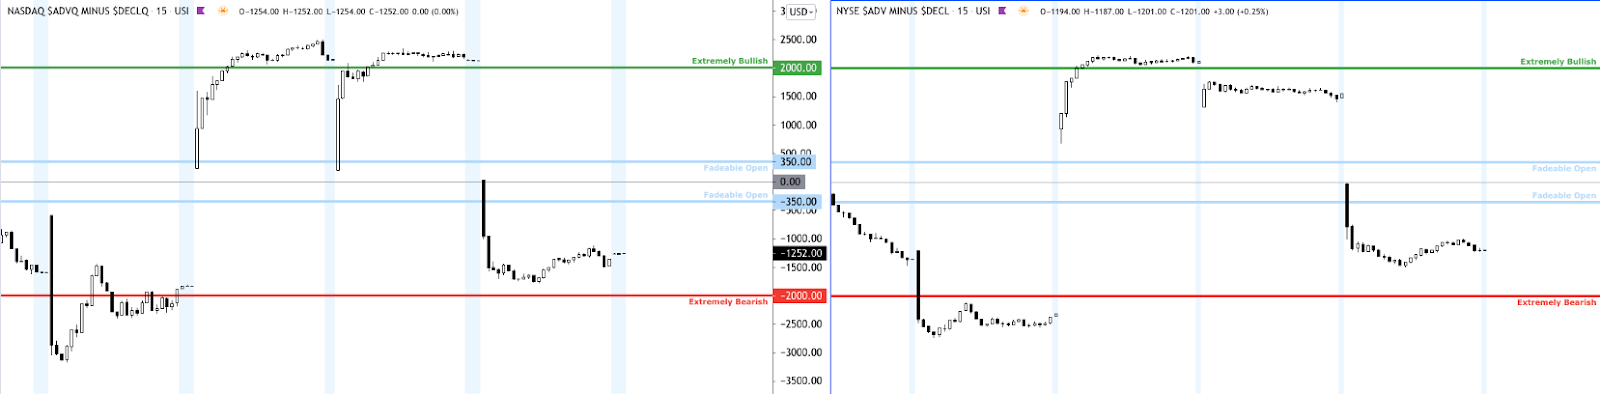
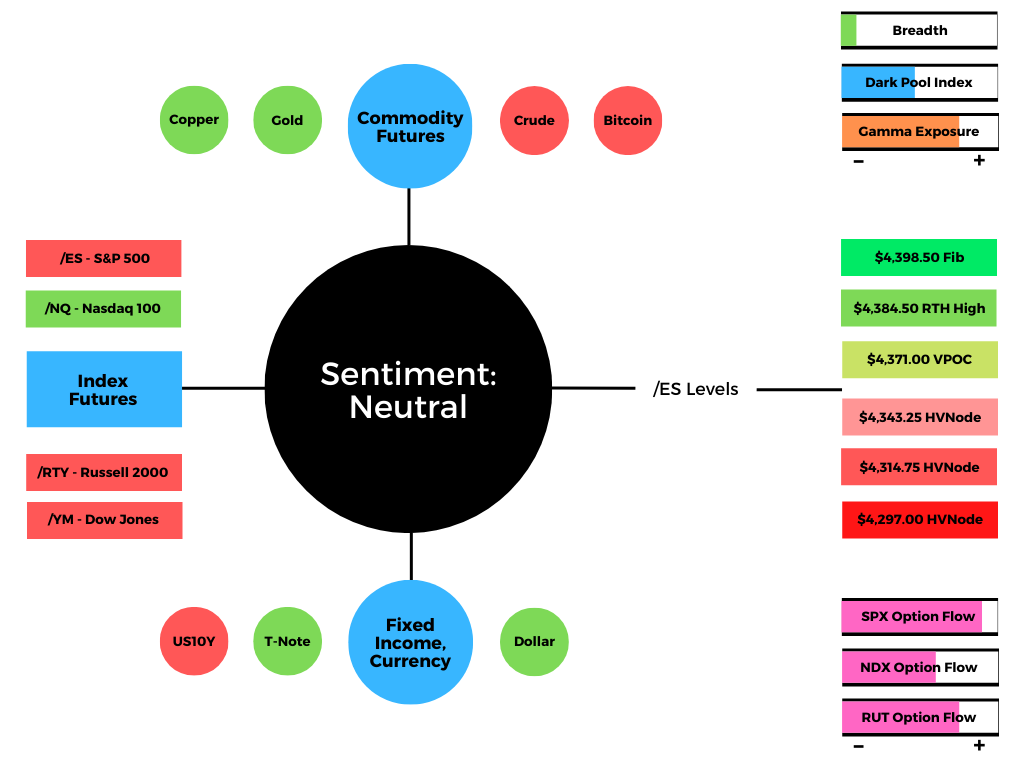
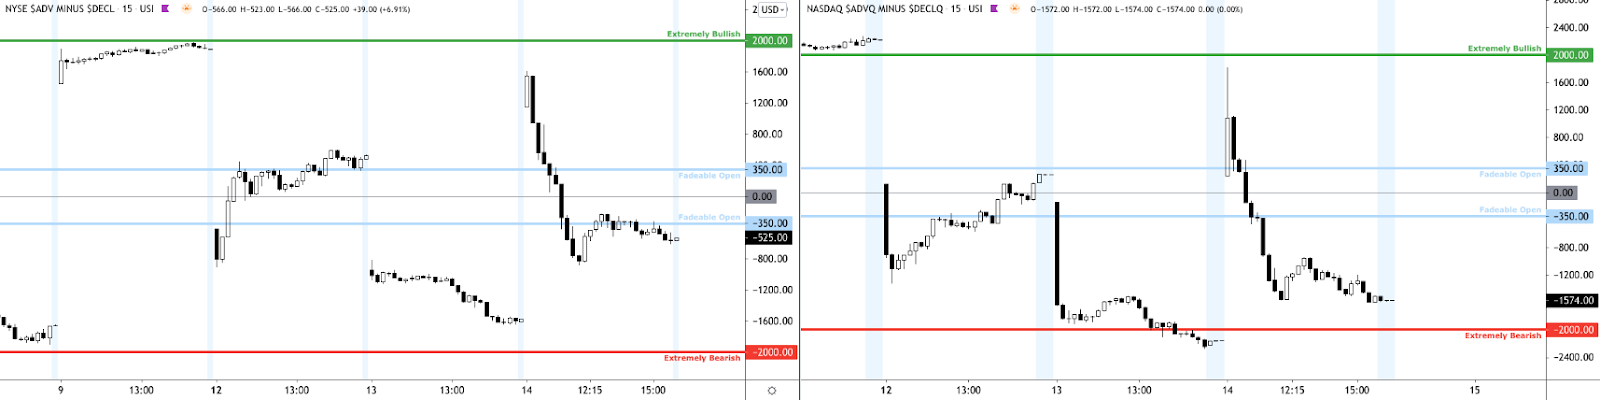
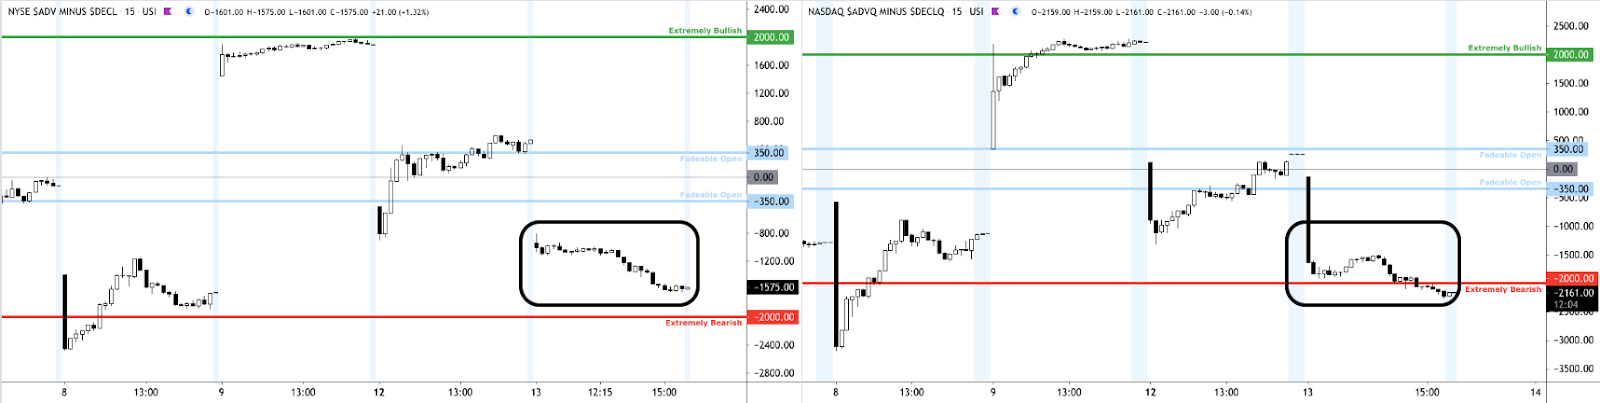
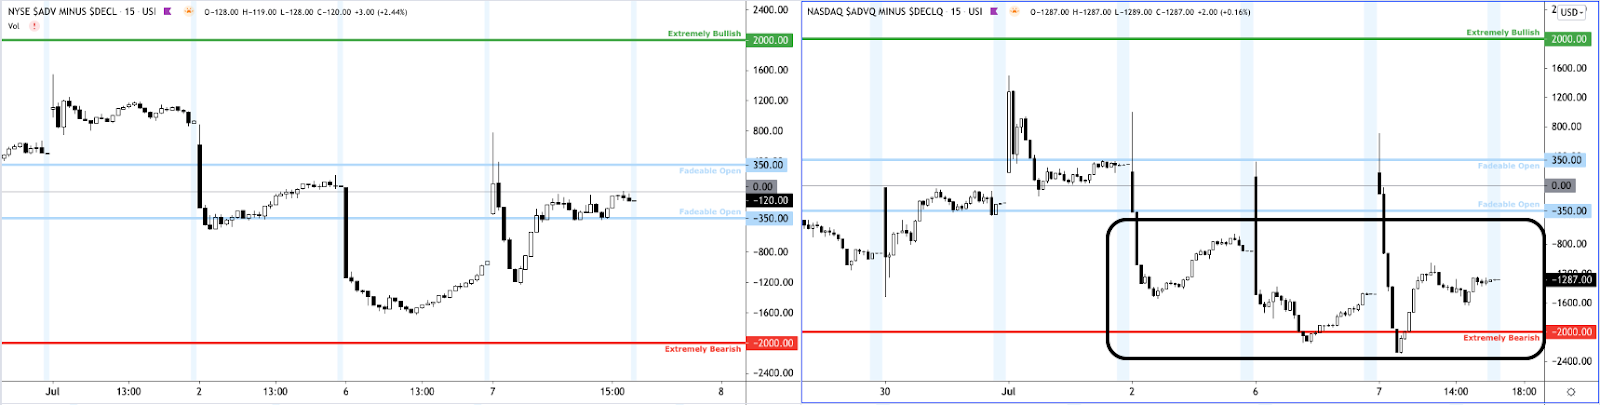
To note, Friday’s trade happened on positive, albeit weaker breadth. This is in comparison to Thursday’s session during which breadth, measured by the Advance/Decline indicator, was negative and not supportive of an advance in price.
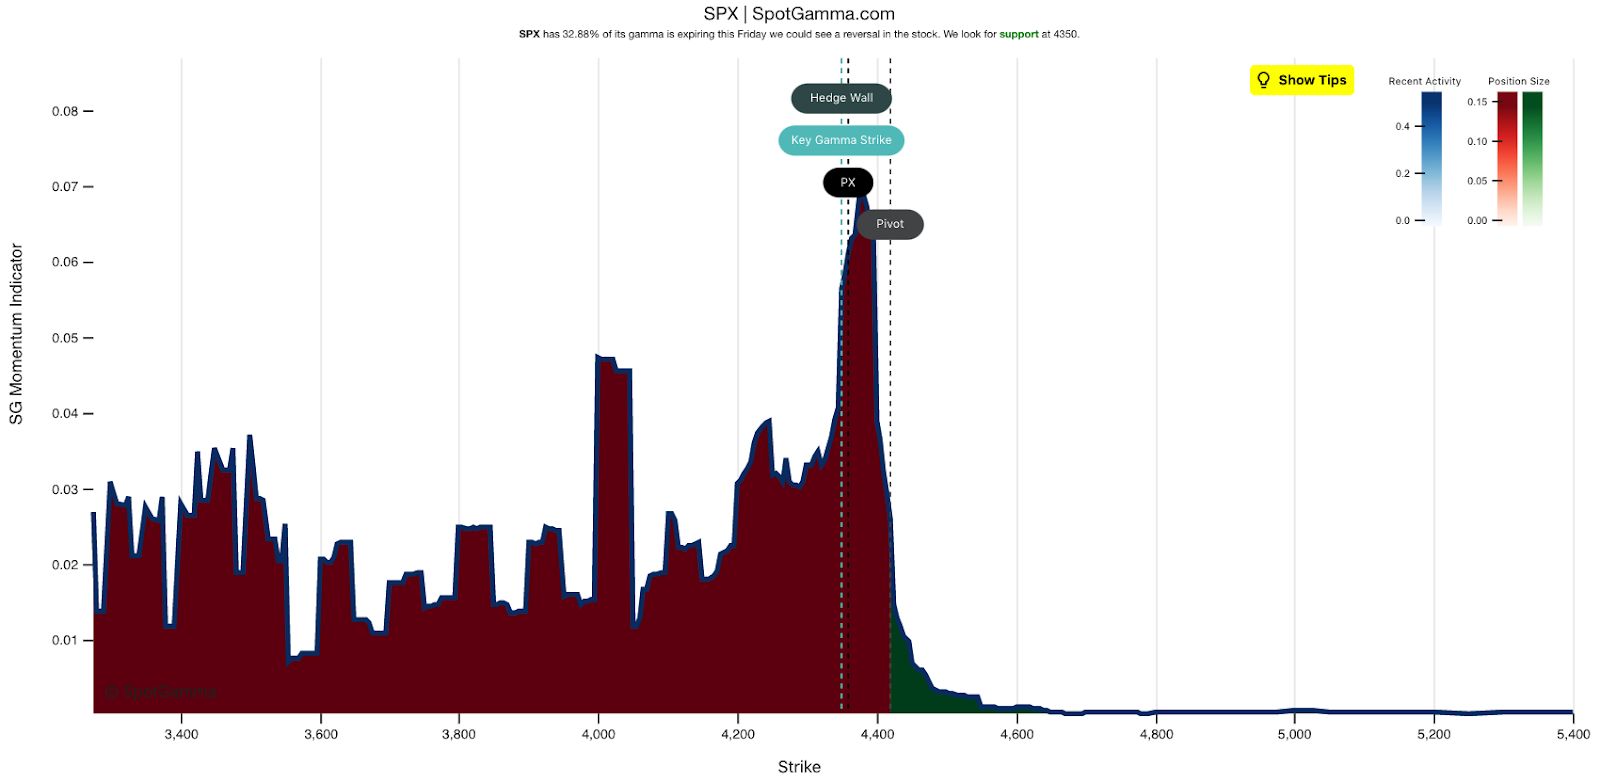
A key thing to watch for is acceptance (i.e., more than 1-hour of trade) and whether an auction failure transpires.
If initiative buyers were to further expand the range, then all is well. However, in a failure to move higher, confirmed by trade below Friday’s $4,372.50 regular trade low (RTH Low), an auction failure may foreshadow a liquidation break.
Liquidation Breaks: A profile shape that suggests participants were “too” long and had poor location.
For today, participants can trade from the following frameworks.
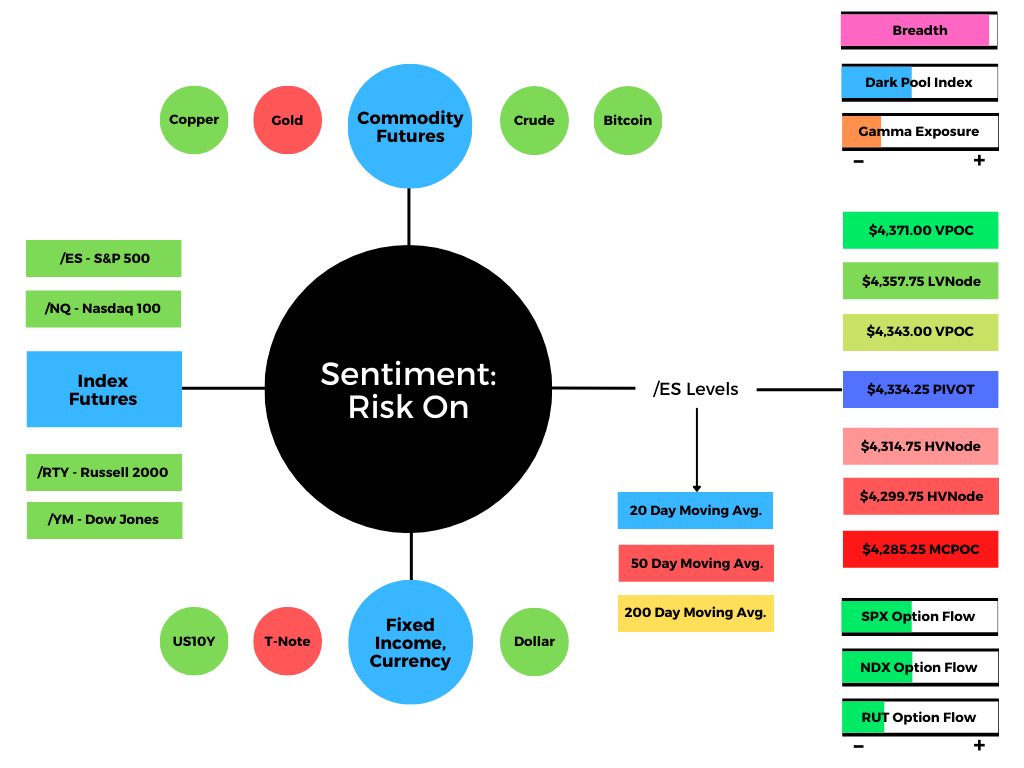
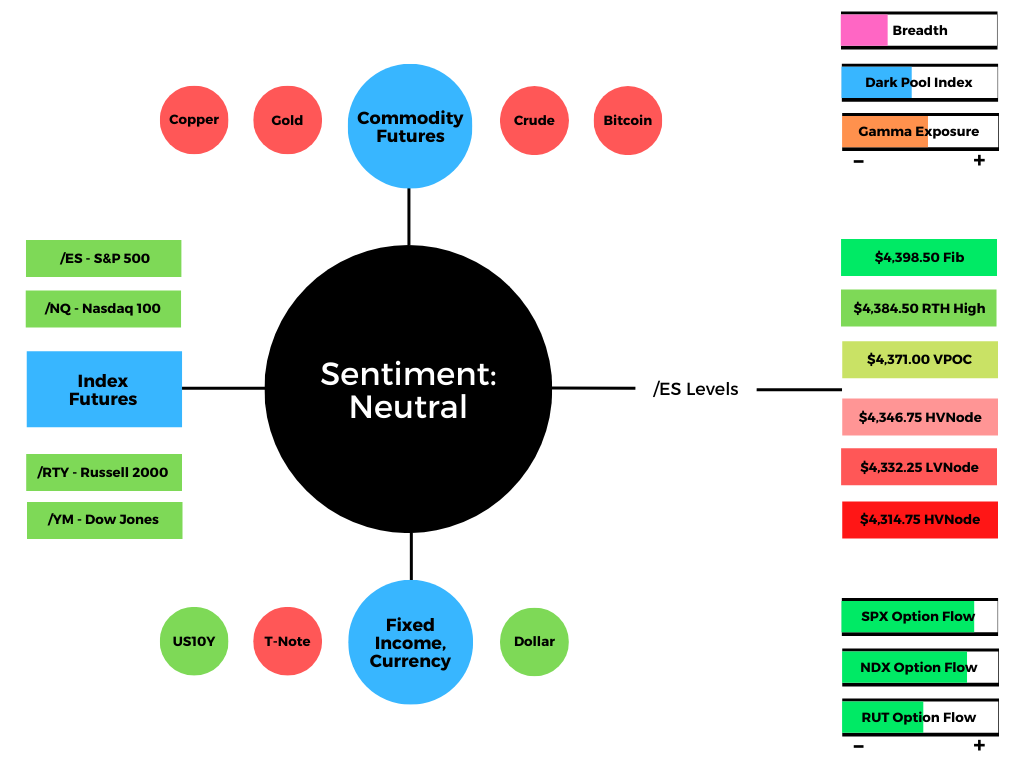
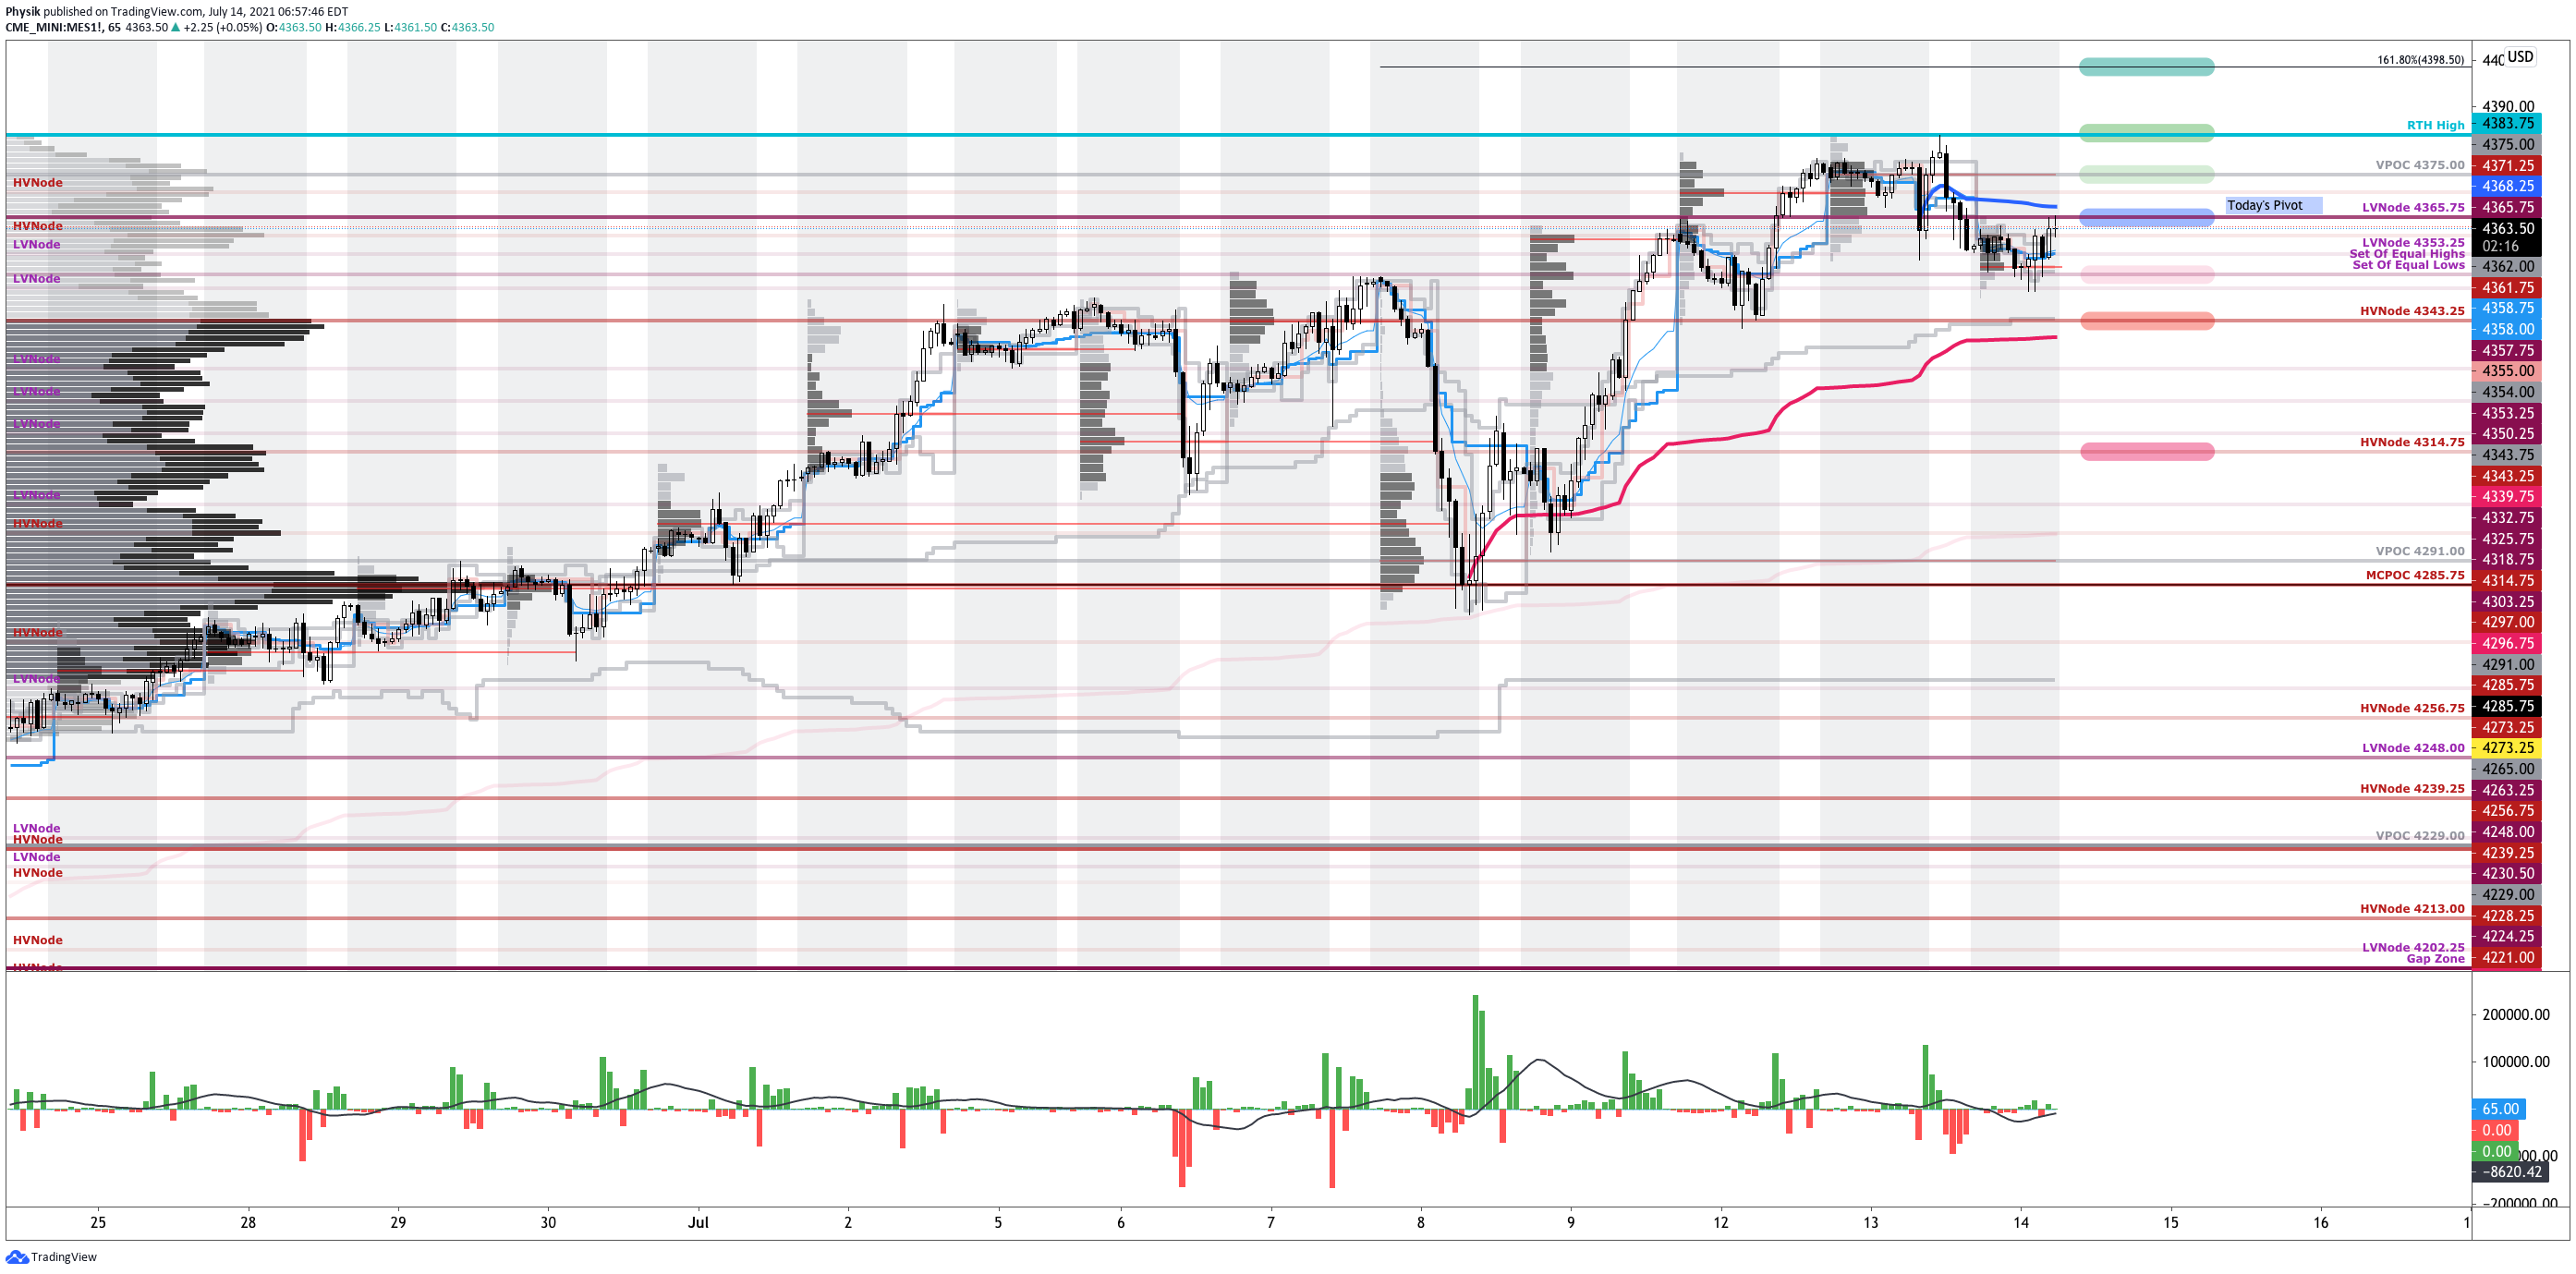
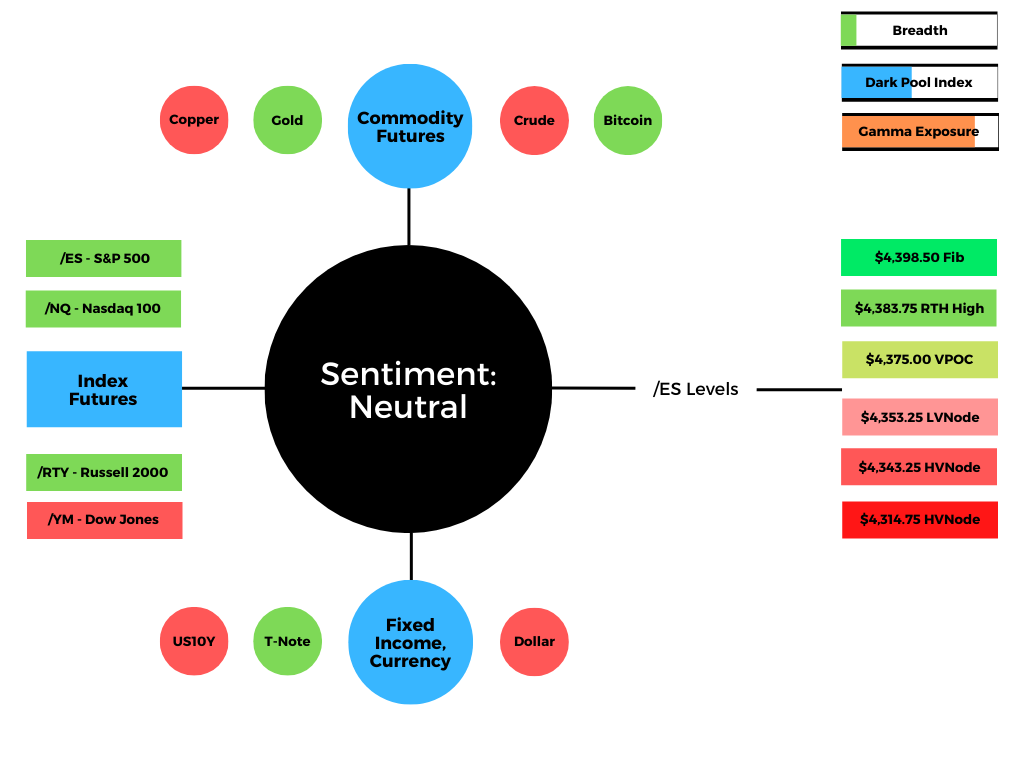
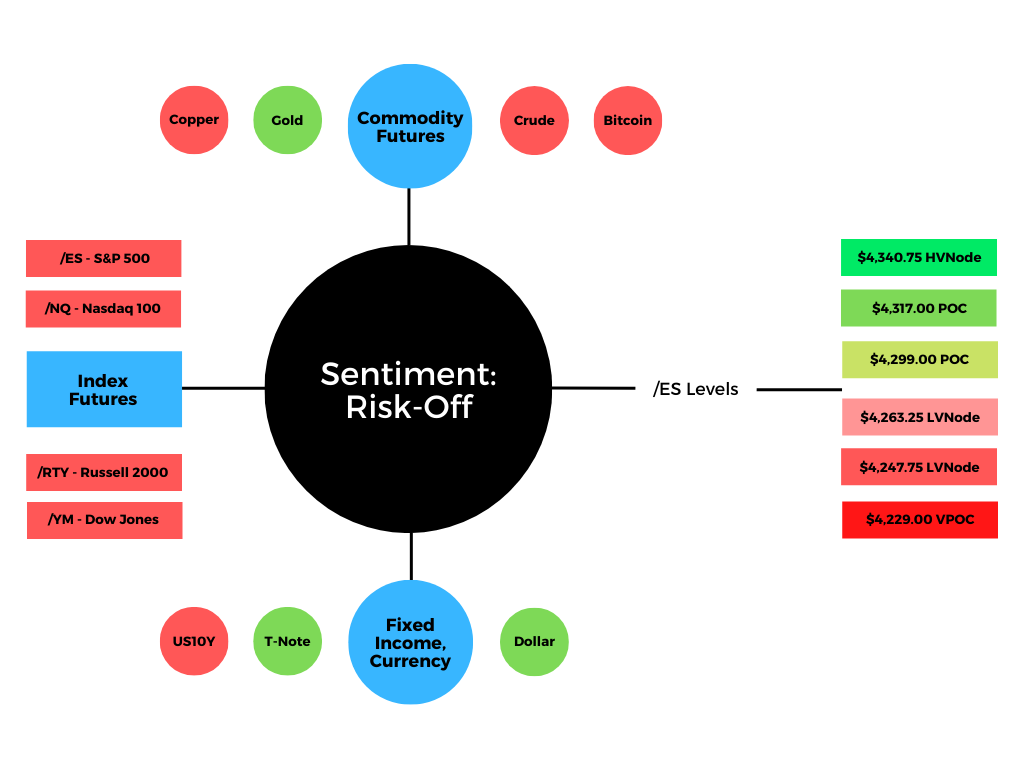
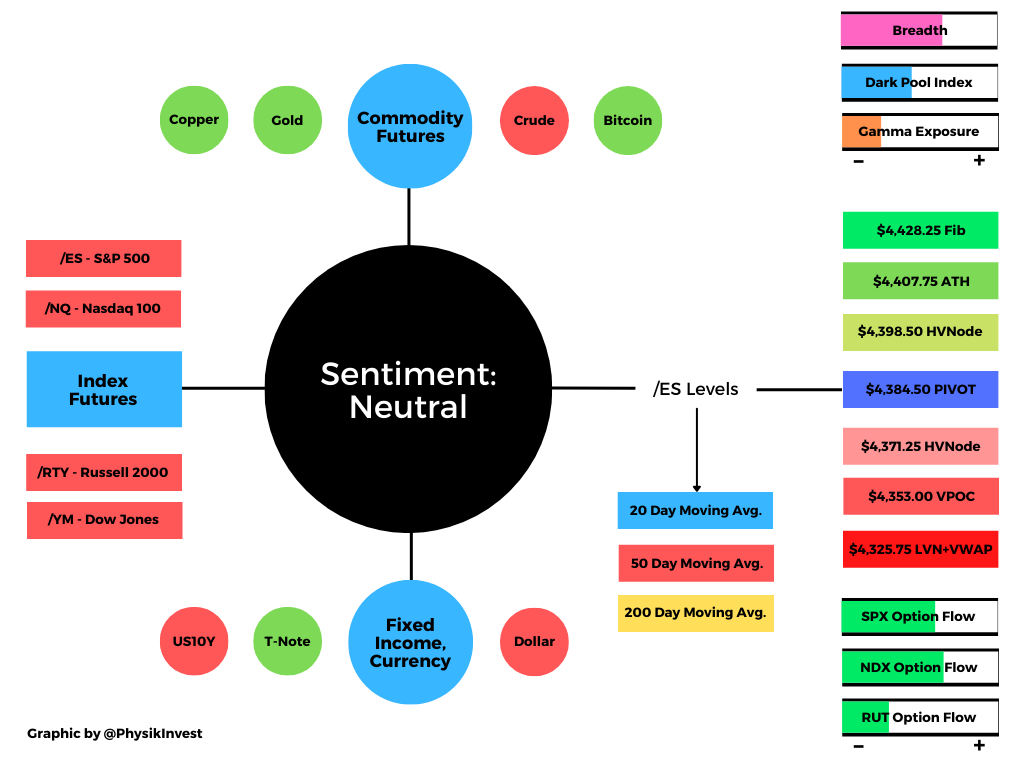
In the best case, the S&P 500 trades sideways or higher; activity above the $4,384.50 pivot puts in play the $4,398.50 high volume area (HVNode). Initiative trade beyond the $4,398.50 HVNode could reach as high as the $4,407.75 ATH and $4,428.25 Fibonacci-derived target.
In the worst case, the S&P 500 trades lower; activity below the $4,384.50 pivot puts in play a potential auction failure confirmed by trade below the $4,372.50 RTH Low. Initiative trade beyond the RTH Low may reach as low as the $4,353.00 untested Point of Control (VPOC) and $4,325.75 LVNode.
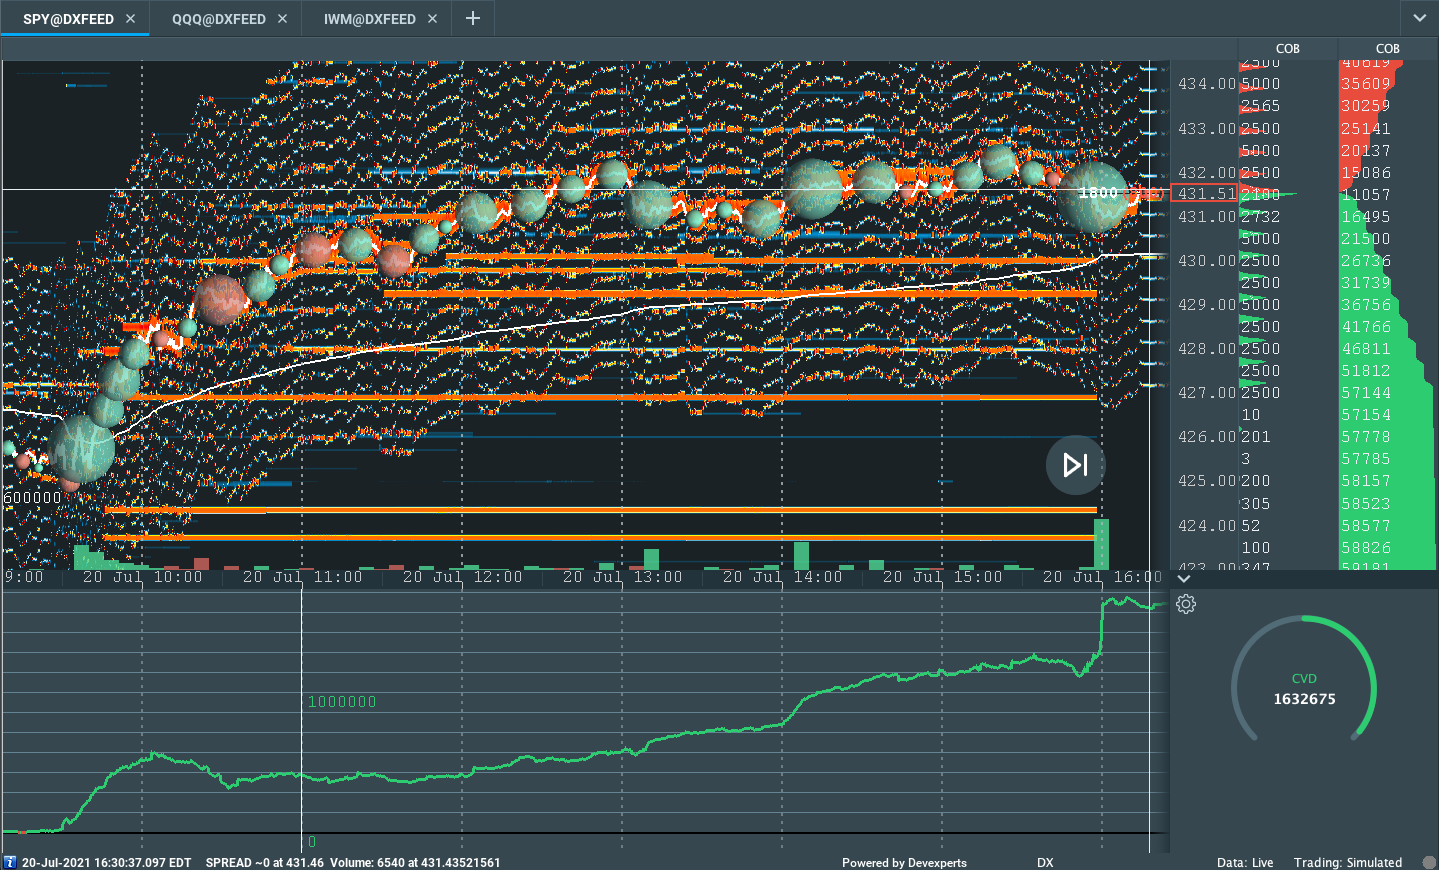
To note, the last key level corresponds with two anchored Volume Weighted Average Price (VWAP) levels, a metric highly regarded by chief investment officers, among other participants, for quality of trade. Additionally, liquidity algorithms are benchmarked and programmed to buy and sell around VWAPs.
POCs: POCs are valuable as they denote areas where two-sided trade was most prevalent. Participants will respond to future tests of value as they offer favorable entry and exit.

Volume Areas: A structurally sound market will build on past areas of high volume. Should the market trend for long periods of time, it will lack sound structure (identified as a low volume area which denotes directional conviction and ought to offer support on any test).

If participants were to auction and find acceptance into areas of prior low volume, then future discovery ought to be volatile and quick as participants look to areas of high volume for favorable entry or exit.

News And Analysis
China stocks tumble in panic selling amid a broad crackdown.
U.S. infrastructure talks near finish as Senators face pressure.
U.S. real yields fell to a record low alongside growth concerns.
The COVID-19 coronavirus crisis is officially over (in the West).
U.S. home price appreciation to moderate as supply increases.
What People Are Saying
About
After years of self-education, strategy development, and trial-and-error, Renato Leonard Capelj began trading full-time and founded Physik Invest to detail his methods, research, and performance in the markets. Additionally, Capelj is a finance and technology reporter. Some of his biggest works include interviews with leaders such as John Chambers, founder and CEO, JC2 Ventures, Kevin O’Leary, businessman and Shark Tank host, Catherine Wood, CEO and CIO, ARK Invest, among others.
Disclaimer
At this time, Physik Invest does not manage outside capital and is not licensed. In no way should the materials herein be construed as advice. Derivatives carry a substantial risk of loss. All content is for informational purposes only.