The daily brief is a free glimpse into the prevailing fundamental and technical drivers of U.S. equity market products. Join the 600+ that read this report daily, below!
Updates: Hey, team! I’m offering some updates on the letter and gauging your thoughts, if any.

Been incredibly busy juggling what is, basically, 3 jobs. Here’s a bit about me, if interested. That said, my attention has been elsewhere, to put it simply, so the letters have taken a bit of a hit. Sorry!

The few options I’ve been faced with include (1) lowering the frequency of letters to improve quality and/or (2) continuing pace but increasing simplicity for some time.

I’m aware that many rely on the key levels I provide, daily, as well as some of the narratives and trade ideas often included in the positioning section. Therefore, I’m soliciting feedback and will follow through with the consensus, if any. Have a great weekend!
Fundamental
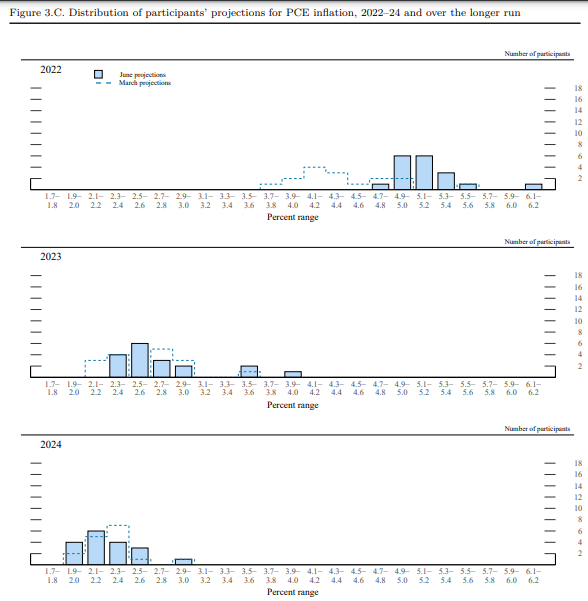
The Fed’s preferred inflation measure – the personal consumption expenditure deflator (PCE) – is set to update. Per Bloomberg, this measure grew an annualized 7.1% for the second quarter.
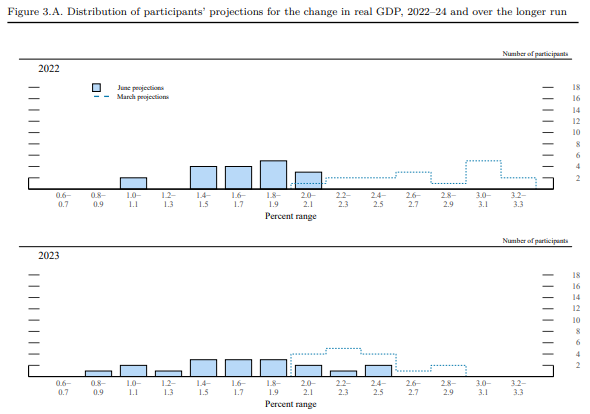
This is on the heels of the Federal Reserve’s (Fed) interest rate hike aimed at reining inflation, as well as data that suggests the “drumbeat of recession” growing louder.
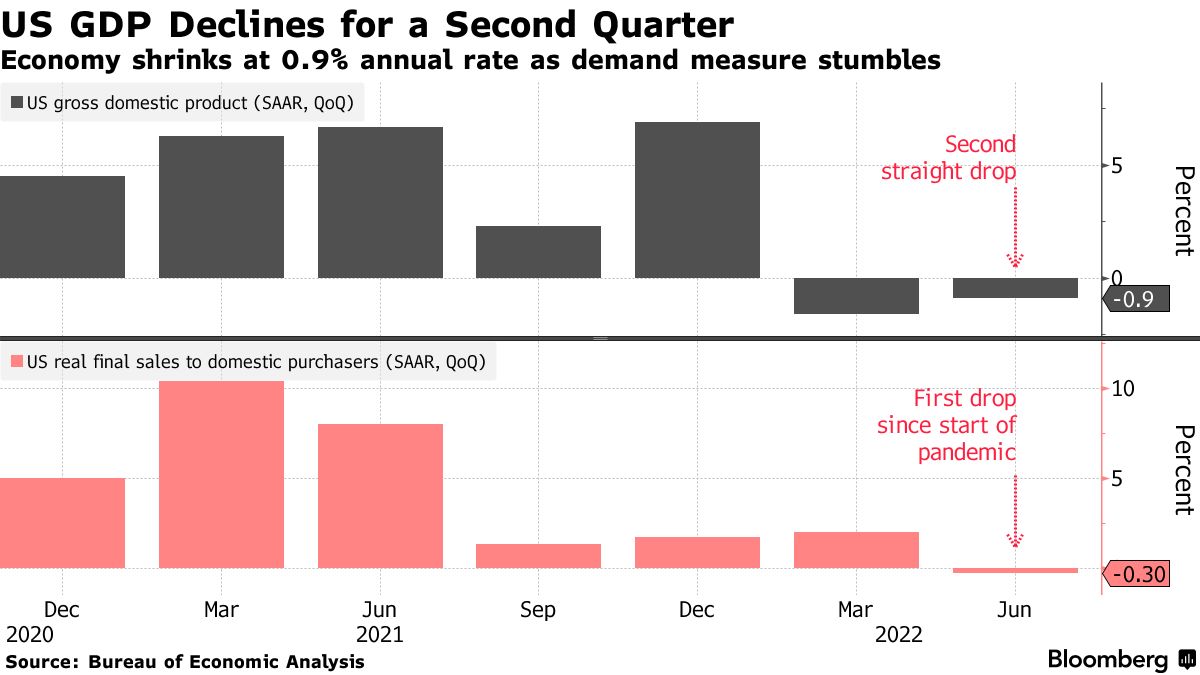
Yelena Shulyatyeva and Eliza Winger, economists cited by Bloomberg, comment that the fall in GDP growth “raises the risk that the economy will fall into recession by year-end.”
However, based on the research and expert commentary set forth in past letters, the case is the economy may already be in recession.
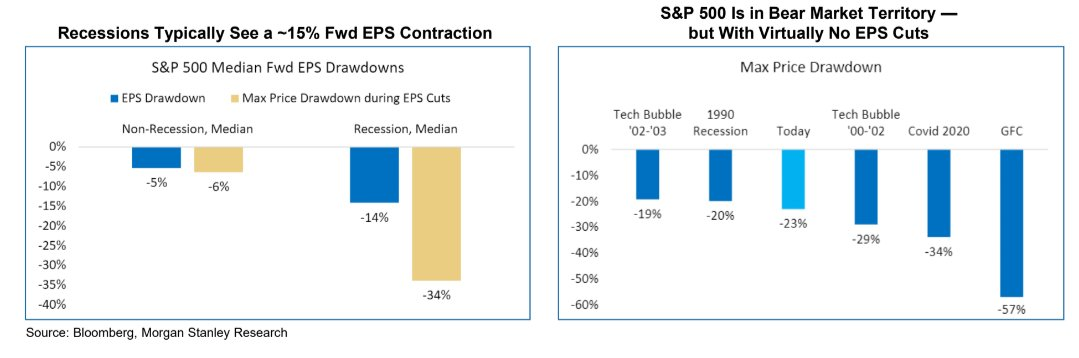
Notwithstanding, what’s the impact on equity markets (i.e., now earnings compression)?
It’s the consensus that equity markets endured one of the sharpest de-rates in three decades as participants priced the compression in multiples on the rise in interest rates and flow of capital to capital markets – the quantitative tightening (QT) – component.
For context, beyond raising costs to borrow and innovate, higher interest rates may mean future discounted valuations are lower. Additionally, yield-hungry investors may seek less risky assets, now, given that their yields are more attractive.

Recall that in engaging in practices such as quantitative easing (QE), central banking authorities purchase assets from private sector entities through the creation of central bank reserves. The unwind of this through the QT exercise removes reserves from balance sheets either through asset sales or non-reinvestment of the principal sum of maturing securities.

In less complex terms, the Fed’s purchase of assets depressed their yields forcing investors into risk. Liquidity withdrawal ought to have the opposite effect, amplifying the impact of rate hikes.

Adding, per Joseph Wang, who we’ve quoted in the past, with bank deposits expected to drain ~1T by year-end, the competition for cash forces investors to continue “lower[ing] their selling prices to compete for the cash they want.”
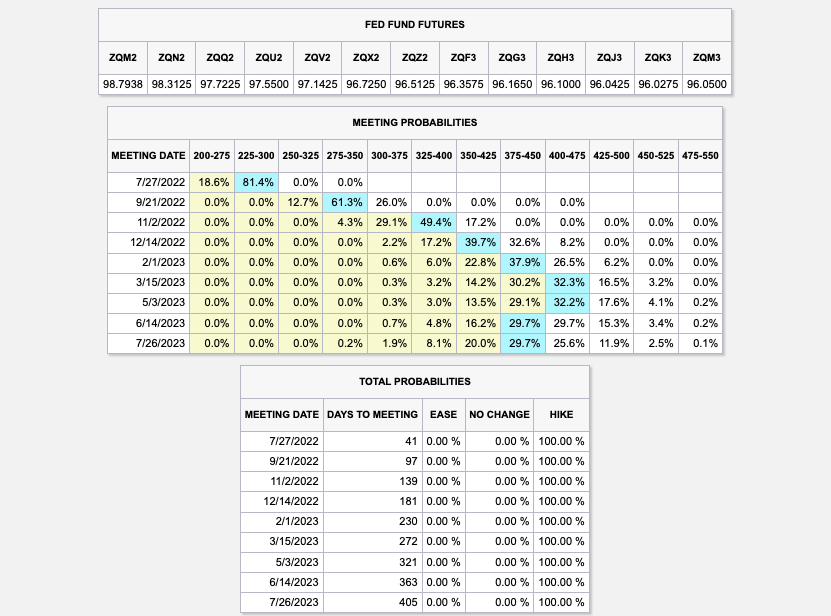
Accordingly, the “Fed will continue to hike interest rates until something breaks,” as explained by Andreas Steno Larsen. In ending forward guidance, “the Fed will rely even more on lagging indicators such as the unemployment rate and the monthly CPI report.”
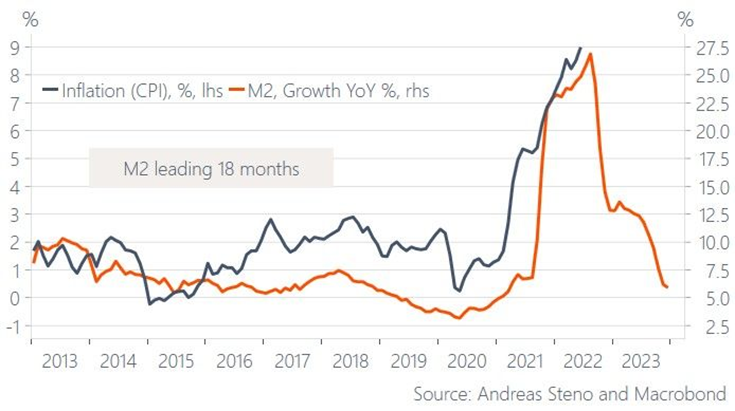
“Once unemployment starts increasing alongside weakening momentum in the inflation reports, it will likely be at least 3-6 months too late to pivot.”
The Eurodollar – which reflects the interest offered on U.S. dollar-denominated deposits at banks outside of the U.S. (i.e., participants’ outlook on interest rates) – curve is inverted and implies rate cuts ahead, “6-7 months from now.”
Given the above, portfolios can “stay away from highly speculative assets, own USD cash, and start allocating towards 5-10y+ government bonds,” as Alfonso Peccatiello explained well.
Context: A stronger dollar, on the tightening of liquidity and credit, as well as increased demand and competition for money, does more to pressure risk and, is an equity headwind.

Additionally, per Morgan Stanley (NYSE: MS) research, "The simple math on S&P 500 earnings from currency is that for every percentage point increase on a year-on-year basis it’s [] a 0.5 hit to EPS growth.”
Positioning
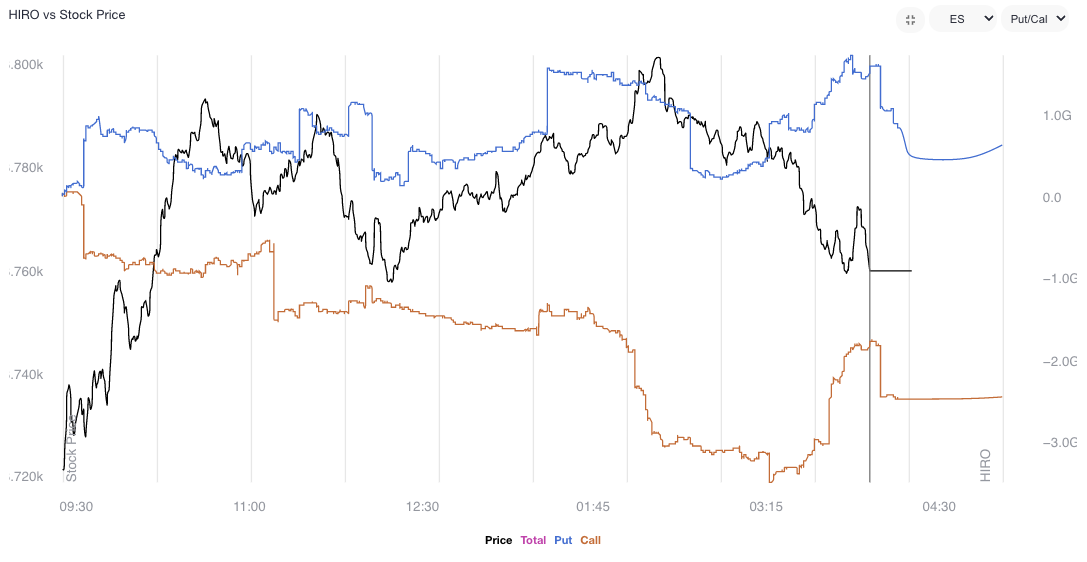
For the past few sessions, we did much to unpack and understand some of the implications of participants’ market positioning.
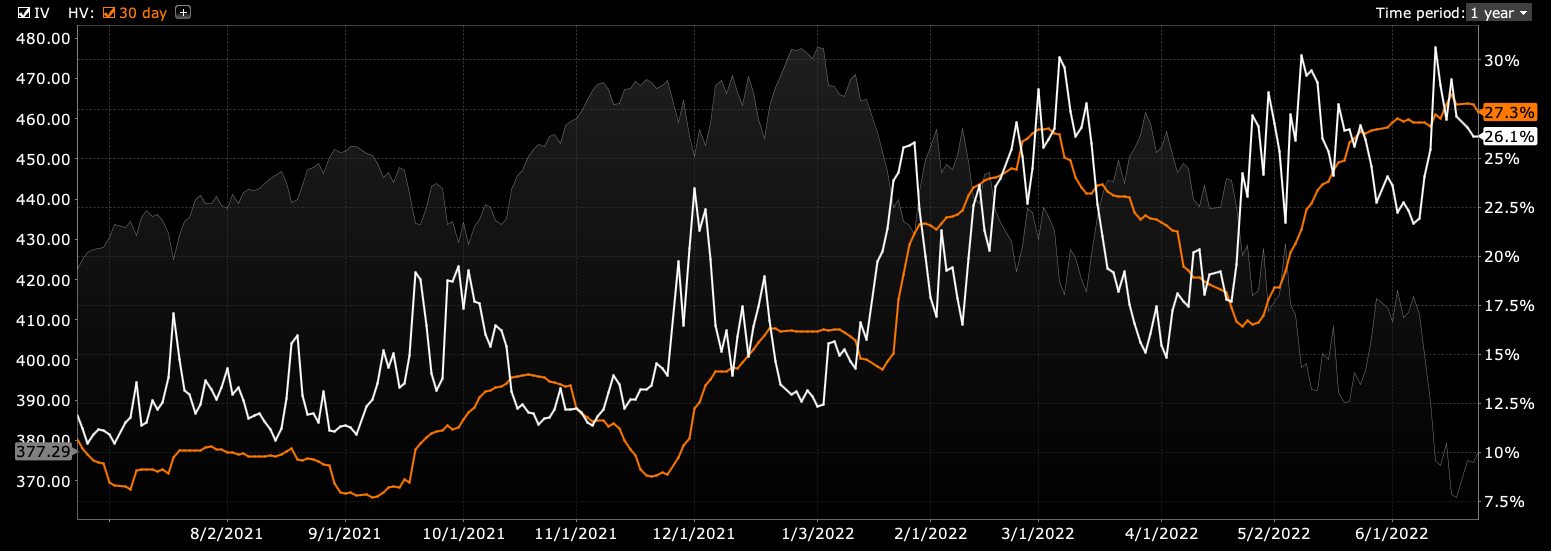
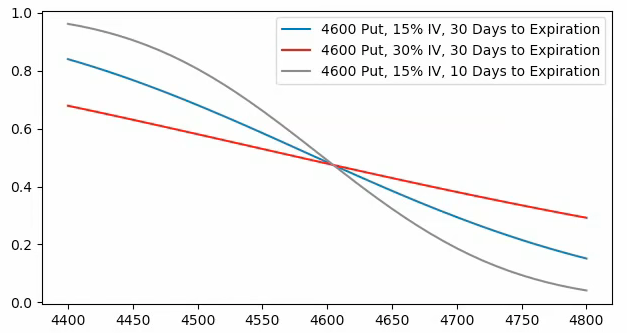
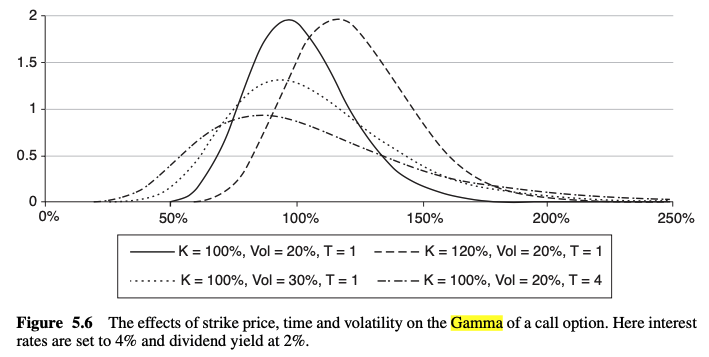
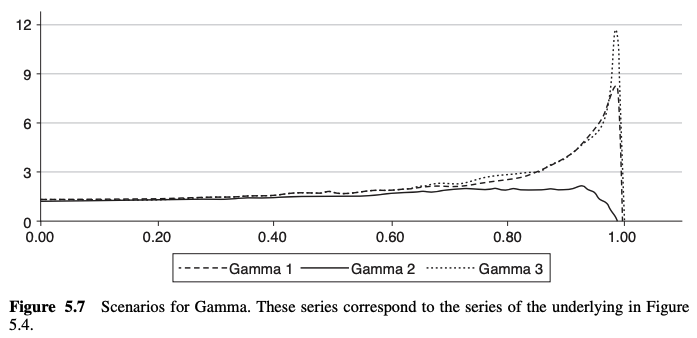
In summation, own volatility where the market is likely to not expire. Sell it where the market is likely to expire. Just because implied (IVOL) volatility is at a high starting point does not mean it should be sold, blindly, particularly on the put side, below the market.
Read: Explanations and Applications – Moontower on Gamma.
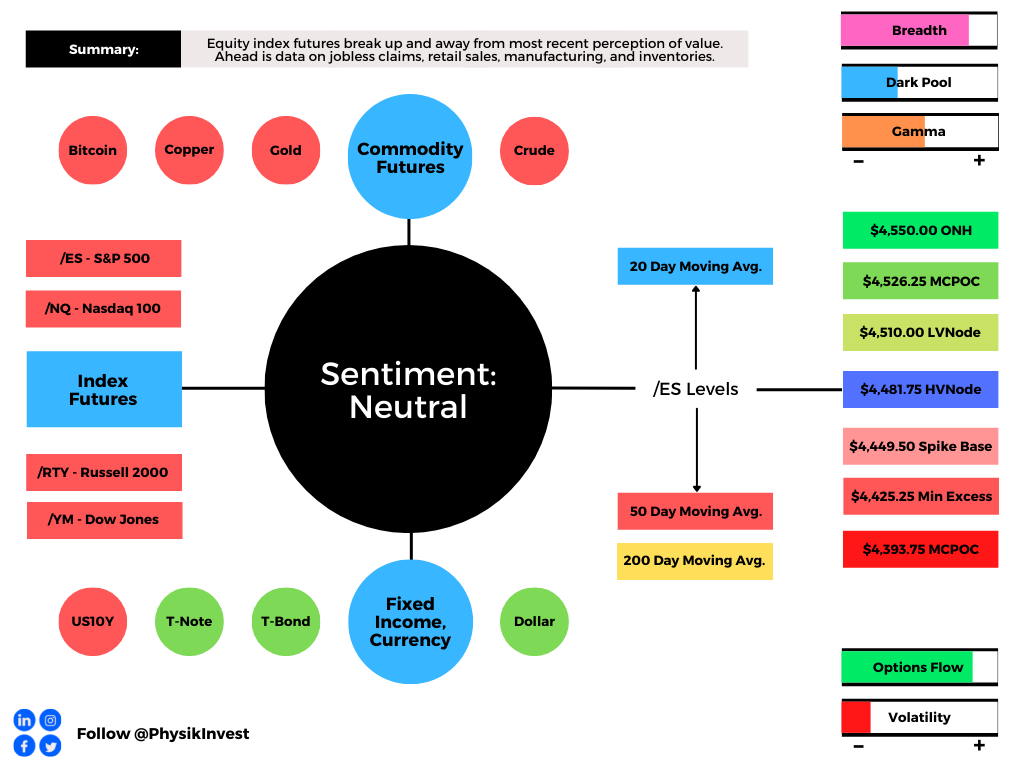
Technical
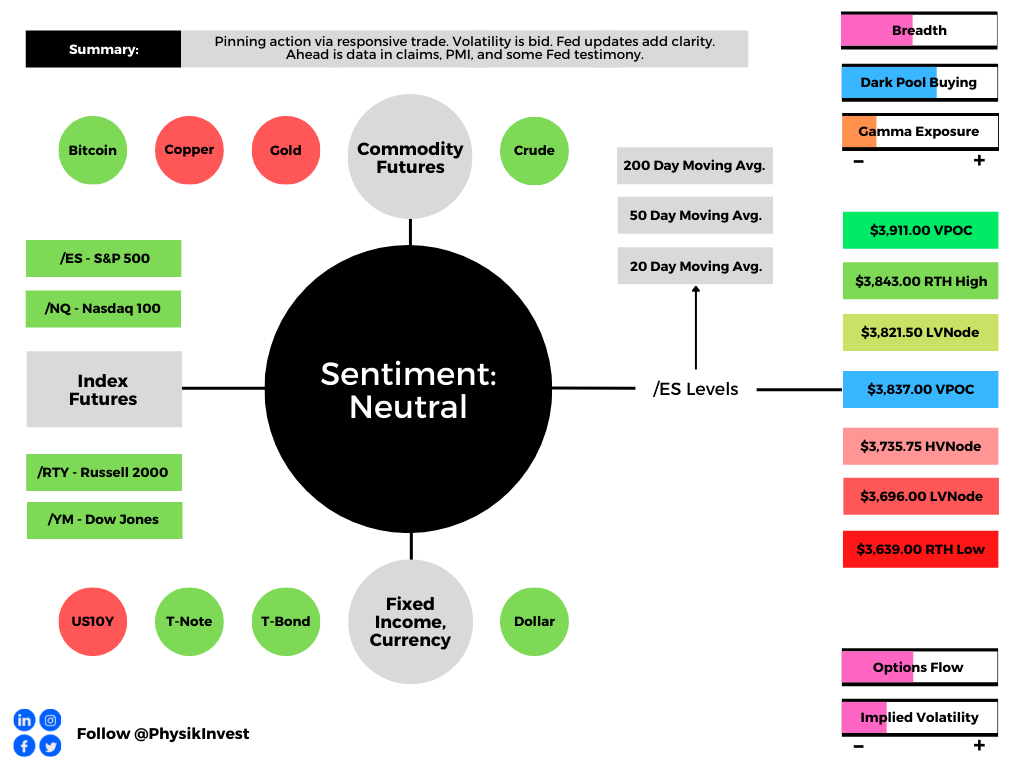
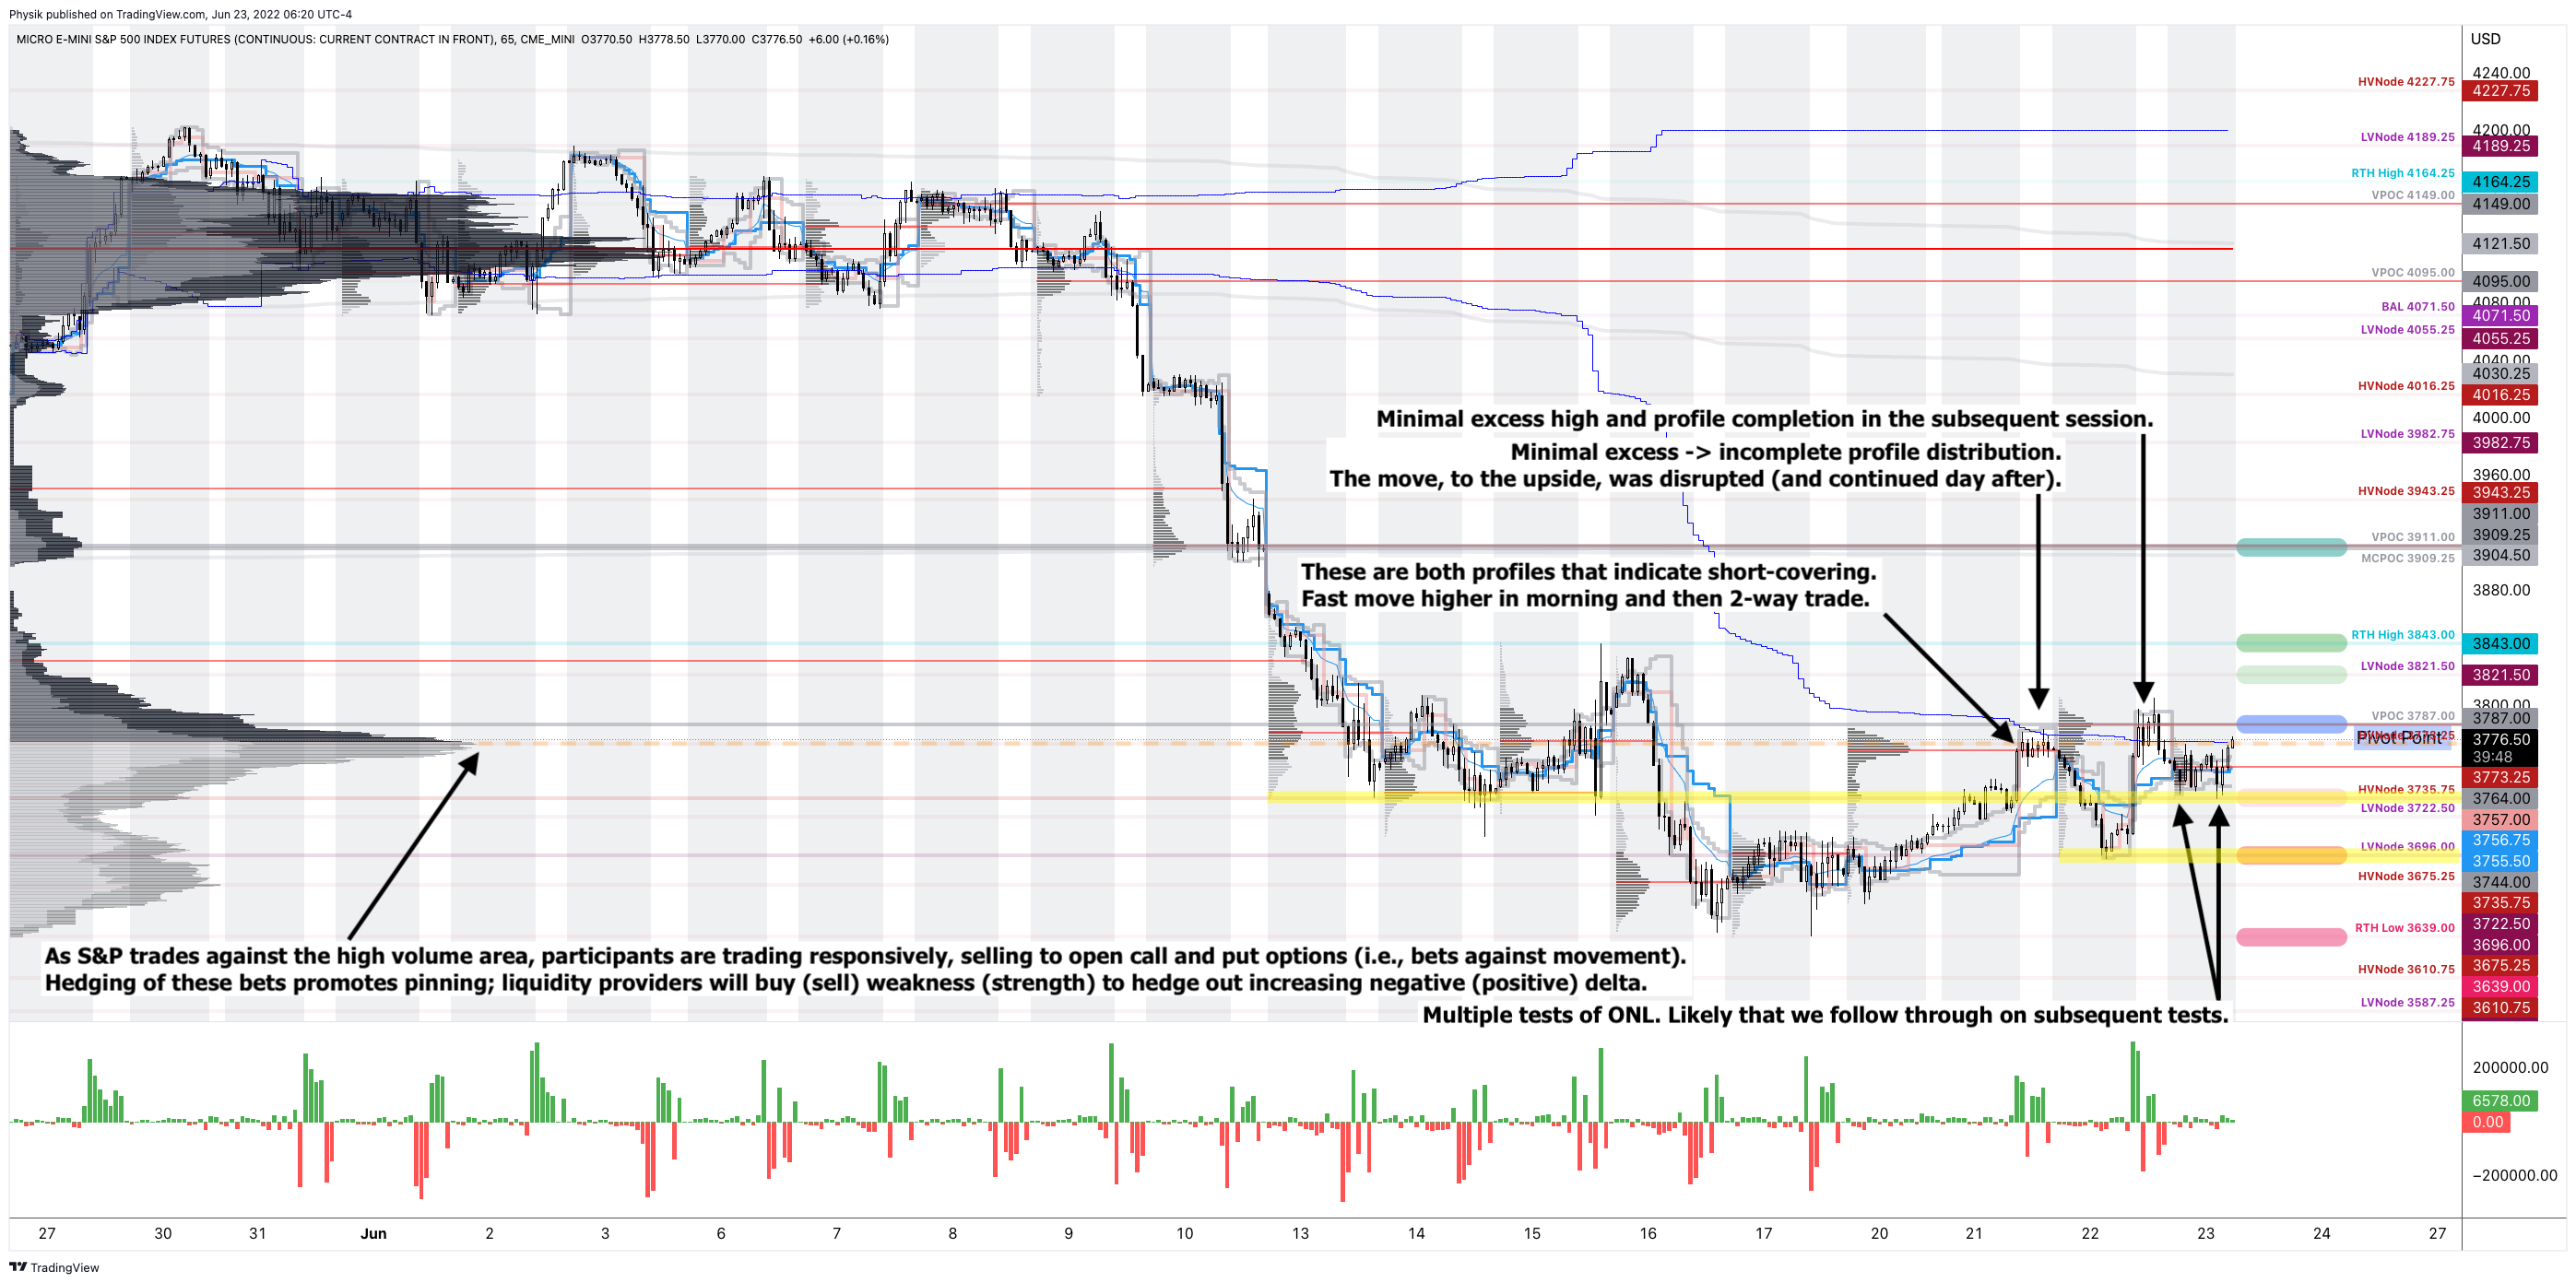
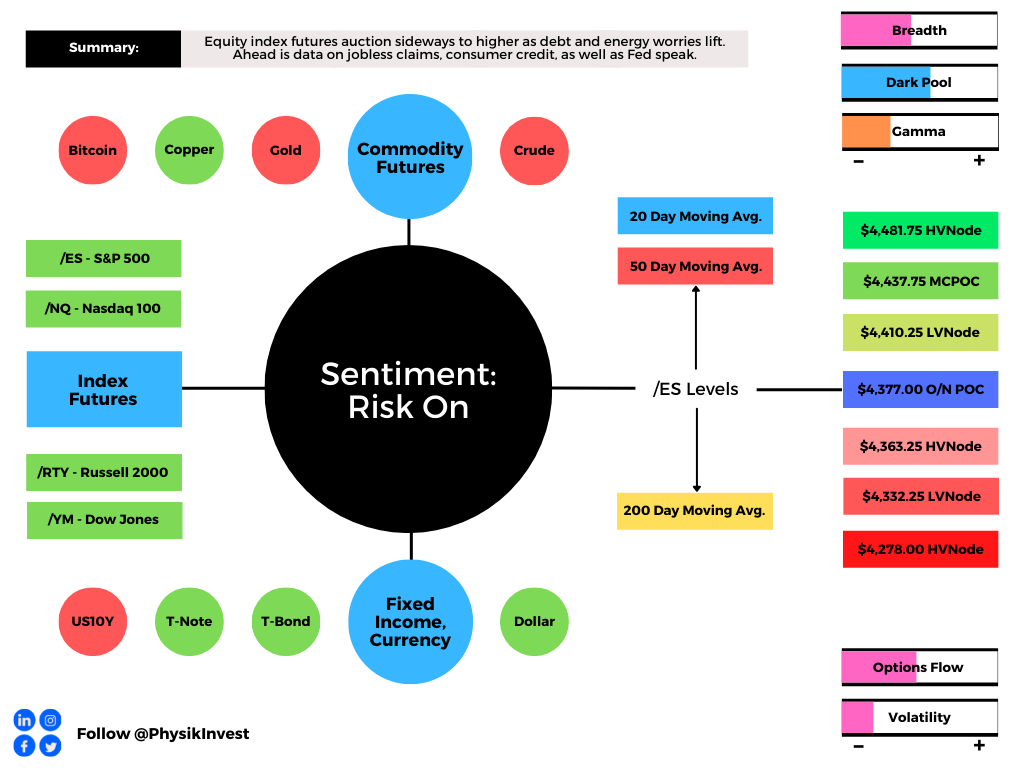
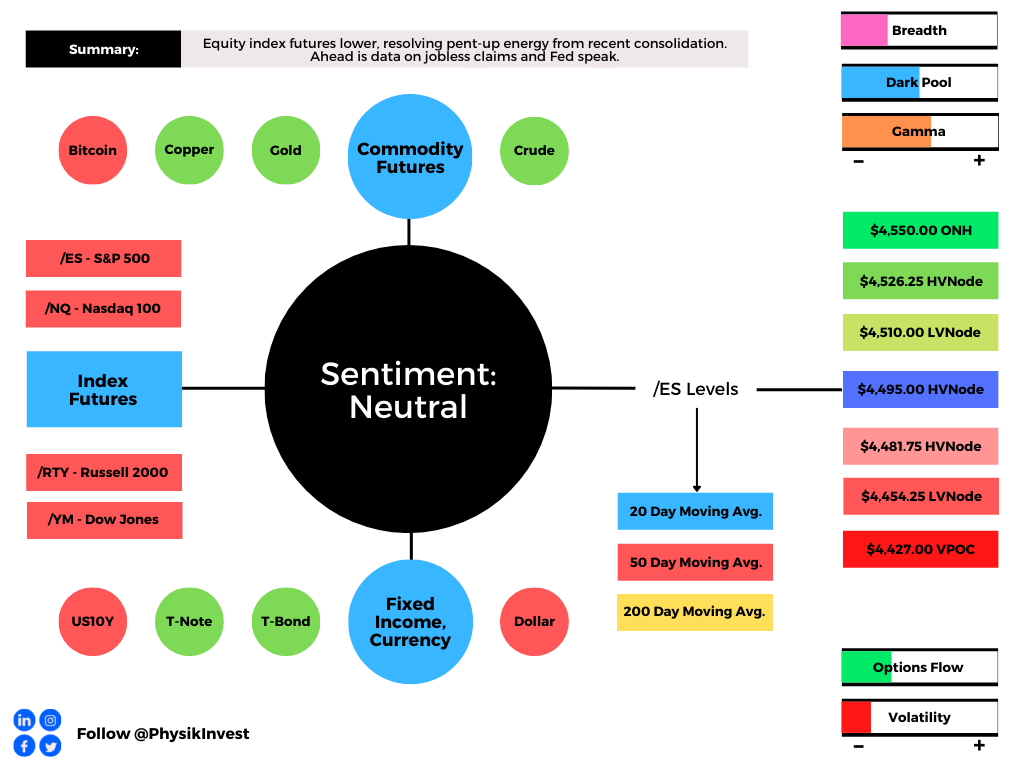
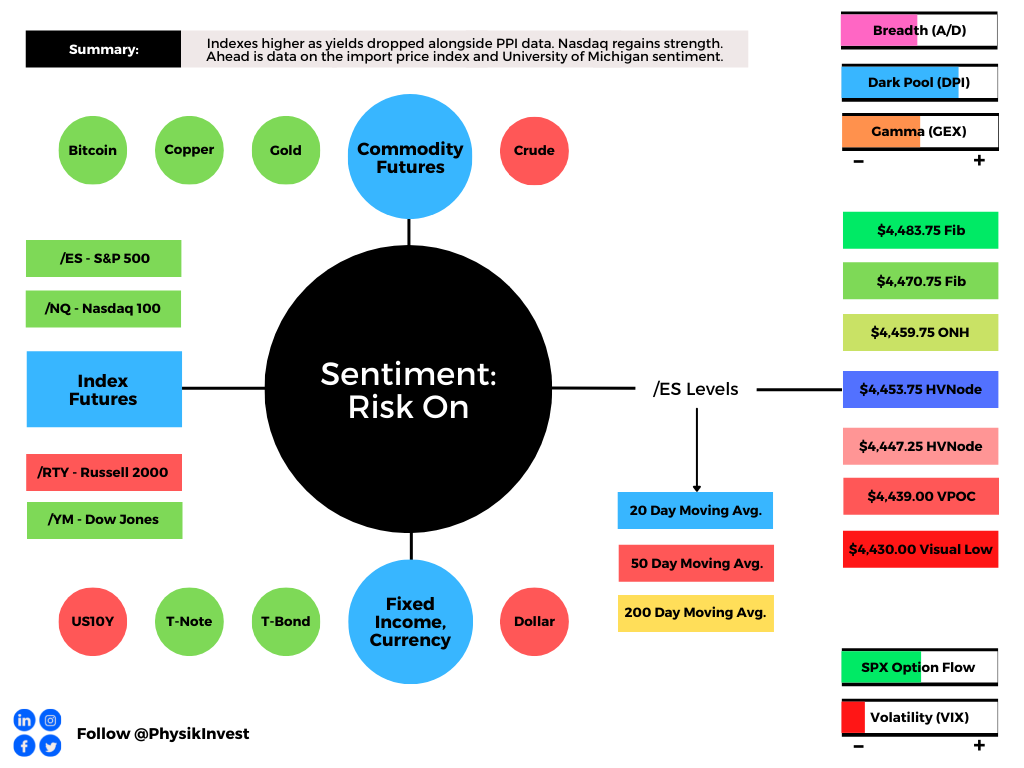
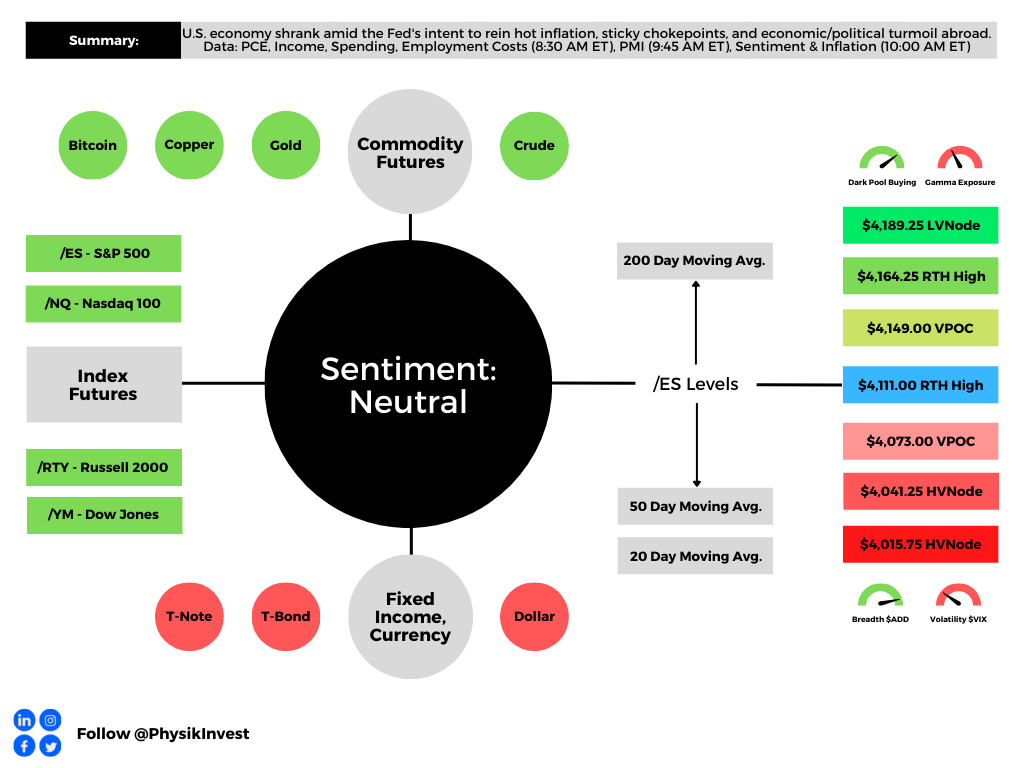
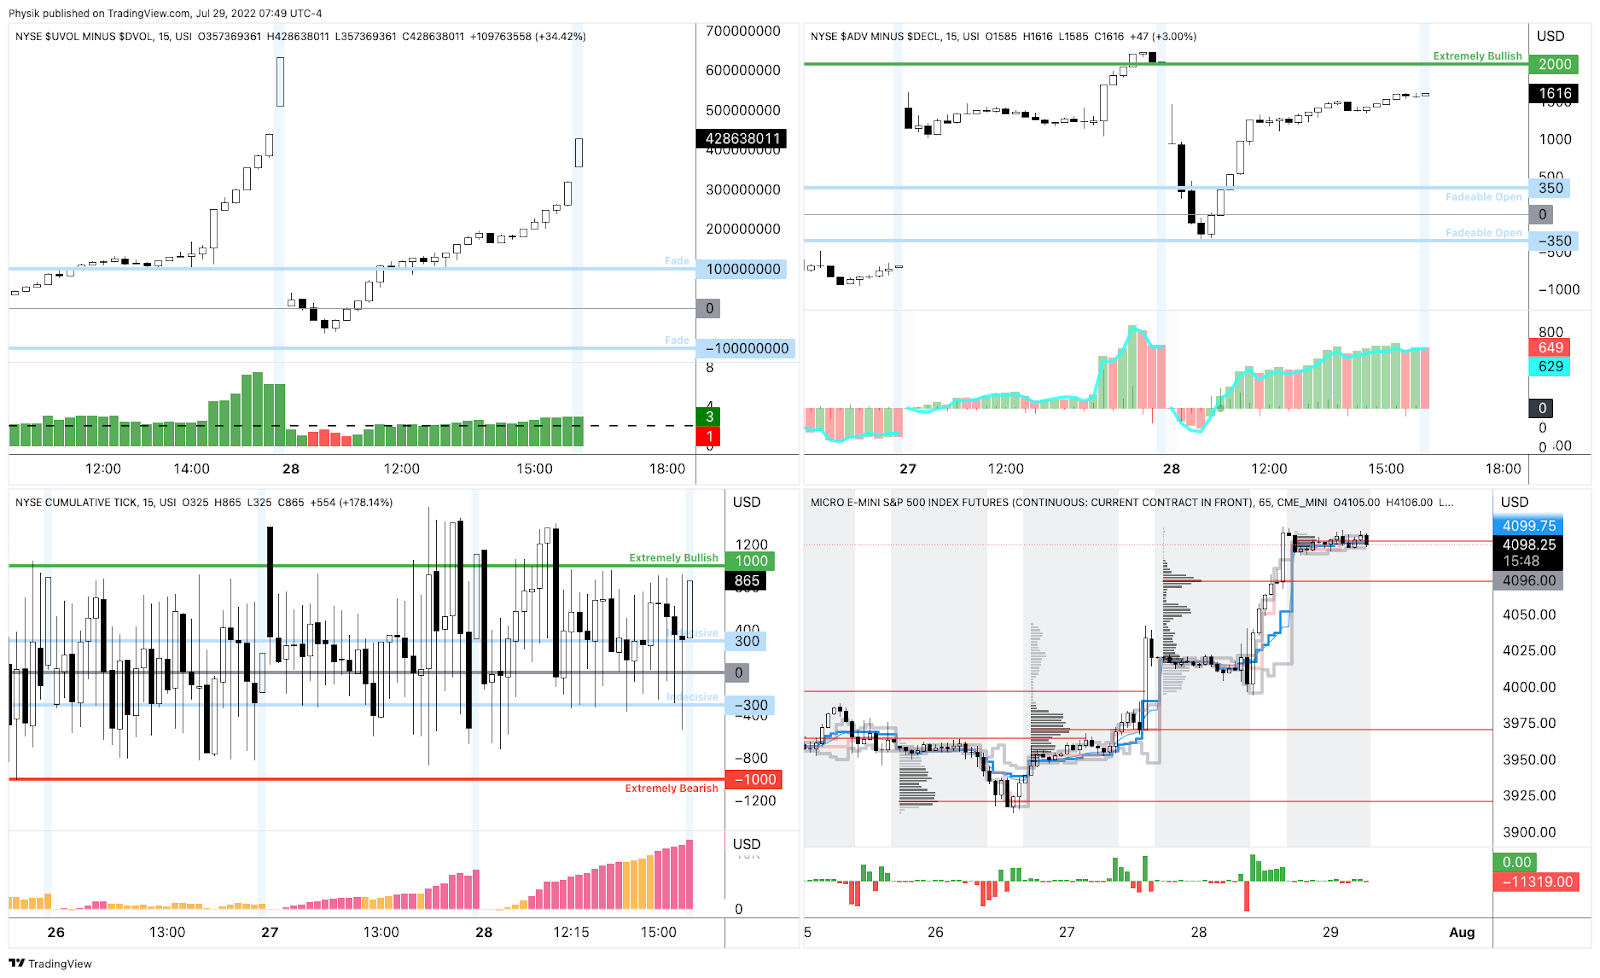
As of 6:30 AM ET, Friday’s regular session (9:30 AM – 4:00 PM ET), in the S&P 500, is likely to open in the middle part of a balanced overnight inventory, inside of prior-range and -value, suggesting a limited potential for immediate directional opportunity.
In the best case, the S&P 500 trades higher.
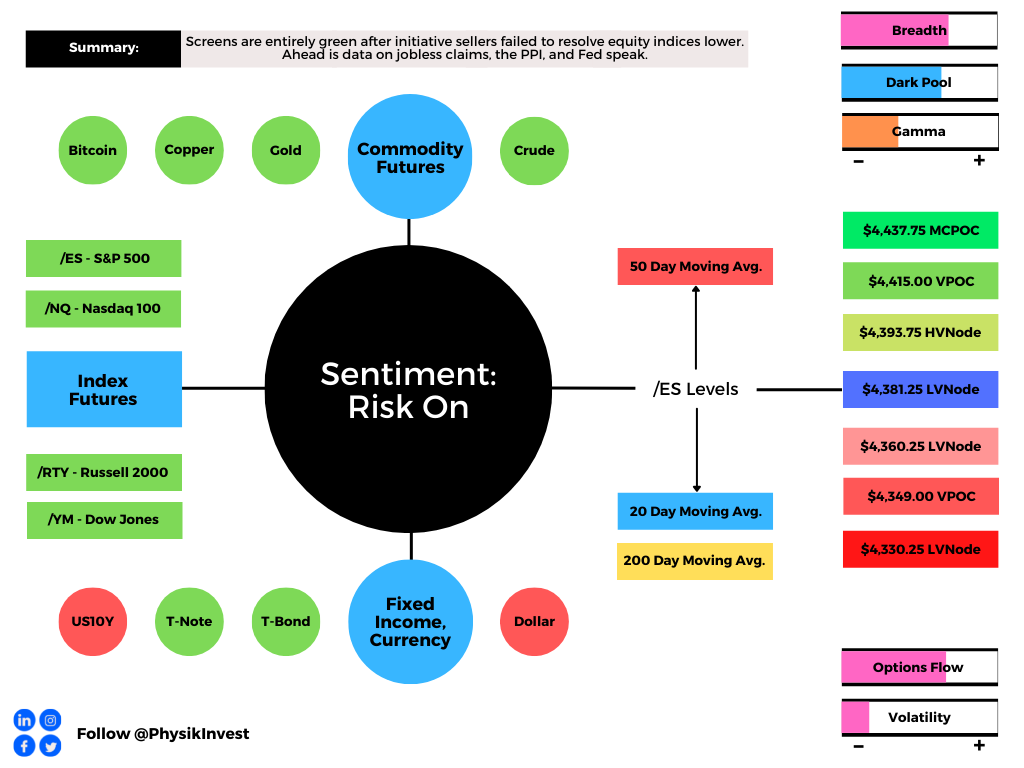
Any activity above the $4,111.00 RTH High puts into play the $4,149.00 VPOC. Initiative trade beyond the $4,149.00 VPOC could reach as high as the $4,164.25 RTH High and $4,189.25 LVNode, or higher.
In the worst case, the S&P 500 trades lower.
Any activity below the $4,111.00 RTH High puts into play the $4,073.00 VPOC. Initiative trade beyond the VPOC could reach as low as the $4,041.25 and $4,015.75 HVNode, or lower.
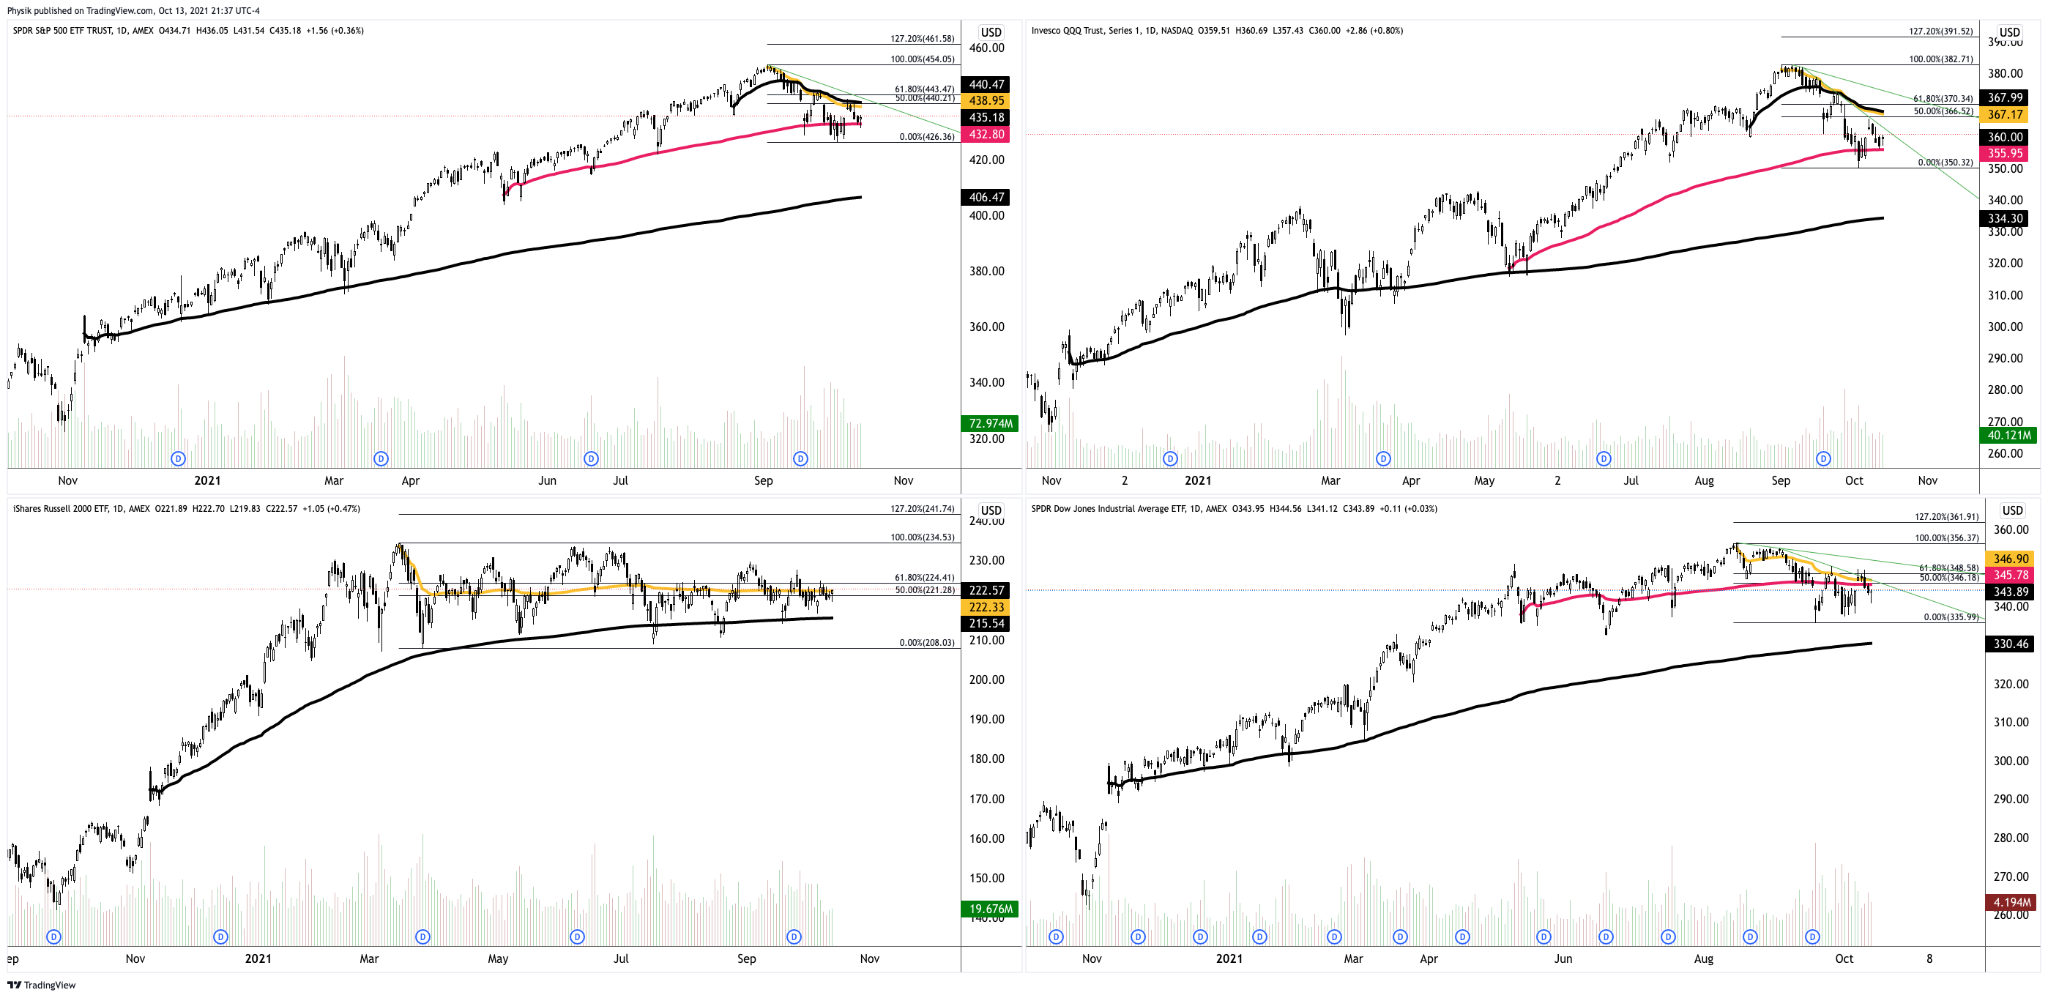
Click here to load today’s key levels into the web-based TradingView charting platform. Note that all levels are derived using the 65-minute timeframe. New links are produced, daily.

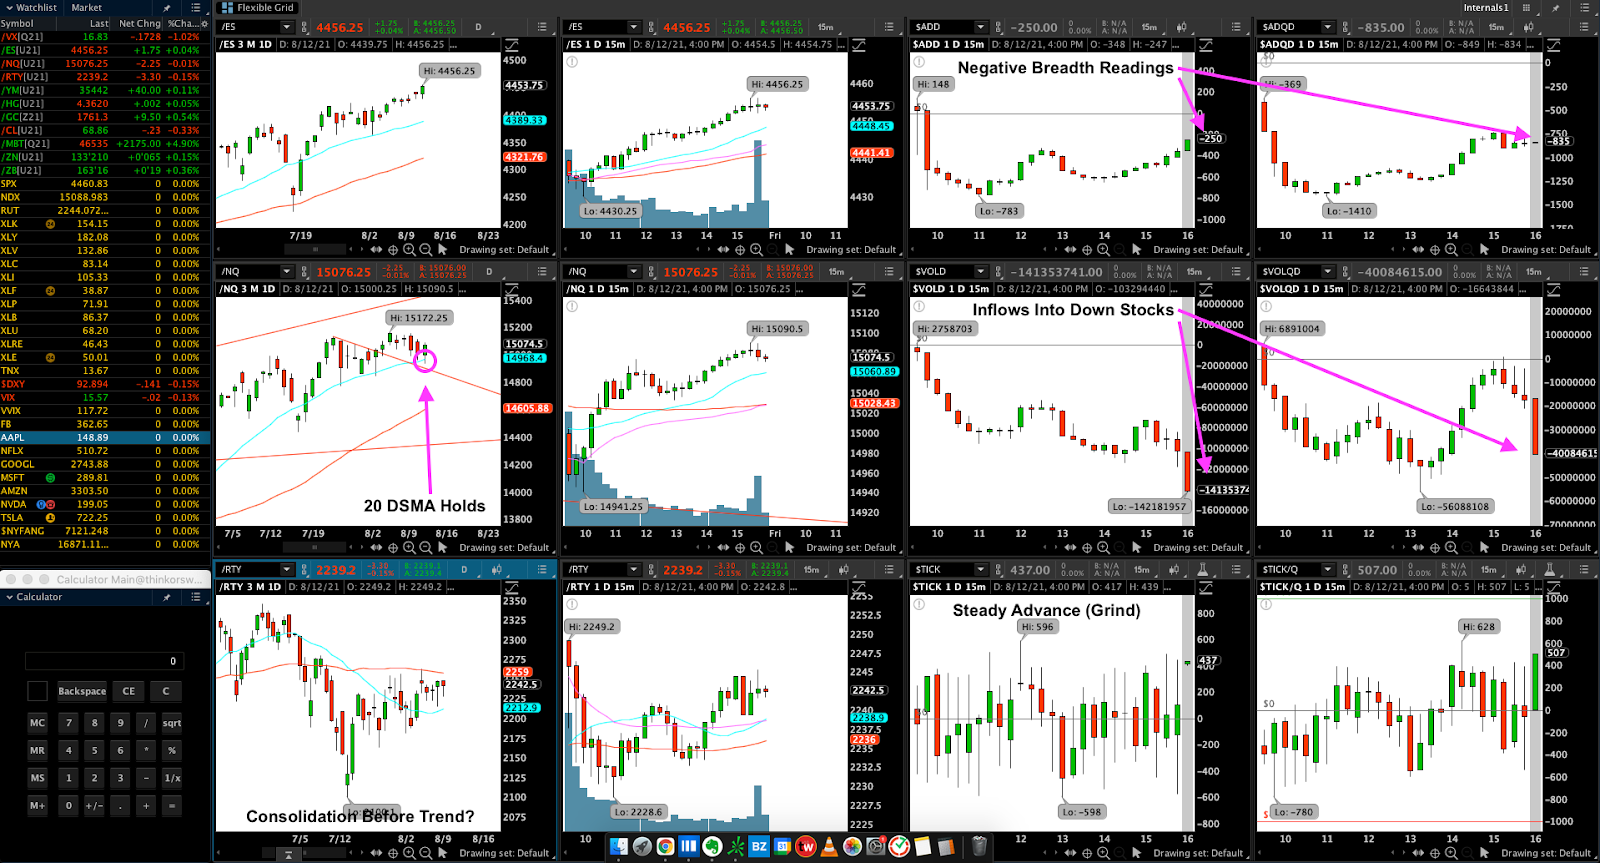
Considerations: This week’s advance was strong, based on market internals. Given this information, the rally is to not be sold, blindly.
Definitions
Volume Areas: A structurally sound market will build on areas of high volume (HVNodes). Should the market trend for long periods of time, it will lack sound structure, identified as low volume areas (LVNodes). LVNodes denote directional conviction and ought to offer support on any test.
If participants were to auction and find acceptance into areas of prior low volume (LVNodes), then future discovery ought to be volatile and quick as participants look to HVNodes for favorable entry or exit.
POCs: POCs are valuable as they denote areas where two-sided trade was most prevalent in a prior day session. Participants will respond to future tests of value as they offer favorable entry and exit.
MCPOCs: POCs are valuable as they denote areas where two-sided trade was most prevalent over numerous day sessions. Participants will respond to future tests of value as they offer favorable entry and exit.
Volume-Weighted Average Prices (VWAPs): A metric highly regarded by chief investment officers, among other participants, for quality of trade. Additionally, liquidity algorithms are benchmarked and programmed to buy and sell around VWAPs.
About
After years of self-education, strategy development, mentorship, and trial-and-error, Renato Leonard Capelj began trading full-time and founded Physik Invest to detail his methods, research, and performance in the markets.
Capelj also develops insights around impactful options market dynamics at SpotGamma and is a Benzinga reporter.
Some of his works include conversations with ARK Invest’s Catherine Wood, investors Kevin O’Leary and John Chambers, FTX’s Sam Bankman-Fried, ex-Bridgewater Associate Andy Constan, Kai Volatility’s Cem Karsan, The Ambrus Group’s Kris Sidial, among many others.
Disclaimer
In no way should the materials herein be construed as advice. Derivatives carry a substantial risk of loss. All content is for informational purposes only.