Categories
Commentary

Daily Brief For May 5, 2022

The Daily Brief is a free glimpse into the prevailing fundamental and technical drivers of U.S. equity market products. Join the 200+ that read this report daily, below!

What Happened

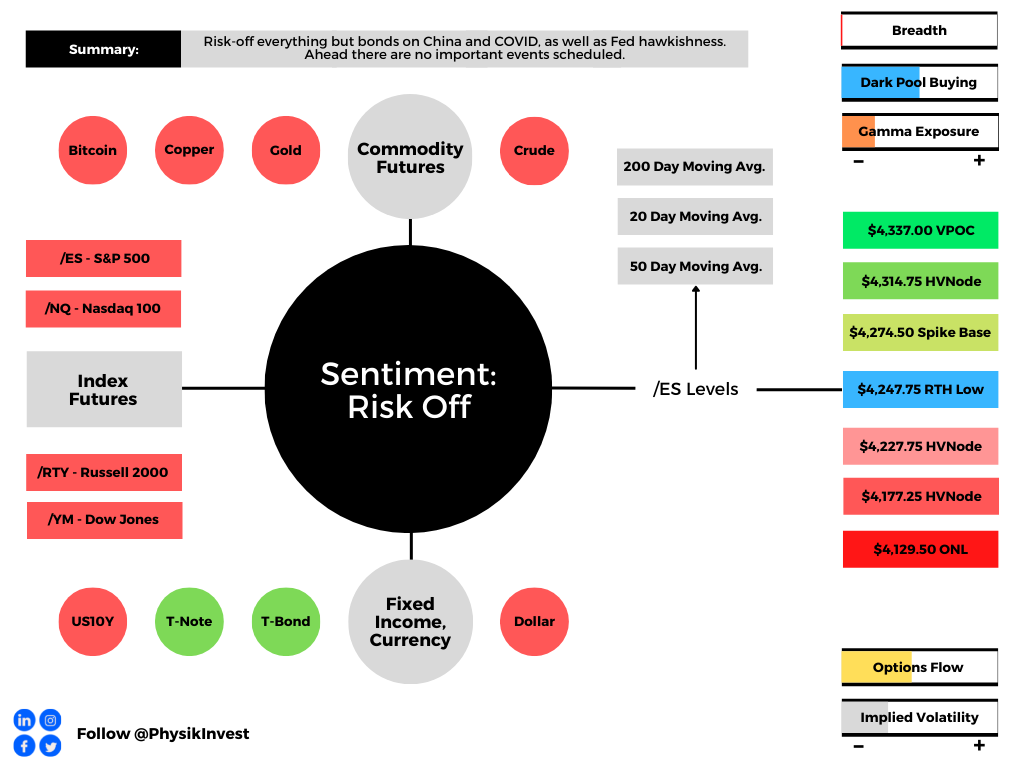
Overnight, equity index futures took back a small chunk of Wednesday’s post-Federal Open Market Committee (FOMC) advance. Both bonds and equity indexes were lower while most commodities and the dollar were bid.

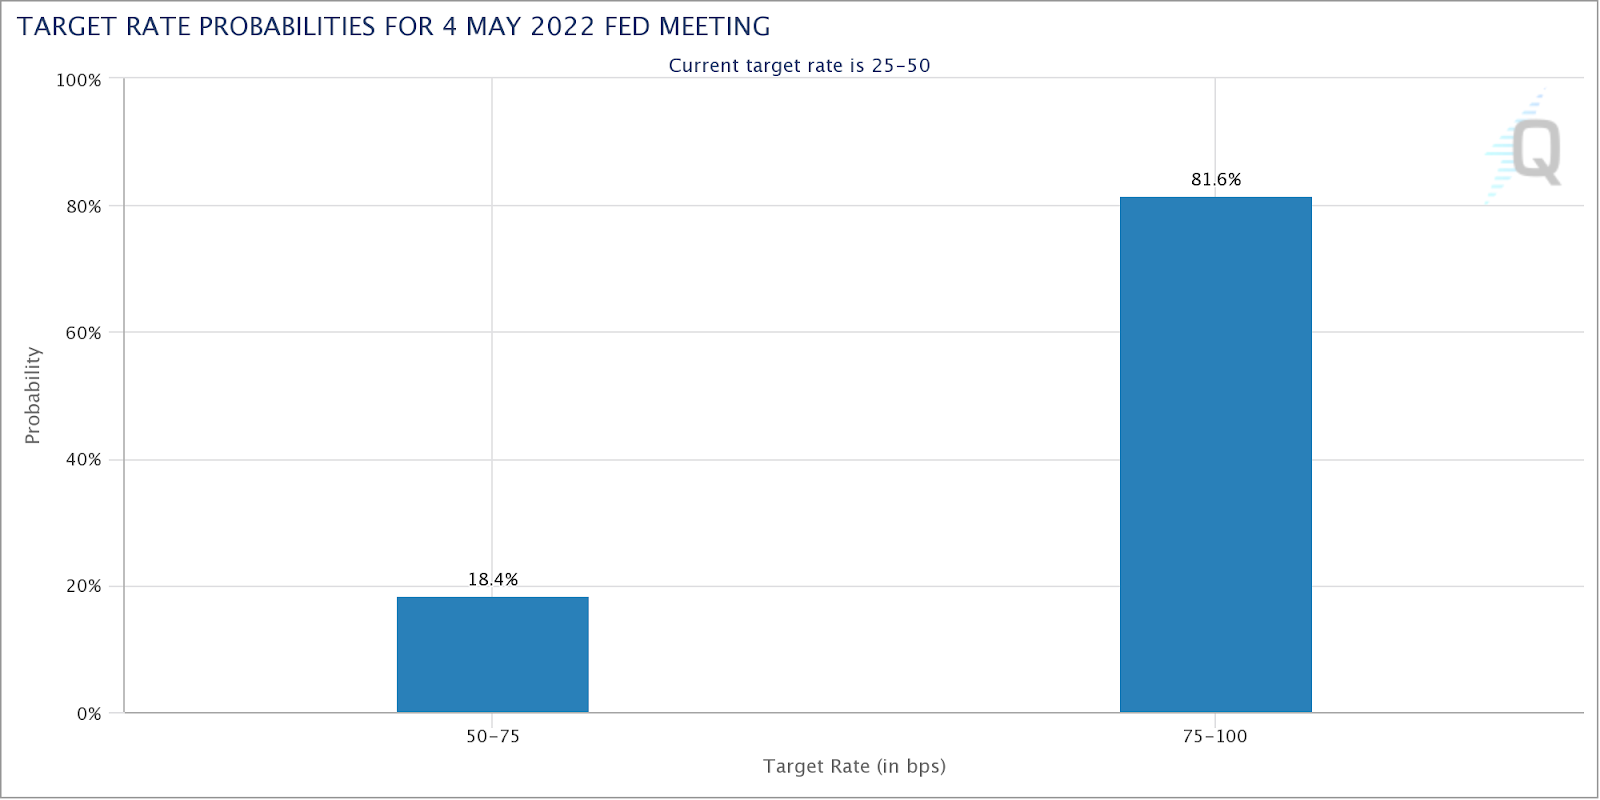
The Federal Reserve hiked interest rates by 50 basis points while knocking the odds of a larger hike (~0.75 or above) later this year, all else equal. The Fed’s holdings of U.S. Treasuries (UST) and mortgage-backed securities (MBS) are set to fall starting June 1.

As expected, the Fed will cut $95 billion a month from its holdings, split between $60 billion of USTs and $35 billion of MBS, per Reuters, in the span of three months.

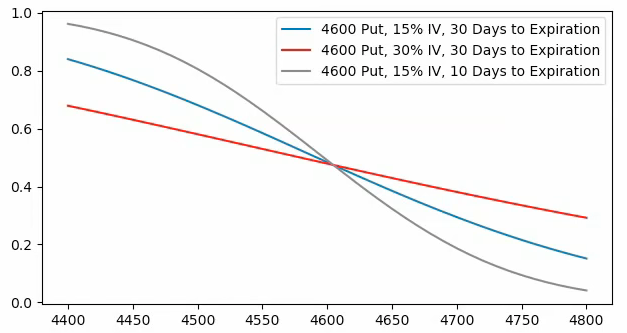
Heading into the FOMC event, markets were sold and protection, particularly that which is shorter-dated, was demanded. This was evidenced via metrics like the VIX’s term structure which had short- and mid-term VIX futures prices higher than those that are longer-term.

The compression of implied volatility after the event affecting existing concentrations of options positioning, particularly at the short-end, coupled with lackluster options buying and selling at the index level, has us questioning the rally’s sustainability.

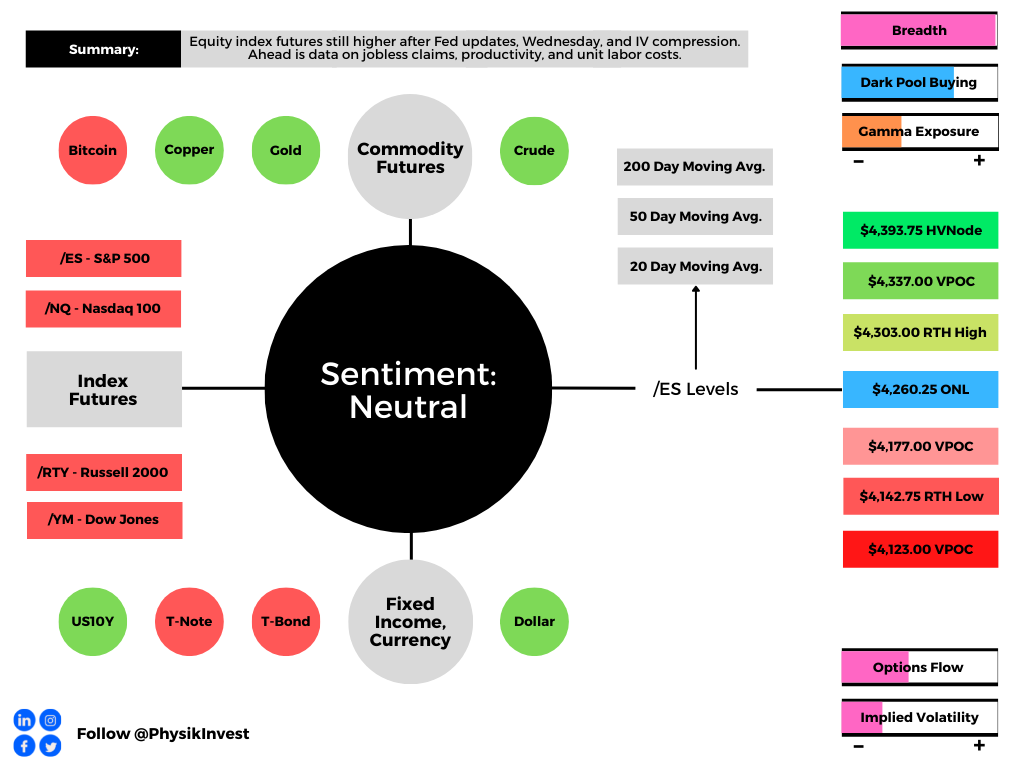
Ahead is data on jobless claims, productivity, and unit labor costs (8:30 AM ET).

Graphic updated 6:40 AM ET. Sentiment Neutral if expected /ES open is inside of the prior day’s range. /ES levels are derived from the profile graphic at the bottom of the following section. Levels may have changed since initially quoted; click here for the latest levels. SqueezeMetrics Dark Pool Index (DIX) and Gamma (GEX) calculations are based on where the prior day’s reading falls with respect to the MAX and MIN of all occurrences available. A higher DIX is bullish. At the same time, the lower the GEX, the more (expected) volatility. Learn the implications of volatility, direction, and moneyness. SHIFT data used for S&P 500 (INDEX: SPX) options activity. Note that options flow is sorted by the call premium spent; if more positive, then more was spent on call options. Breadth reflects a reading of the prior day’s NYSE Advance/Decline indicator. VIX reflects a current reading of the CBOE Volatility Index (INDEX: VIX) from 0-100.

What To Expect

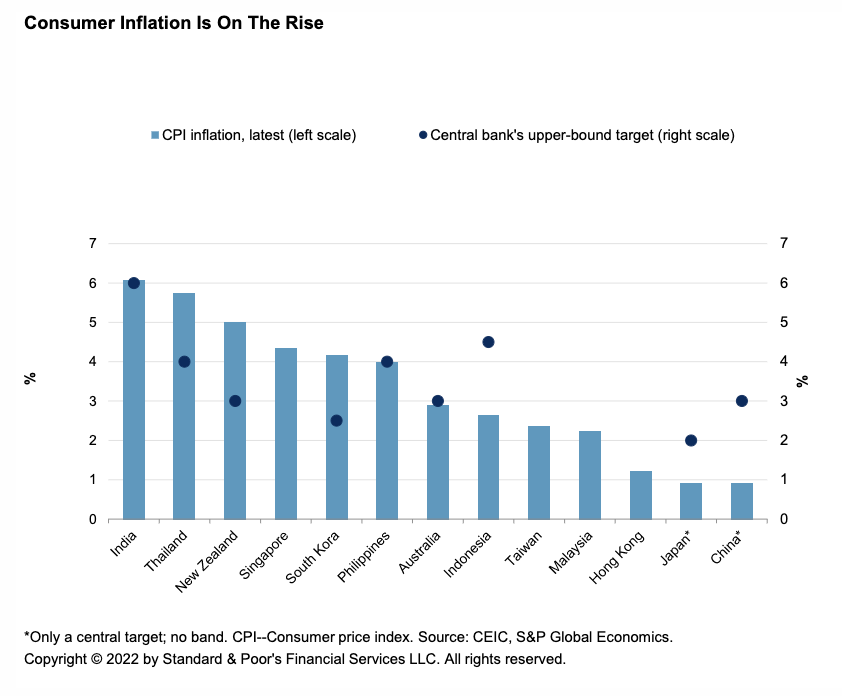
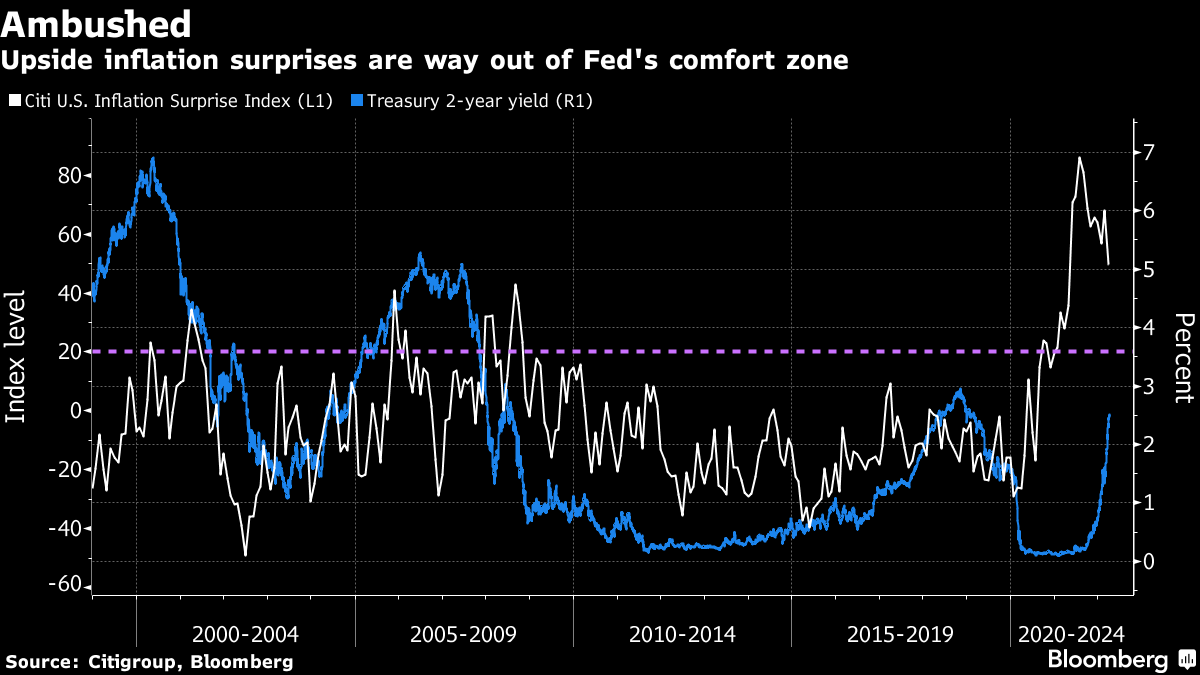
Fundamental: The Fed is raising rates and reducing the size of its balance sheet in light of the economy’s “strong underlying momentum,” as Nordea Bank (OTC: NRDBY) research puts it, a hot labor market and elevated inflation.

During a press conference after the release of meeting statements, the Fed’s Jerome Powell assuaged participants of their fears regarding a 75 basis point hike in later meetings.

Instead, it’s likely the fed tightens twice more by 50 basis points before scaling back to 25 basis point hikes, helping bring inflation down to the 2% target.

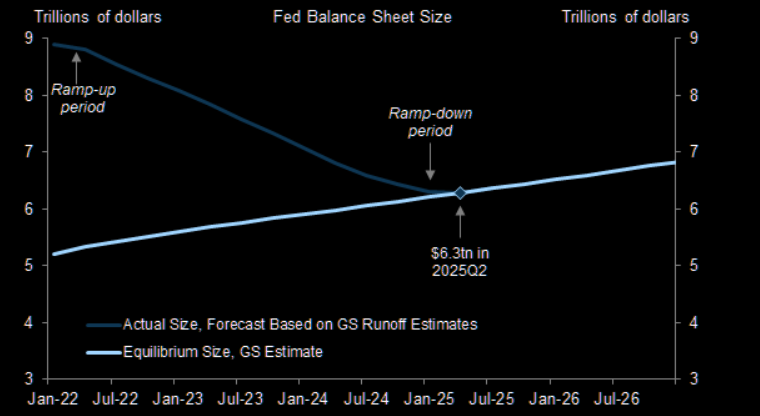
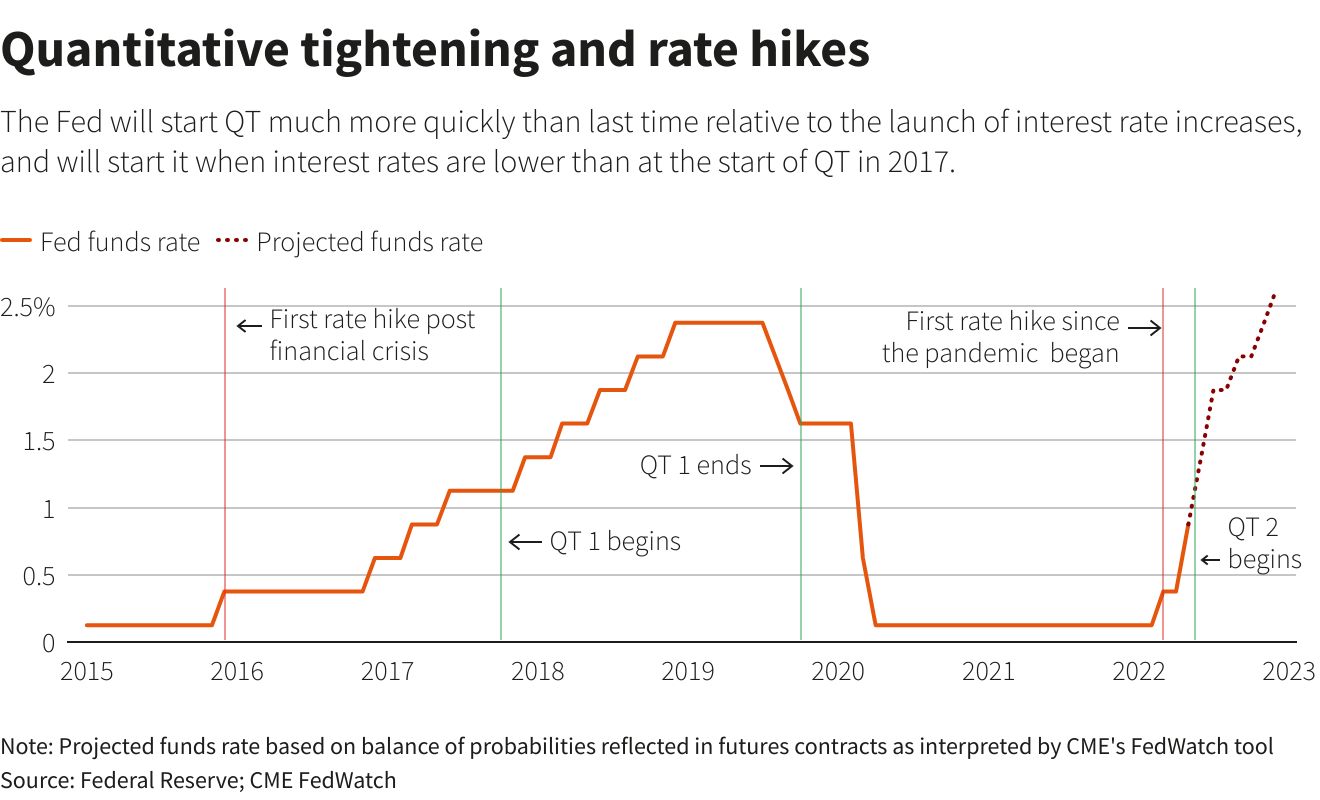
On June 1, the Fed will start the process of balance sheet reduction at $47.5 billion ($30B UST and $17.5B MBS) a month for the first three months. This will increase to $95 billion ($60B UST and $35B MBS), after, “roughly double the maximum pace of $50 billion a month targeted in the 2017-2019 cycle.”

With QT, central banks remove assets from their balance sheet “either through the sale of assets they had purchased or deciding against reinvesting the principal sum of maturing securities,” as JH Investment Management explains

Since March, the Fed’s balance sheet was at $9 trillion, steadied by the reinvestment of proceeds from maturing securities. After a small run-up, starting in September, the Fed will allow for a maximum of $95 billion to roll off without reinvestment.

Per MarketWatch, “In this cycle, one key to markets is when the Fed might actually sell some of its holdings of mortgages $2.7 trillion. This will ripple out through U.S. debt markets.”

This, however, “would be announced well in advance,” enabling “suitable progress toward a longer-run … portfolio composed primarily of Treasury securities.”

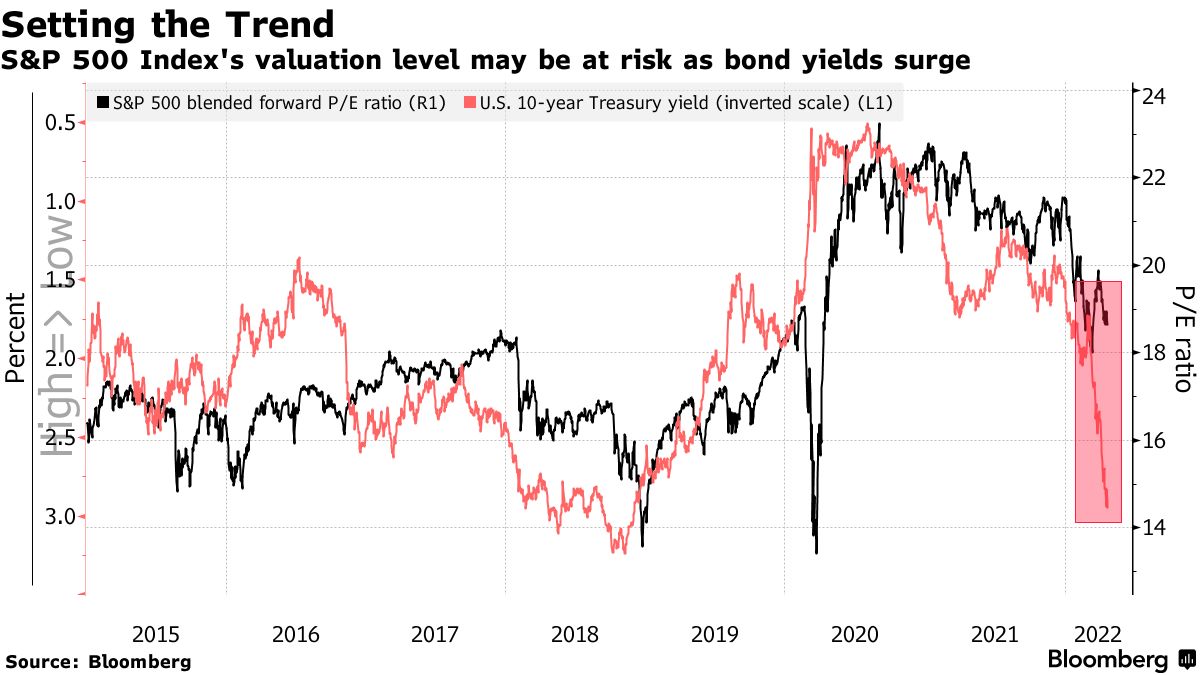
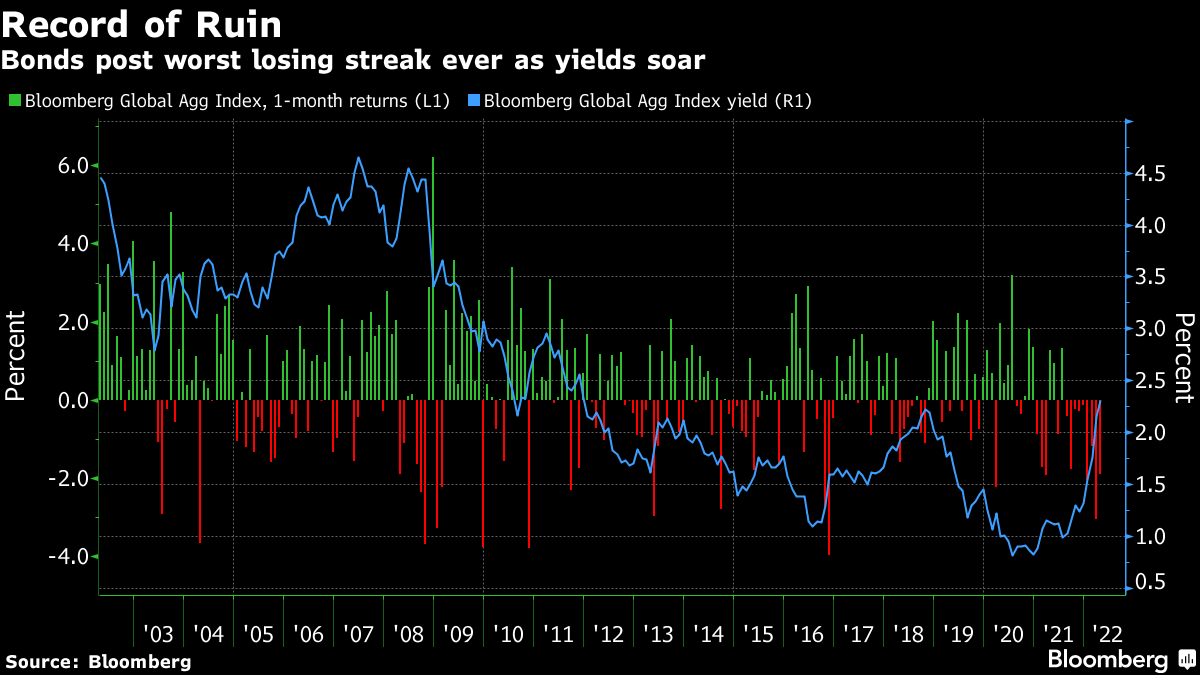
When bonds fall in value, their yields rise. This may have the effect of driving yield-hungry investors into relatively less risky asset categories.

Graphic: Via Reuters.

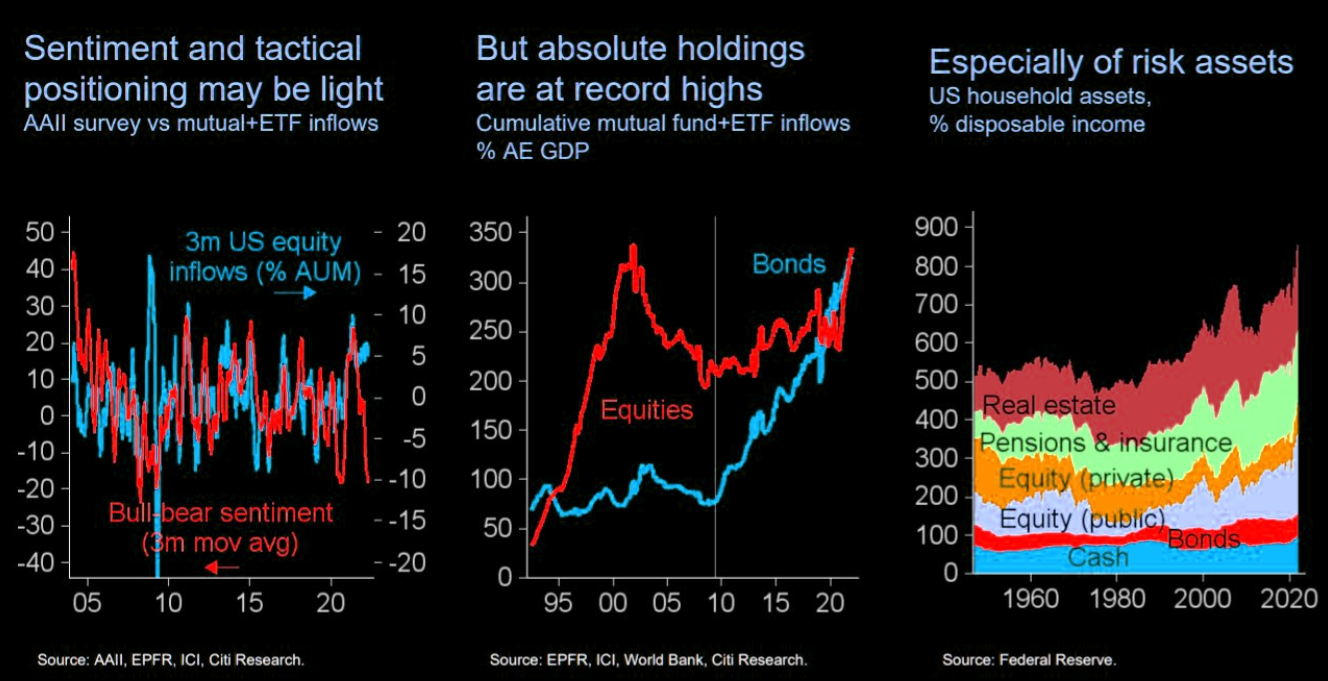
Positioning: There was a large squeeze, post-FOMC. 

The prevailing narrative is that participants’ fears, with respect to how aggressive the Fed would tighten, were assuaged.

Per Standard Chartered’s (OTC: SCBFY) Steve Englander, at its core, “it is fair to say that positioning and excess pessimism reflect a big part of the market reaction.” ​​

“Overall, the tone was much more balanced than at the January and March FOMC meetings.”

As discussed in the past few letters, markets were stretched and participants were demanding protection in size. To quote the May 2 letter:

“Barring a worst-case scenario, if markets do not perform to the downside (i.e., do not trade lower), those highly-priced (often very short-dated) bets on direction will quickly decay, and hedging flows with respect to time and volatility may bolster sharp rallies.” 

Graphic: Via SpotGamma. “SPX prices X-axis. Option delta Y-axis. When the factors of implied volatility and time change, hedging ratios change. For instance, if SPX is at $4,700.00 and IV jumps 15% (all else equal), the dealer may sell an additional 0.2 deltas to hedge their exposure to the addition of a positive 0.2 delta. The graphic is for illustrational purposes, only.”

That’s precisely what happened. The question now is whether there’s a sustained reversal. 

Based on SpotGamma’s Hedging Impact of Real-Time Options Indicator (HIRO), participants’ reaction to the FOMC was lackluster and capital was not committed to bets further out in price and time at higher or lower prices. 

Graphic: SpotGamma’s Hedging Impact of Real-Time Options (HIRO) indicator for SPY. Capital was not committed to bets further out in price and time at higher or lower prices. 

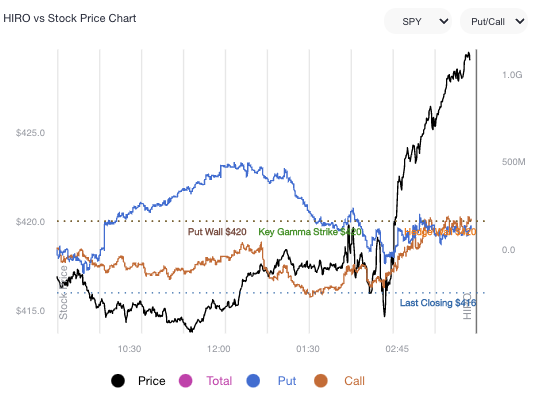
If participants start to concentrate their bets at higher prices, further out in time, that confirms the odds of sustained follow-through. If not, it’s likely that indexes, after a short-term relief, will succumb to fundamental weaknesses.

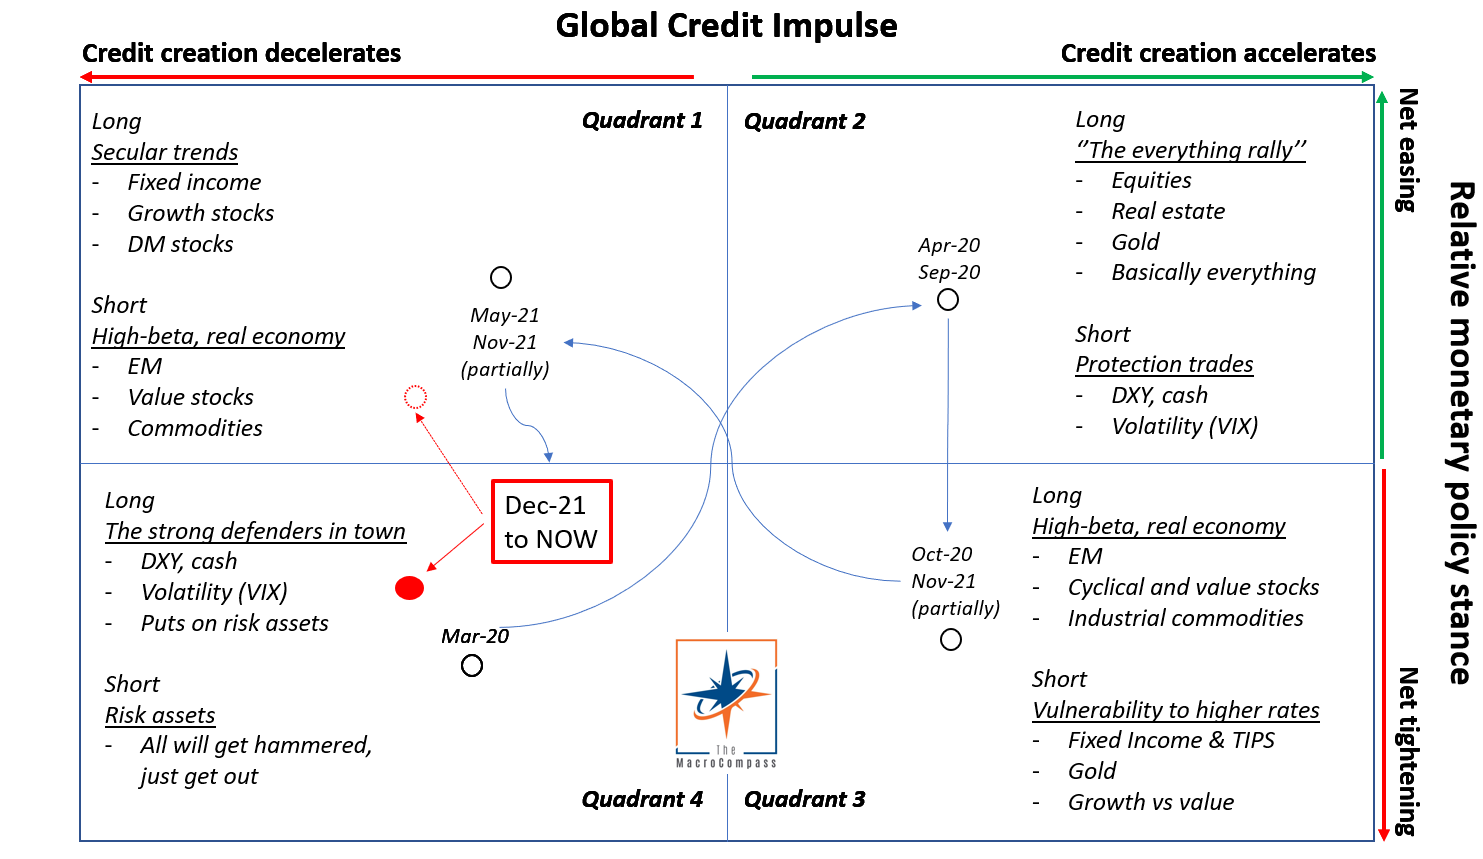
According to Kai Volatility’s Cem Karsan, the rally was purely a function of “structural buyback” and the baseline is that the bear trend holds.

This is because Fed is expected to continue withdrawing liquidity, and this will prompt risk assets to converge with fundamentals as “QT is a direct flow of capital to capital markets.”

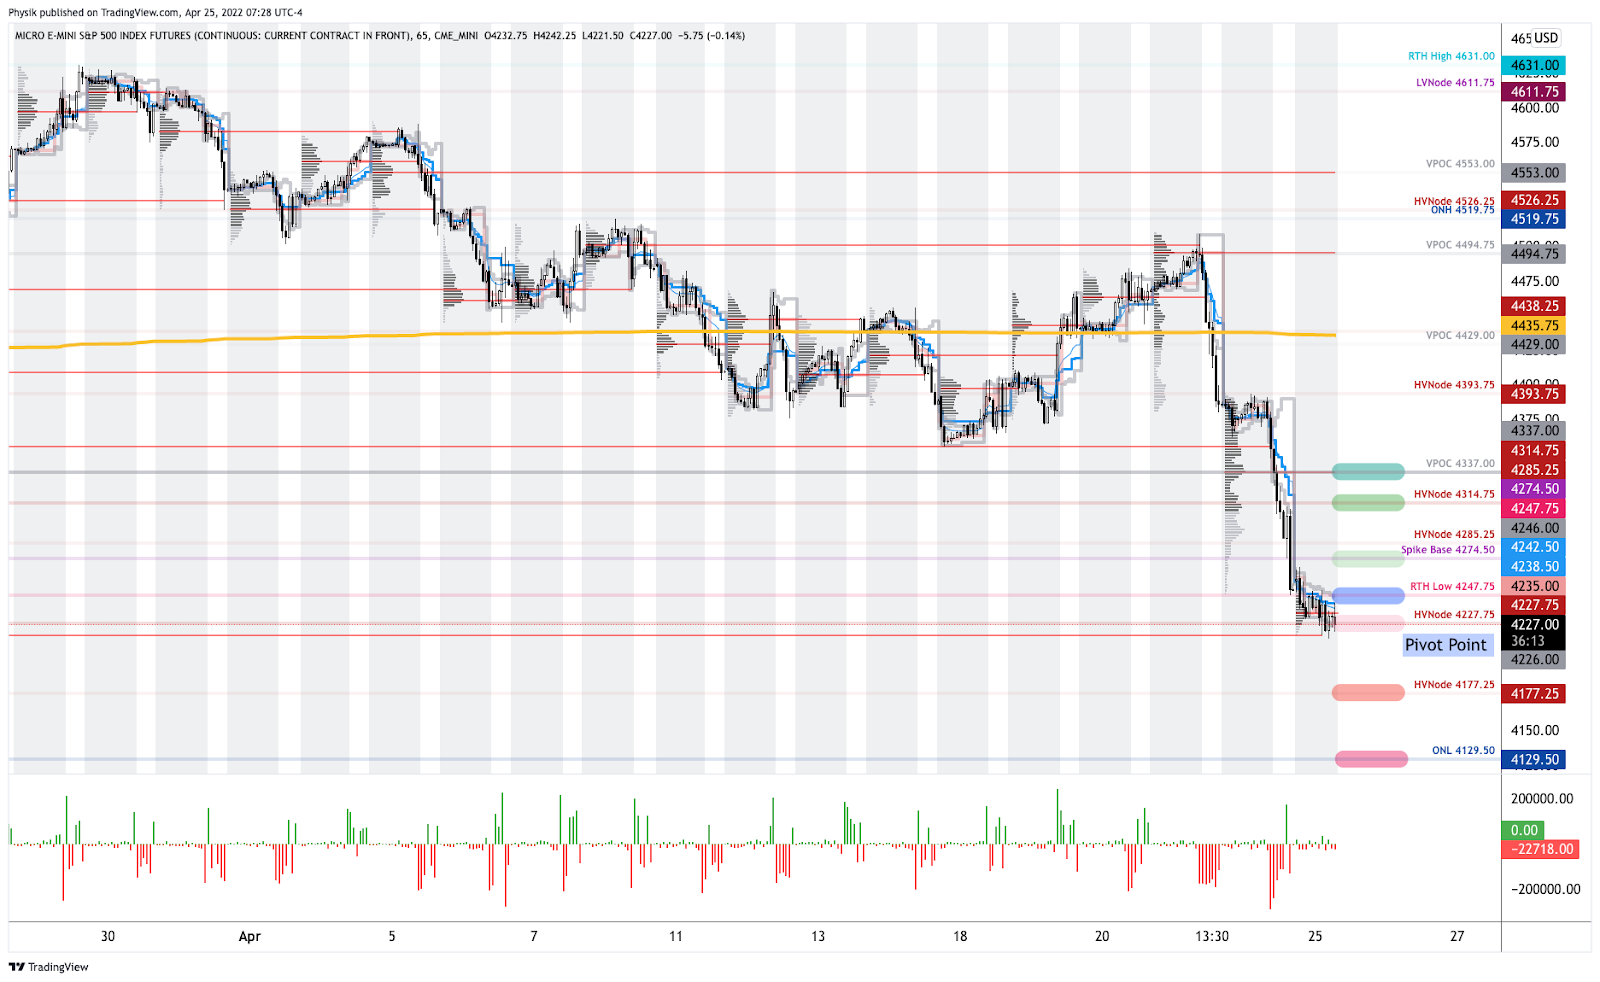
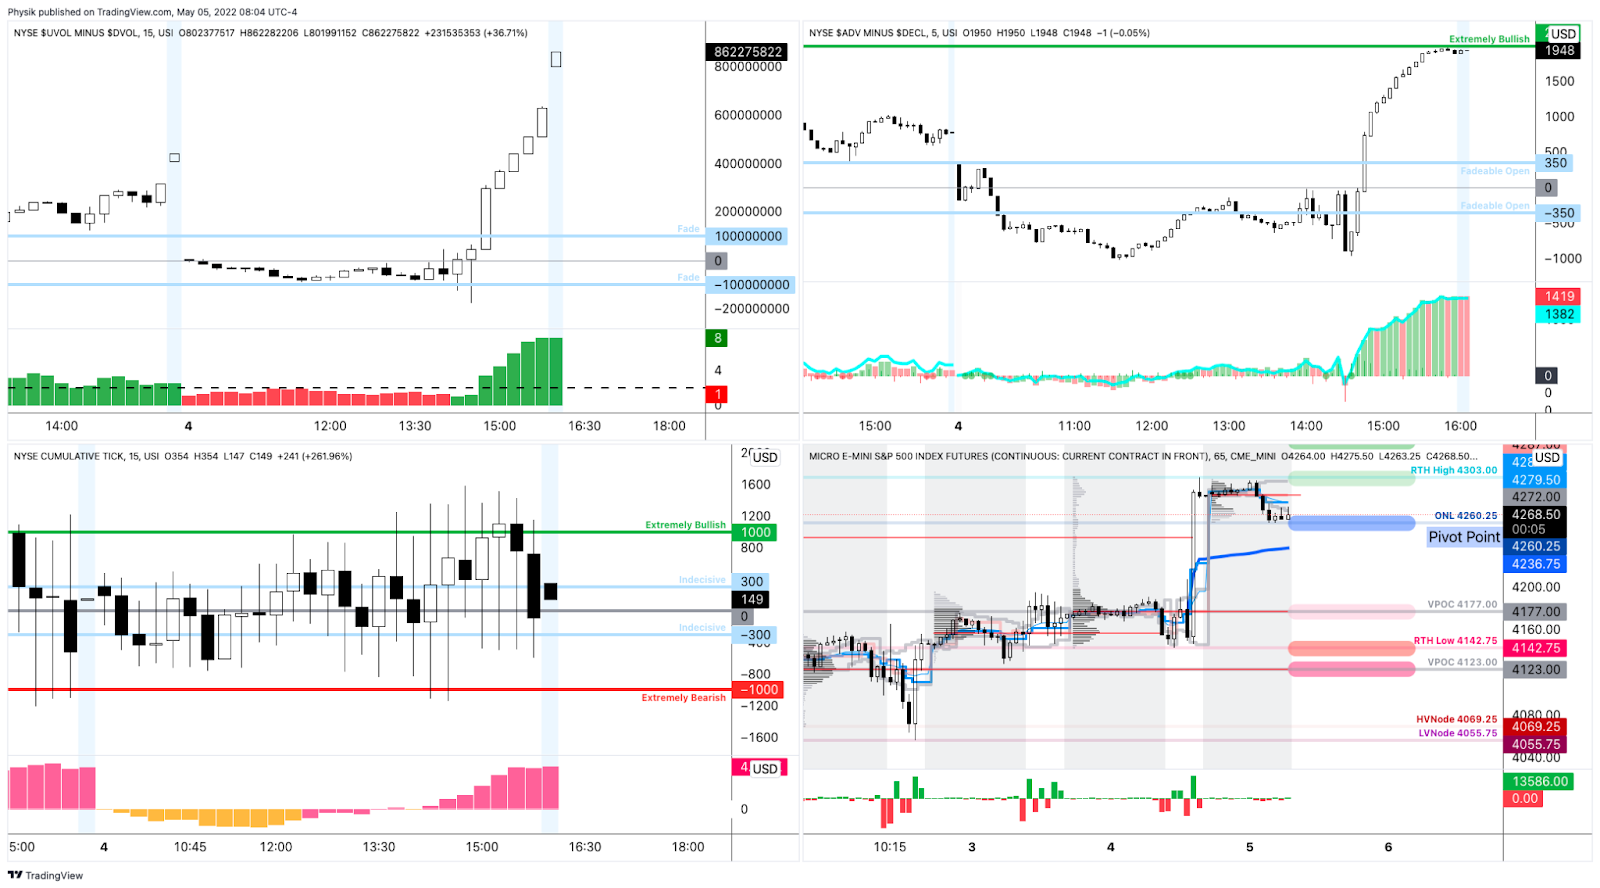
Technical: As of 6:30 AM ET, Thursday’s regular session (9:30 AM – 4:00 PM ET), in the S&P 500, will likely open in the lower part of a negatively skewed overnight inventory, inside of prior-range and -value, suggesting a limited potential for immediate directional opportunity.

In the best case, the S&P 500 trades higher; activity above the $4,260.25 overnight low (ONL) puts in play the $4,303.00 regular trade high (RTH High). Initiative trade beyond the RTH High could reach as high as the $4,337.00 untested point of control (VPOC) and $4,393.75 high volume area (HVNode), or higher.

In the worst case, the S&P 500 trades lower; activity below the $4,260.25 ONL puts in play the $4,177.00 VPOC. Initiative trade beyond the VPOC could reach as low as the $4,142.75 RTH Low and $4,123.00 VPOC, or lower.

Click here to load today’s key levels into the web-based TradingView charting platform. Note that all levels are derived using the 65-minute timeframe. New links are produced, daily.
Graphic: 65-minute profile chart of the Micro E-mini S&P 500 Futures. Please note that some levels have been adjusted since this graphic was made.

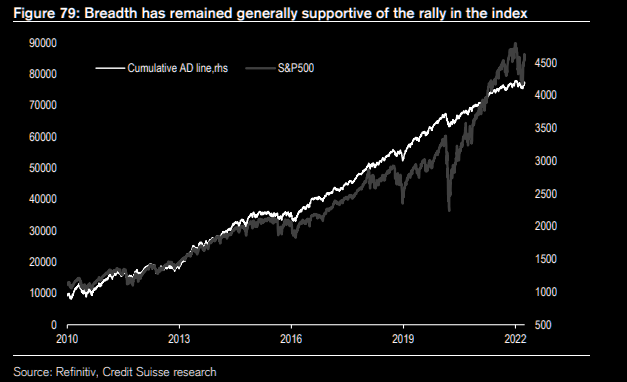
Considerations: Strong advance, yesterday, characterized by very supportive breadth.

Graphic: Market Internals as pioneered by (a mentor of mine) Peter Reznicek. Notice the indicator in the top right, weighted S&P sectors (histogram) versus unweighted (blue line). During late last week, participants sold the entire market, heavily (as supported by the difference between the volume flowing into stocks that are up versus those that are down).

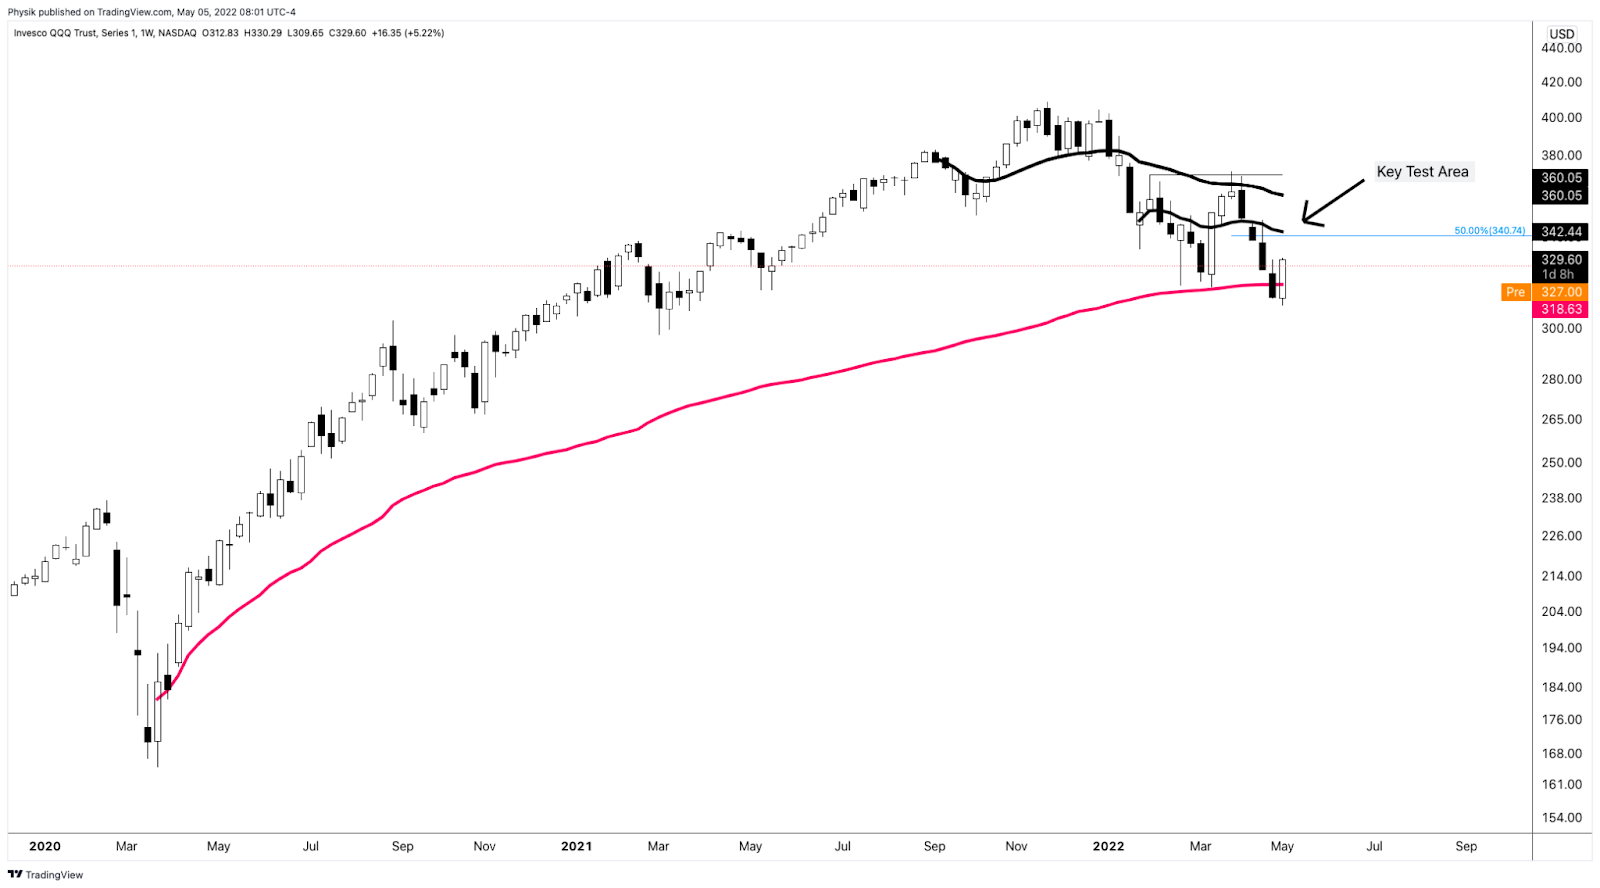
The weaker of the indexes we monitor – the Invesco QQQ Trust Series 1 (NASDAQ: QQQ) – just retook a major VWAP anchored from the lows of March 2020. 

That indicator denotes the level at which the average buyer/seller is in. In other words, that’s the fairest price to pay for Nasdaq 100 exposure (since March 2020) and, instead of being construed as a so-called supply zone, the level ought to, again, be looked at as a demand area. 

What’s next? Looks like there are some key areas where supply is likely to show. Mainly the $340.00 and $360.00 areas in the QQQ are of significance. In the SPY, those areas include $435.00 and $445.00.

Graphic: Invesco QQQ Trust Series 1 (NASDAQ: QQQ) with anchored VWAPs.

Definitions

Overnight Rally Highs (Lows): Typically, there is a low historical probability associated with overnight rally-highs (lows) ending the upside (downside) discovery process.

Volume Areas: A structurally sound market will build on areas of high volume (HVNodes). Should the market trend for long periods of time, it will lack sound structure, identified as low volume areas (LVNodes). LVNodes denote directional conviction and ought to offer support on any test. 

If participants were to auction and find acceptance into areas of prior low volume (LVNodes), then future discovery ought to be volatile and quick as participants look to HVNodes for favorable entry or exit.

POCs: POCs are valuable as they denote areas where two-sided trade was most prevalent in a prior day session. Participants will respond to future tests of value as they offer favorable entry and exit.

Volume-Weighted Average Prices (VWAPs): A metric highly regarded by chief investment officers, among other participants, for quality of trade. Additionally, liquidity algorithms are benchmarked and programmed to buy and sell around VWAPs.

About

After years of self-education, strategy development, mentorship, and trial-and-error, Renato Leonard Capelj began trading full-time and founded Physik Invest to detail his methods, research, and performance in the markets.

Capelj also develops insights around impactful options market dynamics at SpotGamma and is a Benzinga reporter.

Some of his works include conversations with ARK Invest’s Catherine Wood, investors Kevin O’Leary and John Chambers, FTX’s Sam Bankman-Fried, Kai Volatility’s Cem Karsan, The Ambrus Group’s Kris Sidial, among many others.

Disclaimer

In no way should the materials herein be construed as advice. Derivatives carry a substantial risk of loss. All content is for informational purposes only.

Categories
Commentary

Daily Brief For April 25, 2022

Editor’s Note: Wow, what a month! Looks like there was a ton of volatility we weren’t able to navigate together.

I’m back now and will be making changes to both the quantity and quality of notes sent. In total transparency, I took on way too much work, and quality suffered a tad. I look forward to making things a bit more sustainable and am grateful for your interest in remaining a subscriber.

Interested in getting this free glimpse into the prevailing fundamental and technical drivers of U.S. equity market products. Join the 200+ that read this report daily, below, today!

What Happened

Overnight, the equity index and most commodity futures explored lower. Bonds and implied volatility metrics were bid.

This is alongside news that China’s reaction to a local COVID-19 outbreak may feed into global slowdowns just as supply pressures, among other things, are pushing the Federal Reserve (Fed) to adopt a more hawkish policy stance.

Notable is the pace at which China’s yuan is falling. 

Per TD Securities, it suggests “the PBOC is utilizing the yuan as another tool to provide stimulus to the economy at a time when they are showing restraint on the monetary policy front.” 

Ahead, there are no important economic events scheduled. See who is reporting earnings, here.

Graphic updated 7:30 AM ET. Sentiment Risk-Off if expected /ES open is below the prior day’s range. /ES levels are derived from the profile graphic at the bottom of the following section. Levels may have changed since initially quoted; click here for the latest levels. SqueezeMetrics Dark Pool Index (DIX) and Gamma (GEX) calculations are based on where the prior day’s reading falls with respect to the MAX and MIN of all occurrences available. A higher DIX is bullish. At the same time, the lower the GEX, the more (expected) volatility. Learn the implications of volatility, direction, and moneyness. SHIFT data used for S&P 500 (INDEX: SPX) options activity. Note that options flow is sorted by the call premium spent; if more positive, then more was spent on call options. Breadth reflects a reading of the prior day’s NYSE Advance/Decline indicator. VIX reflects a current reading of the CBOE Volatility Index (INDEX: VIX) from 0-100.

What To Expect

Fundamental: A push-and-pull, continues.

At a high level, it was surmised that many of the responses to geopolitical tension and inflation were priced in. The economy, since early pandemic disruptions, has strengthened and the need for ultra-accommodative policies is no more.

Graphic: Via S&P Global Inc (NYSE: SPGI).

That means low rates and quantitative easing (QE) – easy money so to speak – are on the way out, at least for the time being.

Recall that QE is a policy to expand the Federal Reserve’s balance sheet “to provide monetary accommodation, typically when interest rates are at a zero-lower bound (when nominal interest rates are at, or near, zero),” as JH Investment Management explains.

With QT, central banks remove assets (e.g., government bonds they bought from the private sector) from their balance sheet “either through the sale of assets they had purchased or deciding against reinvesting the principal sum of maturing securities.”

With that, we note that when bonds rise in value, their yields decline; “when the Fed embarks on bond-buying program[s] to support the U.S. economy, … [it nudges] the prices of these assets higher while pushing yields lower, which also has the effect of driving yield-hungry investors into relatively riskier asset categories that promise high returns.”

Graphic: Via ICI. Taken from The Market Ear.

As a result, participants’ demand for risk assets prompts their divergence from fundamentals. As liquidity is removed and funding costs increase, this may prompt risk assets to converge with fundamentals.

This is because, for investors to take on additional risk for return, they must receive in excess of the risk-free rate (as provided by the Treasury). This excess is the risk premium.

Previously, as the Damped Spring’s Andy Constan had previously commented, “[a]dditional risk premium expansion pressures from these levels is not likely.”

“However, if, in the unlikely event, details of QT do emerge suggesting a start of QT before June and at a greater size than expected, we would no longer be willing to hold [risk] assets as that would cause an end to any risk premium contraction possibilities.”

Well, that’s what happened in early April when Fed members said their debt holdings would be reduced “at a rapid pace” as soon as May, as well as hike rates, faster. 

“Given that the recovery has been considerably stronger and faster than in the previous cycle, I expect the balance sheet to shrink considerably more rapidly than in the previous recovery,” the Fed’s Lael Brainard said

The Fed may even raise “caps” on the pace of QT.

Graphic: Via The Market Ear. Goldman Sachs Group Inc (NYSE: GS) sees the balance sheet shrinking “to an equilibrium size of just over $6tn by early- or mid-2025, though there is substantial uncertainty about its terminal size.”

Per CME Group Inc’s (NASDAQ: CME) FedWatch Tool, market participants are pricing a near-100% probability that the Fed will move the target rate to 75-100 bps (+50 or +75 bps).

Graphic: Via CME Group Inc. FedWatch Tool suggests a near-100% chance of a Fed hike that moves the target rate between 75 and 100 bps.

At a high-level, rates hikes take time to flow through to the economy while “QT is a direct flow of capital to capital markets or flow out of,” according to statements by Kai Volatility’s Cem Karsan. 

“An increase in the pace of tightening of QT should mean lower stocks, wider credit spreads and a slight reduction in the need for front-end hikes,” explains Kevin Muir of the MacroTourist.

“Using the balance sheet as a tightening tool represents a large change in the Fed’s attitude, and IS NOT priced into the market.”

Graphic: Bloomberg. “Everyone bearish, but redemptions just starting,” said BofA strategists led by Michael Hartnett, adding that the environment of “extreme inflation” and rates shock is just setting in, as the Federal Reserve tightens monetary policy. “75 basis points is the new 25 basis points,” Hartnett said, referring to the scope of future interest-rate hikes.

As an aside, adding to earlier comments on the yuan’s fall, Bob Parker, a senior adviser at Credit Suisse Group AG (NYSE: CS) explains that “When Chinese investors lose confidence in their own economy/markets, capital outflows from China accelerate, … [and] this, then, leads to a central bank which has to prop up the currency by selling some of the country’s huge reserve piles.” 

“Part of their reserves will have been/are in U.S. equities so as the reserves fall, they are natural sellers of the S&P.”

Graphic: Via Refinitiv. Taken from The Market Ear. CNH versus SPX.

Positioning: In a comparison of options positioning and passive buying support, the returns distribution is skewed positive and points to building support for a potential short-term bounce.

Graphic: Via Physik Invest. Data via SqueezeMetrics.

The most recent liquidation resulted in participants reaching for protection and this exacerbated movement to the downside amidst the reflexive hedging.

As this short-dated exposure decays, the counterparts’ hedges are to be tapered and this may assist in the market hammering out a bottom or rallying. 

On the contrary, however, as SpotGamma explained in a recent note, “[t]op of mind as we head into new trade on Monday is the likelihood traders will not aggressively sell volatility (i.e., if they sell volatility -> that drives volatility lower -> resulting in hedging flows that support the market) until the FOMC (5/4) and/or some resolution on the geopolitical front.”

“Therefore, [] expect larger trading ranges this upcoming week.”

Technical: As of 6:30 AM ET, Monday’s regular session (9:30 AM – 4:00 PM ET), in the S&P 500, will likely open in the lower part of a negatively skewed overnight inventory, outside of prior-range and -value, suggesting a potential for immediate directional opportunity.

In the best case, the S&P 500 trades higher; activity above the $4,247.75 regular trade low (RTH Low) puts in play the $4,274.50 spike base. Initiative trade beyond the spike base could reach as high as the $4,314.75 high volume area (HVNode) and $4,337.00 untested point of control (VPOC), or higher.

In the worst case, the S&P 500 trades lower; activity below the $4,247.75 RTH Low puts in play the $4,227.75 HVNode. Initiative trade beyond the $4,227.75 HVNode could reach as low as the $4,177.25 HVNode and $4,129.50 overnight low (ONL), or lower.

Considerations: Spikes mark the beginning of a break from value. Spikes higher (lower) are validated by trade at or above (below) the spike base (i.e., the origin of the spike).

In a spike up (down) situation, trade below (above) the spike base, negates the buying (selling).

Click here to load today’s key levels into the web-based TradingView charting platform. Note that all levels are derived using the 65-minute timeframe. New links are produced, daily.
Graphic: 65-minute profile chart of the Micro E-mini S&P 500 Futures.

What People Are Saying

Definitions

Overnight Rally Highs (Lows): Typically, there is a low historical probability associated with overnight rally-highs (lows) ending the upside (downside) discovery process.

Volume Areas: A structurally sound market will build on areas of high volume (HVNodes). Should the market trend for long periods of time, it will lack sound structure, identified as low volume areas (LVNodes). LVNodes denote directional conviction and ought to offer support on any test. 

If participants were to auction and find acceptance into areas of prior low volume (LVNodes), then future discovery ought to be volatile and quick as participants look to HVNodes for favorable entry or exit.

POCs: POCs are valuable as they denote areas where two-sided trade was most prevalent in a prior day session. Participants will respond to future tests of value as they offer favorable entry and exit.

About

After years of self-education, strategy development, mentorship, and trial-and-error, Renato Leonard Capelj began trading full-time and founded Physik Invest to detail his methods, research, and performance in the markets.

Capelj also develops insights around impactful options market dynamics at SpotGamma and is a Benzinga reporter.

Some of his works include conversations with ARK Invest’s Catherine Wood, investors Kevin O’Leary and John Chambers, FTX’s Sam Bankman-Fried, Kai Volatility’s Cem Karsan, The Ambrus Group’s Kris Sidial, among many others.

Disclaimer

In no way should the materials herein be construed as advice. Derivatives carry a substantial risk of loss. All content is for informational purposes only.

Categories
Commentary

Daily Brief For April 11, 2022

Hey team, you’re going to have to forgive me. Still am traveling through the rest of this month. Therefore, coverage will remain sporadic and less in-depth. Apologies and take care!

What Happened

Overnight, equity index futures were mixed after last week’s liquidation alongside news that the Federal Reserve was interested in sharper interest-rate hikes and balance-sheet reductions to stem inflation. 

China equities were weak on the implications of COVID-19 outbreaks, among other things. 

Some Russian entities entered into effective default, as ruled by markets. The conflict between Russia and Ukraine, that spurred crippling economic sanctions, is ongoing. 

And, in other news, some Bitcoin (CRYPTO: BTC) pundits suggest weakness in risk assets, like technology, may bring down cryptocurrency. 

Crypto prices “do not trade on the fundamentals of being peer-to-peer, decentralized, censorship-resistant digital networks designed for the transfer of money,” explained BitMEX founder Arthur Hayes on correlations with the Nasdaq 100 trading at record highs. 

Crypto “will lead equities lower as we head into the downturn, and lead equities higher as we work our way out of it.”

Ahead is data on NY Fed median 1- and 3-year expected inflation (11:00 AM ET). Fed-speak by Charles Evans (12:40 PM ET). The quarterly earnings season begins this week. Bank stocks to start reporting Wednesday, April 13.

Graphic updated 6:45 AM ET. Sentiment Risk-Off if expected /ES open is below the prior day’s range. /ES levels are derived from the profile graphic at the bottom of the following section. Levels may have changed since initially quoted; click here for the latest levels. SqueezeMetrics Dark Pool Index (DIX) and Gamma (GEX) calculations are based on where the prior day’s reading falls with respect to the MAX and MIN of all occurrences available. A higher DIX is bullish. At the same time, the lower the GEX, the more (expected) volatility. Learn the implications of volatility, direction, and moneyness. SHIFT data used for S&P 500 (INDEX: SPX) options activity. Note that options flow is sorted by the call premium spent; if more positive, then more was spent on call options. Breadth reflects a reading of the prior day’s NYSE Advance/Decline indicator. VIX reflects a current reading of the CBOE Volatility Index (INDEX: VIX) from 0-100.

What To Expect

Fundamental: The ruling narrative, so to speak, is concerned with the management of inflation through monetary policies, credit impulse contractions, as well as the implications of Russia’s invasion of Ukraine, China’s COVID-19 actions, and beyond.

Graphic: Via The Macro Compass.

The Federal Reserve’s (Fed) roadmap for shrinking the balance sheet and raising rates was revealed in the recent release of Federal Open Market Committee (FOMC) minutes. 

“The FOMC stayed far too easy for far too long and has belatedly realized their mistake,” said Stephen Stanley, chief economist at Amherst Pierpont Securities LLC. 

“They are now scrambling to get policy back to neutral as quickly as they can. Once they arrive at something close to neutral, they will have to ascertain over time how far into restrictive territory they have to move to get inflation back under control.”

Graphic: Via Bloomberg.

Moreover, as talked about in past commentaries, quantitative tightening (QT) amplifies the impact of rate hikes.

Per statements by JH Investment Management, through QT, central banks remove assets from their balance sheet. This is “either through the sale of assets they purchased or deciding against reinvesting the principal sum of maturing securities.” 

With that, we note that when bonds rise in value, their yields decline; “when the Fed embarks on bond-buying program[s] to support the U.S. economy, … [it nudges] the prices of these assets higher while pushing yields lower, which also has the effect of driving yield-hungry investors into relatively riskier asset categories that promise high returns.”

As liquidity is removed, this may prompt risk assets to converge with fundamentals.

Graphic: Via Bloomberg. Bonds continue their losing streak. This is amid end-of-quarter rebalancing inflows; “Bonds performed so poorly in the past month that exchange-traded fund investors were forced to buy in record amounts.”

At present, via CME Group Inc’s (NASDAQ: CME) FedWatch tool, participants are pricing in a heightened probability of a half-point hike next month.

Graphic: Via CME Group Inc. FedWatch tool.

Notwithstanding, per Credit Suisse Group AG (NYSE: CS) research, there has been no meaningful breadth disconnect; breadth remains supportive of higher S&P 500 prices.

Via: Credit Suisse research. Taken from The Market Ear.

At the same time, JPMorgan Chase & Co’s (NYSE: JPM) Mislav Matejka sees continued gains in earnings while equity versus credit and bond yields are still supportive of valuations.

Positioning: Keeping this section light, today.

After quarterly rebalances and options expiries, the reduction in counterparty exposure to positive gamma freed indexes (i.e., unpinned), as expected

Why? 

We see counterparties as those participants who take the other side of customer trades. The collapse in realized volatility and the move higher in equity markets solicited counterparties’ decreased (increased) hedging of put (call) options. 

The naive assumption is that counterparties are short (long) put (call) protection. When implied volatility declines and underlyings move higher, counterparties have less (more) exposure to amplified losses (gains). 

To hedge, they sell into strength and buy into weakness, basically.

As participants start to concentrate their bets in shorter-dated expiries, at higher prices, counterparties take from underlying movement in their provision of liquidity. It takes an options expiry, or some exogenous event, to disrupt this balance. 

That happened at the end of last month. Since then, increases in implied volatility and lower underlying equity prices have helped pressure indexes and increase realized volatility.

Technical: As of 6:45 AM ET, Monday’s regular session (9:30 AM – 4:00 PM ET), in the S&P 500, will likely open in the middle part of a negatively skewed overnight inventory, outside of prior-range and -value, suggesting a potential for immediate directional opportunity.

In the best case, the S&P 500 trades higher; activity above the $4,468.75 poor low puts in play the $4,489.75 low volume area (LVNode). Initiative trade beyond the LVNode could reach as high as the $4,501.00 VPOC and $4,519.75 overnight high (ONH), or higher.

In the worst case, the S&P 500 trades lower; activity below the $4,468.75 poor low puts in play the $4,444.50 weak low. Initiative trade beyond the weak low could reach as low as the $4,409.00 VPOC and $4,395.25 high volume area (HVNode), or lower.

Considerations: Gaps ought to fill quickly. Should they not, that’s a signal of strength; do not fade. Leaving value behind on a gap-fill or failing to fill a gap (i.e., remaining outside of the prior session’s range) is a go-with indicator.

Auctioning and spending at least 1-hour of trade back in the prior range suggests a lack of conviction; in such a case, do not follow the direction of the most recent initiative activity.

Click here to load today’s key levels into the web-based TradingView charting platform. Note that all levels are derived using the 65-minute timeframe. New links are produced, daily.
Graphic: 65-minute profile chart of the Micro E-mini S&P 500 Futures.

Definitions

Overnight Rally Highs (Lows): Typically, there is a low historical probability associated with overnight rally-highs (lows) ending the upside (downside) discovery process.

Volume Areas: A structurally sound market will build on areas of high volume (HVNodes). Should the market trend for long periods of time, it will lack sound structure, identified as low volume areas (LVNodes). LVNodes denote directional conviction and ought to offer support on any test. 

If participants were to auction and find acceptance into areas of prior low volume (LVNodes), then future discovery ought to be volatile and quick as participants look to HVNodes for favorable entry or exit.

POCs: POCs are valuable as they denote areas where two-sided trade was most prevalent in a prior day session. Participants will respond to future tests of value as they offer favorable entry and exit.

Volume-Weighted Average Prices (VWAPs): A metric highly regarded by chief investment officers, among other participants, for quality of trade. Additionally, liquidity algorithms are benchmarked and programmed to buy and sell around VWAPs.

About

After years of self-education, strategy development, mentorship, and trial-and-error, Renato Leonard Capelj began trading full-time and founded Physik Invest to detail his methods, research, and performance in the markets.

Capelj also develops insights around impactful options market dynamics at SpotGamma and is a Benzinga reporter.

Some of his works include conversations with ARK Invest’s Catherine Wood, investors Kevin O’Leary and John Chambers, FTX’s Sam Bankman-Fried, Kai Volatility’s Cem Karsan, The Ambrus Group’s Kris Sidial, among many others.

Disclaimer

In no way should the materials herein be construed as advice. Derivatives carry a substantial risk of loss. All content is for informational purposes only.