
The Daily Brief is a free glimpse into the prevailing fundamental and technical drivers of U.S. equity market products. Join the 200+ that read this report daily, below!
What Happened
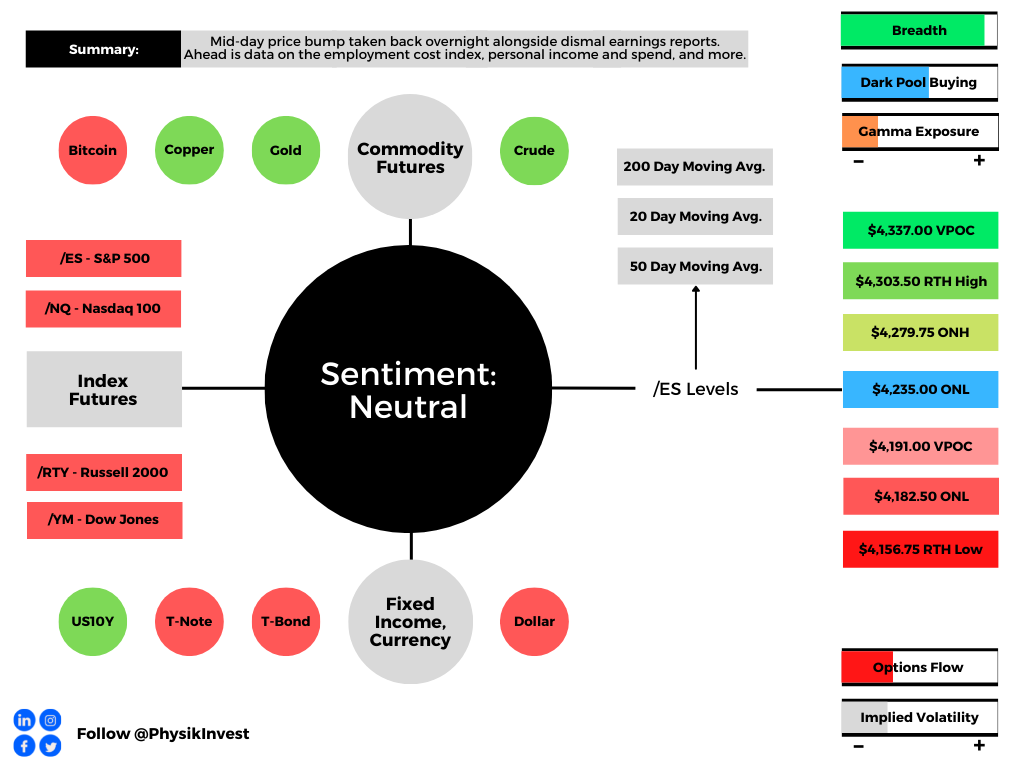
Overnight, equity index futures auctioned sideways-to-lower after a mid-day price bump Thursday, on the heels of dismal earnings, among other things including a contraction in economic growth, last quarter.
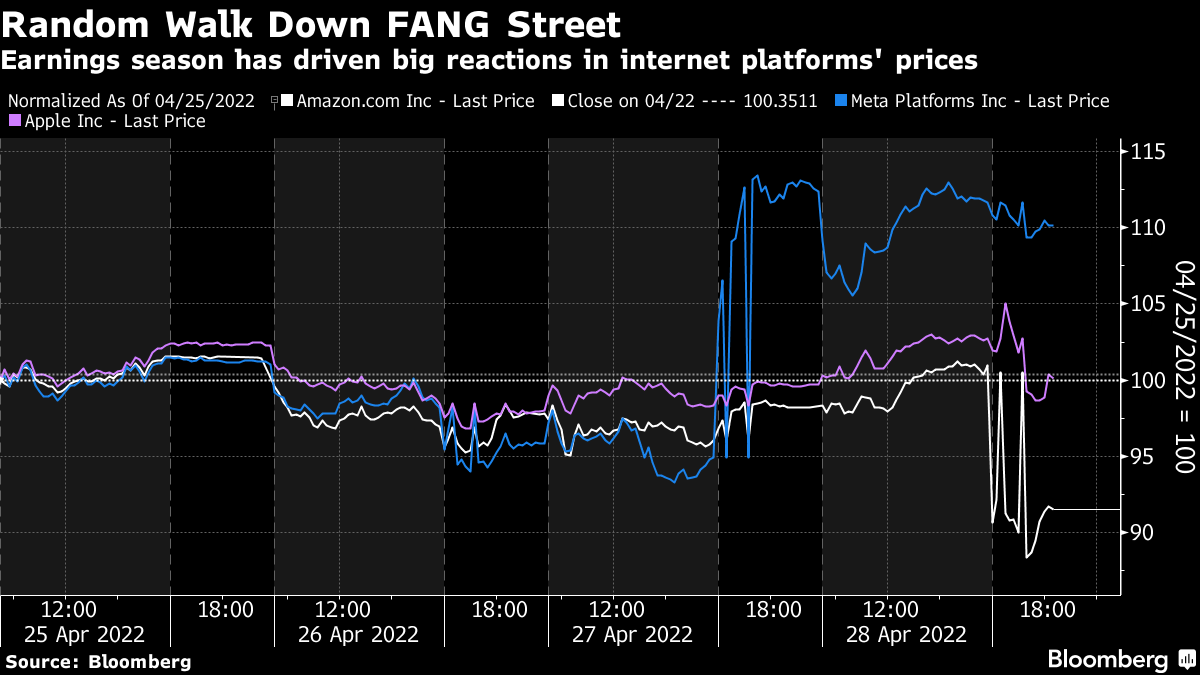
Amazon Inc (NASDAQ: AMZN) shares fell after the company projected sluggish sales as well as higher costs.
Apple Inc (NASDAQ: AAPL) saw strong sales and profit help top estimates. The company announced a $90 billion share buyback and fears over supply constraints.
Tesla Inc’s (NASDAQ: TSLA) Elon Musk offloaded $4 billion worth of shares just after his deal to buy Twitter Inc (NYSE: TWTR) was reached days before.
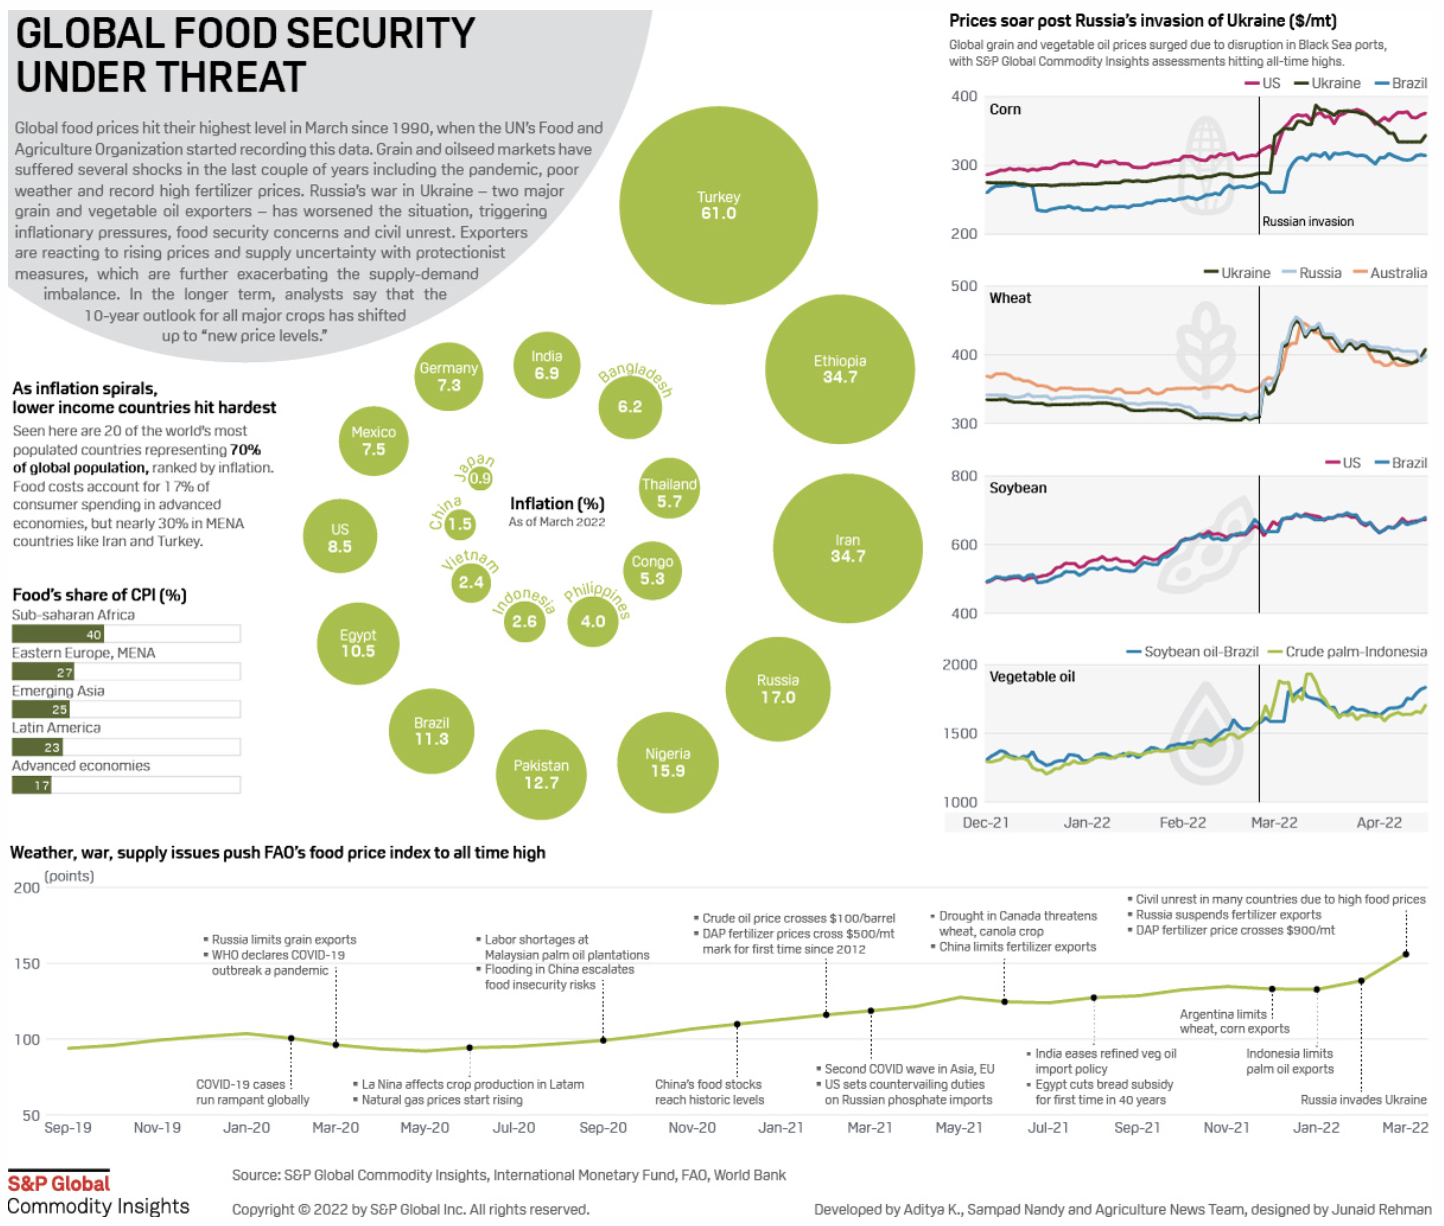
Also in the news: Russia’s urgency to avoid a default. Food Inflation hits an all-time high. China’s currency plunge raises the risk of 2015-style panic. No-money-down crypto mortgages and why housing may be topping. Barclays PLC (NYSE: BCS) halts ETN sales.
Ahead is data on the employment cost index, PCE, personal income and consumer spending (8:30 AM ET), as well as Chicago PMI (9:45 AM ET), and University of Michigan consumer sentiment and inflation expectations (10:00 AM ET).
What To Expect
Fundamental: In hindsight, a very volatile week characterized by large, two-sided action and little constructive movement (i.e., a week that ended sideways rather than up or down).
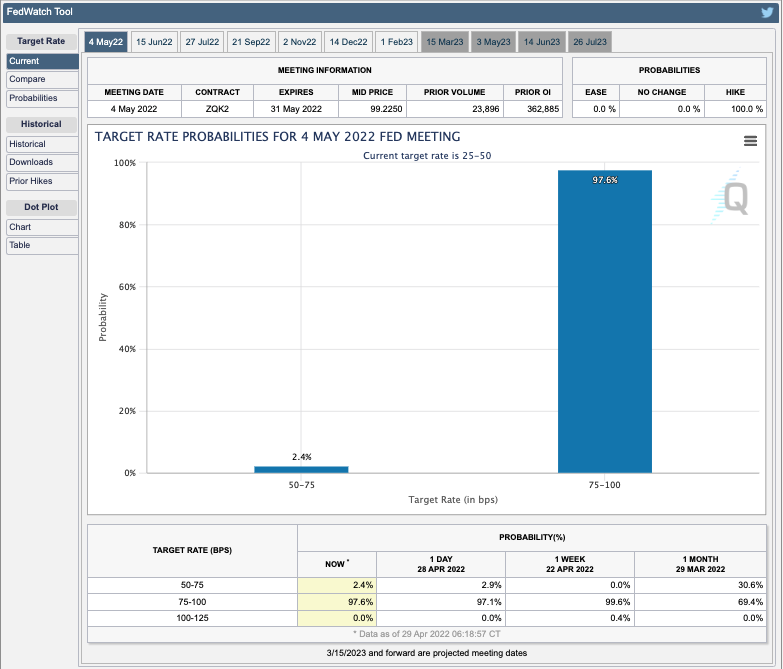
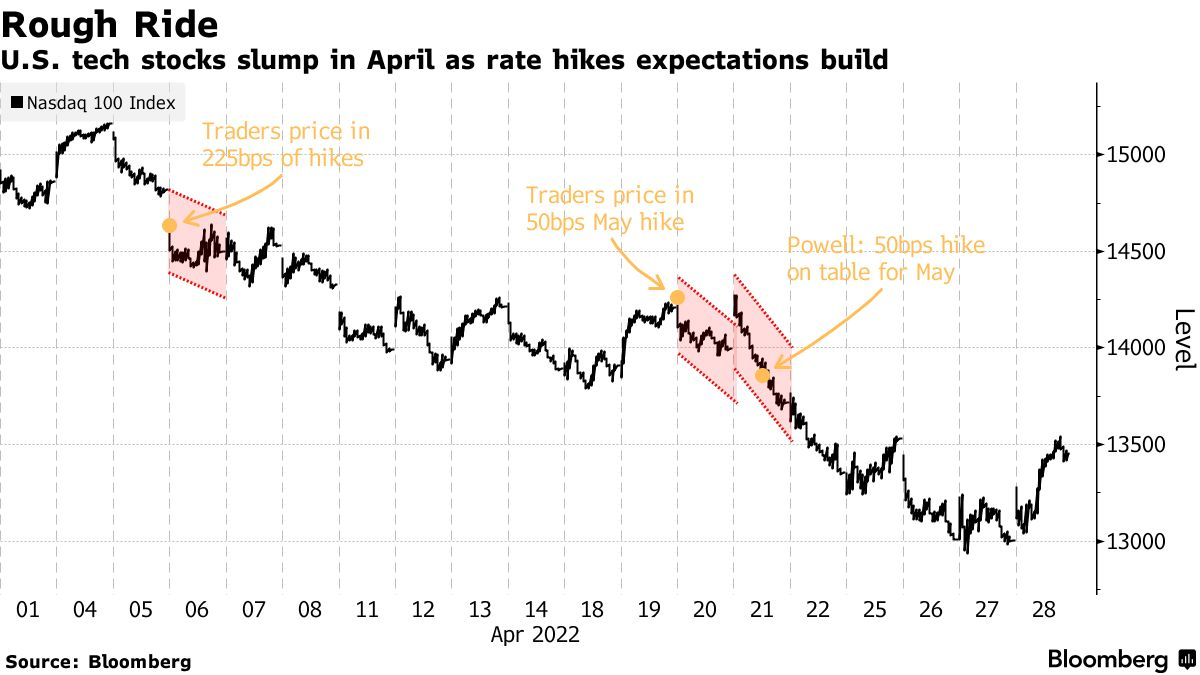
This is ahead of what many think is likely to be front-loaded 50 basis point tightening next week and in June with rates, ultimately, trading in the range of 2.25-2.50% end-of-year.
In light of tightening expectations, Columbia Threadneedle’s Gene Tannuzzo says “Tighter financial conditions are the mechanism that reduces demand and ultimately slows inflation.”
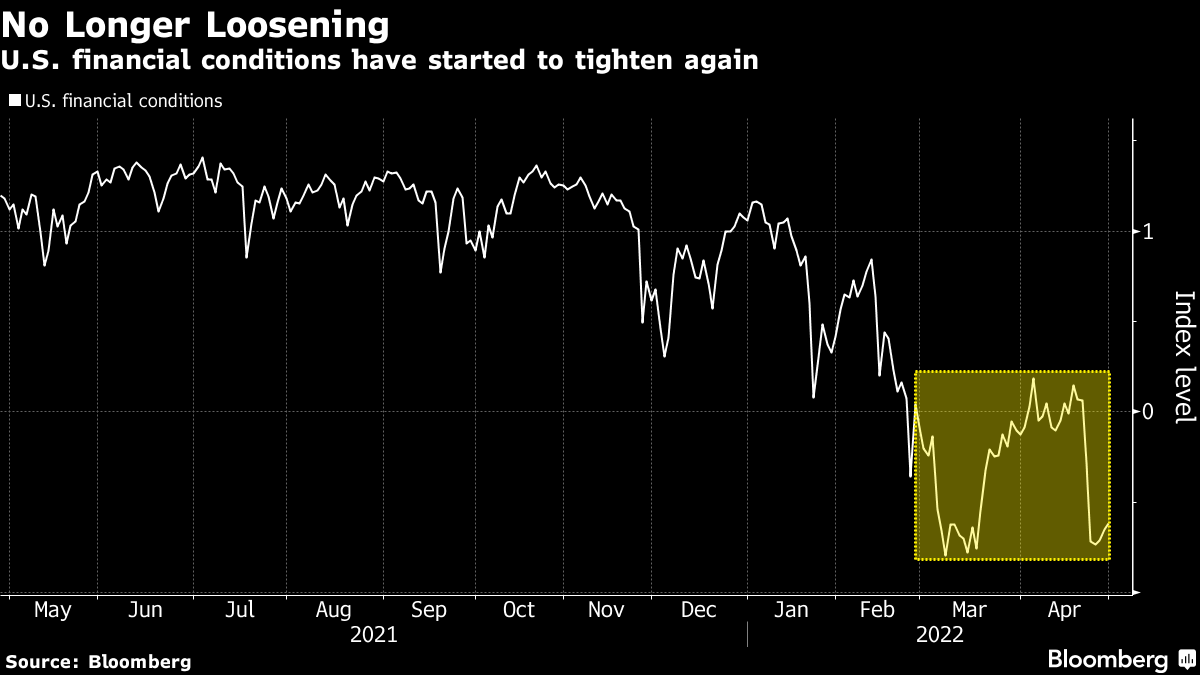
“If financial conditions don’t tighten [i.e., stocks regain their swagger] and inflation remains high, in their eyes, they need to hike more.”
In regards to balance sheet reduction, “QT will consist of run-off caps of USD 60bn for US Treasuries (UST) and USD 35bn for mortgage-backed securities (MBS), which will make up for a cap of USD 95bn per month going forward,” Nordea Bank (OTC: NRDBY) research says.
“The balance sheet reduction will revolve around coupon securities, with the Fed’s c. USD 326bn Treasury bills only allowed roll-off in months when maturing caps do not reach the cap. We expect the Fed to use a 3-month roll-on period in its reduction, which will make up for a relatively smooth and predictable treasury run-off.”
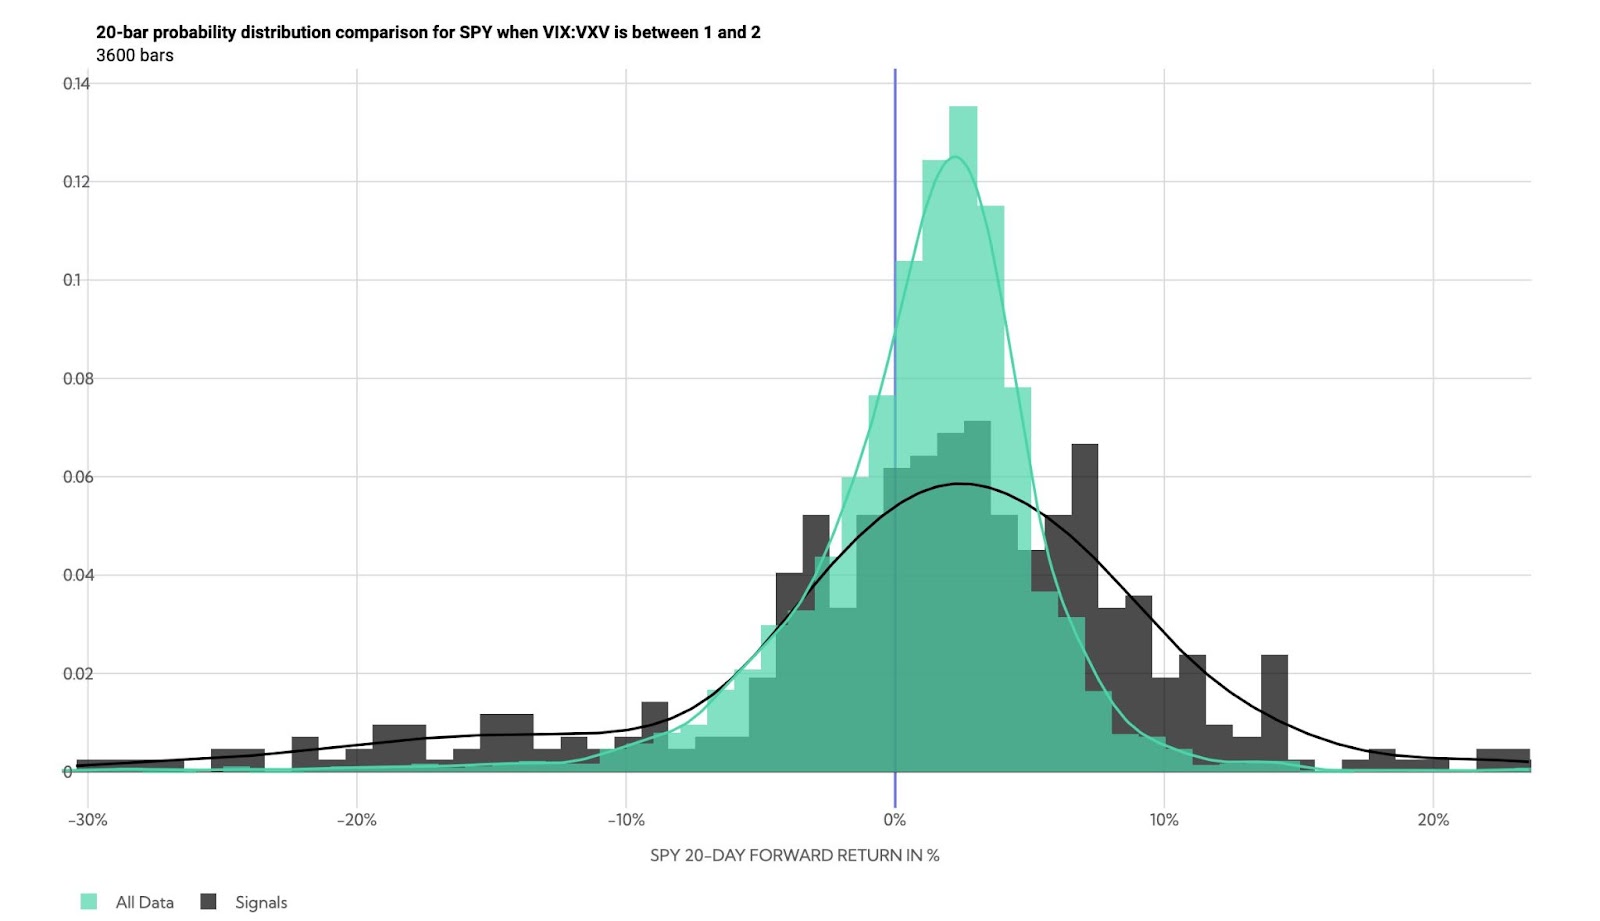
Positioning: Our April 27 discussion on positioning went into great detail on the likelihood of continued volatility and lower prices.
On April 28 we noted the implications of heightened implied volatility and no follow-through to the downside.
The returns distribution, based on implied volatility metrics alone, was skewed positive, albeit with a potential for large negative outliers.
During Thursday’s trade, markets endured a near-vertical price rise alongside repositioning and what SpotGamma says is a “put-heavy expiration [Friday] (20% of gamma roll-off expected).”
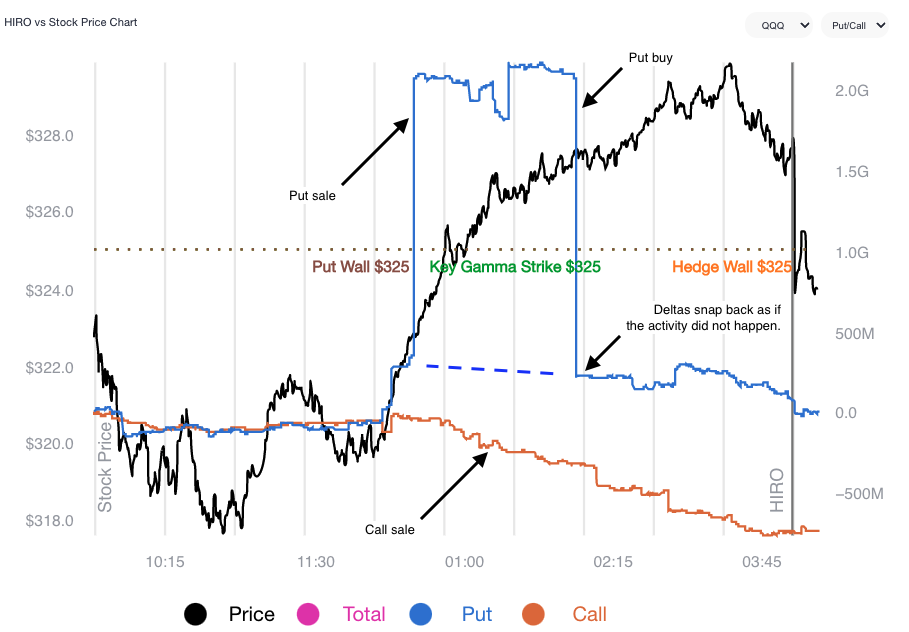
The idea is as follows: customers are well-hedged (customers own puts and/or are short calls) and this offers them positive, yet asymmetric (gamma), exposure to direction (delta). In other words, negative delta and positive gamma.
The counterparty has exposure to positive delta and negative gamma. If the underlyings trade lower and volatility rises, all else equal, the position will lose. To hedge against these losses, the counterparties will sell underlying into weakness.
If this exposure is to roll off or underlying prices reverse and move higher, these counterparties will re-hedge and buy underlying. That’s what SpotGamma is hinting at.
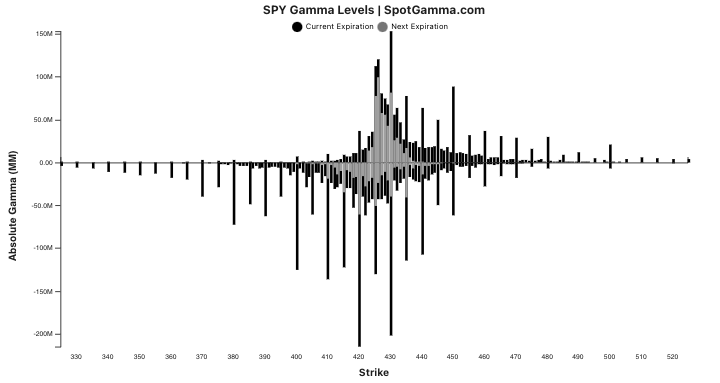
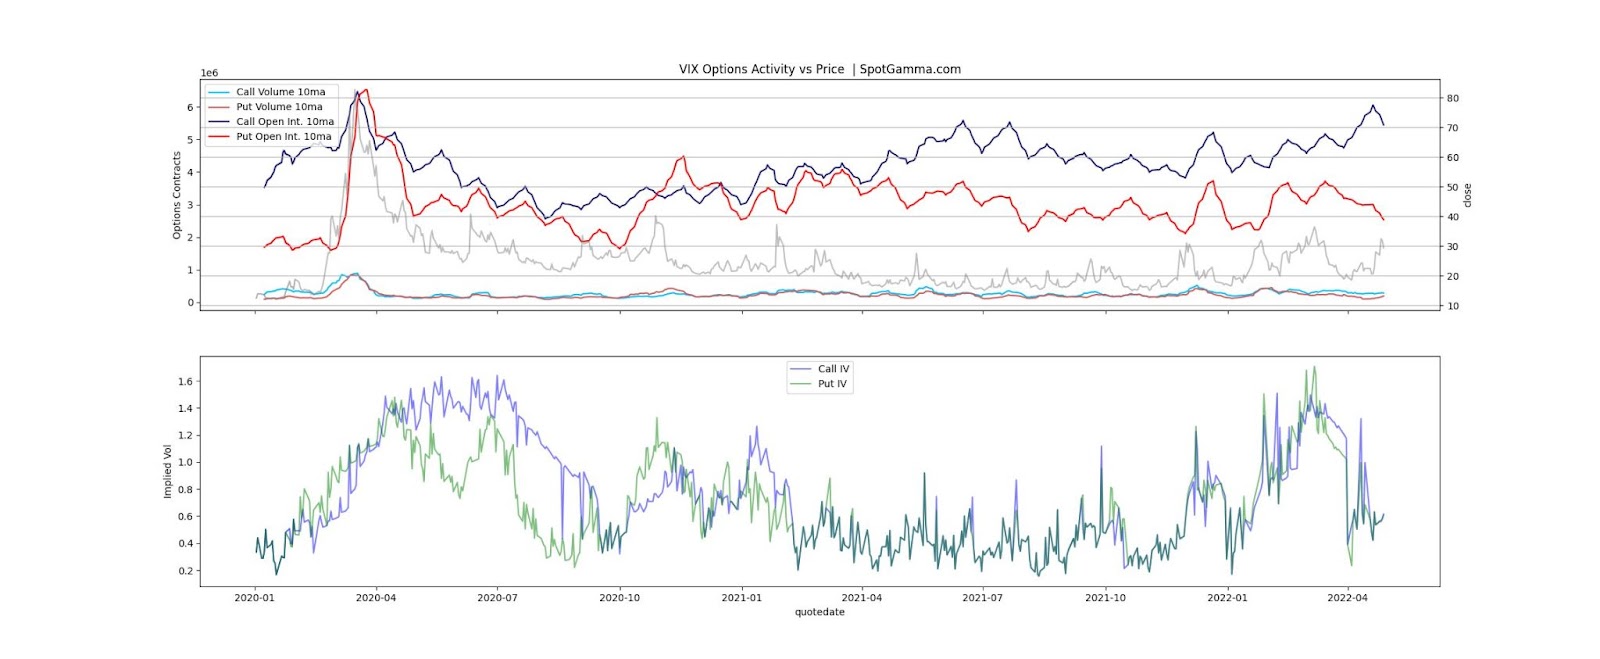
SpotGamma also notes: “VIX call open interest (blue) is near March ’20 highs. With VIX near 1-yr highs put interest (red) is near lows. Equity rally/vol decline seems like it would catch most everyone offsides.”
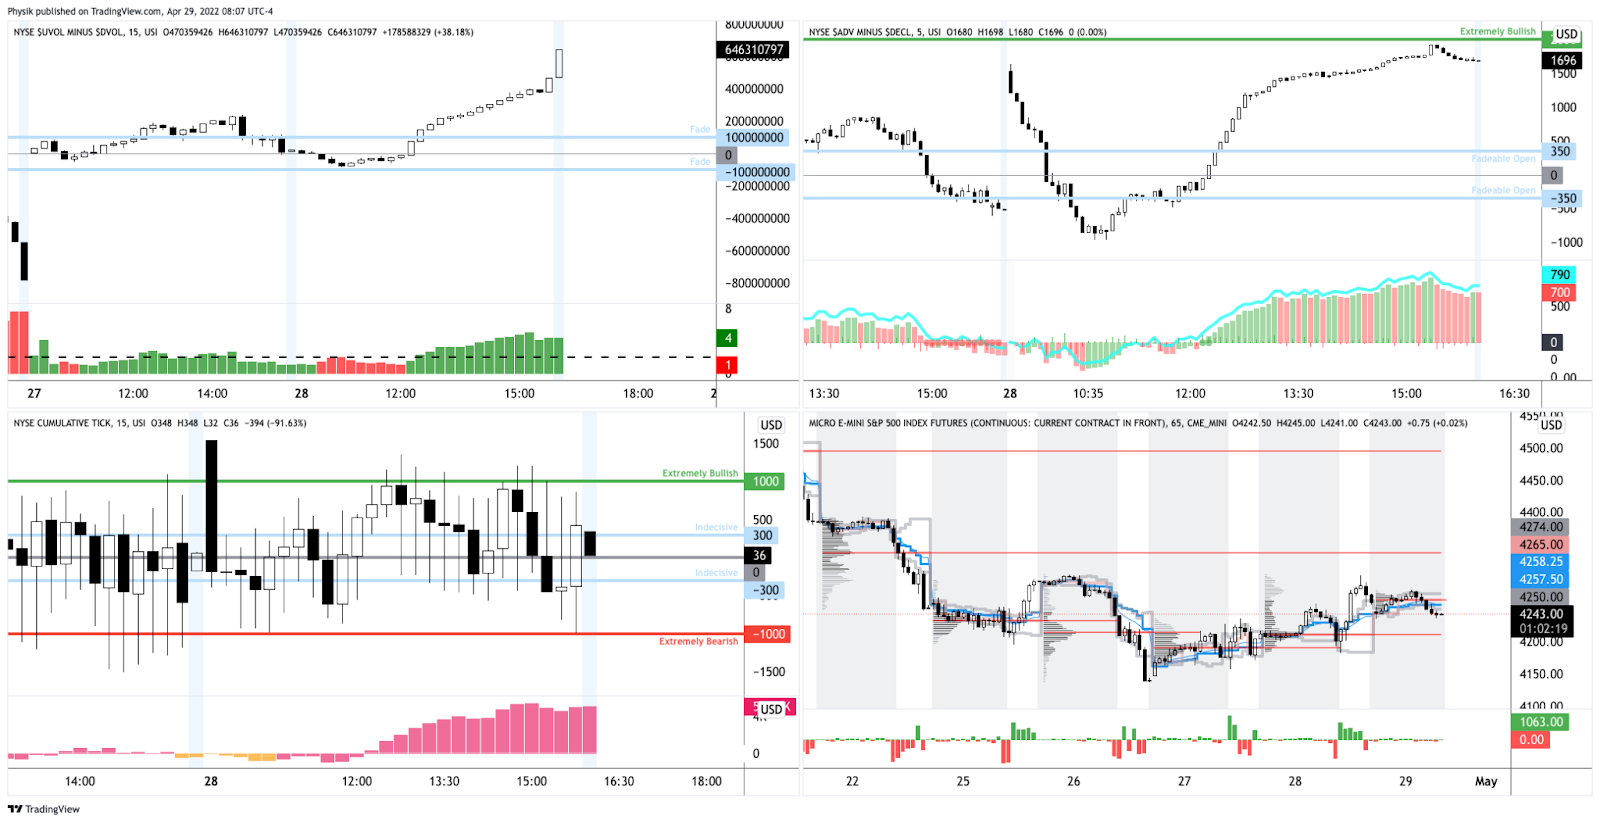
Technical: As of 6:15 AM ET, Friday’s regular session (9:30 AM – 4:00 PM ET), in the S&P 500, will likely open in the middle part of a balanced overnight inventory, inside of prior-range and -value, suggesting a limited potential for immediate directional opportunity.
In the best case, the S&P 500 trades higher; activity above the $4,235.00 overnight low (ONL) puts in play the $4,279.75 overnight high (ONH). Initiative trade beyond the ONH could reach as high as the $4,303.50 regular trade high (RTH High) and $4,337.00 untested point of control (VPOC), or higher.
In the worst case, the S&P 500 trades lower; activity below the $4,235.00 ONL puts in play the $4,191.00 VPOC. Initiative trade beyond the VPOC could reach as low as the $4,182.50 ONL and $4,156.75 regular trade low (RTH Low), or lower.
Click here to load today’s key levels into the web-based TradingView charting platform. Note that all levels are derived using the 65-minute timeframe. New links are produced, daily.

Considerations: Into this week, markets were extremely weak alongside hawkish remarks from the Fed and dismal responses to earnings results, among other things.
Then, as a major index – the Invesco QQQ Trust Series 1 (NASDAQ: QQQ) – tested a major VWAP anchored from the lows of March 2020. After, a rounded bottom began to form while implied volatility metrics continued to trend higher.

Thursday’s price rise and volatility compression, particularly at the short-end of the term structure coincided with some of the strongest breadth in days.
Notwithstanding, the entire advance was taken back overnight and now the S&P 500 is trading back inside a multi-day consolidation.
If a short-term trader, playing responsively (i.e., fading edges) is likely the best course of action until the indexes, at least, are able to break above this week’s ranges and remain there (i.e., not trade back down).
Definitions
Overnight Rally Highs (Lows): Typically, there is a low historical probability associated with overnight rally-highs (lows) ending the upside (downside) discovery process.
Volume Areas: A structurally sound market will build on areas of high volume (HVNodes). Should the market trend for long periods of time, it will lack sound structure, identified as low volume areas (LVNodes). LVNodes denote directional conviction and ought to offer support on any test.
If participants were to auction and find acceptance into areas of prior low volume (LVNodes), then future discovery ought to be volatile and quick as participants look to HVNodes for favorable entry or exit.
POCs: POCs are valuable as they denote areas where two-sided trade was most prevalent in a prior day session. Participants will respond to future tests of value as they offer favorable entry and exit.
Volume-Weighted Average Prices (VWAPs): A metric highly regarded by chief investment officers, among other participants, for quality of trade. Additionally, liquidity algorithms are benchmarked and programmed to buy and sell around VWAPs.
About
After years of self-education, strategy development, mentorship, and trial-and-error, Renato Leonard Capelj began trading full-time and founded Physik Invest to detail his methods, research, and performance in the markets.
Capelj also develops insights around impactful options market dynamics at SpotGamma and is a Benzinga reporter.
Some of his works include conversations with ARK Invest’s Catherine Wood, investors Kevin O’Leary and John Chambers, FTX’s Sam Bankman-Fried, Kai Volatility’s Cem Karsan, The Ambrus Group’s Kris Sidial, among many others.
Disclaimer
In no way should the materials herein be construed as advice. Derivatives carry a substantial risk of loss. All content is for informational purposes only.


