
The daily brief is a free glimpse into the prevailing fundamental and technical drivers of U.S. equity market products. Join the 300+ that read this report daily, below!
Note: Looking back, yesterday’s letter was “eh” to put it simply.
So, here’s a discussion in the positioning section that tidies up some of the past analyses we’ve made. Also, I will be off Friday, July 22, 2022, through to Tuesday, July 26, 2022.
Thank you for all the support and I look forward to hitting next week, hard, with you! Take care!
Positioning
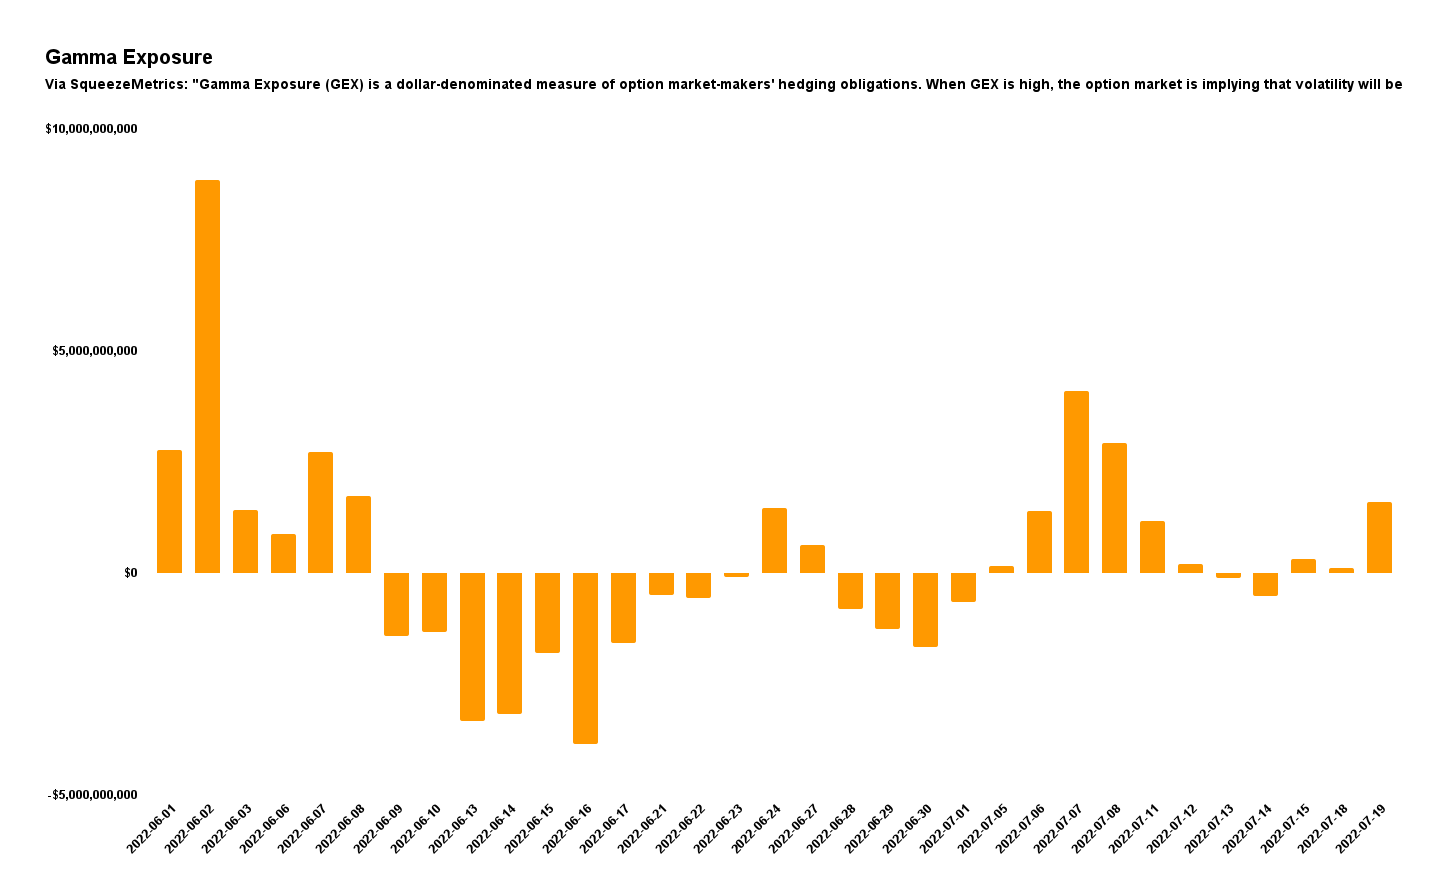
As of 6:30 AM ET, Thursday’s expected volatility, via the Cboe Volatility Index (INDEX: VIX), sits at ~1.25%. Net gamma exposures increasing may help tighten equity index ranges.
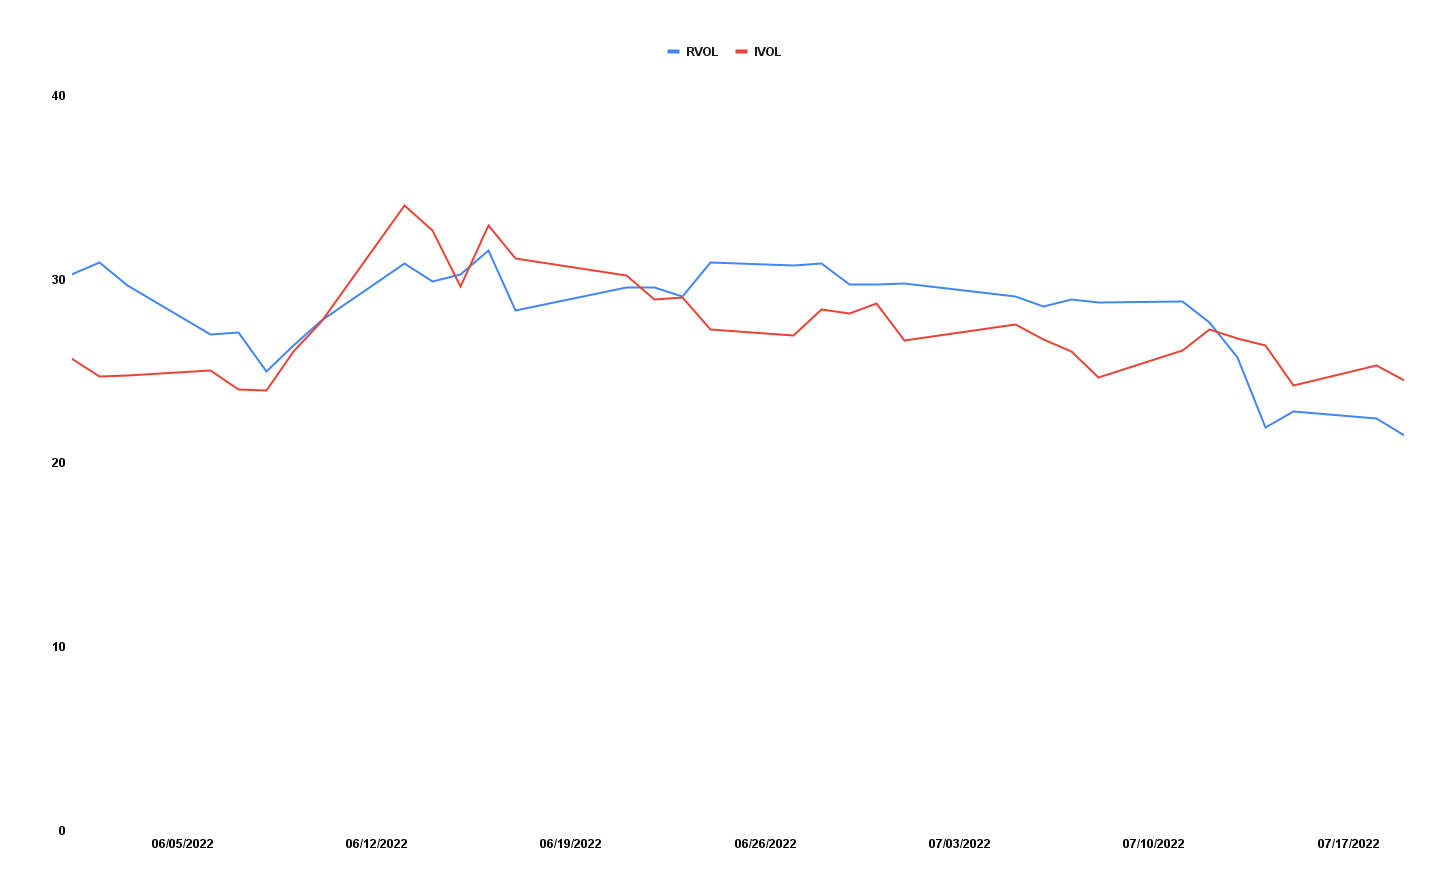
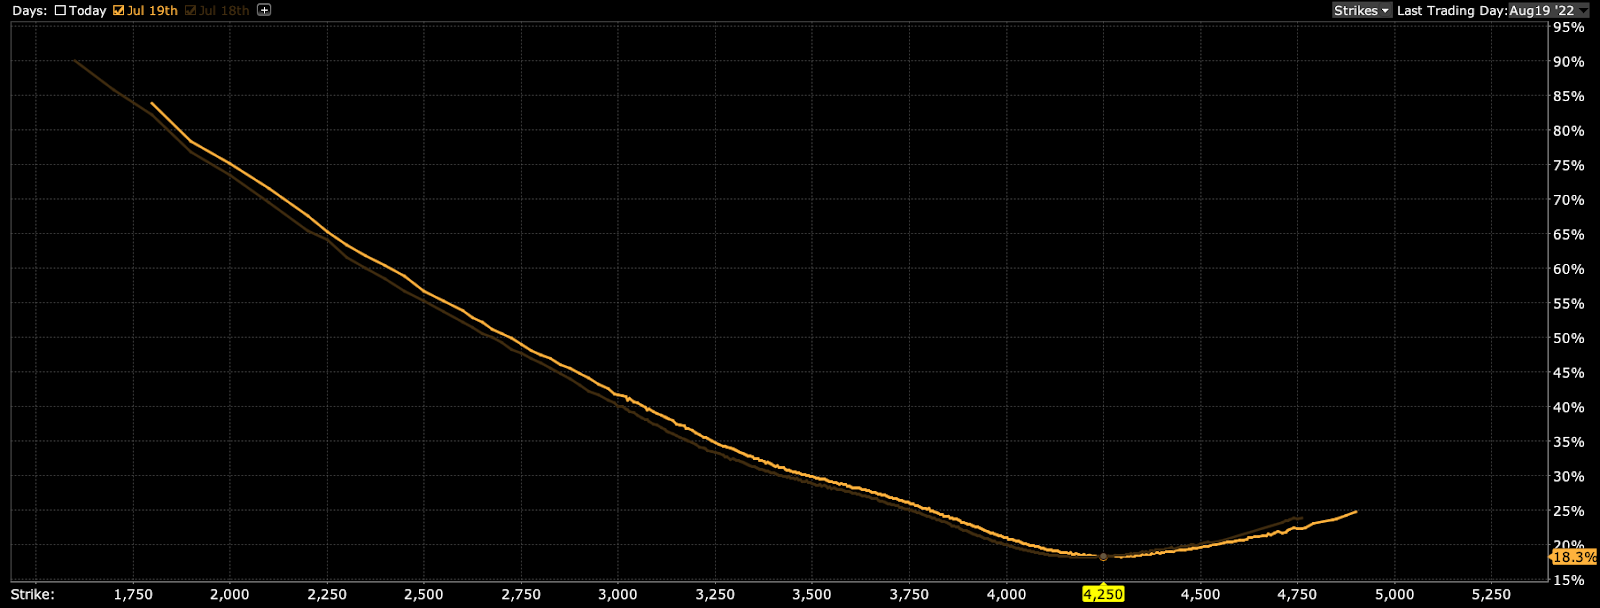
Given where realized (RVOL) and implied (IVOL) volatility measures are, as well as skew, it is beneficial to be a buyer of short-dated complex options structures (e.g., low-cost call ratios) that are short those options that have the most to lose in an SPX up, VIX down environment.
The reason why?
Kai Volatility’s Cem Karsan explained it well in a conversation he had with the Charles Schwab Inc-owned (NYSE: SCHW) TD Ameritrade Network.
Heading into the 2022 decline, institutions were well hedged. Their monetization of hedges, as well as the demand for certain equity options structures (and the hedging of them) into the fall, lent to supply and compressed volatility on a fixed strike basis, relative to that in other markets.
Volatility supply, coupled with the lower liquidity environment, results in hedging pressures that (matter more) and lend to index mean reversion which Karsan posits may be coming to an end.
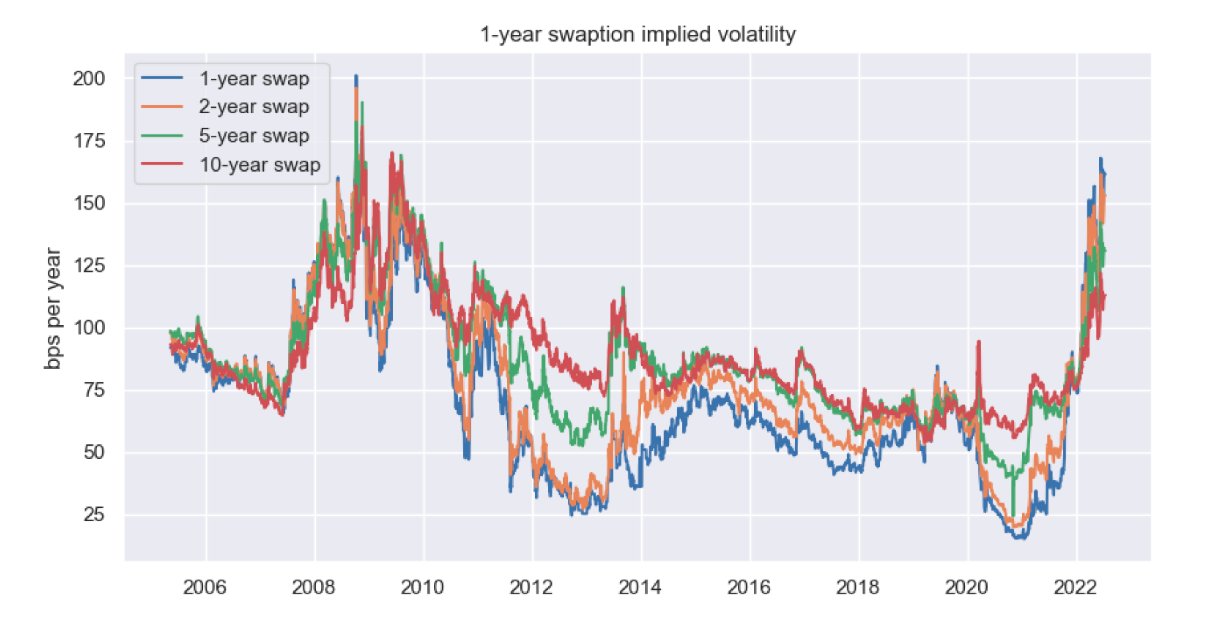
In validating his thesis, Karsan pointed to fixed strike volatility jumping in spite of the equity rally.
“This is the beginning of an untethering,” he explained. “If we see a rally here, IVOL will likely increase on a fixed strike basis. If that does, that will continue to untether index volatility which has been one of the most supportive things into the decline.”
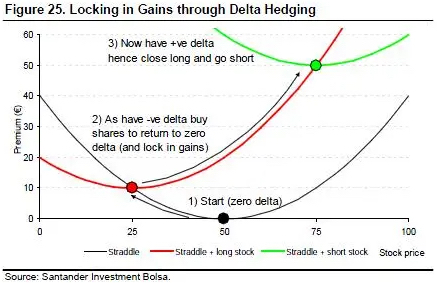
For context, on the latter remark, when volatility is supplied by the customer, the counterparty, which is on the other side, has exposure to long volatility. All else equal, on directional moves, long volatility positions will reprice for the counterparty favorably.
To re-hedge, the counterparty will buy weakness (against increased negative delta) and sell strength (against increased positive delta). Below is a naive example of the effects of delta hedging a straddle on profit and loss.
Moreover, these shifts are suggestive of weakening market support, in the face of a macro and geopolitical environment that’s not improving. Quantitative tightening (QT), which is “the direct input of capital to capital markets” is set to double on September 1, 2022, all the while there is likely to be compression on earnings, and a break up in risk premiums across markets.
The “tail risks are building” and no longer is volatility likely to be pinned by (1) sentiment and positioning, as well as (2) hedging on the equity volatility side, Karsan added.
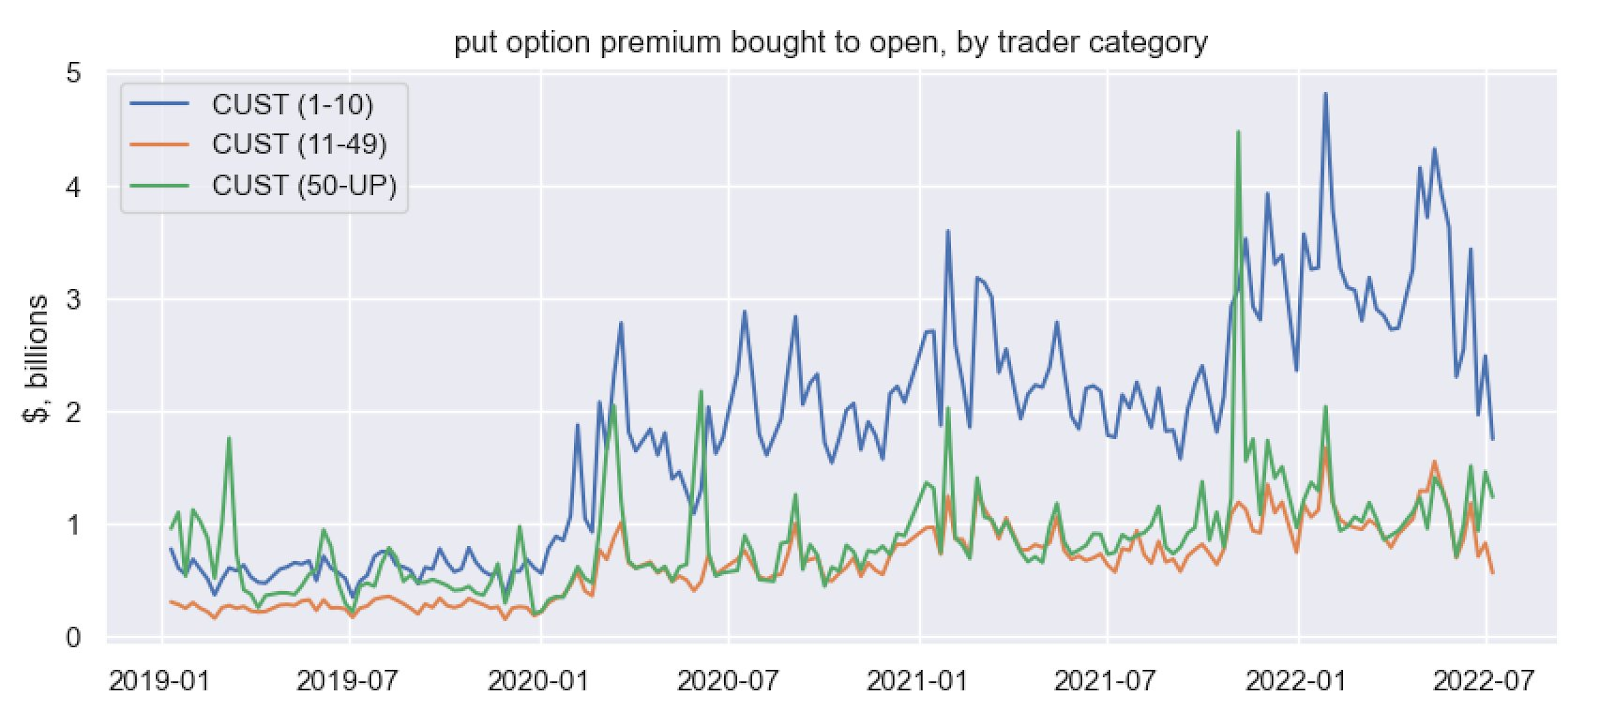
“As you squeeze entities out on the upside of that short positioning, and volatility itself, on the equity side, becomes less and less hedged on the customer level, which we’re beginning to see, the market can really begin to respond to the core macro factors.”
With a more volatile second leg down in play, Karsan says higher prices, in spite of small blips in IVOL on a fixed strike basis, will offer participants an opportunity to “add to volatility hedges.”
Likewise, with call options outperforming “their delta to the upside,” it makes much sense to replace static equity long exposure with that which is dynamic.
“The bare minimum, if you’re long equities, is to be expressing that in calls,” Karsan ends. S&P 500 calls are at a “17.5 and 18 volatility. If we continue to slide, the VIX [likely won’t] slide below 20 in this environment, given the macro risk.”
Technical
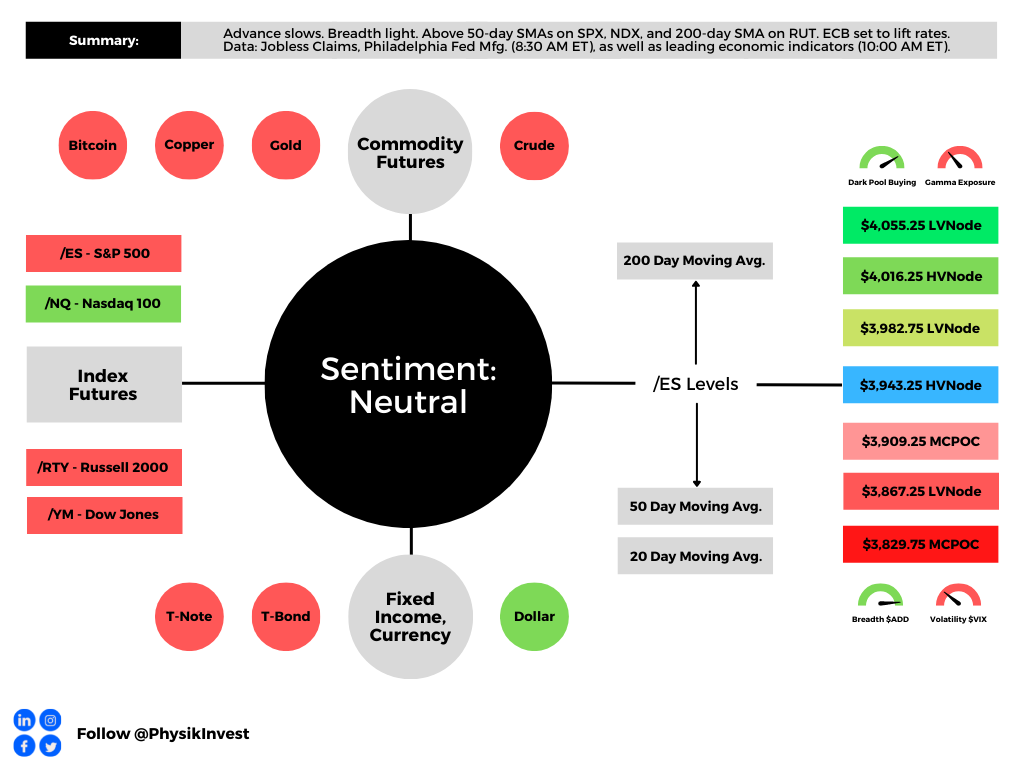
As of 6:30 AM ET, Thursday’s regular session (9:30 AM – 4:00 PM ET), in the S&P 500, is likely to open in the middle part of a balanced overnight inventory, inside of prior-range and -value, suggesting a limited potential for immediate directional opportunity.
In the best case, the S&P 500 trades higher.
Any activity above the $3,943.25 HVNode puts into play the $3,982.75 LVNode. Initiative trade beyond the LVNode could reach as high as the $4,016.25 HVNode and $4,055.25 LVNode, or higher.
In the worst case, the S&P 500 trades lower.
Any activity below the $3,943.25 HVNode puts into play the $3,909.25 MCPOC. Initiative trade beyond the MCPOC could reach as low as the $3,867.25 LVNode and $3,829.75 MCPOC, or lower.
Click here to load today’s key levels into the web-based TradingView charting platform. Note that all levels are derived using the 65-minute timeframe. New links are produced, daily.

Definitions
Volume Areas: A structurally sound market will build on areas of high volume (HVNodes). Should the market trend for long periods of time, it will lack sound structure, identified as low volume areas (LVNodes). LVNodes denote directional conviction and ought to offer support on any test.
If participants were to auction and find acceptance into areas of prior low volume (LVNodes), then future discovery ought to be volatile and quick as participants look to HVNodes for favorable entry or exit.
POCs: POCs are valuable as they denote areas where two-sided trade was most prevalent in a prior day session. Participants will respond to future tests of value as they offer favorable entry and exit.
MCPOCs: POCs are valuable as they denote areas where two-sided trade was most prevalent over numerous day sessions. Participants will respond to future tests of value as they offer favorable entry and exit.
Volume-Weighted Average Prices (VWAPs): A metric highly regarded by chief investment officers, among other participants, for quality of trade. Additionally, liquidity algorithms are benchmarked and programmed to buy and sell around VWAPs.
About
After years of self-education, strategy development, mentorship, and trial-and-error, Renato Leonard Capelj began trading full-time and founded Physik Invest to detail his methods, research, and performance in the markets.
Capelj also develops insights around impactful options market dynamics at SpotGamma and is a Benzinga reporter.
Some of his works include conversations with ARK Invest’s Catherine Wood, investors Kevin O’Leary and John Chambers, FTX’s Sam Bankman-Fried, ex-Bridgewater Associate Andy Constan, Kai Volatility’s Cem Karsan, The Ambrus Group’s Kris Sidial, among many others.
Disclaimer
In no way should the materials herein be construed as advice. Derivatives carry a substantial risk of loss. All content is for informational purposes only.


7 replies on “Daily Brief For July 21, 2022”
[…] For more, the very detailed Daily Brief for July 21, 2022, explained it best. Check that out, here. […]
[…] as explained in the Daily Brief for July 21, 2022, heading into the 2022 decline, institutions repositioned and hedged, even allocating to […]
[…] With call options outperforming “their delta to the upside,” it continues to make much sense to replace static equity long exposure with that which is dynamic, Karsan explained. […]
[…] the past few sessions, we did much to unpack and understand some of the implications of participants’ market […]
[…] well explained in the Daily Brief for July 21, 2022, heading into the 2022 decline, institutions repositioned and hedged, even allocating to […]
[…] Should markets experience a shock (e.g., China and U.S. tensions escalate), the new demand for hedges may result in an “untethering” in IVOL, which was “one of the most supportive things into the decline,” Karsan explained. […]
[…] to be a buyer of options structures. It is weeks prior to this near-vertical price rise that we mulled rotating into dynamic (options) bets and structures lined up against some key […]