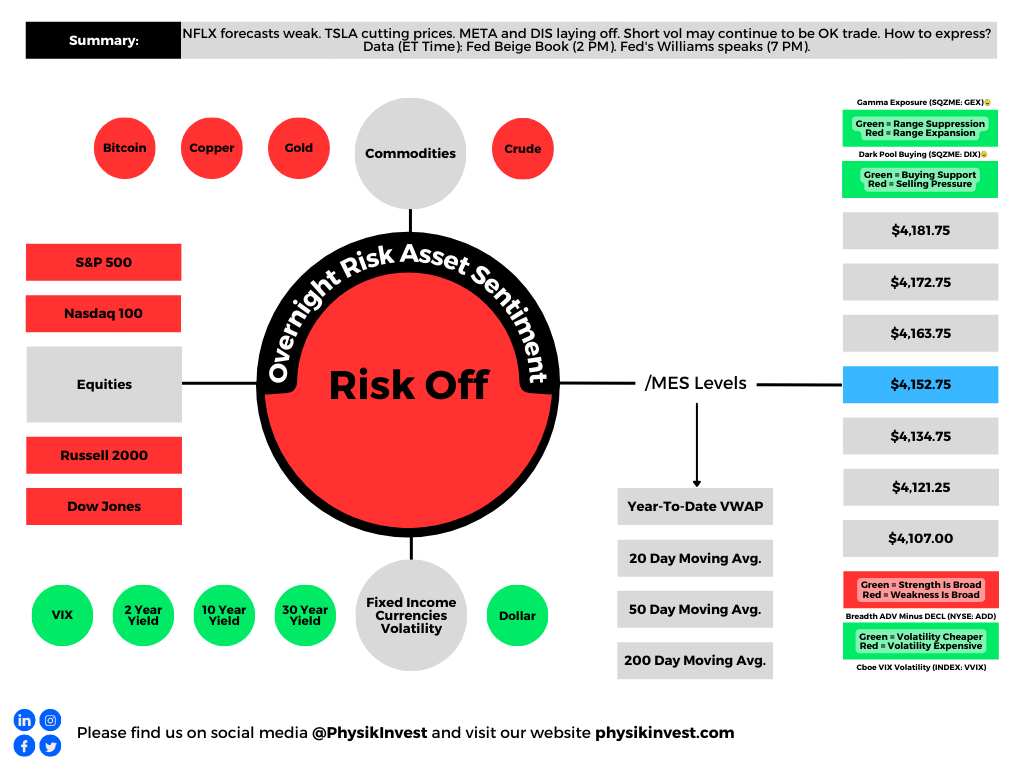
Big news includes Netflix Inc (NASDAQ: NFLX) beating earnings estimates but having a weaker-than-expected forecast, Tesla Inc (NASDAQ: TSLA) cutting prices the sixth time this year, Meta Platforms Inc (NASDAQ: META) and Walt Disney Co (NYSE: DIS) commencing layoffs, and mortgage rates edging higher to ~6.4%.
Graphic: Retrieved from Bloomberg. “US mortgage rates increased last week by the most in two months to 6.43%, denting already sluggish demand.”
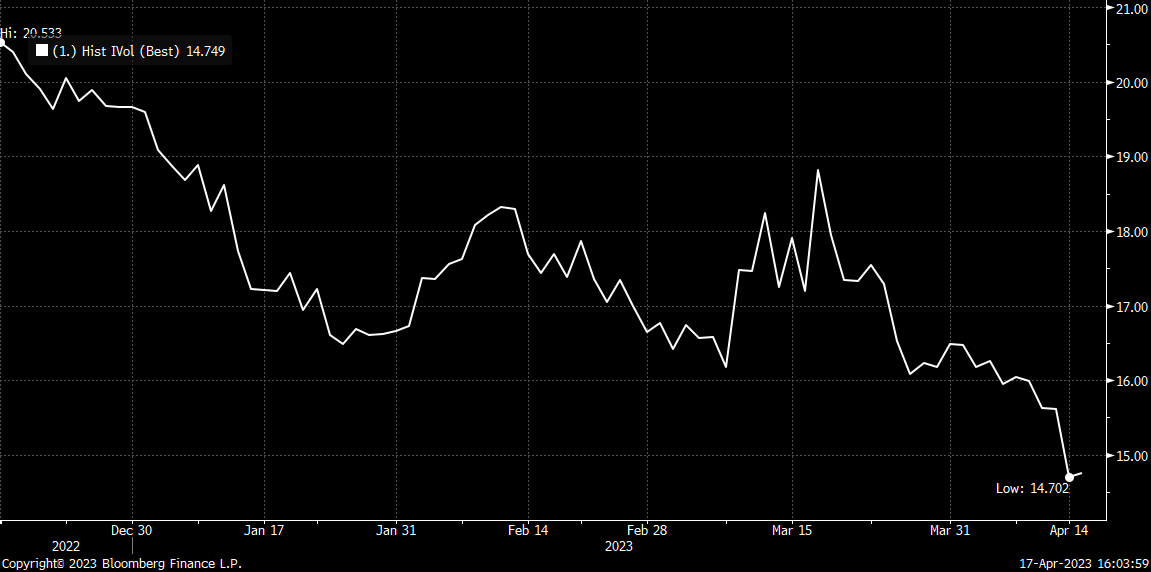
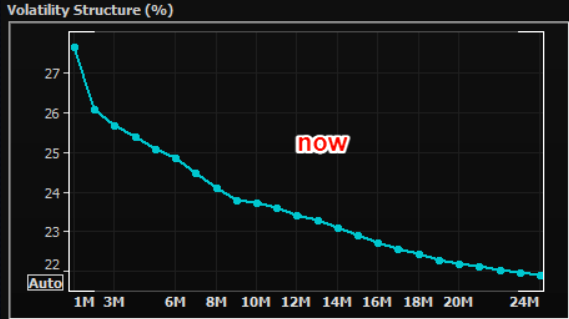
Equity markets are down, and equity implied volatility (IVOL) measures, including the Cboe Volatility Index or VIX, are climbing. Notwithstanding, the trend lower in IVOL is intact, and that’s good for traders biased short volatility.
Graphic: Retrieved from Bloomberg via Danny Kirsch of Piper Sandler Companies (NYSE: PIPR). Call option volatility for the $4,150.00 strike. May monthly expiration.
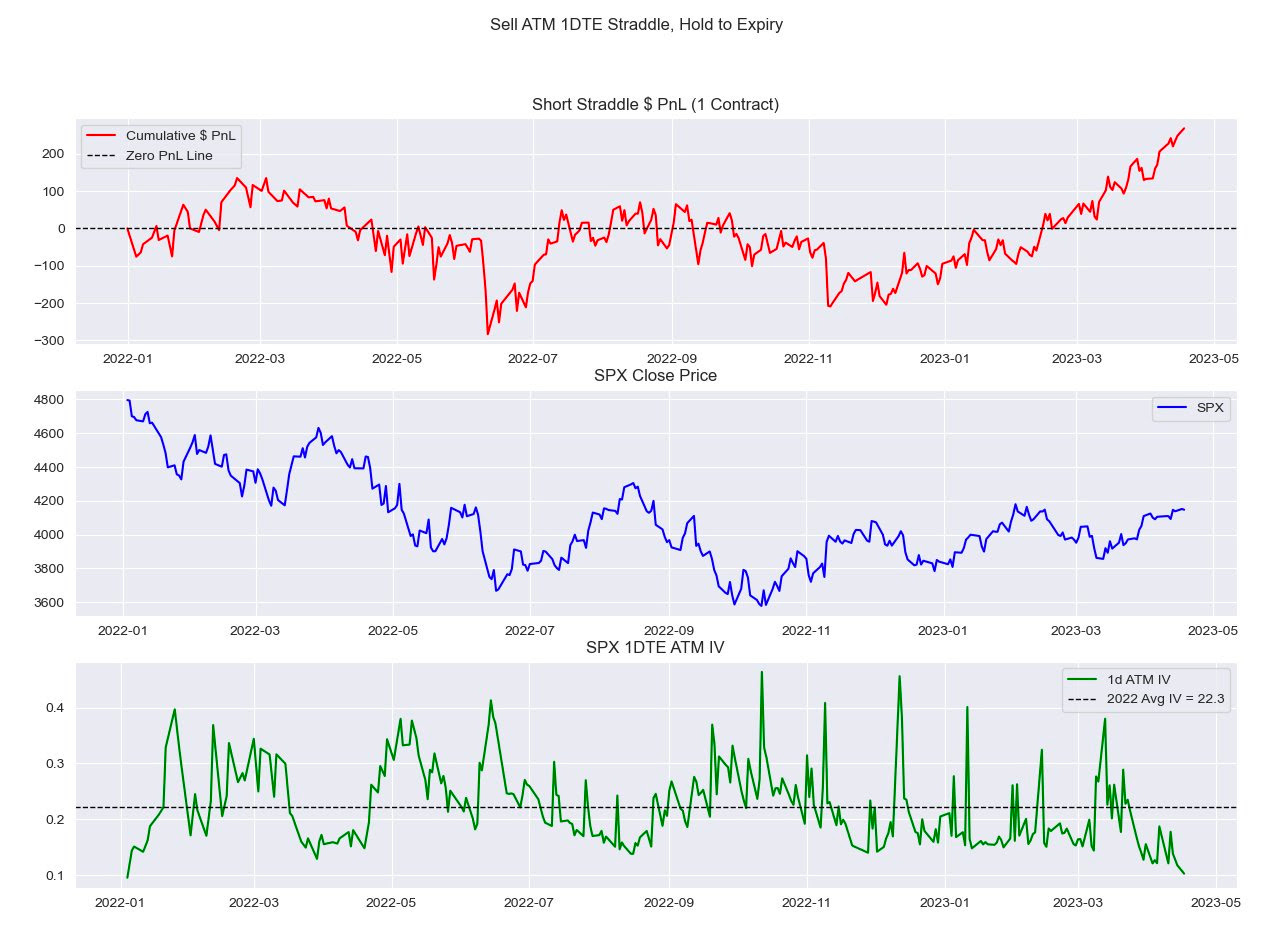
“With all the focus [on S&P 500 (INDEX: SPX)] 0 DTE lately, I look at how expensive these have been since 2022,” IPS Strategic Capital’s Pat Hennessy says, referencing a backtest he conducted selling a 1 DTE straddle and holding till maturity.
“Performance since the November CPI has been stellar, with a 63% win rate and an average gain of $20.00.”
Graphic: Retrieved from IPS Strategic Capital’s Pat Hennessy.
Volatility trader Darrin John agrees, noting volatility remains expensive, a detriment to those who may be biased long volatility.
“The VRP is so wide across all of the tenors I track,” John elaborates. “It’s going to be hard for gamma buyers to cover daily theta bills.”
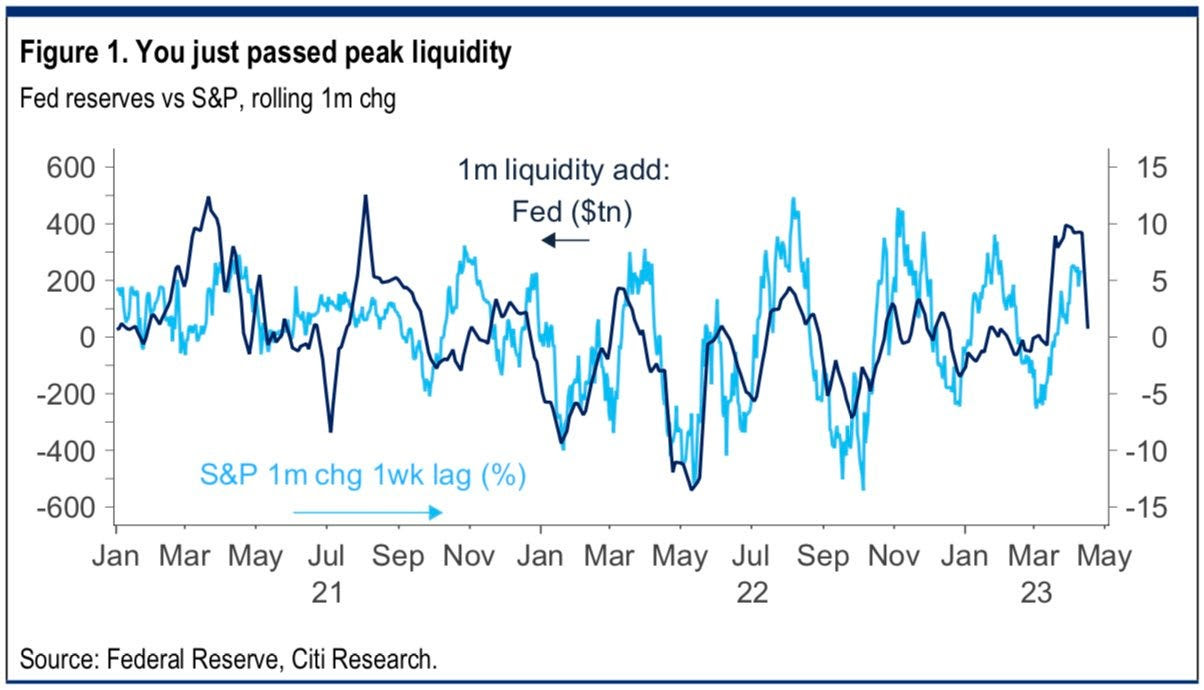
Clouds are appearing on the horizon, however, and the trend higher (lower) in stocks (volatility) may not last. Bloomberg forecasts the largest fall in SPX earnings since the start of 2020. Notwithstanding, strength can continue for longer …
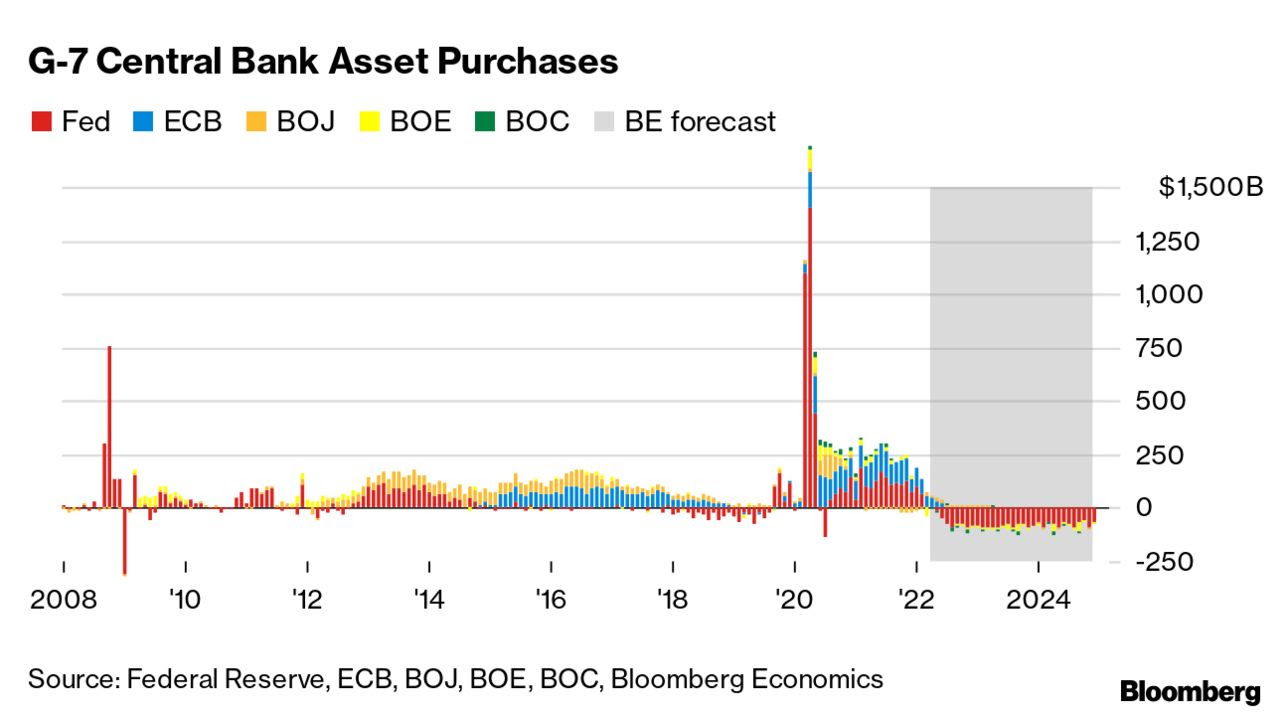
Graphic: Retrieved from Citigroup Inc Research (NYSE: C) via @tr8derz. “YTD rally stems from $1tn in CB liquidity. High-frequency indicators suggest this is already stalling, and coming weeks seem increasingly likely to bring a sharp reversal. Higher TGA and RRP, ECB QT and reduced China easing could easily see a net drain of some $6-800bn.”
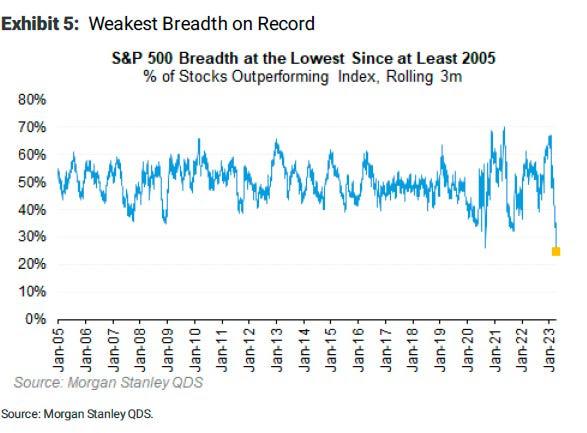
… even with the SPX breadth reading poor. The SPX has rallied with multiples rising; strength came with positive earnings surprises, bond demand, and other things.
Graphic: Retrieved from Morgan Stanley (NYSE: MS) via Bloomberg.
Hence, at the risk of sounding like a broken record, the low-cost call structures we’ve talked about in the past remain attractive.
If markets move higher, you can monetize and roll profits into put spreads (i.e., buy put and sell another at a lower strike). This may work well if JPMorgan Chase & Co’s (NYSE: JPM) call that “even a mild recession would warrant retesting the previous lows” is realized.
Such structures work well as “a big pop in the market can result in a decent drop in the VIX…and vice versa, a market sell-off will result in a greater increase in the VIX now than it did in 2022,” says Alpha Exchange.
Alternatively, lean neutral and buy into cash or bonds yielding 4-5%. Some long box spreads yield 5.4% as of yesterday’s close.
In other news, Physik Invest’s first in-depth note is nearing completion and will be available for public viewing in short order. Take care and watch your risk!
About
Welcome to the Daily Brief by Physik Invest, a soon-to-launch research, consulting, trading, and asset management solutions provider. Learn about our origin story here, and consider subscribing for daily updates on the critical contexts that could lend to future market movement.
Separately, please don’t use this free letter as advice; all content is for informational purposes, and derivatives carry a substantial risk of loss. At this time, Capelj and Physik Invest, non-professional advisors, will never solicit others for capital or collect fees and disbursements. Separately, you may view this letter’s content calendar at this link.
The daily brief is a free glimpse into the prevailing fundamental and technical drivers of U.S. equity market products. Join the 300+ that read this report daily, below!
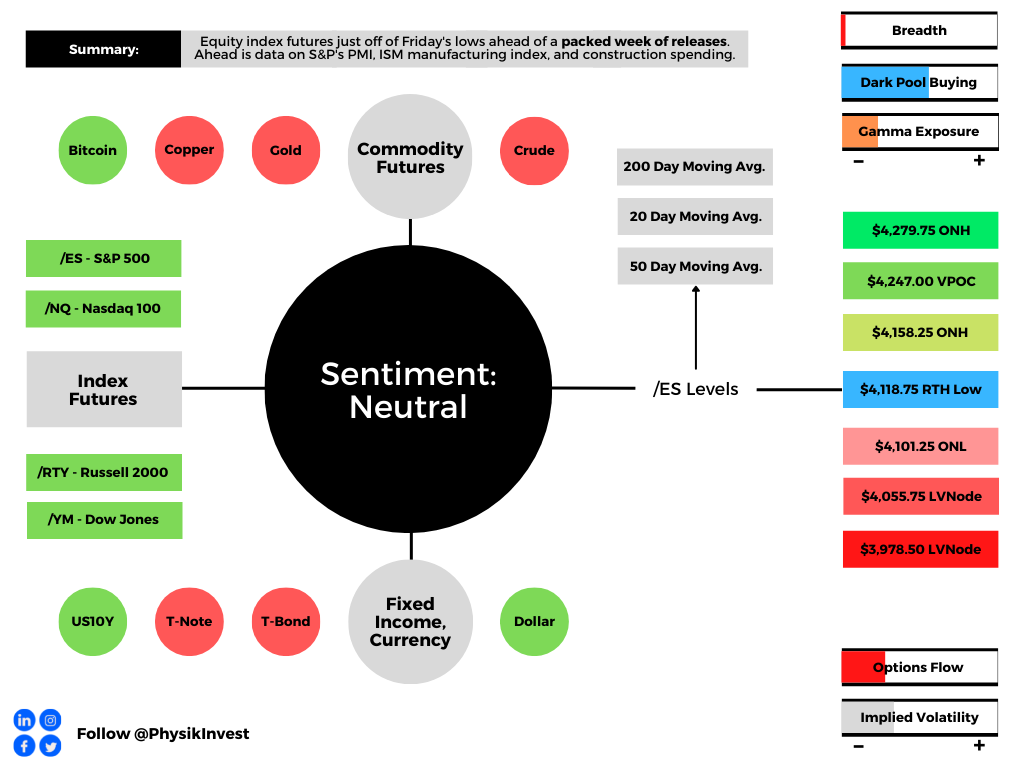
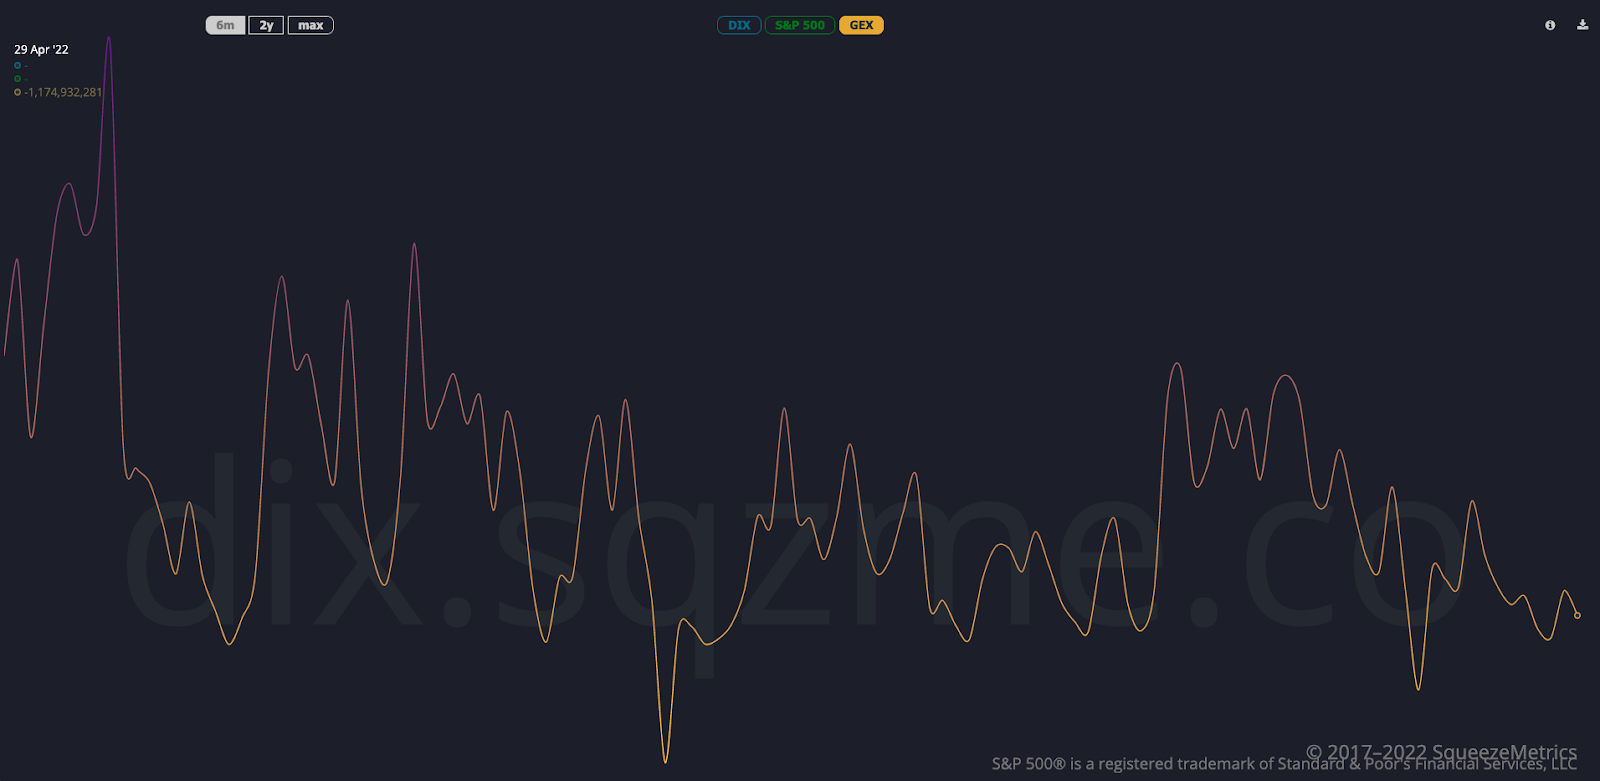
Graphic updated 7:00 AM ET. Sentiment Neutral if expected /ES open is inside of the prior day’s range. /ES levels are derived from the profile graphic at the bottom of the following section. Levels may have changed since initially quoted; click here for the latest levels. SqueezeMetrics Dark Pool Index (DIX) and Gamma (GEX) calculations are based on where the prior day’s reading falls with respect to the MAX and MIN of all occurrences available. A higher DIX is bullish. At the same time, the lower the GEX, the more (expected) volatility. Learn the implications of volatility, direction, and moneyness. Breadth reflects a reading of the prior day’s NYSE Advance/Decline indicator. VIX reflects a current reading of the CBOE Volatility Index (INDEX: VIX) from 0-100.
Fundamental
Thanks to all the subscribers who have signed up in the past few days. Not sure how you got here so thank you! Also, thanks to whoever may have shared the letter to make that happen!
From here, you can expect in-depth commentaries on aspects like fundamentals, technicals, and positioning. Insights are actionable as they help me protect and grow my own capital!
Without further delay, below is what you need to know for today!
In the news was Netflix Inc’s (NASDAQ: NFLX) post-earnings jump on better-than-expected subscriber loss numbers, the Russians and Europeans agreeing on gas pipelines, mortgage boycotts spreading across China, tight food supplies, gas prices falling to some of the lowest levels in months, and China warning against a Taiwan visit by the U.S.
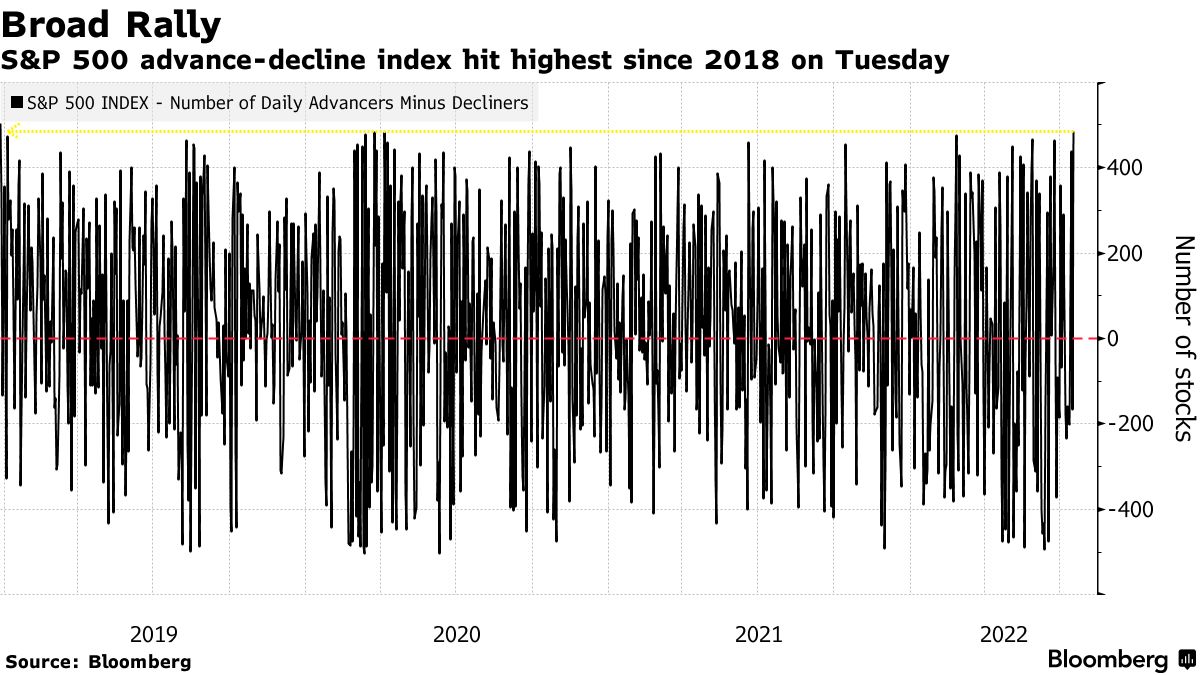
Further, after our July 19 remark on incredibly strong pessimism likely to serve as a contrarian signal, the equity indexes pushed higher, following through key multi-week resistance.
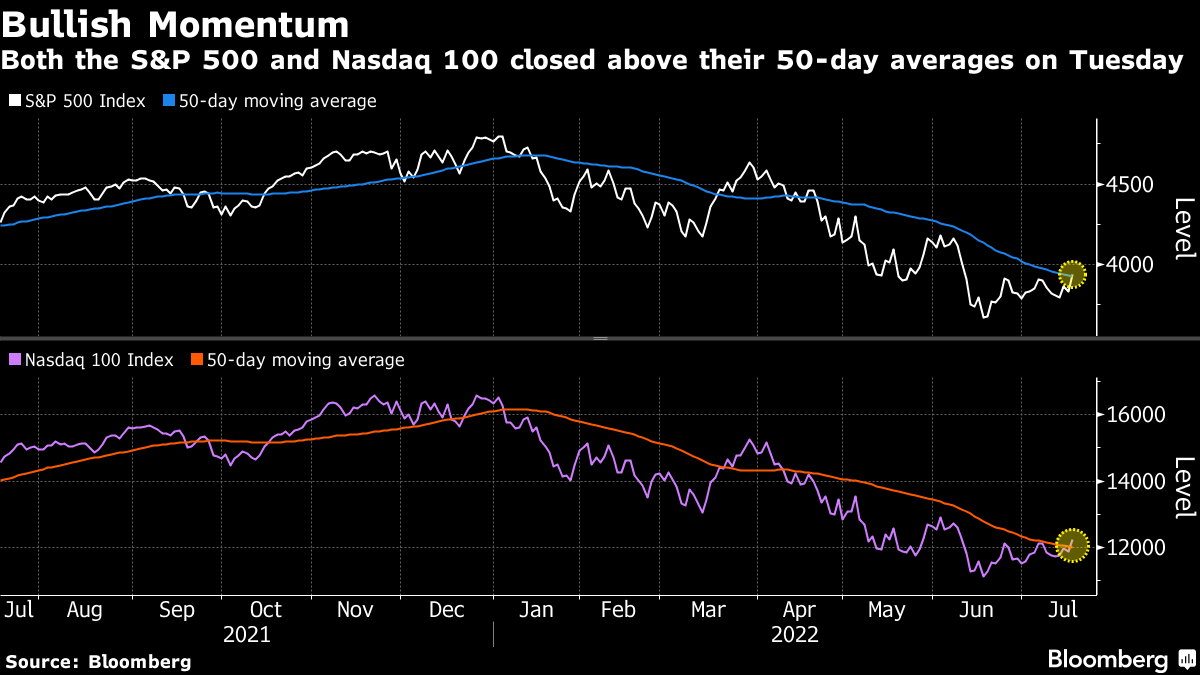
Key levels quoted held nearly to the tick. Now, both the Nasdaq 100 (INDEX: NDX) and S&P 500 (INDEX: SPX) are above their 20- and 50-day moving averages. The Russell 2000, a laggard, made it above the 200-day moving average.
The speed and ferociousness of the rally have more to do with how participants were positioned – in light of what seemed to be a worsening fundamental situation – into the break of some very visual resistances, discussed in prior letters. Read the next section for more on the positioning.
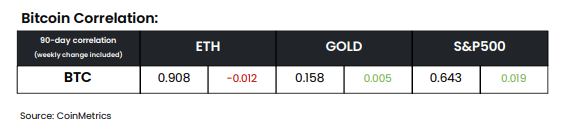
Cryptocurrencies, which were recipients of the same risk-on flows equities saw, too, went higher yesterday. Per CoinMetrics data, Bitcoin’s (CRYPTO: BTC) correlation to equities is positive.
For context, asset volatility had fallen on participants’ extension of moneyness to nonmonetary assets, given easy monetary policies and an environment of ample debt and leverage. These policies made it easier to borrow and make longer-duration bets on ideas with lots of promise.
This had consequences on the real economy and asset prices, accordingly, which rose and kept deflationary pressures at bay. The distinction between economies and financial markets blurred.
When the reverse happens – tighter liquidity and credit – and volatility eventually rises, demand (and competition) for money (or cash) deflates assets (e.g., equities, crypto, and the like).
With U.S. market liquidity, as well as the dollar’s role as a global reserve currency, putting U.S. markets and the S&P 500 at the center of the global carry regime, a U.S. stock market drop is a recession and the direct reflection of the unwinds of carry.
It is the manifestation of a deflationary shock, and today’s sentiment reflects this.
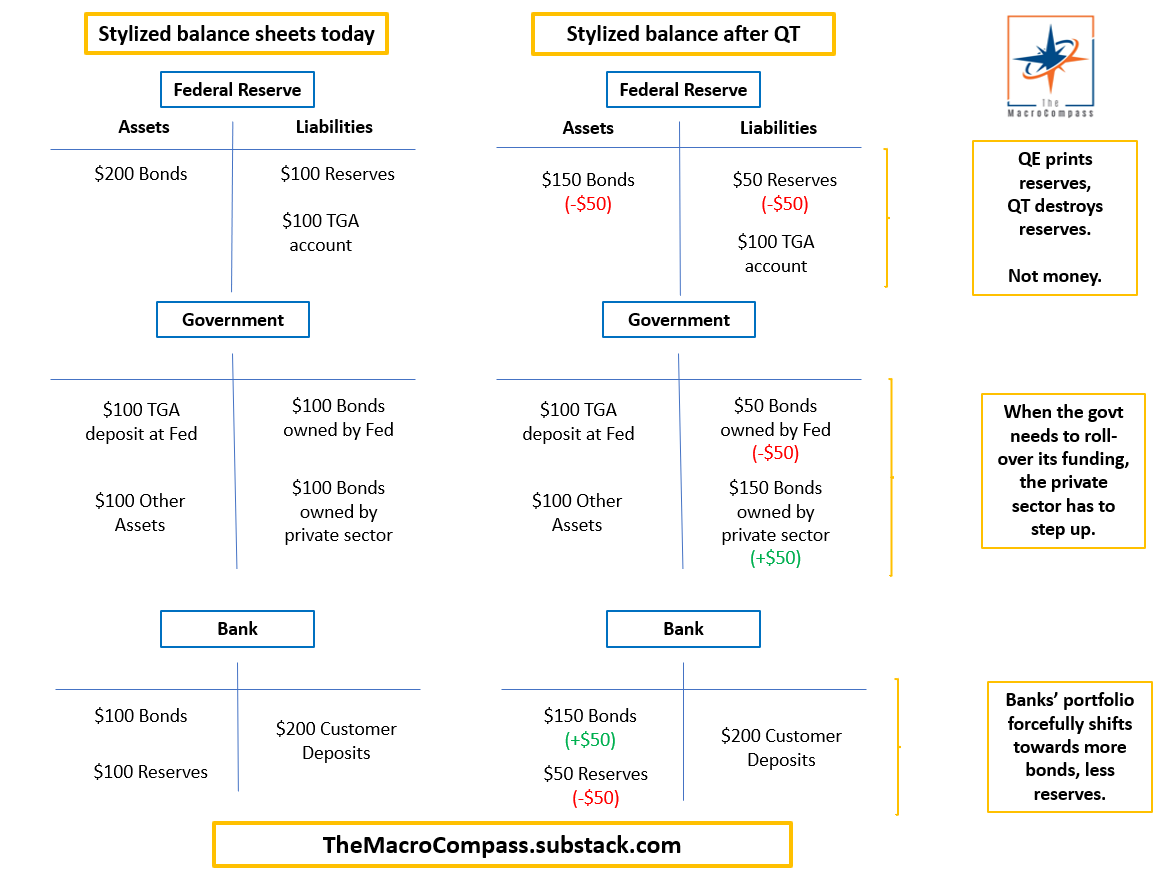
Ultimately, a deflationary pulse manifesting disinflation in consumer prices may prompt the Fed (Federal Reserve) to reverse on rates and quantitative tightening (QT), the (out)flow of capital from capital markets.
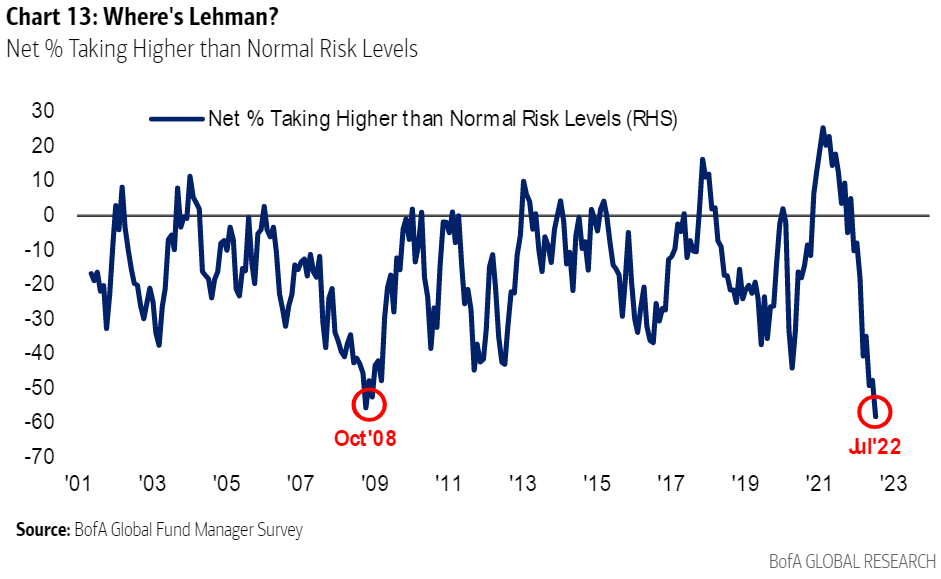
Graphic: Graphic: Via Bank of America Corporation (NYSE: BAC). Retrieved from Bloomberg. “The previous low on this measure came five months before the final market low, but again this could be taken as evidence that the market has already taken enough evasive action.”
Positioning
The continued sale of volatility (as long volatility trades have not panned out), particularly across shorter time horizons, left those, on the other side, warehousing long volatility (a sort-of naive thing to say bluntly as we’re discounting customer trades being paired off with each other).
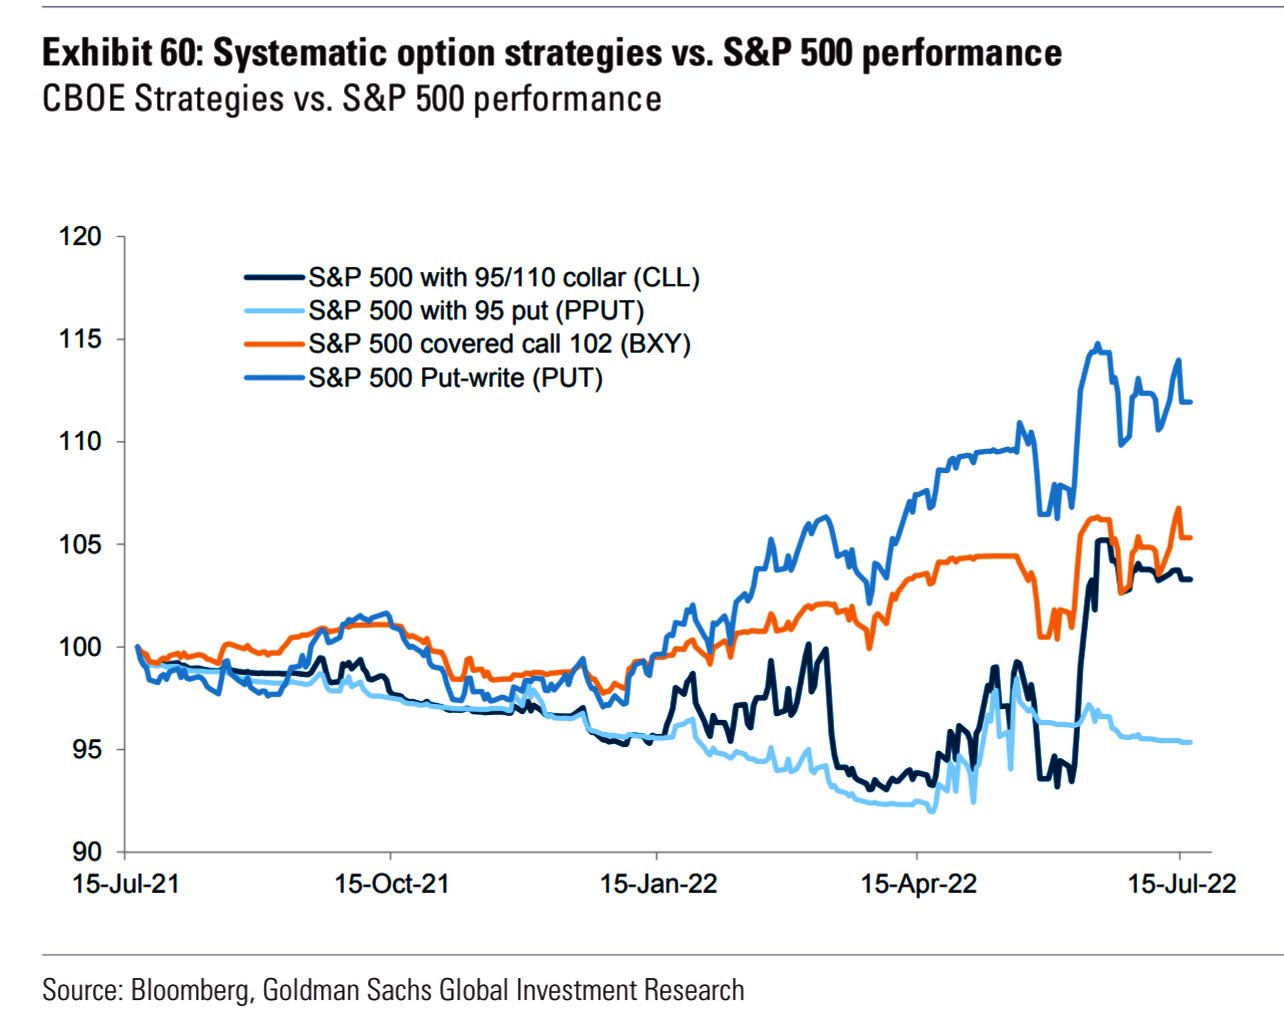
Graphic: Retrieved from Goldman Sachs Group Inc (NYSE: GS).
Nonetheless, these liquidity providers’ positions, all else equal, will maintain or increase in value if underlying(s) realize volatility (especially that far in excess of implied). To (re)hedge, those on the other side will do less to add realized (RVOL) volatility and more to suppress implied (IVOL).
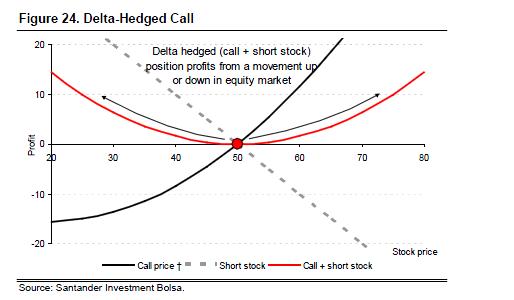
Graphic: Via Banco Santander SA (NYSE: SAN). Into strength (weakness), counterparties’ long call exposures will increase (decrease) in value. To re-hedge, counterparties will buy (sell) weakness (strength).
Moreover, with RVOL creeping (and exceeding, at times) the IVOL, short volatility structures, particularly if unhedged and across short time horizons, are not doing good. The unwinding of these structures can add fuel to the directional resolve (e.g., if the customer buys back a short call, the liquidity provider sells their long call and buys back their short equity to re-hedge).
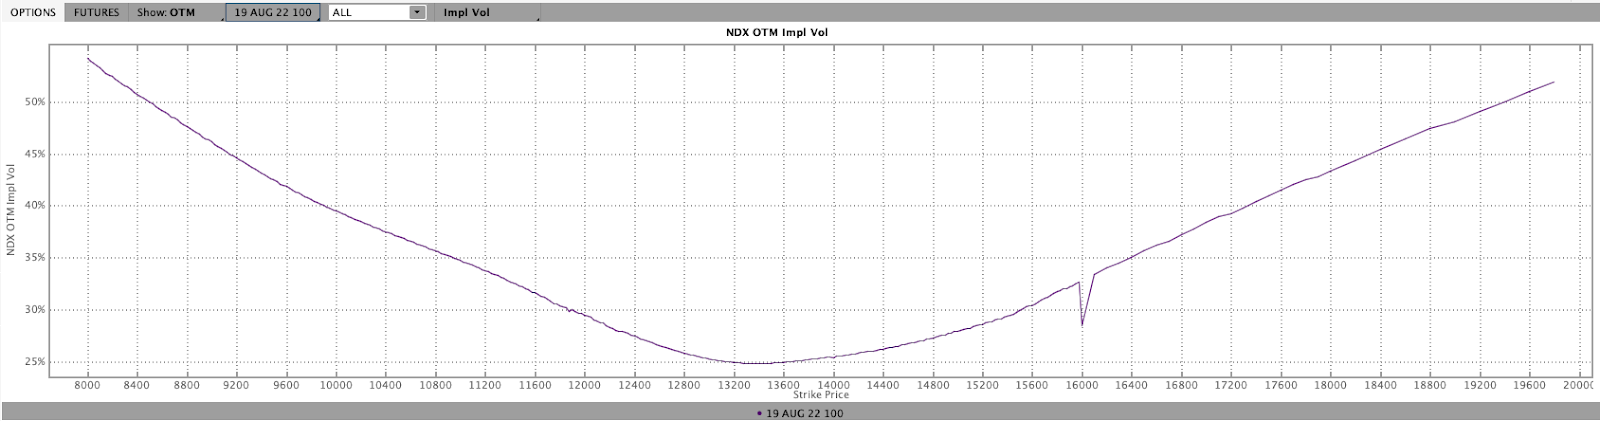
Hence, options structures that we said may be good to take advantage of the “smiley” skew (e.g., zero- or low-cost call ratio spreads) are performing much better.
Graphic: Updated 7/18/2022. Via Charles Schwab Corporation-owned (NYSE: SCHW) TD Ameritrade’s Thinkorswim. Skew resembles more of a smile, rather than a smirk.
Technical
As of 6:45 AM ET, Wednesday’s regular session (9:30 AM – 4:00 PM ET), in the S&P 500, is likely to open in the middle part of a balanced overnight inventory, inside of prior-range and -value, suggesting a limited potential for immediate directional opportunity.
In the best case, the S&P 500 trades higher.
Any activity above the $3,943.25 HVNode puts into play the $3,982.75 LVNode. Initiative trade beyond the LVNode could reach as high as the $4,016.25 HVNode and $4,055.25 LVNode, or higher.
In the worst case, the S&P 500 trades lower.
Any activity below the $3,943.25 HVNode puts into play the $3,909.25 MCPOC. Initiative trade beyond the MCPOC could reach as low as the $3,867.25 LVNode and $3,829.75 MCPOC, or lower.
Click here to load today’s key levels into the web-based TradingView charting platform. Note that all levels are derived using the 65-minute timeframe. New links are produced, daily.
Graphic: 65-minute profile chart of the Micro E-mini S&P 500 Futures.
Considerations: Responsiveness near key-technical areas (that are discernable visually on a chart), suggests technically-driven traders with short time horizons are very active.
Such traders often lack the wherewithal to defend retests and, additionally, the type of trade may be indicative of the other time frame participants waiting for more information to initiate trades.
Definitions
Volume Areas: A structurally sound market will build on areas of high volume (HVNodes). Should the market trend for long periods of time, it will lack sound structure, identified as low volume areas (LVNodes). LVNodes denote directional conviction and ought to offer support on any test.
If participants were to auction and find acceptance into areas of prior low volume (LVNodes), then future discovery ought to be volatile and quick as participants look to HVNodes for favorable entry or exit.
POCs: POCs are valuable as they denote areas where two-sided trade was most prevalent in a prior day session. Participants will respond to future tests of value as they offer favorable entry and exit.
MCPOCs: POCs are valuable as they denote areas where two-sided trade was most prevalent over numerous day sessions. Participants will respond to future tests of value as they offer favorable entry and exit.
Volume-Weighted Average Prices (VWAPs): A metric highly regarded by chief investment officers, among other participants, for quality of trade. Additionally, liquidity algorithms are benchmarked and programmed to buy and sell around VWAPs.
About
After years of self-education, strategy development, mentorship, and trial-and-error, Renato Leonard Capelj began trading full-time and founded Physik Invest to detail his methods, research, and performance in the markets.
Capelj also develops insights around impactful options market dynamics at SpotGamma and is a Benzinga reporter.
In no way should the materials herein be construed as advice. Derivatives carry a substantial risk of loss. All content is for informational purposes only.
The Daily Brief is a free glimpse into the prevailing fundamental and technical drivers of U.S. equity market products. Join the 200+ that read this report daily, below!
Overnight, equity index futures auctioned off of Friday’s regular trade lows. Yields, the dollar, and implied volatility metrics were bid.
There were no changes in the newsflow’s tone this weekend; investors remain concerned over the implications of monetary policy shifts and inflation, as well as war, COVID, and the supply pressures associated.
Ahead is data on S&P Global Inc’s (NYSE: SPGI) U.S. manufacturing PMI (9:45 AM ET), as well as the ISM manufacturing index and construction spending (10:00 AM ET).
Graphic updated 6:30 AM ET. Sentiment Neutral if expected /ES open is inside of the prior day’s range. /ES levels are derived from the profile graphic at the bottom of the following section. Levels may have changed since initially quoted; click here for the latest levels. SqueezeMetrics Dark Pool Index (DIX) and Gamma (GEX) calculations are based on where the prior day’s reading falls with respect to the MAX and MIN of all occurrences available. A higher DIX is bullish. At the same time, the lower the GEX, the more (expected) volatility. Learn the implications of volatility, direction, and moneyness. SHIFT data used for S&P 500 (INDEX: SPX) options activity. Note that options flow is sorted by the call premium spent; if more positive, then more was spent on call options. Breadth reflects a reading of the prior day’s NYSE Advance/Decline indicator. VIX reflects a current reading of the CBOE Volatility Index (INDEX: VIX) from 0-100.
What To Expect
Fundamental: The indexes continue to hold well in the context of severe weaknesses under the hood, so to speak, especially in the high-flying technology and growth of 2020-2021.
Stocks like Zoom Video Communications (NASDAQ: ZM) and Netflix Inc (NASDAQ: NFLX), the beneficiaries of the work-from-home trends, have de-rated substantially since the start of 2022.
In spite of earnings growth (~10% for S&P 500 companies that have reported, per Bloomberg), “the reaction to earnings surprises in April was asymmetric,” and a display of “the outsized role played by outliers.”
For context, “Mega-cap growth (MCG) & Tech earnings are missing by -6.0% at the aggregate level [while] the median company [is] beating by 5.7%.”
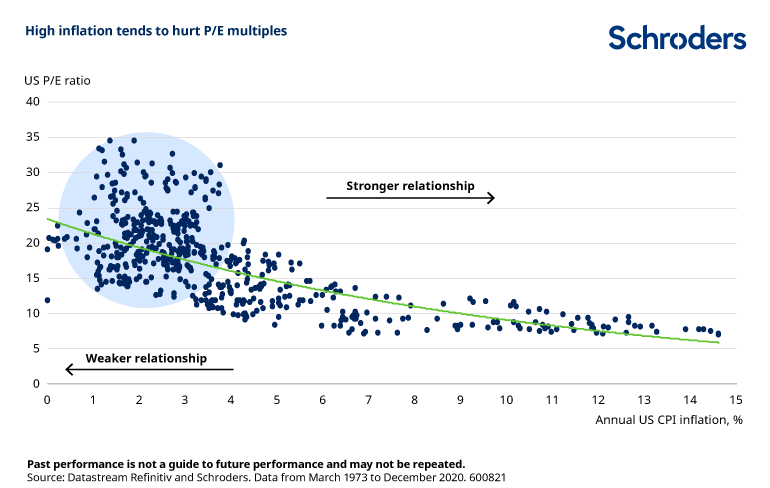
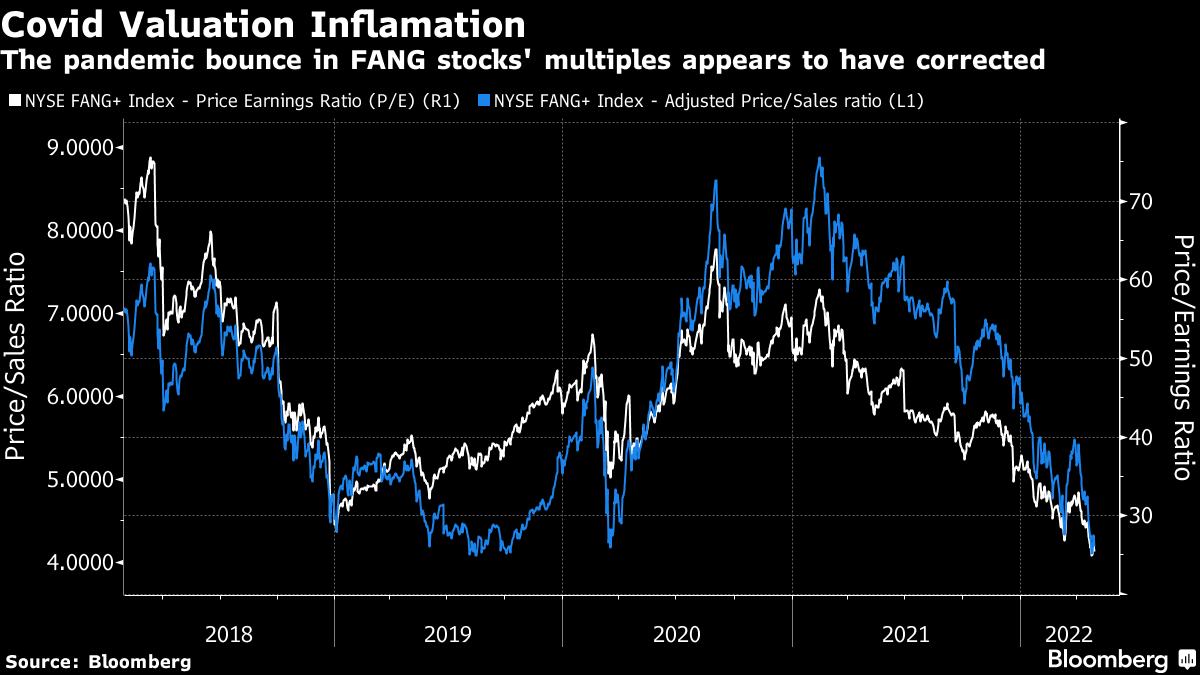
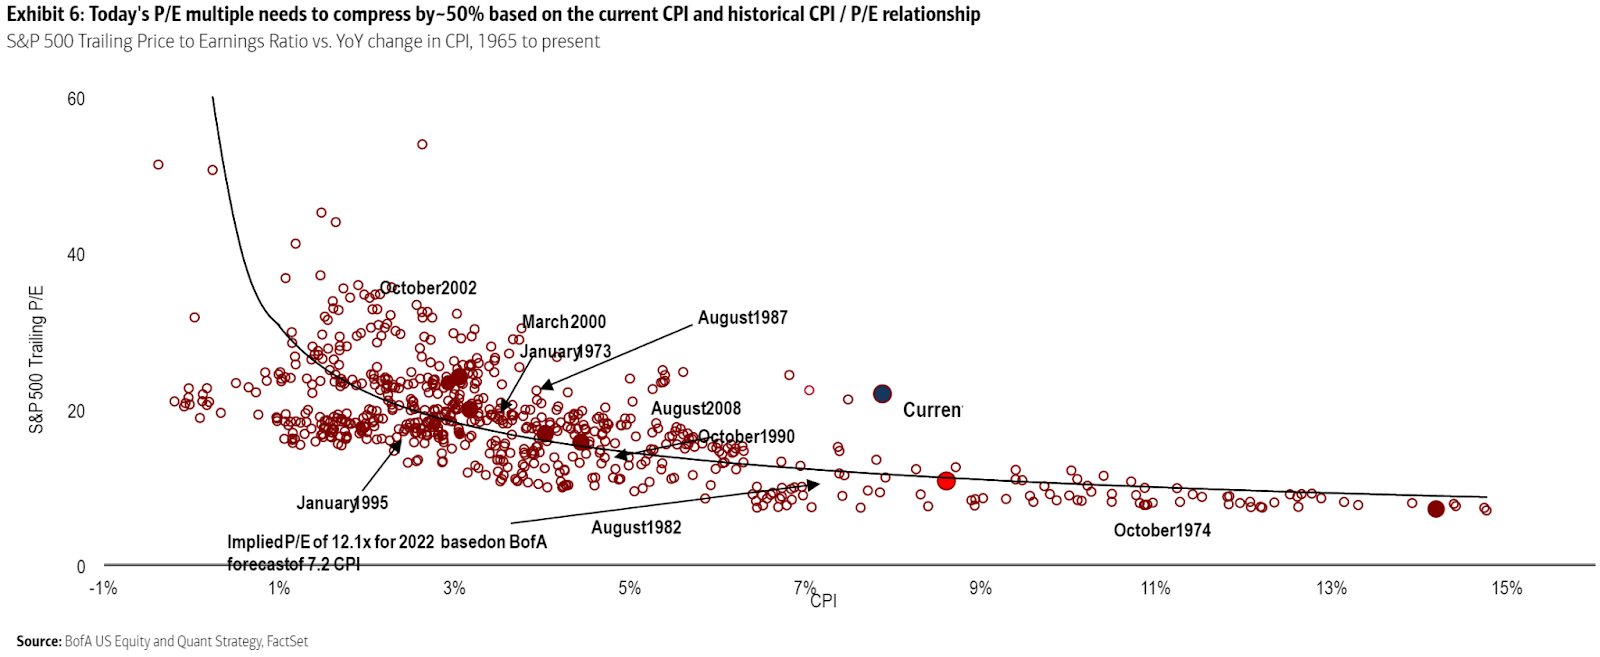
This is as inflation, among other factors, continues to bite into the “over-optimistic multiples driven by the assumption that pandemic-era performance could continue in perpetuity.”
Per Bank of America Corporation (NYSE: BAC), the S&P’s current P/E is way too high, given the current CPI.
Graphic: Via Bank of America Corporation. Taken from Bloomberg. “It’s straightforward common sense that higher inflation would lead to paying a lower multiple of earnings because you expect future earnings to be eaten into by inflation. And common sense is borne out empirically; all else equal, higher inflation does indeed tend to mean lower earnings multiples.”
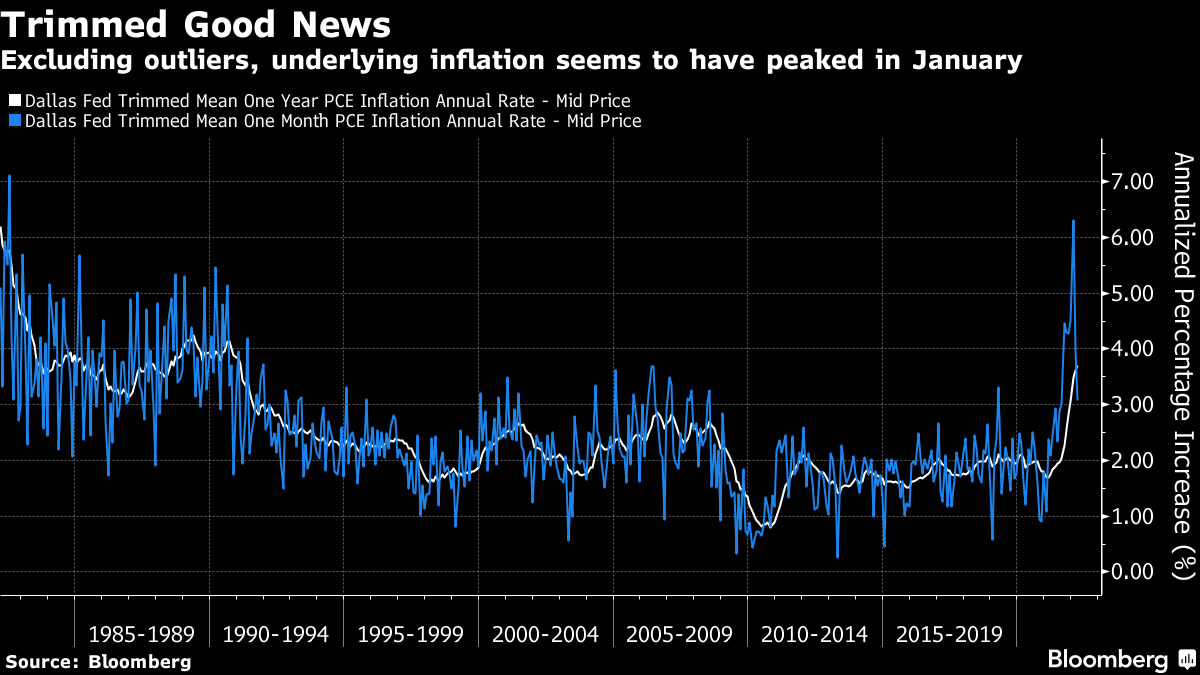
Notwithstanding, trimming outliers, inflation may have peaked and that is a positive for those equity investors who think “inflation is high, but they’re confident that it’s transitory,” therefore current valuations are just.
Per @ConvexityMaven, recession chatter is unwarranted. The economy is expanding and the only worry investors should have is “if the Fed cannot chill nominal GDP.”
That means “rates are going north” and, according to Bank of America Corporation’s Michael Hartnett, “asset prices must reset lower.”
Some investors, like the Japanese, have heeded this message and are offloading billions in Treasuries in anticipation of more attractive levels and “stabilization in long-dated yields.”
Perspectives: Some, including Credit Suisse Group AG’s (NYSE: CS) Zoltan Pozsar, believe market participants are in for a world of [much more] hurt as “central banks can only deal with nominal, not real chokepoints.”
“Banks’ stock buybacks are lowering SLRs as we speak, and the Fed is about to embark on QT, and these nominal balance sheet and liquidity trends, will at some point clash with the realities of a garden variety of supply chain issues,” as a result of geopolitical chokepoints.
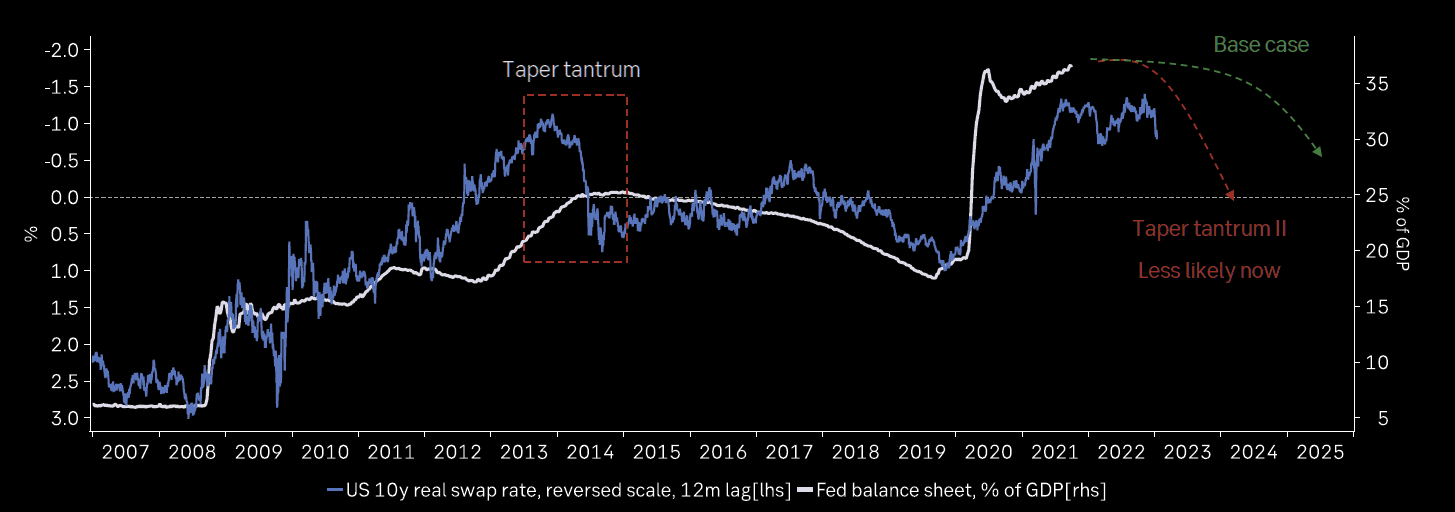
Graphic: Per Bloomberg, “[E]very $1 trillion of QT will equate to a decline of roughly 10% in stocks over the next 12 months or so.”
Given Pozsar’s findings, “The Fed will do QE again by summer 2023.”
Positioning: Recall that the indexes are trading relatively strong, in comparison to constituents, especially those that are smaller technology and growth companies.
Essentially, “we’re two-thirds of the way through a dot-com type collapse,” explains Simplify Asset Management’s Mike Green.
“It’s just happened underneath the surface of the indices which is [that] … dynamic of passive flows supporting the largest stocks within the index, whereas the smaller stocks can be influenced to a greater extent by the behavior of discretionary managers.”
This liquidity supply, apart from passive flows, stems from index-level hedging pressures, also.
Here’s why, as borrowed from our April 27, 2022 commentary.
Participants are well-hedged and use weakness as an opportunity to buy into a less highly valued broader market.
Well-hedged means that customers (i.e., you and I) own protection against long equity exposure. So, that could mean customers own puts and/or are short calls. One of the most dominant flows is the long put, short call.
Such trade offers customers positive, yet asymmetric (gamma), exposure to direction (delta). In other words, negative delta and positive gamma.
The counterparty has exposure to positive delta and negative gamma. If the underlyings trade lower and volatility rises, all else equal, the position will lose. To hedge against these losses, the counterparties will sell underlying into weakness.
If prices reverse and move higher, these counterparties will re-hedge and buy underlying.
Normally, as seen over the bull run of 2020 and 2021, markets are in an uptrend and there’s a strong supply of volatility. Often, customers sell more calls than puts and, in an uptrend, those calls solicit more active hedging than the put options.
Recall that the customer is short the call. That means the counterparty is long the call (a positive delta and gamma trade) and will make money if prices rise, all else equal.
The hedging of this particular exposure (i.e., sell strength, buy weakness), in an uptrend, occurs slower (i.e., counterparts will allow their profits to run), and that’s what can help the market sustain lower volatility trends for longer periods.
When prices reverse and underlyings trade lower, put options solicit increased hedging activity. Given the nature of counterparty exposure to those puts, that hedging happens quickly and can take from market liquidity as to volatility (i.e., buy strength, sell weakness).
Graphic: Via SqueezeMetrics. Equity move lower solicits increased hedging activity of put options. Counterparties have negative gamma exposure to these puts. Therefore, to hedge, they buy strength and sell weakness, adding to realized volatility. This trend is ongoing.
So, what now?
Participants are most concerned (and hedging against) unforeseen monetary policy action and economic chokepoints like a potential Russian default.
Investors will get clarity on some of these issues in the coming sessions.
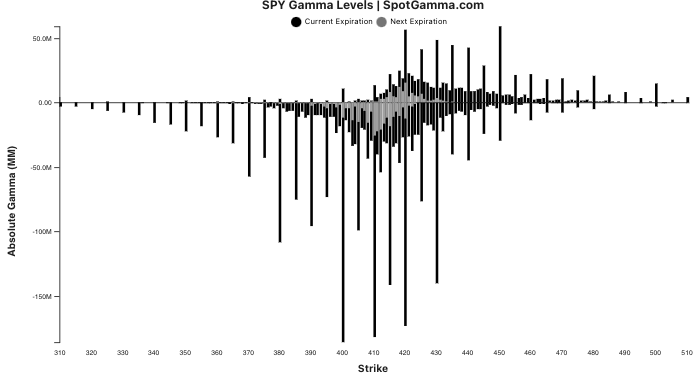
Graphic: Via SpotGamma, the estimated gamma for calls by strike as a positive number and puts as a negative number on the S&P 500 ETF, the SPY. Notice the weight on the put side.
Barring a worst-case scenario, if markets do not perform to the downside (i.e., do not trade lower), those highly-priced (often very short-dated) bets on direction will quickly decay, and hedging flows with respect to time and volatility may bolster sharp rallies.
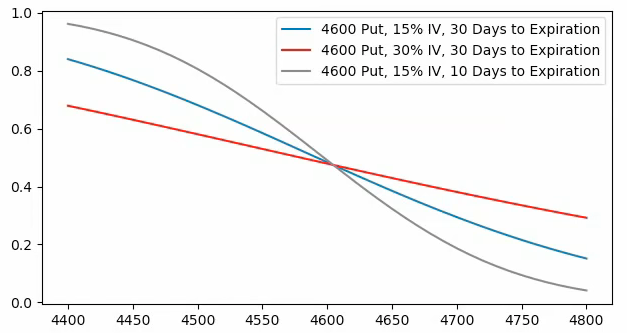
Graphic: Via SpotGamma. “SPX prices X-axis. Option delta Y-axis. When the factors of implied volatility and time change, hedging ratios change. For instance, if SPX is at $4,700.00 and IV jumps 15% (all else equal), the dealer may sell an additional 0.2 deltas to hedge their exposure to the addition of a positive 0.2 delta. The graphic is for illustrational purposes, only.”
Whether those price rises kick off a sustained reversal depends on what the fundamental situation is, then.
Presently, the largest index constituents are starting to succumb to worsening fundamentals and that will, ultimately, feed into the indexes which are pinned due to passive and hedging flows.
In other words, fundamentals will trump this talk of positioning (i.e., it is only in the short-term does this positioning we’ve talked about have greater implications).
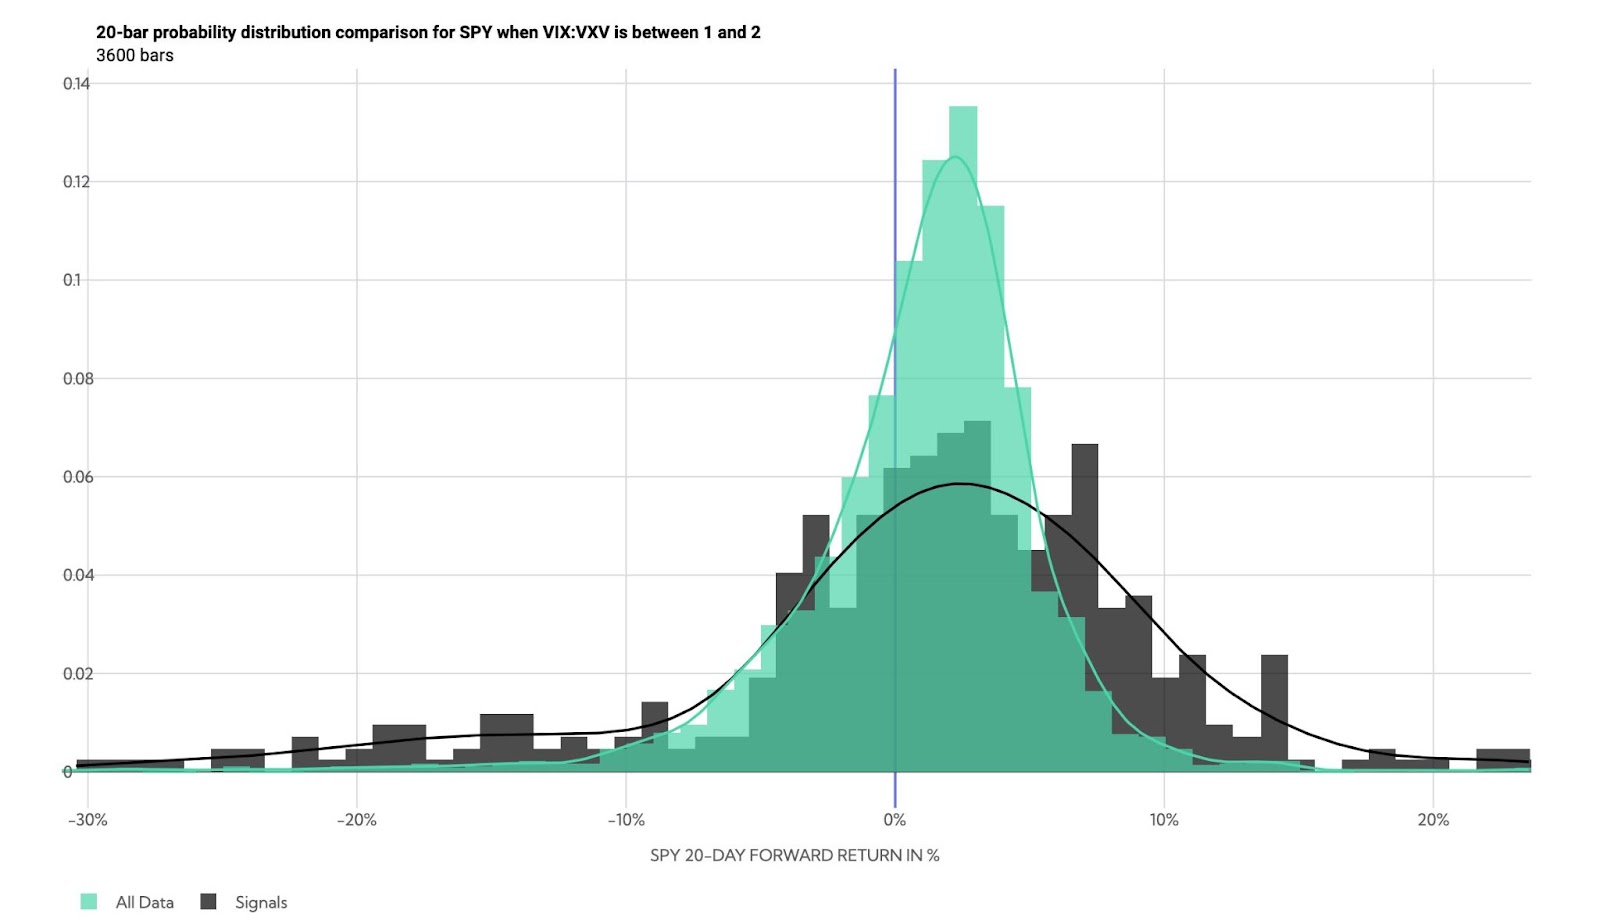
Consideration: The returns distribution, based on implied volatility metrics alone, is skewed positive (though there are some large negative outliers pursuant to The Ambrus Group’s Kris Sidial recent explanation that despite negative sentiment, “nobody is truly scared” and “Fixed strike vols continue to underperform, along with the lack of concern in the VX term structure”).
Caution.
Graphic: Via SpotGamma, “Put vs Call gamma suggests stretched positioning.”
Technical: As of 6:30 AM ET, Monday’s regular session (9:30 AM – 4:00 PM ET), in the S&P 500, will likely open in the middle part of a balanced overnight inventory, inside of prior-range and -value, suggesting a limited potential for immediate directional opportunity.
In the best case, the S&P 500 trades higher; activity above the $4,118.75 regular trade low (RTH Low) puts in play the $4,158.25 overnight high (ONH). Initiative trade beyond the ONH could reach as high as the $4,247.00 untested point of control (VPOC) and $4,279.75 ONH, or higher.
In the worst case, the S&P 500 trades lower; activity below the $4,118.75 RTH Low puts in play the $4,101.25 overnight low (ONL). Initiative trade beyond the ONL could reach as low as the $4,055.75 low volume area (LVNode) and $3,978.50 low volume area (LVNode), or lower.
Click here to load today’s key levels into the web-based TradingView charting platform. Note that all levels are derived using the 65-minute timeframe. New links are produced, daily.
Graphic: 65-minute profile chart of the Micro E-mini S&P 500 Futures.
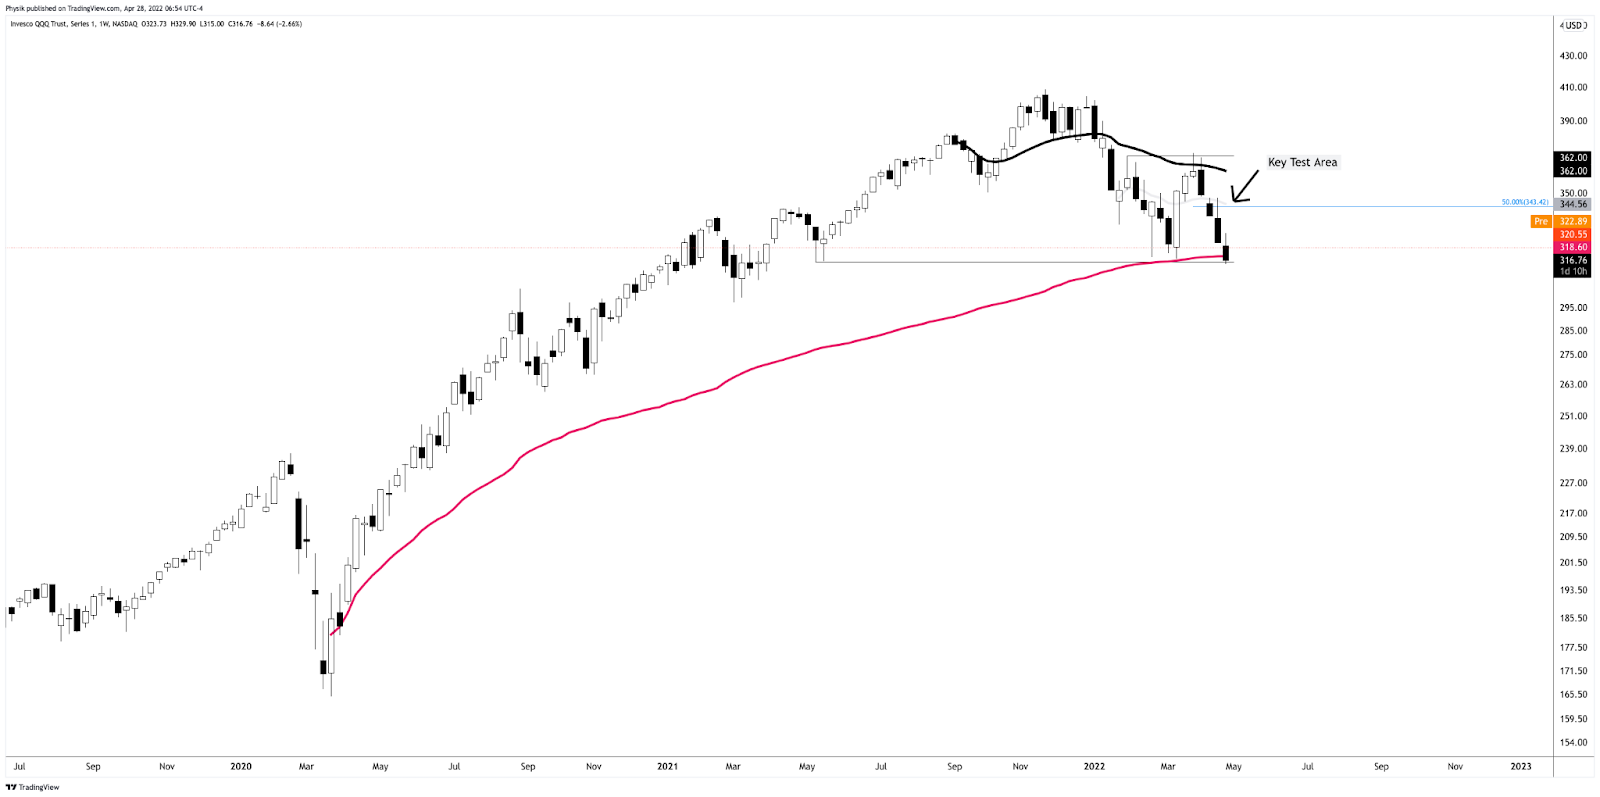
Considerations: Terribly weak price action, last week, with the S&P 500, Nasdaq 100, and Russell 2000 all flirting with early 2022 lows.
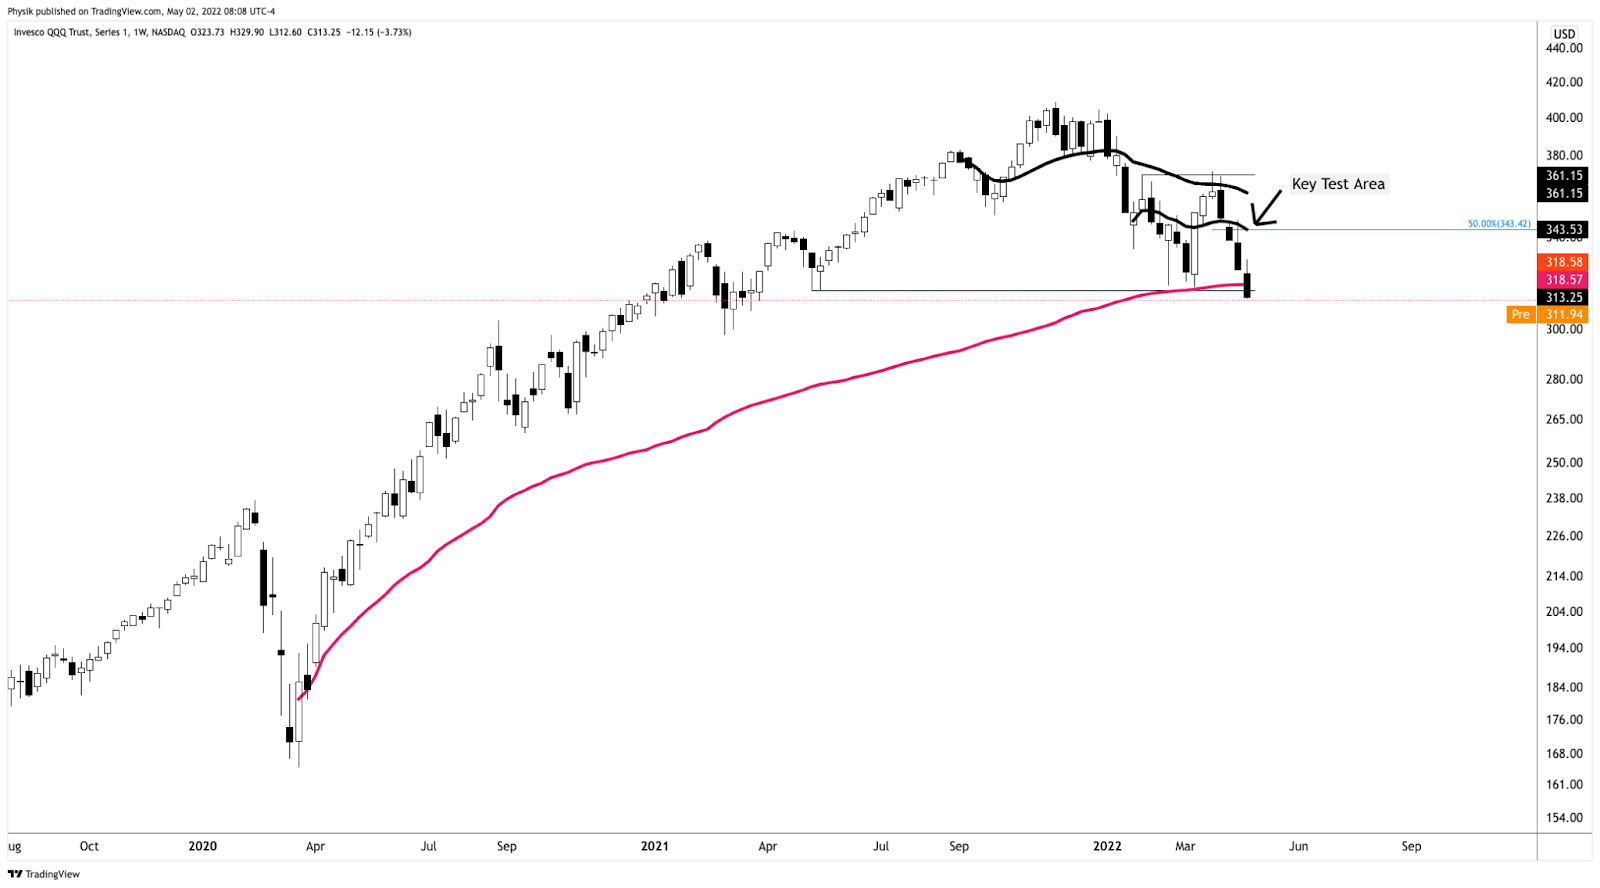
The weaker of the bunch – the Invesco QQQ Trust Series 1 (NASDAQ: QQQ) – just broke a major VWAP anchored from the lows of March 2020.
That indicator denotes the level at which the average buyer/seller is in.
In other words, it is the fairest price to pay for Nasdaq 100 exposure (since March 2020) and, instead of being construed as a so-called demand zone, the level ought to be looked at as overhead supply on tests, higher. Caution.
Graphic: Invesco QQQ Trust Series 1 (NASDAQ: QQQ) with anchored VWAPs.
Definitions
Overnight Rally Highs (Lows): Typically, there is a low historical probability associated with overnight rally-highs (lows) ending the upside (downside) discovery process.
Volume Areas: A structurally sound market will build on areas of high volume (HVNodes). Should the market trend for long periods of time, it will lack sound structure, identified as low volume areas (LVNodes). LVNodes denote directional conviction and ought to offer support on any test.
If participants were to auction and find acceptance into areas of prior low volume (LVNodes), then future discovery ought to be volatile and quick as participants look to HVNodes for favorable entry or exit.
POCs: POCs are valuable as they denote areas where two-sided trade was most prevalent in a prior day session. Participants will respond to future tests of value as they offer favorable entry and exit.
Volume-Weighted Average Prices (VWAPs): A metric highly regarded by chief investment officers, among other participants, for quality of trade. Additionally, liquidity algorithms are benchmarked and programmed to buy and sell around VWAPs.
About
After years of self-education, strategy development, mentorship, and trial-and-error, Renato Leonard Capelj began trading full-time and founded Physik Invest to detail his methods, research, and performance in the markets.
Capelj also develops insights around impactful options market dynamics at SpotGamma and is a Benzinga reporter.
In no way should the materials herein be construed as advice. Derivatives carry a substantial risk of loss. All content is for informational purposes only.
The Daily Brief is a free glimpse into the prevailing fundamental and technical drivers of U.S. equity market products. Join the 200+ that read this report daily, below!
Overnight, equity index futures auctioned sideways-to-higher alongside some upbeat earnings announcements.
Meta Platforms Inc (NASDAQ: FB) surged post-market, yesterday, after its main social network Facebook added more users than expected.
PayPal Holdings Inc (NYSE: PYPL) vowed to rein in costs and boost profits while Qualcomm Inc (NASDAQ: QCOM) rose on an upbeat forecast.
There’s a strong push-and-pull between what’s good and bad. File Deutsche Bank’s (NYSE: DB) recent comments on a pending recession under what’s bad.
The bank sees the Fed Target Rate reaching up to 6% which “will push the economy into a significant recession by late next year.”
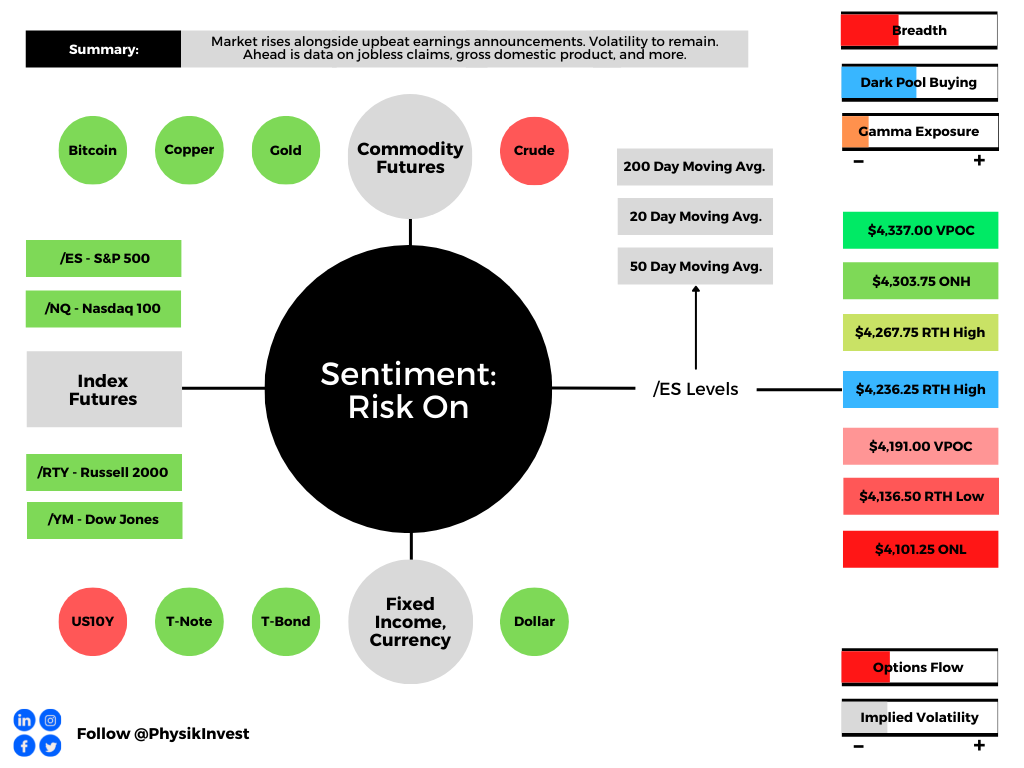
Graphic updated 7:00 AM ET. Sentiment Risk-On if expected /ES open is above the prior day’s range. Sentiment Risk-Off if expected /ES open is below the prior day’s range. /ES levels are derived from the profile graphic at the bottom of the following section. Levels may have changed since initially quoted; click here for the latest levels. SqueezeMetrics Dark Pool Index (DIX) and Gamma (GEX) calculations are based on where the prior day’s reading falls with respect to the MAX and MIN of all occurrences available. A higher DIX is bullish. At the same time, the lower the GEX, the more (expected) volatility. Learn the implications of volatility, direction, and moneyness. SHIFT data used for S&P 500 (INDEX: SPX) options activity. Note that options flow is sorted by the call premium spent; if more positive, then more was spent on call options. Breadth reflects a reading of the prior day’s NYSE Advance/Decline indicator. VIX reflects a current reading of the CBOE Volatility Index (INDEX: VIX) from 0-100.
What To Expect
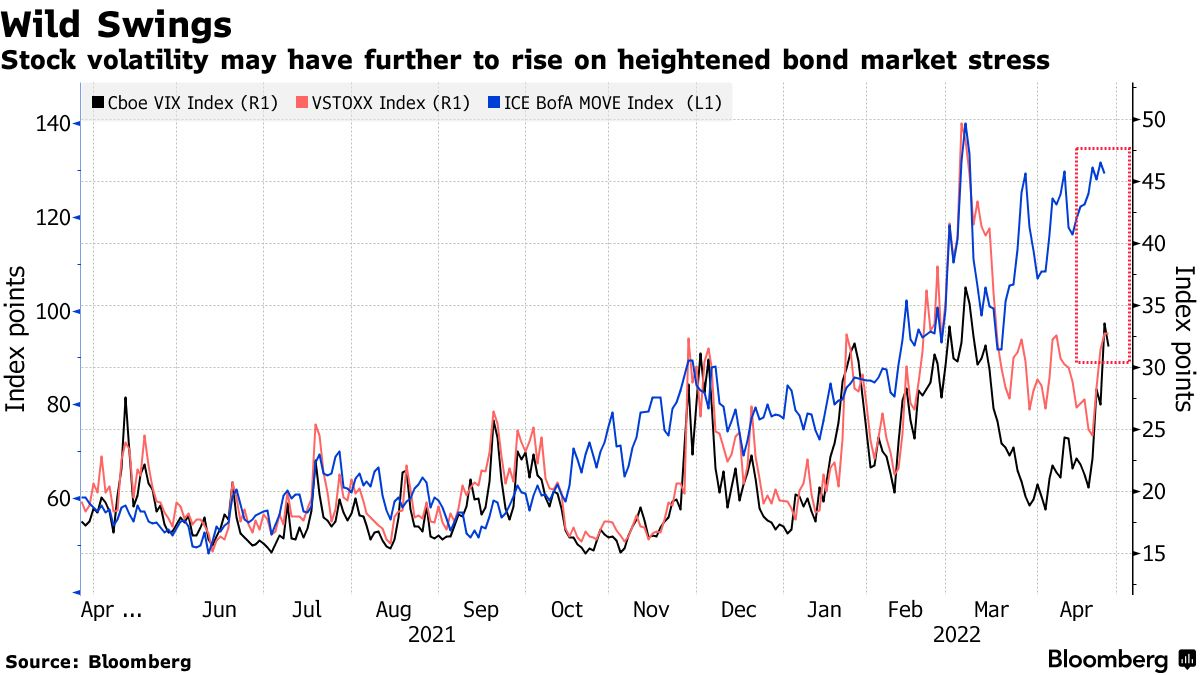
Fundamental: Divergences across different assets and markets continue.
For instance, the equity market’s pricing of risk which we can take as being reflected by the CBOE Volatility Index [INDEX: VIX]) is not moving lock-step with that of measures elsewhere.
The fear in one market tends to spread to others. Regardless of the cause, it seems that equity and bond market participants are not on the same page.
Is that really true, though? Not necessarily.
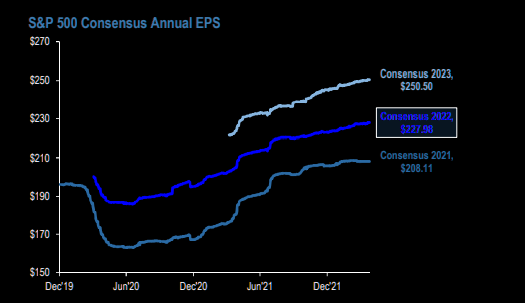
If we look at some single stocks, Netflix Inc (NASDAQ: NFLX), among others (all the while S&P 500 earnings have been revised up) has suffered through a substantial de-rate and volatility as participants priced the implications of policy evolution, slower economic growth, and beyond.
Graphic: Via JPMorgan Chase & Co (NYSE: JPM). Taken from The Market Ear.
That has us returning to pinning at the index level, relative to what the constituents are doing.
As well explained in Physik Invest’s March 3, 2022 commentary, this is more so a function of positioning and structural flows, or supply of liquidity.
Absent some exogenous event, participants are well-hedged for what is known (e.g., rate hikes and quantitative tightening (QT), COVID resurgences, Russia and Ukraine, among other things).
The caveat is that the Federal Reserve is far more aggressive than expected, ramping up QT, “a direct flow of capital to capital markets or flow out of,” per Kai Volatility’s Cem Karsan.
For context, it is the intention to take from the max liquidity (which pushed participants out of the risk curve and promoted a divergence from fundamentals) markets were supplied with, and this has the effect of removing market excesses, some of which have fed into volatility markets.
In part, some of the QT has been reflected in bond prices, JPMorgan Chase & Co (NYSE: JPM) explains. However, should there be far more aggressive monetary action, as Deutsche research suggests, coupled with a worsening of the geopolitical and/or economic situation abroad (e.g., Russian default), markets are likely to succumb.
“Using the balance sheet as a tightening tool represents a large change in the Fed’s attitude, and IS NOT priced into the market,” MacroTourist’s Kevin Muir adds.
“An increase in the pace of tightening of QT should mean lower stocks, wider credit spreads, and a slight reduction in the need for front-end hikes.”
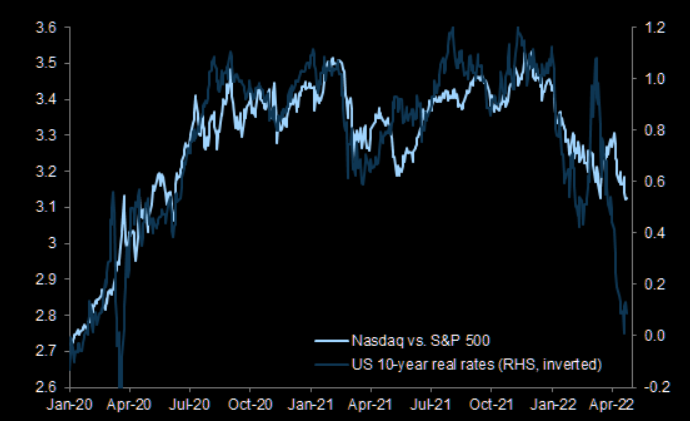
Graphic: Via Goldman Sachs Group Inc (NYSE: GS). Taken from The Market Ear. The “Nasdaq has underperformed the S&P 500 but by less than what the move in real yields would suggest.”
Positioning: Volatility to continue as markets have traded lower and participants have priced up the cost of insurance – particularly at the short-end – on underlying equity exposure.
Graphic: SPX volatility term structure via Refinitiv. Taken from The Market Ear.
This is due to options delta (exposure to direction) being far more sensitive (gamma) across shorter time horizons (i.e., the range across which options deltas shift from “near-zero to near-100% becomes very narrow.”)
Yesterday, markets were pinned after exploring lower in the days prior. The activity was concentrated in short-dated bets at those levels, and that’s in part a result of some of the hedging that went on.
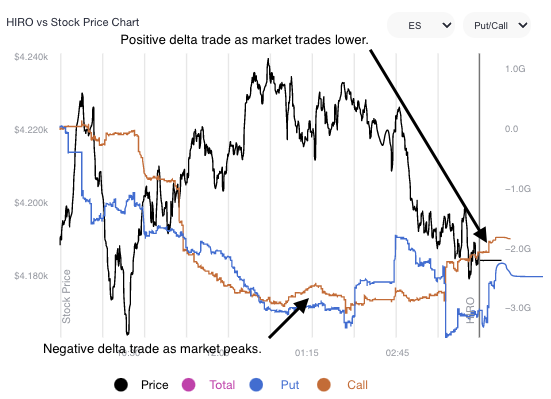
Graphic: Via SpotGamma’s Hedging Impact of Real-Time Options Indicator.
If markets do not perform to the downside (i.e., do not trade lower), those short-dated bets on direction will quickly decay, and hedging flows with respect to time (charm) and volatility (vanna) may bolster sharp rallies.
Whether those price rises have legs depends on what the fundamental situation is, then. Regardless, the returns distribution, based on implied volatility metrics alone, is skewed positive, albeit there are some large negative outliers.
Graphic: Via @HalfersPower. “In backwardation via $VIX: $VIX3M next month [realized volatility] is highest amongst the deciles (d10 >1) ~43% subsequent realized volatility.”
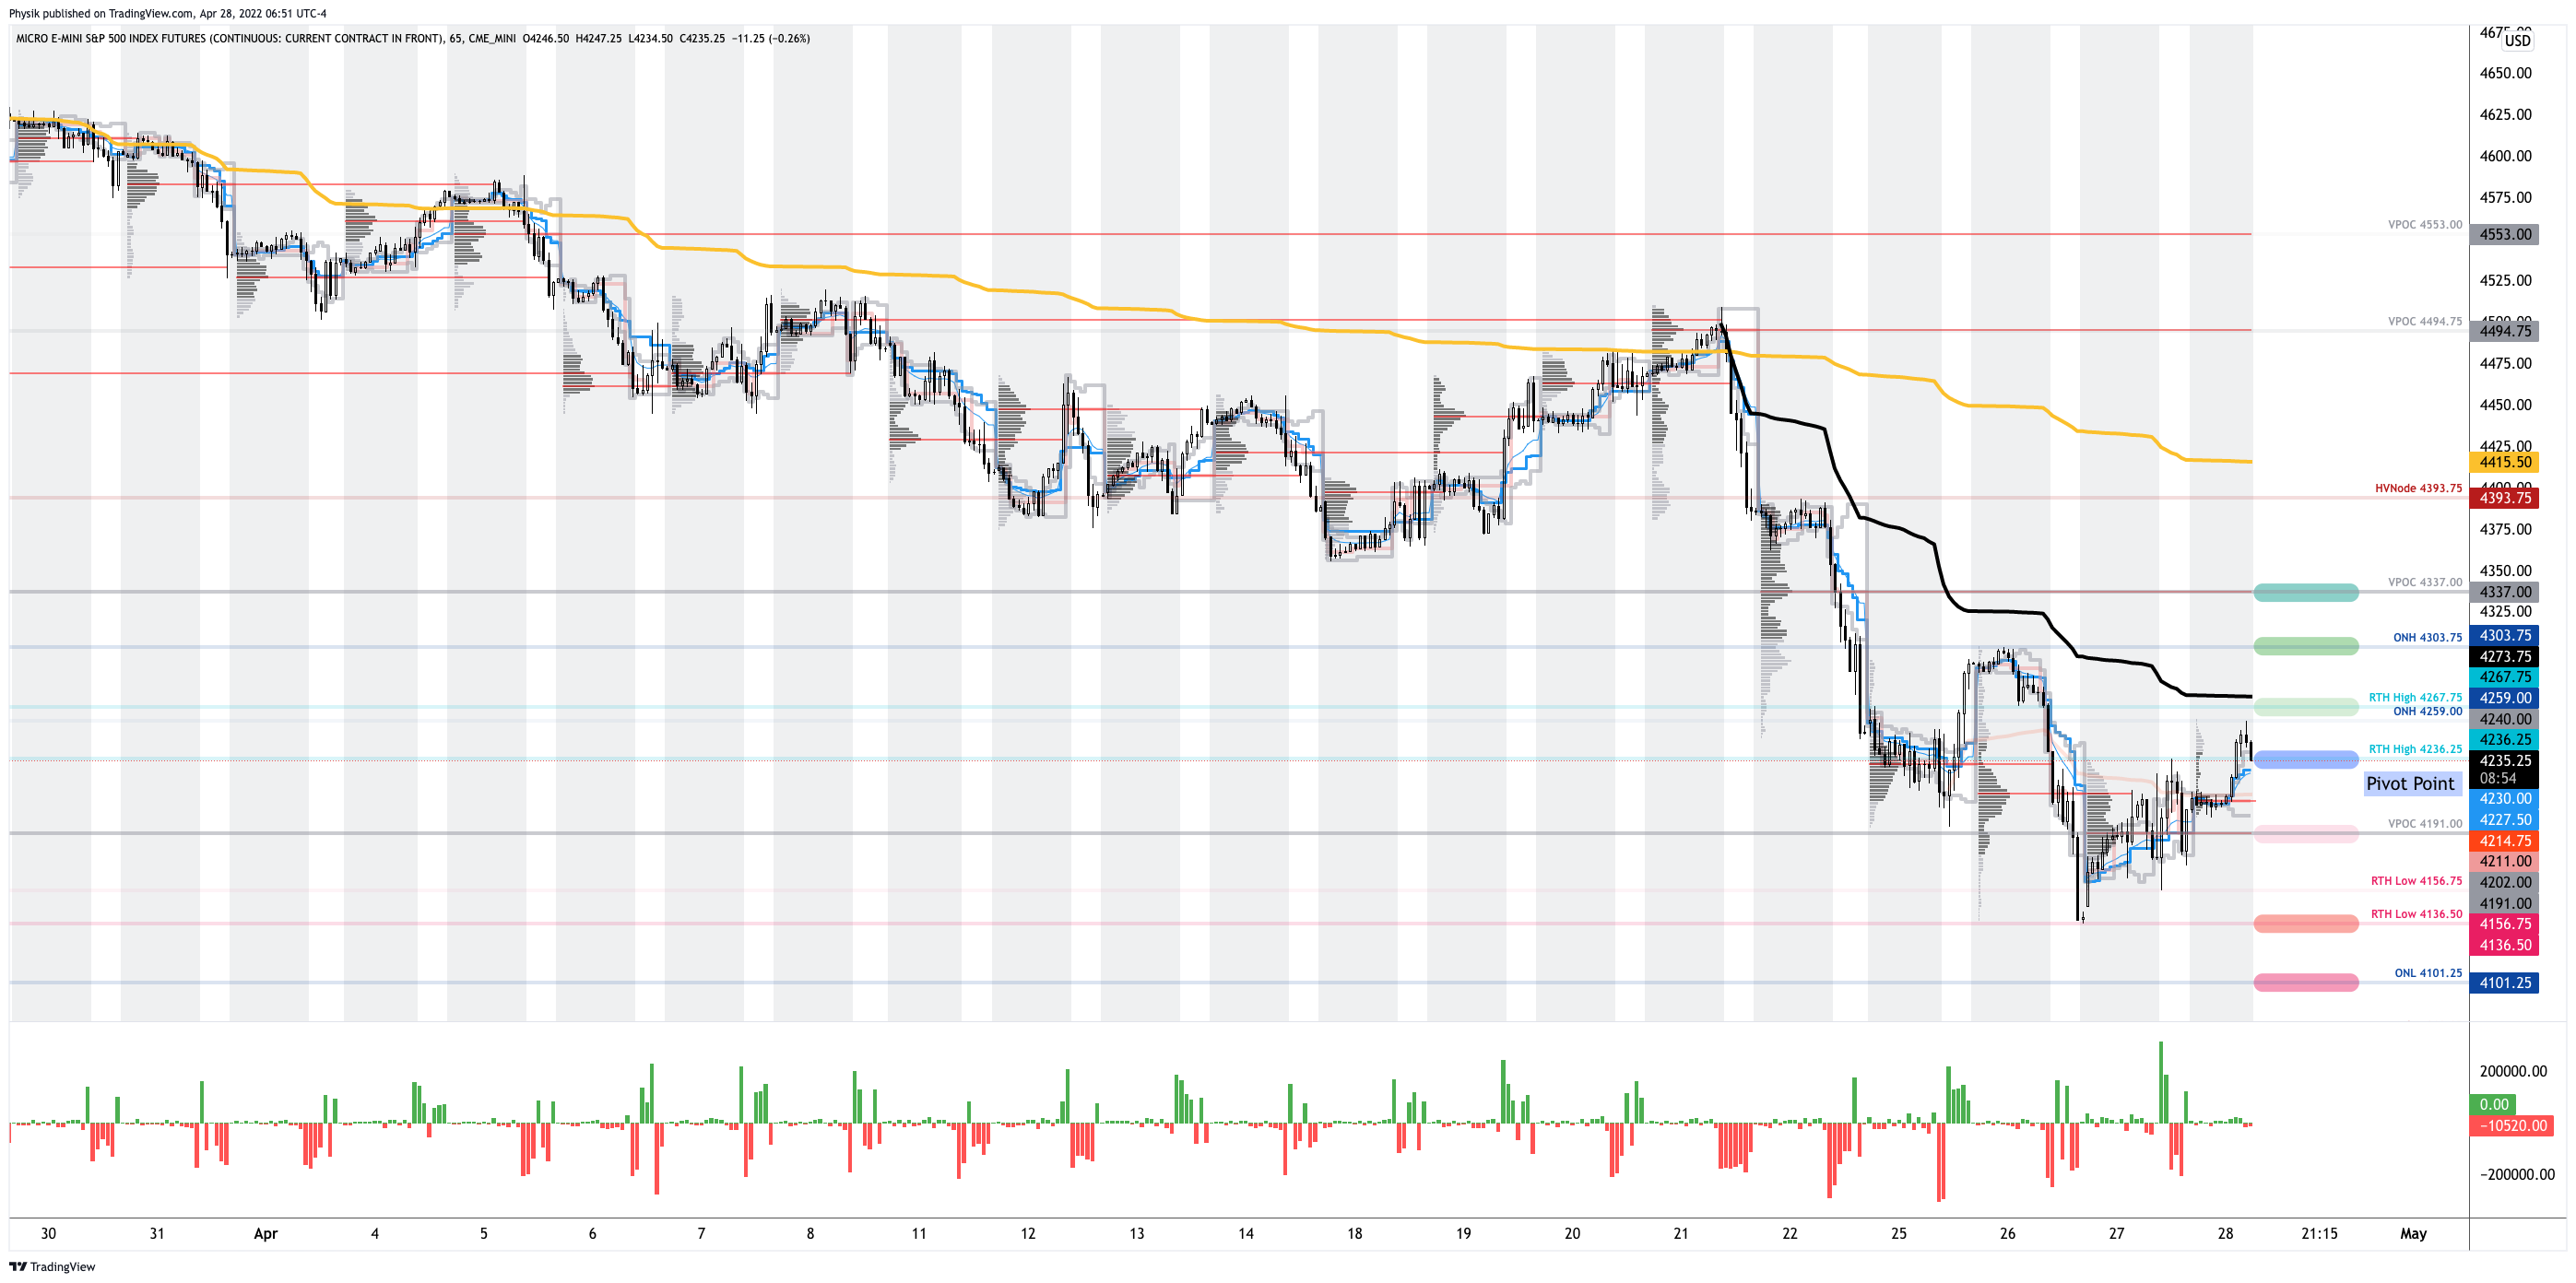
Technical: As of 7:00 AM ET, Thursday’s regular session (9:30 AM – 4:00 PM ET), in the S&P 500, will likely open in the middle part of a positively skewed overnight inventory, just inside of prior-range and -value, suggesting a limited potential for immediate directional opportunity.
In the best case, the S&P 500 trades higher; activity above the $4,236.25 regular trade high (RTH High) puts in play the $4,267.75 RTH High. Initiative trade beyond the $4,267.75 RTH High could reach as high as the $4,303.75 overnight high (ONH) and $4,337.00 untested point of control (VPOC), or higher.
In the worst case, the S&P 500 trades lower; activity below the $4,236.25 RTH High puts in play the $4,191.00 VPOC. Initiative trade beyond the VPOC could reach as low as the $4,136.00 regular trade low (RTH Low) and $4,101.25 overnight low (ONL), or lower.
Click here to load today’s key levels into the web-based TradingView charting platform. Note that all levels are derived using the 65-minute timeframe. New links are produced, daily.
Graphic: 65-minute profile chart of the Micro E-mini S&P 500 Futures.
Considerations: Markets are higher after testing some key levels outlined in prior letters.
The Invesco QQQ Trust Series 1 (NASDAQ: QQQ), one of the weakest products this letter monitors, just tested a major VWAP, yesterday, anchored from the lows of March 2020.
Graphic: Invesco QQQ Trust Series 1 (NASDAQ: QQQ) with anchored VWAPs.
The Nasdaq has led the market down. It may lead the market higher on reversals. We’ll continue to monitor market breadth, among other metrics, for signs of strength.
Definitions
Overnight Rally Highs (Lows): Typically, there is a low historical probability associated with overnight rally-highs (lows) ending the upside (downside) discovery process.
Volume Areas: A structurally sound market will build on areas of high volume (HVNodes). Should the market trend for long periods of time, it will lack sound structure, identified as low volume areas (LVNodes). LVNodes denote directional conviction and ought to offer support on any test.
If participants were to auction and find acceptance into areas of prior low volume (LVNodes), then future discovery ought to be volatile and quick as participants look to HVNodes for favorable entry or exit.
Gamma: Gamma is the sensitivity of an option to changes in the underlying price. Dealers that take the other side of options trades hedge their exposure to risk by buying and selling the underlying. When dealers are short-gamma, they hedge by buying into strength and selling into weakness. When dealers are long-gamma, they hedge by selling into strength and buying into weakness. The former exacerbates volatility. The latter calms volatility.
Vanna: The rate at which the delta of an option changes with respect to volatility.
Charm: The rate at which the delta of an option changes with respect to time.
POCs: POCs are valuable as they denote areas where two-sided trade was most prevalent in a prior day session. Participants will respond to future tests of value as they offer favorable entry and exit.
Volume-Weighted Average Prices (VWAPs): A metric highly regarded by chief investment officers, among other participants, for quality of trade. Additionally, liquidity algorithms are benchmarked and programmed to buy and sell around VWAPs.
About
After years of self-education, strategy development, mentorship, and trial-and-error, Renato Leonard Capelj began trading full-time and founded Physik Invest to detail his methods, research, and performance in the markets.
Capelj also develops insights around impactful options market dynamics at SpotGamma and is a Benzinga reporter.
In no way should the materials herein be construed as advice. Derivatives carry a substantial risk of loss. All content is for informational purposes only.
The Daily Brief is a free glimpse into the prevailing fundamental and technical drivers of U.S. equity market products. Join the 200+ that read this report daily, below!
Overnight, equity index futures auctioned sideways, mostly, after a weak close, Thursday.
Measures of implied volatility remained bid while bonds rose after yields briefly surpassed 1.9%.
Ahead is data on leading economic indicators (10:00 AM ET).
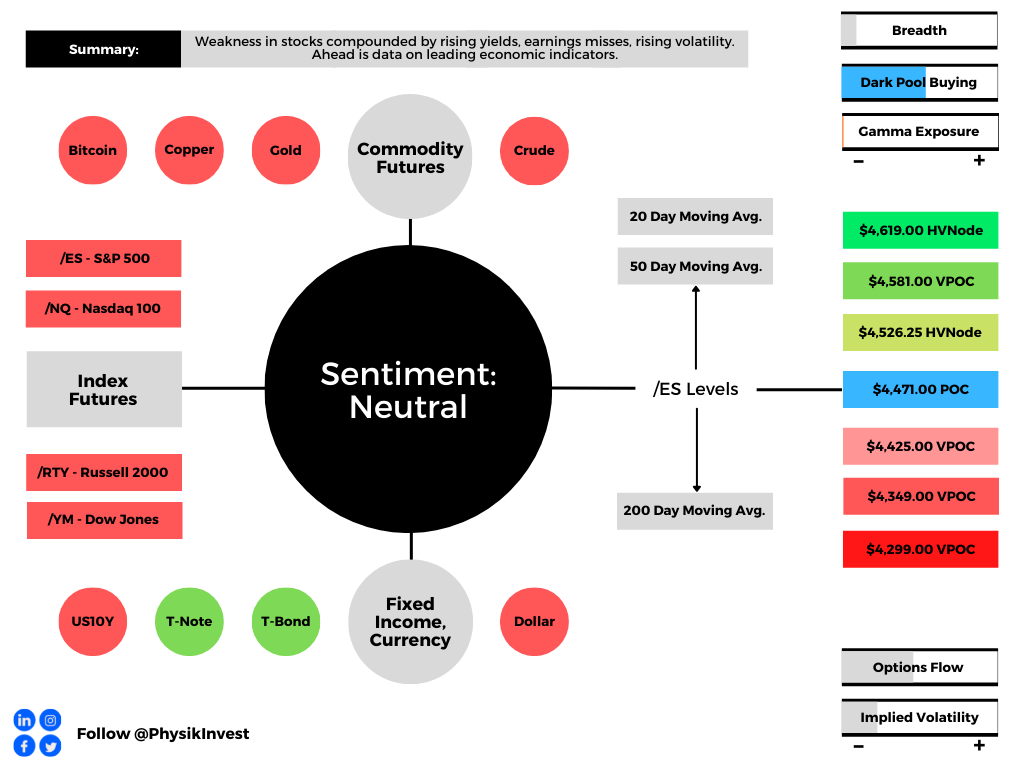
Graphic updated 6:30 AM ET. Sentiment Neutral if expected /ES open is inside of the prior day’s range. /ES levels are derived from the profile graphic at the bottom of the following section. Levels may have changed since initially quoted; click here for the latest levels. SqueezeMetrics Dark Pool Index (DIX) and Gamma (GEX) calculations are based on where the prior day’s reading falls with respect to the MAX and MIN of all occurrences available. A higher DIX is bullish. At the same time, the lower the GEX, the more (expected) volatility. Learn the implications of volatility, direction, and moneyness. SHIFT data used for S&P 500 (INDEX: SPX) options activity. Note that options flow is sorted by the call premium spent; if more positive, then more was spent on call options. Breadth reflects a reading of the prior day’s NYSE Advance/Decline indicator. VIX reflects a current reading of the CBOE Volatility Index (INDEX: VIX) from 0-100.
What To Expect
Fundamental: The Nasdaq dipped into correction territory as stocks extended lower, Thursday.
Weakness was compounded by geopolitical tensions, the prospects of reduced stimulus to combat high inflation, as well as poor responses to earnings results.
Shares of Amazon Inc (NASDAQ: AMZN) just missed the round $3,000.00 figure and Peloton Interactive Inc (NASDAQ: PTON) fell on waning demand, while Netflix Inc (NASDAQ: NFLX) traded down just over 20.00% on a weak subscriber outlook.
“Thursday’s trading pattern looks exactly like a typical session from the summer of 2007 as the sub-prime crisis was beginning to send the first shock waves through the stock market,” said Bloomberg’s John Authers on wild changes in sentiment exacerbating the volatility.
“Big changes of direction in the last hour, with no obvious news to trigger them, became a fact of life.”
Moreover, with pandemic-era speculation still embedded in prices, Authers adds, the removal of central bank liquidity opens the door to even lower prices as the “process to correct a lot of excess is now underway.”
Regardless of how aggressive contractions in monetary policy are, the Federal Reserve will spell out its plans well in advance, Fed Governor Christopher Waller explained.
“I don’t see a 50 basis point hike in March. We have not prepared markets for anything that dramatic. One of our key themes has been not to surprise market, giving well enough advance, in terms of what we’re trying to do.”
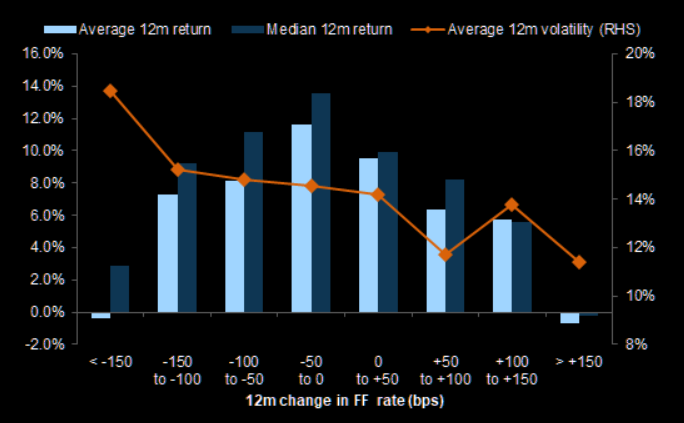
Graphic: Per The Market Ear, “Equities usually deliver lower returns but with lower volatility during faster Fed hiking episodes.”
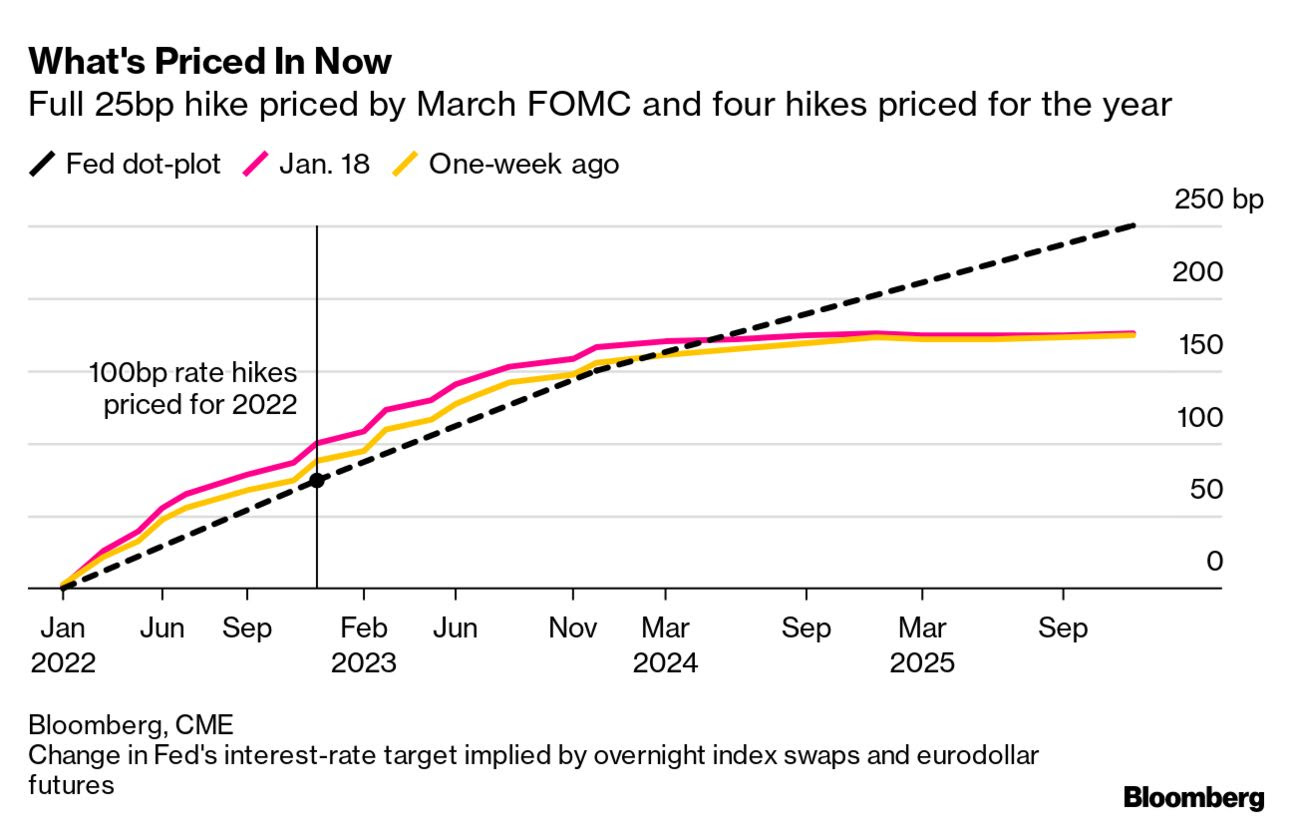
At present, a full 25 basis point hike is priced by March.
Graphic: Via Bloomberg, there are four rate hikes priced for the year.
Per S&P Global Inc (NYSE: SPGI) analyses, these hikes are likely to “cause shorter-term rates, such as the 1- and 2-year Treasury yields, to climb more rapidly than longer-term rates,” potentially pressuring consumer credit, and increasing the costs of loans.
“By launching the reduction in the balance sheet, the Fed could match the rise in short-term rates with a similar rise in longer duration rates,” thus reducing the Fed’s need to hike rates, S&P Global explained.
“Given mortgage rates and corporate borrowing costs are more impacted by movements in 10-year yields than 3-month rates, the Fed funds target rate may not need to be increased as aggressively to get inflation under control,” James Knightley, an ING Groep NV (NYSE: ING) economist, added.
Mortgage Rates normalize: B eware
MBS bonds tend to trade ~75bp higher in rate than other bonds. The FED compressed this to barely 25bp during Covid, but now it's reverting
1) Levered REITs will take a hit 2) Housing will slow 3) Market anticipates balance sheet run off pic.twitter.com/h0CTlEvTCr
Positioning: Per Morgan Stanley’s (NYSE: MS) prime brokerage data, investors are deploying a more defensive tilt to portfolios in the face of a deceleration in sales and margin compression.
This “stock liquidation played into the large negative gamma position which accelerated selling into the close,” according to options modeling and analysis service SpotGamma.
For context, “when a position’s delta falls (rises) with stock or index price rises (falls), the underlying is in a negative-gamma environment.”
In such an environment, the expansion of volatility as a result of demand for downside (put) protection (a lot of which is short-dated and increasingly sensitive to direction) for instance, leaves dealers compounding weakness.
Graphic: Implied volatility term structure shifts higher, mostly at the front-end.
Therefore, in the case of heightened demand for downside put protection (a negative-delta trade), higher implied volatility increases dealer exposure positive delta.
To offset this positive delta exposure, dealers sell more underlying, exacerbating weakness.
The passage of the monthly options expiration (OPEX) ought to clear some of the put-heavy positioning; “removal of this exposure post-OPEX,” coupled with a reduction in embedded event premiums tied to the approaching Federal Open Market Committee (FOMC) event, “will leave dealers with less positive delta exposure to sell against.”
This opens up a window of strength wherein dealers are to take less liquidity (buy strength and sell weakness) and pressure less the market in hedging put-heavy positioning.
Graphic: Taken from The Market Ear. In a lower liquidity environment, dealer hedging matters more.
Technical: As of 6:30 AM ET, Friday’s regular session (9:30 AM – 4:00 PM ET), in the S&P 500, will likely open in the middle part of a balanced overnight inventory, inside of prior-range and -value, suggesting a limited potential for immediate directional opportunity.
Spikes: Spike’s mark the beginning of a break from value. Spikes higher (lower) are validated by trade at or above (below) the spike base (i.e., the origin of the spike). The base is $4,549.00.
In the best case, the S&P 500 trades higher; activity above the $4,471.00 point of control (POC) puts in play the $4,526.25 high volume area (HVNode). Initiative trade beyond the HVNode could reach as high as the $4,581.00 untested point of control (VPOC) and $4,619.00 HVNode, or higher.
In the worst case, the S&P 500 trades lower; activity below the $4,471.00 POC puts in play the $4,425.00 VPOC. Initiative trade beyond the $4,425.00 VPOC could reach as low as the $4,349.00 and $4,299.00 VPOCs, or lower.
Click here to load today’s key levels into the web-based TradingView charting platform. Note that all levels are derived using the 65-minute timeframe. New links are produced, daily.
Graphic: 65-minute profile chart of the Micro E-mini S&P 500 Futures.
What People Are Saying
$VIX vol to S&P relationship is subpar. Lots of pre hedging came in that late Nov – Early Dec right around this range in the S&P, which is why we aren't seeing an aggressive bid for vols. Those hedges are still fresh and there isn't a NEED to run for more. We have also noticed
Tell tale sign of the impending non-collapse: High Yield Credit Spreads have barely budged YTD despite all the residual pain caused by #rotation in the stock market. We could see an uptick post OPEX, but you must #BTD as long as they remain comfortably below their November wides. pic.twitter.com/c9lzyXvbjz
Volume Areas: A structurally sound market will build on areas of high volume (HVNodes). Should the market trend for long periods of time, it will lack sound structure, identified as low volume areas (LVNodes). LVNodes denote directional conviction and ought to offer support on any test.
If participants were to auction and find acceptance into areas of prior low volume (LVNodes), then future discovery ought to be volatile and quick as participants look to HVNodes for favorable entry or exit.
POCs: POCs are valuable as they denote areas where two-sided trade was most prevalent in a prior day session. Participants will respond to future tests of value as they offer favorable entry and exit.
Options Expiration (OPEX): Traditionally, option expiries mark an end to pinning (i.e, the theory that market makers and institutions short options move stocks to the point where the greatest dollar value of contracts will expire) and the reduction dealer gamma exposure.
About
After years of self-education, strategy development, mentorship, and trial-and-error, Renato Leonard Capelj began trading full-time and founded Physik Invest to detail his methods, research, and performance in the markets.
Capelj is also a Benzinga finance and technology reporter interviewing the likes of Shark Tank’s Kevin O’Leary, JC2 Ventures’ John Chambers, FTX’s Sam Bankman-Fried, and ARK Invest’s Catherine Wood, as well as a SpotGamma contributor developing insights around impactful options market dynamics.
Disclaimer
Physik Invest does not carry the right to provide advice.
In no way should the materials herein be construed as advice. Derivatives carry a substantial risk of loss. All content is for informational purposes only.
The Daily Brief is a free glimpse into the prevailing fundamental and technical drivers of U.S. equity market products. Join the 200+ that read this report daily, below!
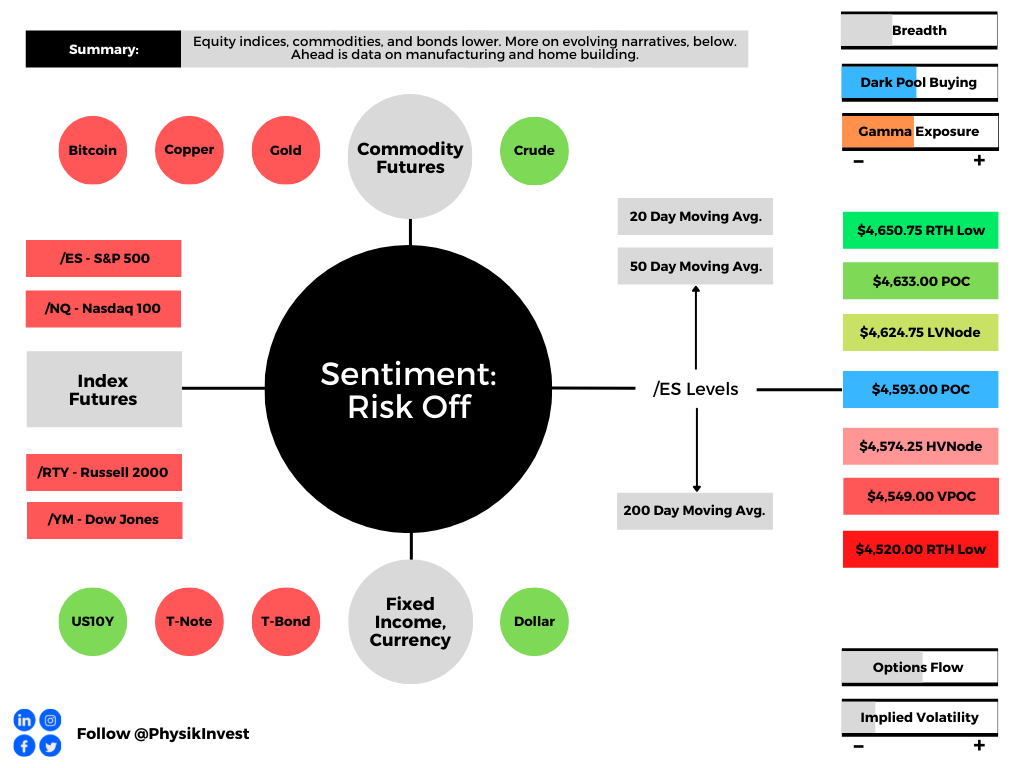
Overnight, equity index futures auctioned lower alongside a surge in bond yields. Rate-sensitive sectors were weakest in pre-market trade, in comparison to the value and cyclical names.
Earnings are now in focus. Participants shall use earnings updates to gauge how companies are performing in spite of omicron, among other challenges.
Ahead is data on the Empire Manufacturing Index (8:30 AM ET) and NAHB Home Builders Index (10:00 AM ET).
Graphic updated 6:30 AM ET. Sentiment Risk-Off if expected /ES open is below the prior day’s range. /ES levels are derived from the profile graphic at the bottom of the following section. Levels may have changed since initially quoted; click here for the latest levels. SqueezeMetrics Dark Pool Index (DIX) and Gamma (GEX) calculations are based on where the prior day’s reading falls with respect to the MAX and MIN of all occurrences available. A higher DIX is bullish. At the same time, the lower the GEX, the more (expected) volatility. Learn the implications of volatility, direction, and moneyness. SHIFT data used for S&P 500 (INDEX: SPX) options activity. Note that options flow is sorted by the call premium spent; if more positive, then more was spent on call options. Breadth reflects a reading of the prior day’s NYSE Advance/Decline indicator. VIX reflects a current reading of the CBOE Volatility Index (INDEX: VIX) from 0-100.
What To Expect
Fundamental: Ahead of earnings releases from Goldman Sachs Group (NYSE: GS), Morgan Stanley (NYSE: MS), Bank of America (NYSE: BAC), and Netflix (NASDAQ: NFLX), as well as key rate decisions, indices sold heavy.
The Nasdaq 100 led the decline after holiday-trade, Monday, as yields surged alongside concerns central banks would tighten monetary policy sooner than expected.
This is as higher rates have the potential to decrease the present value of future earnings, making stocks, especially those that are high growth, less attractive.
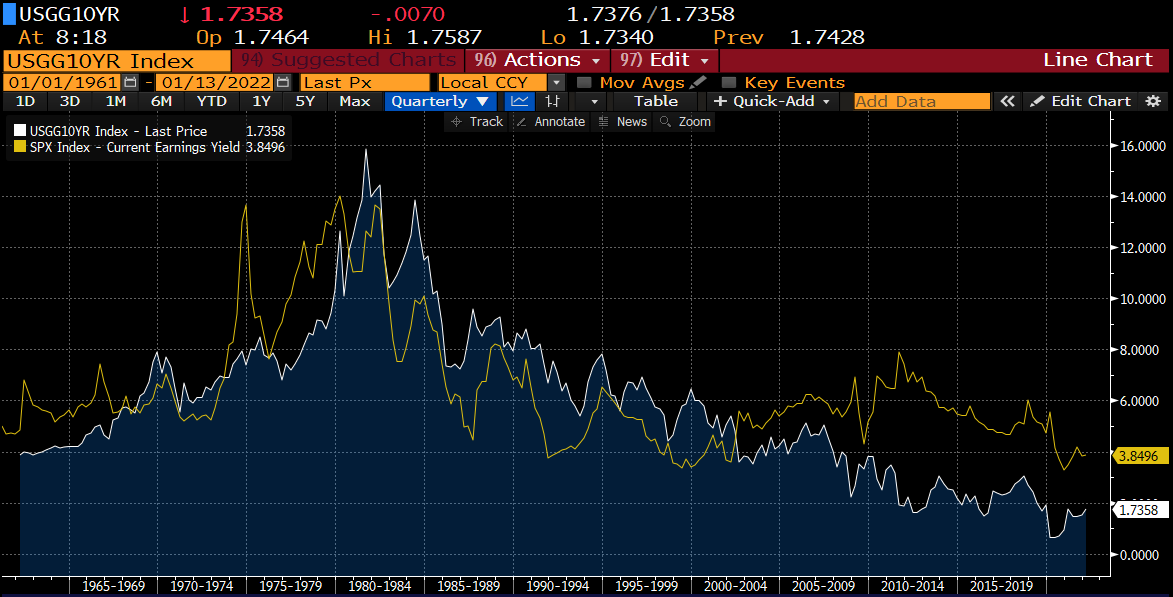
“The rationale behind this is the trade-off,” Grit Capital put well in a recent newsletter.
“Why would I park my money somewhere that is only yielding 1%, when I can invest in riskier assets that can raise my return?”
Graphic: Per Grit Capital, “A common proxy that a lot of people look at is the S&P500’s earnings yield (yellow) vs. the 10yr (white).”
At the same time, narratives around quantitative tightening (i.e., the reduction in the size of the Federal Reserve’s balance sheet) are growing louder.
This is what Andy Constan of Damped Spring Advisors refers to as the QT drumbeat.
This drumbeat is to intensify in spite of strong economic and earnings growth, as well as a moderation in inflation, Constan says.
“The lack of additional liquidity provided by Fed purchase will also remove a damper for the market and the economy keeping asset volatility well bid, while also causing asset diversification benefit to fall, generating rising portfolio volatility and the risk demanded to hold assets.”
Note: Check out this Constan’s really interesting story, below!
Graphic: Via The Market Ear, “Temporary relief from Powell – slow reverse QE’ confirmed. Powell says Fed will stop replacing maturing bonds, but will not sell holdings: slow QT.”
“If current, priced in, inflation and growth expectations are exactly realized we predict that risk premiums on 30-year yields will increase by 15bp and equity risk premium by 30bp,” Constan adds. “These risk premium expansions will generate a 2% headwind on long bond prices and a 10% headwind for equity prices.”
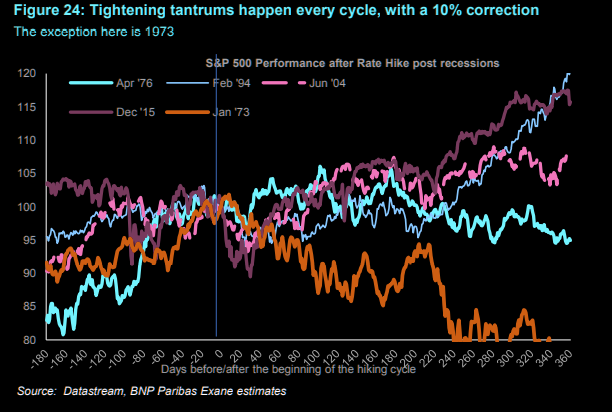
Constan’s comments line up with that of Morgan Stanley’s which sees markets selling down 10-20% during H1 2022, as expectations call for five 25 bp hikes. History is in alignment, below.
Graphic: S&P 500 performance before and after rate hikes, via The Market Ear.
So, despite recent inflows and “light positioning,” taking all of the above comments together, the window for stocks to rally is closing.
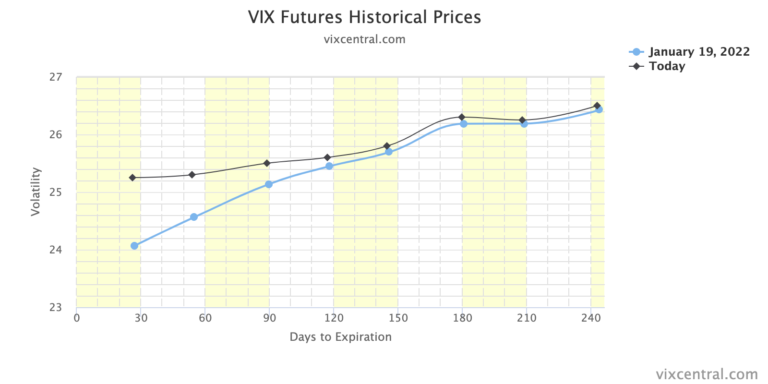
Positioning: The coming January 19 expiration of options on the Cboe Volatility Index (INDEX: VIX) and January 21 monthly equity options expiration (OPEX) has major implications.
According to Constan, the “[o]ptions expiration which includes lots of LEAP contracts will be a catalyst for a squeeze rally and a post-OpEx sell-off.”
This is as, according to Kai Volatility’s Cem Karsan, there is a constant structural positioning that naturally drives markets higher.
“I use this analogy of a jet,” he explained, referencing the three factors – the change in the underlying price (gamma), implied volatility (vanna), and time (charm) – that are well known to impact an options exposure to directional risk or delta.
“[T]he hedging vanna and charm flows, and whatnot will push the markets higher.”
To note, though, with narratives around higher rates and QT strengthening, so to speak, divergences between the S&P 500 and metrics like the Bond Closed-End Fund (CEF) Advance-Decline line have already appeared.
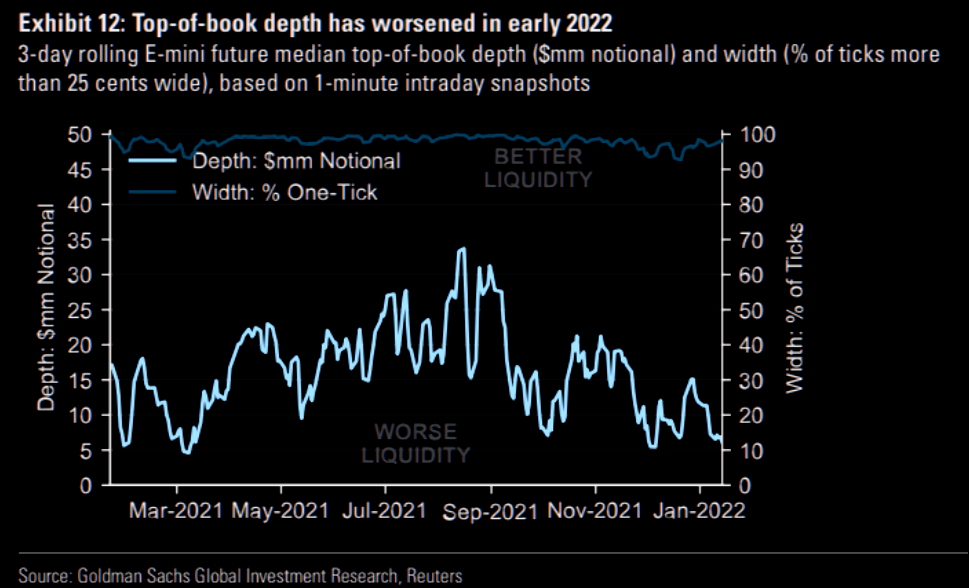
As McClellan Financial Publications explains, “liquidity has suddenly become a problem, and it is affecting the more liquidity-sensitive issues first. That can be a prelude to that same illiquidity coming around and biting the big cap stocks that drive the major averages.”
As an aside, some believe that the Fed’s removal of liquidity has the potential to prick the bubble, prompting a cascading reaction that exacerbates underlying price movements.
“It’s not a coincidence that the mid-February to mid-March 2020 downturn literally started the day after February expiration and ended the day of March quarterly expiration,” Karsan adds.
“These derivatives are incredibly embedded in how the tail reacts and there’s not enough liquidity, given the leverage, if the Fed were to taper.”
Technical: As of 6:30 AM ET, Tuesday’s regular session (9:30 AM – 4:00 PM ET), in the S&P 500, will likely open in the lower part of a negatively skewed overnight inventory, outside of prior-range and -value, suggesting a potential for immediate directional opportunity.
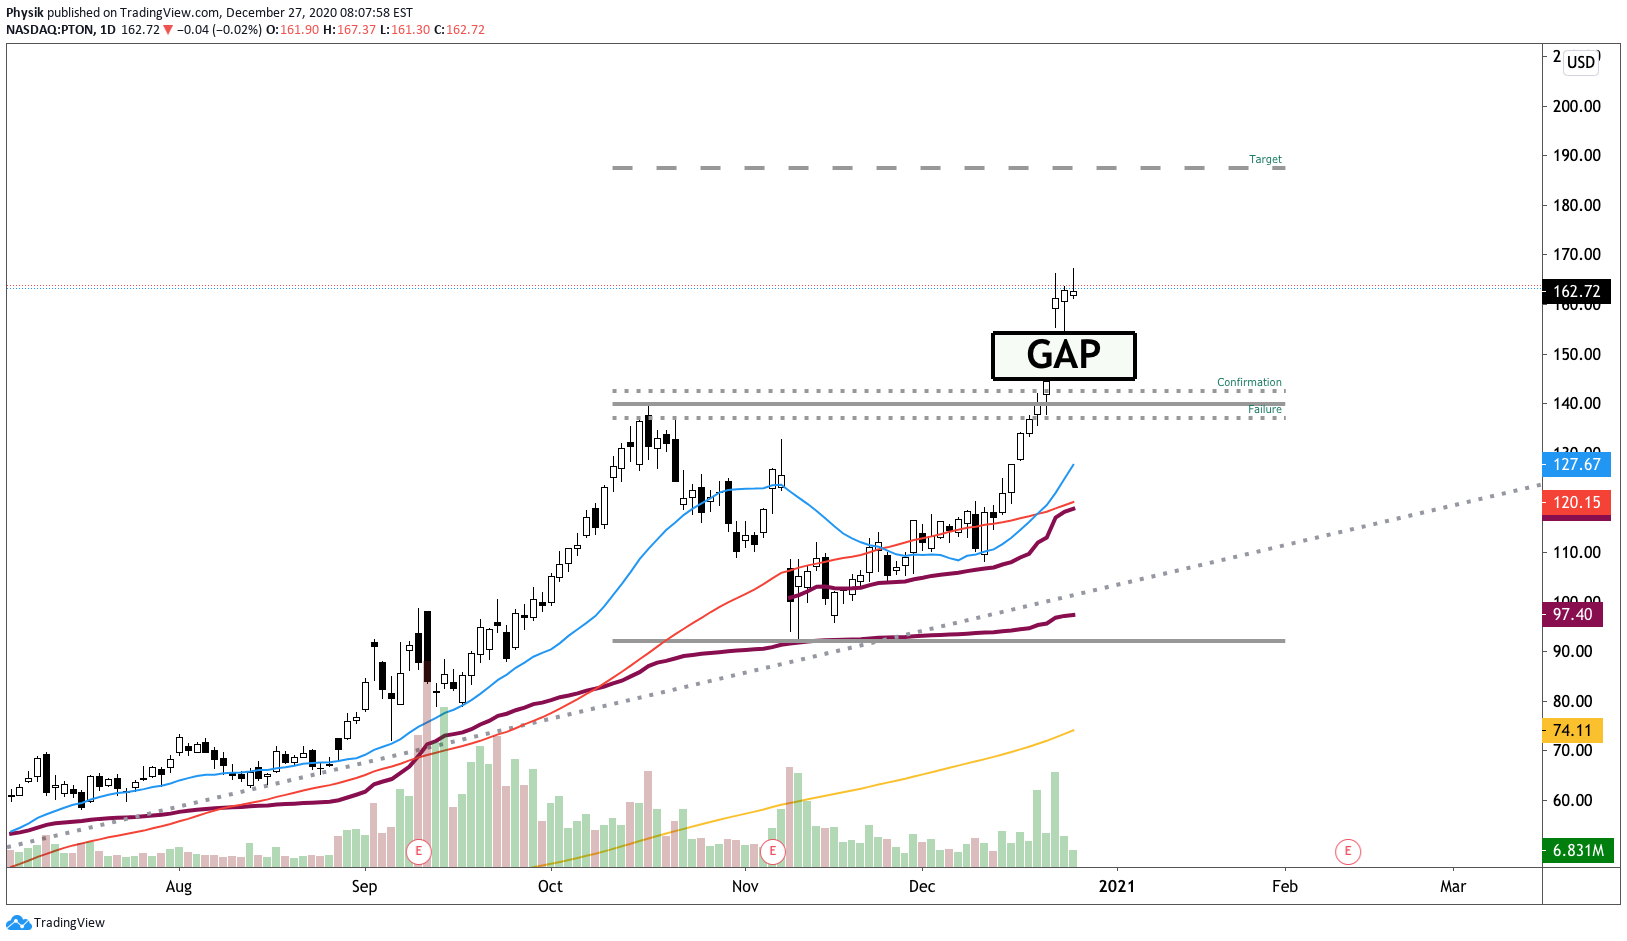
Gap Scenarios: Gaps ought to fill quickly. Should they not, that’s a signal of strength; do not fade. Leaving value behind on a gap-fill or failing to fill a gap (i.e., remaining outside of the prior session’s range) is a go-with indicator.

Auctioning and spending at least 1-hour of trade back in the prior range suggests a lack of conviction; in such a case, do not follow the direction of the most recent initiative activity.
In the best case, the S&P 500 trades higher; activity above the $4,593.00 point of control (POC) puts in play the $4,624.75 low volume area (LVNode). Initiative trade beyond the LVNode could reach as high as the $4,633.00 POC and $4,650.75 regular trade low (RTH Low), or higher.
In the worst case, the S&P 500 trades lower; activity below the $4,593.00 POC puts in play the $4,574.25 high volume area (HVNode). Initiative trade beyond the HVNode could reach as low as the $4,549.00 VPOC and $4,520.00 RTH Low, or lower.
Considerations: The S&P 500 remains above its 200-day simple moving average. The long-term trend remains up.
Click here to load today’s key levels into the web-based TradingView charting platform. Note that all levels are derived using the 65-minute timeframe. New links are produced, daily.
Graphic: 65-minute profile chart of the Micro E-mini S&P 500 Futures.
Definitions
Volume Areas: A structurally sound market will build on areas of high volume (HVNodes). Should the market trend for long periods of time, it will lack sound structure, identified as low volume areas (LVNodes). LVNodes denote directional conviction and ought to offer support on any test.
If participants were to auction and find acceptance into areas of prior low volume (LVNodes), then future discovery ought to be volatile and quick as participants look to HVNodes for favorable entry or exit.
POCs: POCs are valuable as they denote areas where two-sided trade was most prevalent in a prior day session. Participants will respond to future tests of value as they offer favorable entry and exit.
MCPOCs: POCs are valuable as they denote areas where two-sided trade was most prevalent over numerous day sessions. Participants will respond to future tests of value as they offer favorable entry and exit.
Options Expiration (OPEX): Traditionally, option expiries mark an end to pinning (i.e, the theory that market makers and institutions short options move stocks to the point where the greatest dollar value of contracts will expire) and the reduction dealer gamma exposure.
About
After years of self-education, strategy development, mentorship, and trial-and-error, Renato Leonard Capelj began trading full-time and founded Physik Invest to detail his methods, research, and performance in the markets.
Capelj is also a Benzinga finance and technology reporter interviewing the likes of Shark Tank’s Kevin O’Leary, JC2 Ventures’ John Chambers, FTX’s Sam Bankman-Fried, and ARK Invest’s Catherine Wood, as well as a SpotGamma contributor developing insights around impactful options market dynamics.
Disclaimer
Physik Invest does not carry the right to provide advice.
In no way should the materials herein be construed as advice. Derivatives carry a substantial risk of loss. All content is for informational purposes only.
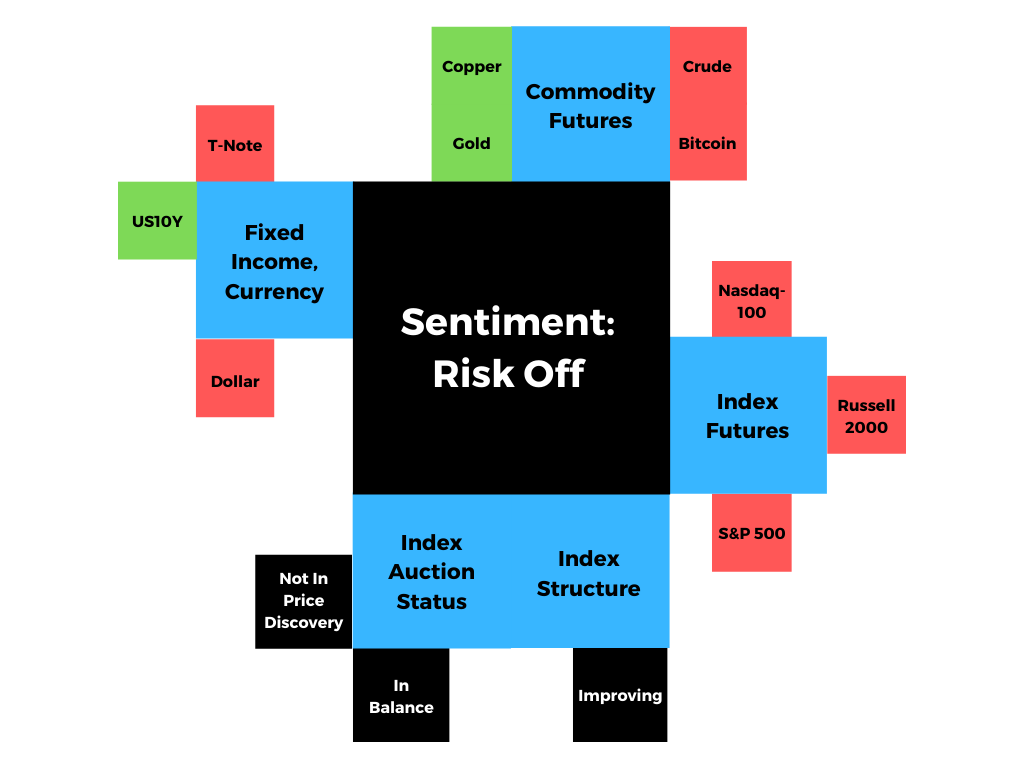
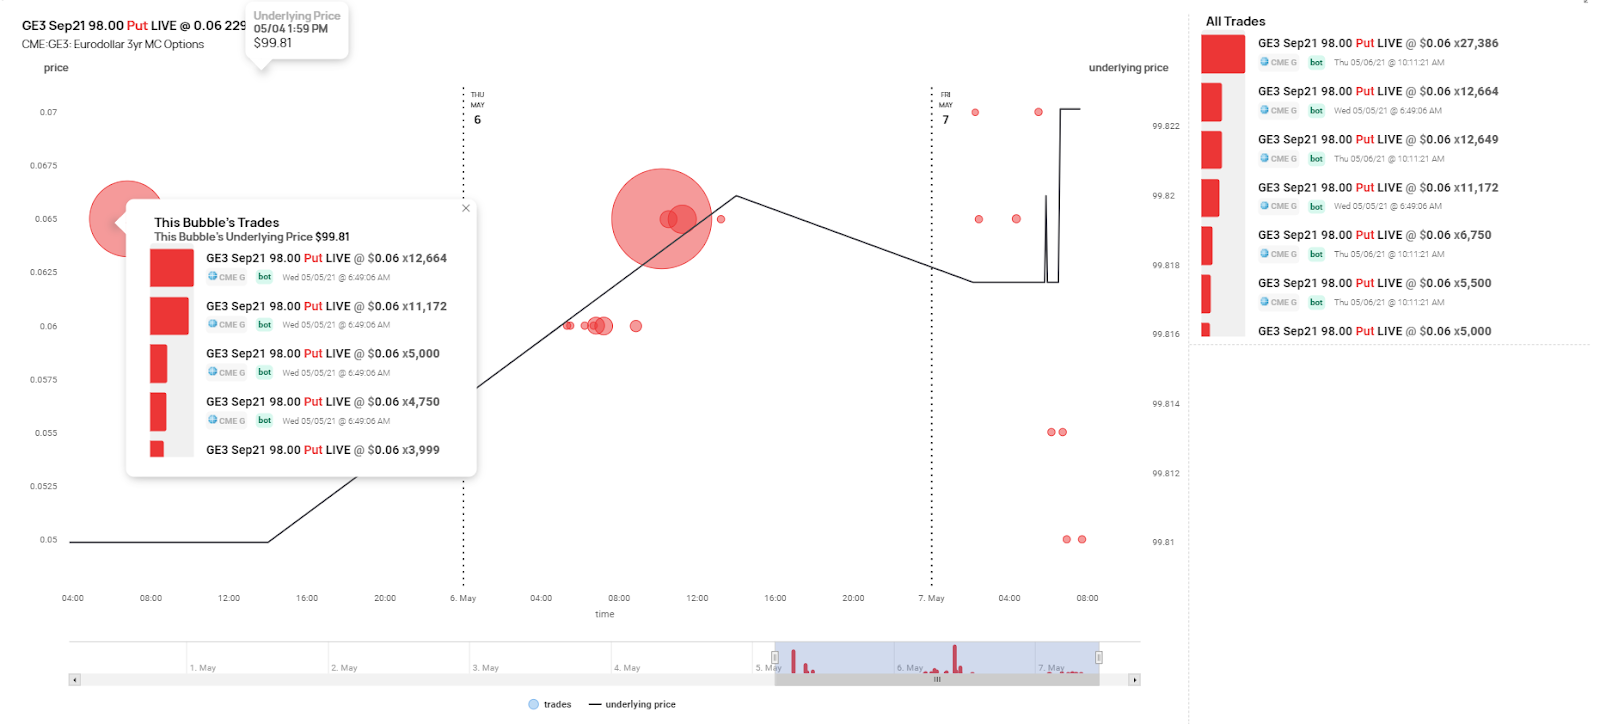
What Happened: U.S. stock index futures auctioned lower, overnight, alongside fears of rising inflation. Most affected were heavily-weighted index constituents (e.g., Facebook, Netflix, Google, Microsoft, Amazon, Nvidia, and Tesla), or stocks that have the most to lose in an environment that favors cyclical and value assets.
Adding, despite the Federal Reserve’s commitment to limiting talk of taper and rate hikes, traders are positioning themselves for a change in tone. Activity in the 98.00 put strike options, in the Eurodollar, suggests traders are betting on a potential surprise at the Jackson Hole symposium.
Graphic: Eurodollar bet on SHIFT’s institutional platform. The purchase of 98.00 strike put options suggests traders are looking to add “two Fed hikes to [current] expectations.”
What To Expect: Tuesday’s regular session (9:30 AM – 4:00 PM EST) in the S&P 500 will open far from prior-range and -value, suggesting a limited potential for immediate directional opportunity. Reason being — a state of shock, as a result of a severe overnight drop.
Adding, during the prior day’s regular trade, the worst-case outcome occurred, evidenced by initiative trade below the $4,216.00 low volume area (LVNode). The HVNodes at $4,199.25, $4,190.75, and $4,177.25 (a major pivot) all were in play, yesterday.
Volume Areas: A structurally sound market will build on past areas of high volume. Should the market trend for long periods of time, it will lack sound structure (identified as a low volume area which denotes directional conviction and ought to offer support on any test).

If participants were to auction and find acceptance into areas of prior low volume, then future discovery ought to be volatile and quick as participants look to areas of high volume for favorable entry or exit.
For today, participants can trade from the following frameworks.
In the best case, the S&P 500 trades sideways or higher; activity above the $4,169.75 overnight pullback high targets the $4,177.25 HVNode pivot. Initiative trade beyond the pivot puts in play the $4,191.25, $4,199.25, $4,211.50, and $4,224.75 HVNodes.
In the worst case, the S&P 500 trades lower; activity below the $4,177.25 pivot targets the $4,141.00 VPOC. Thereafter, if lower, participants may look for responses at the $4,137.25 and $4,122.75 HVNodes. Auctioning through $4,130.25 increases the odds of trade to the poor structure at $4,110.50.
POCs: POCs (like HVNodes described above) are valuable as they denote areas where two-sided trade was most prevalent. Participants will respond to future tests of value as they offer favorable entry and exit.
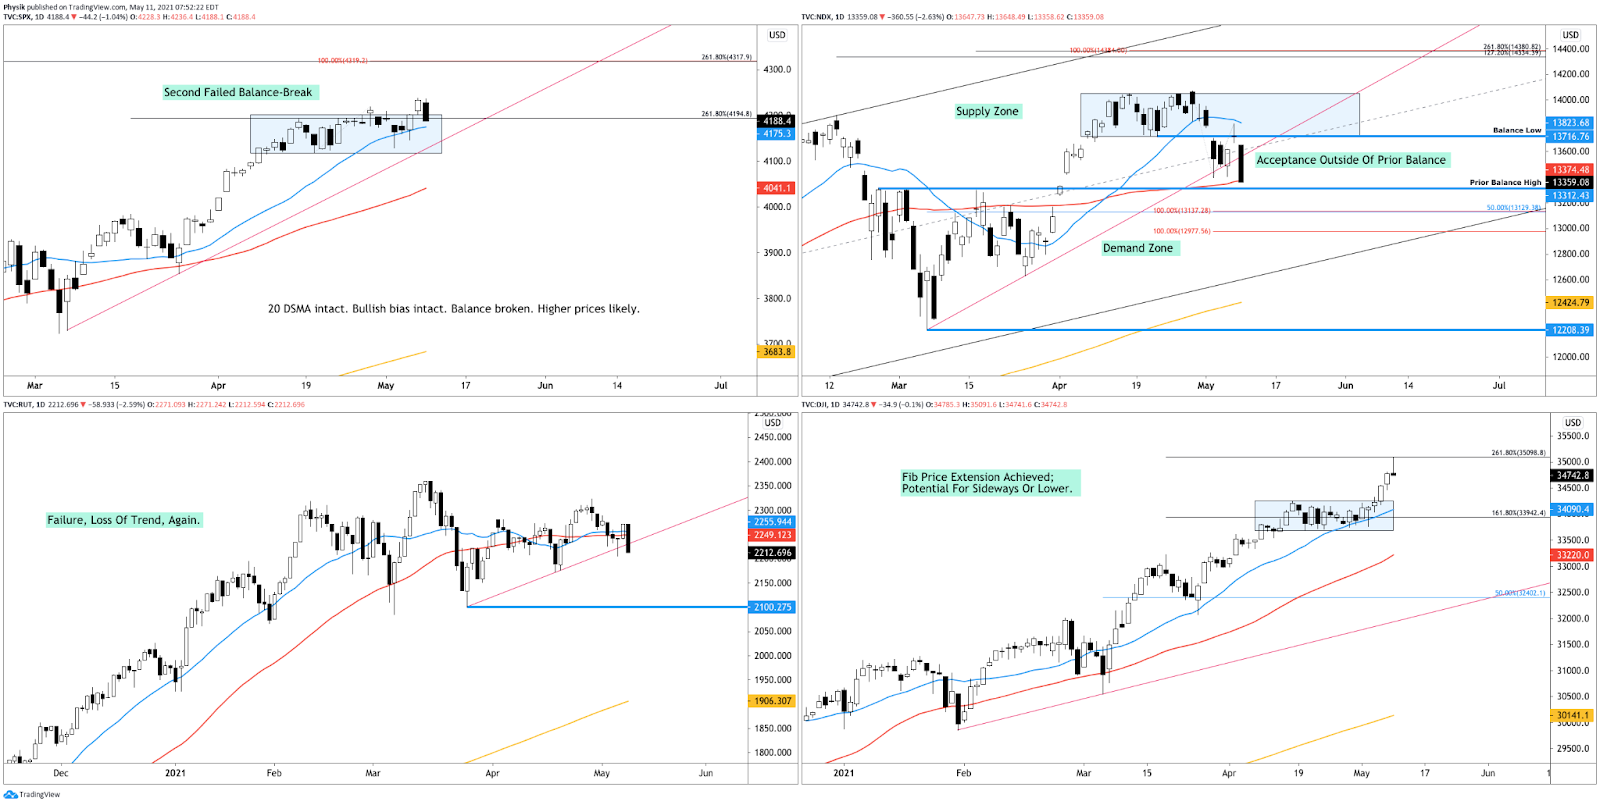
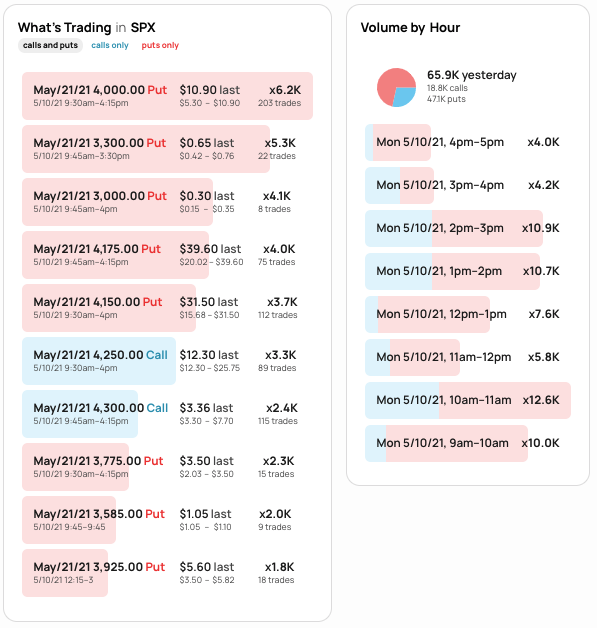
Graphic: 65-minute profile chart of the Micro E-mini S&P 500 Futures.Graphic: Daily candlestick charts of the S&P 500 (top left), Nasdaq 100 (top right), Russell 2000 (bottom left), and Dow Jones Industrial Average (bottom right). The Dow is the strongest of the four. The Nasdaq is the weakest.Graphic: SHIFT search suggests participants were very interested in put strikes at and below $4,200.00 in the cash-settled S&P 500 Index (INDEX: SPX), May 10.
News And Analysis
Economy | The Fed is playing with fire by clinging to emergency policies. (WSJ)
Pipeline outage has not so far caused an extra increase. For now, traders anticipate local inventories will remain sufficient to absorb loss of wholesale deliveries to East Coast, the pipeline will re-enter service relatively quickly, and the disruption will be swiftly reversed: pic.twitter.com/VoTTmAmZuq
Markets | What happens to stocks after the Fed stops raining money? (WSJ)
Housing | Americans moved during the pandemic. Where did they go? (WSJ)
Commodities | The role of critical minerals in the clean energy transition. (IEA)
Markets | More whacks around the head for investors after jobs data. (BBG)
About
Renato founded Physik Invest after going through years of self-education, strategy development, and trial-and-error. His work reporting in the finance and technology space, interviewing leaders such as John Chambers, founder, and CEO, JC2 Ventures, Kevin O’Leary, businessman and Shark Tank host, Catherine Wood, CEO and CIO, ARK Invest, among others, afforded him the perspective and know-how very few come by.
Having worked in engineering and majored in economics, Renato is very detailed and analytical. His approach to the markets isn’t built on hope or guessing. Instead, he leverages the unique dynamics of time and volatility to efficiently act on opportunity.
Disclaimer
At this time, Physik Invest does not manage outside capital and is not licensed. In no way should the materials herein be construed as advice. Derivatives carry a substantial risk of loss. All content is for informational purposes only.
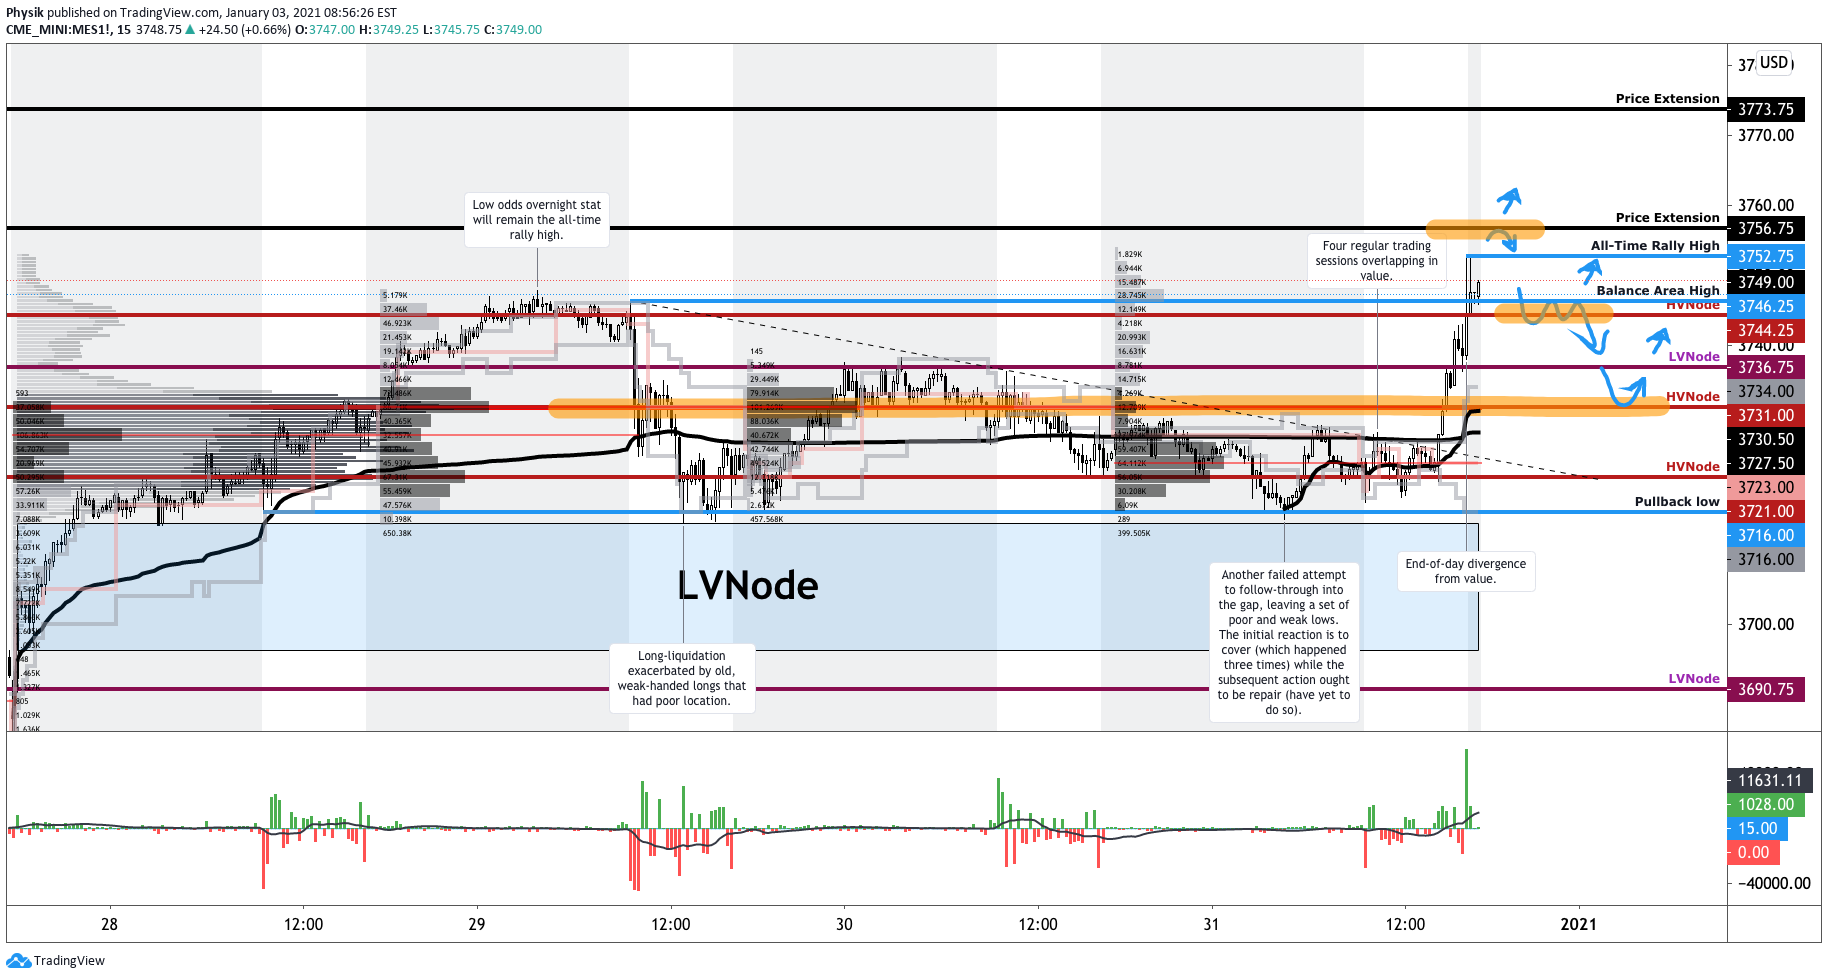
What Happened: Coming into the extended holiday weekend, on tapering volumes, U.S. index futures balanced for four regular trading sessions (9:30 AM – 4:00 PM ET), before breaking out.
Pictured: Profile overlays on a 15-minute candlestick chart of the Micro E-mini S&P 500 Futures
What To Expect: Thursday’s session found initiative buying surface above the $3,731.00 high-volume node (HVNode), the market’s most recent perception of value.
Given four-sessions worth of unchanged value, and the failure to fill the gap beneath a weak low (i.e., a visual level that attracts the business of short-term, technically-driven market participants) at $3,714.50, participants will come into Monday’s session knowing the following:
Amid Thursday’s late-day buying, price diverged from value.
The overnight rally high at $3,747.75 was recovered (i.e., based on historical trade, there were low odds that the overnight all-time high would end the upside discovery process).
The multi-month upside breakout targeting S&P 500 prices as high as $4,000.00 remains intact.
In light of the above dynamics, the following frameworks apply for next week’s trade.
In the best case, the S&P 500 remains above its $3,731.00 HVNode. Expectations thereafter include continued balance, or a response followed by initiative buying to take out the price extension at $3,756.75.
In the worst case, the S&P 500 initiates below its $3,731.00 HVNode. Expectations thereafter include a test of the weak, minimal excess low at $3,714.50, and subsequent follow-through as low as the $3,691.00 break-point.
Noting: Excess forms after an auction has traveled too far in a particular direction and portends a sustained reversal. Absence of excess, in the case of a low, suggests minimal conviction; participants will cover (i.e., back off the low) and weaken the market, before following through.
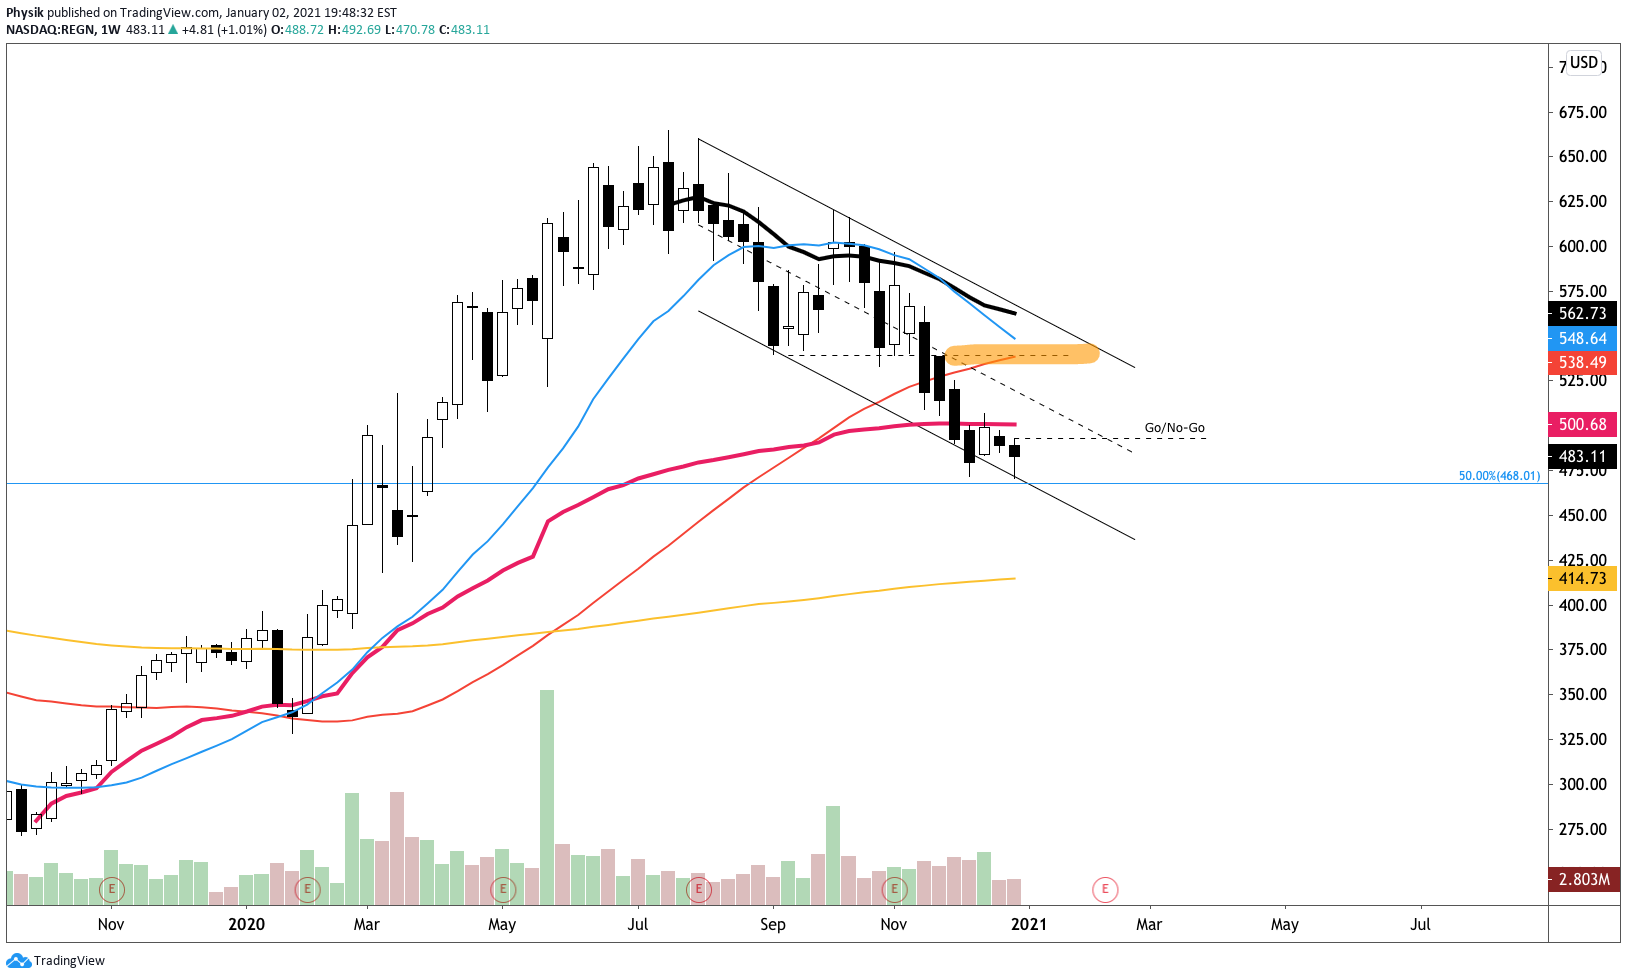
Two go, no-go levels exist; trade that finds increased involvement above $3,752.75 and below $3,714.50 would suggest a change in conviction. Anything in-between favors responsive trade.
Conclusion: From an uneven recovery, stimulus, elections, trade, and the like, it helps to boil it down to what actually matters: price and value.
Though risks remain, markets are pricing in the odds of a continued rebound. All broad-market indices are in an uptrend. A break below $3,600.00 in the S&P 500 would denote a substantial change in tone.
Pictured: Retest of the upside breakpoint on a weekly candlestick chart of the cash S&P 500 Index
What Happened: Coming into the extended holiday weekend, on tapering volumes, U.S. index futures balanced within prior range.
This activity occurred in the context of a larger balance-area forming just beyond the $3,600.00 multi-month break-out point. Given the lack of range expansion, in addition to the aforementioned responsive, back-and-forth trade, participants are signaling a lack of conviction.
Though there is a lot of noise in the markets — an uneven recovery, stimulus, elections, trade, and the like — one key point remains: the multi-month upside breakout targeting S&P 500 prices as high as $4,000.00 remains intact. Add to this the recovery of Monday’s liquidation fueled by weak-handed, short-term buyers, and the fact that the all-time $3,724.25 rally-high was established in an overnight session, it is highly likely that the upside discovery process has yet to end.
Note: Historically, there is a low probability that overnight all-time highs end the upside discovery process.
Pictured: Profile overlays on a 30-minute candlestick chart of the Micro E-mini S&P 500 Futures
What To Expect: Friday’s session found responsive selling surface near the $3,691.00 profile level. Given that participants had difficulty in sustaining higher prices, alongside shortened holiday trade, the following frameworks apply for next week’s trade.
In the best case, the S&P 500 remains above its $3,667.75 HVNode, and continues to balance. As stated earlier, given the tapering volume and holiday, the odds of directional resolve are quite low.
Two go, no-go levels exist; trade that finds increased involvement above $3,691.00 and below $3,667.75 would suggest a change in conviction. Anything in-between favors responsive trade.
Conclusion:Bank of America Corp’s (NYSE: BAC) Michael Hartnett summarized it best: “[T]he year of the virus, the lockdown, a crash, a recession, an epic policy panic, the greatest stock market rally of all-time, a V-shape economic recovery, and ending with a vaccine for COVID-19.”
Though risks remain, markets are pricing in the odds of a continued rebound. Unless some exogenous event were to transpire, technically speaking, all broad-market indices are in an uptrend. A move below $3,600.00 in the S&P 500 would denote a change in tone, increasing the likelihood of a failed breakout that would target prices as low as $3,200.00.
Pictured: Retest of the upside breakpoint on a daily candlestick chart of the cash S&P 500 Index
Levels Of Interest: The $3,691.00 boundary and $3,667.75 HVNode.
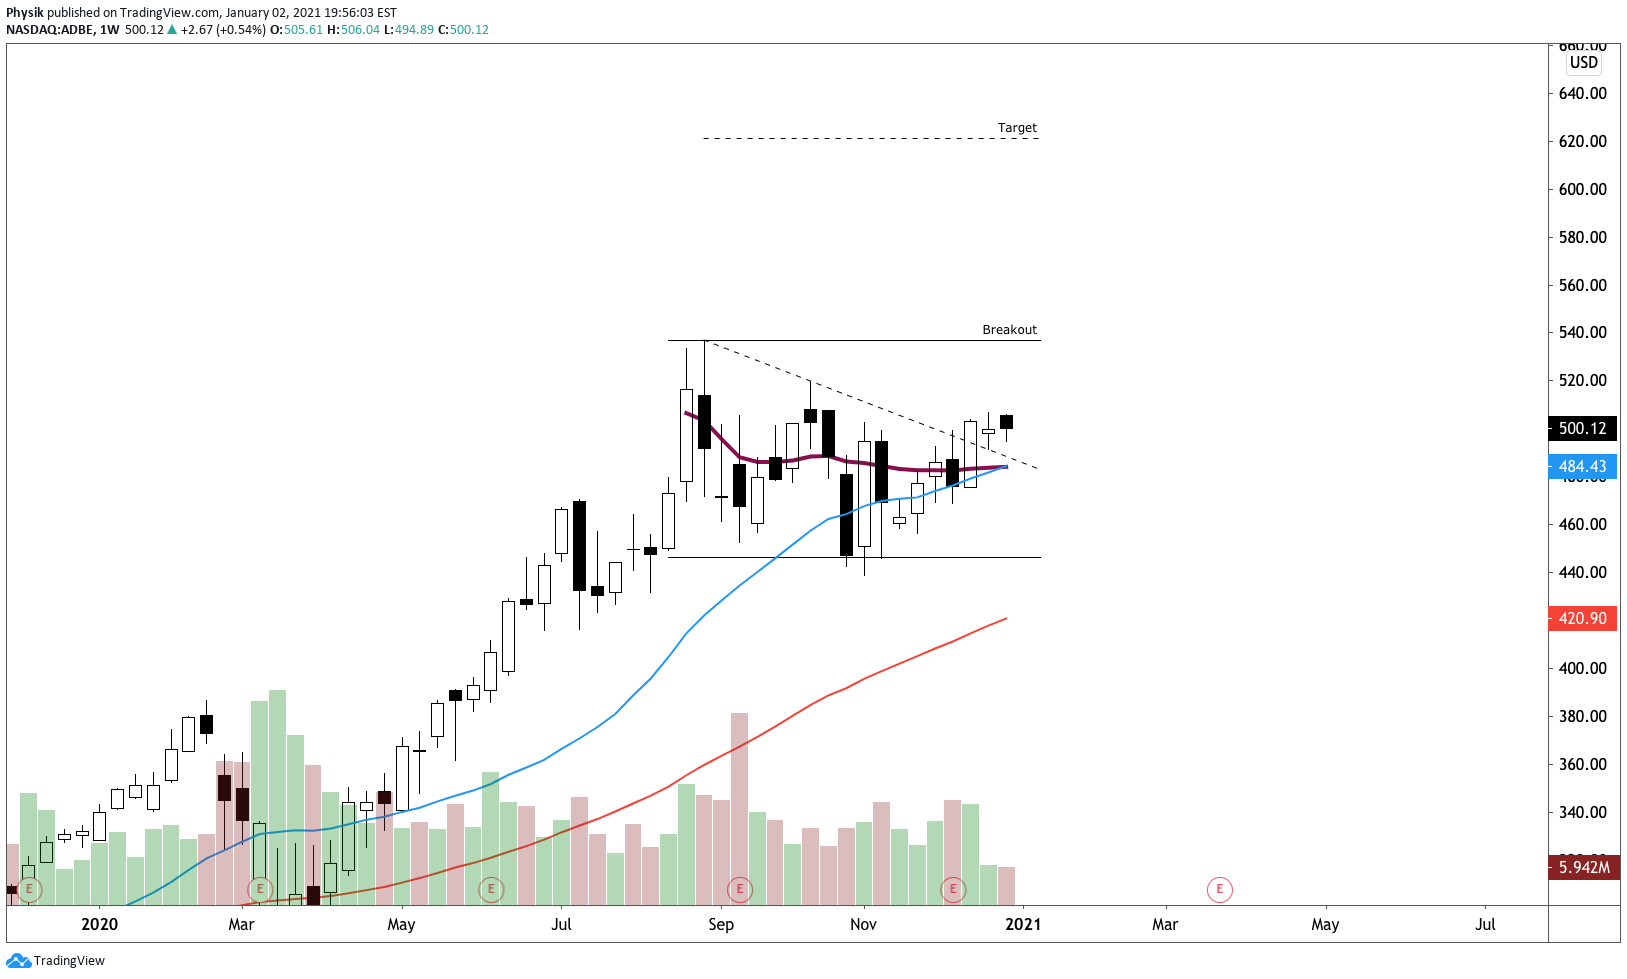
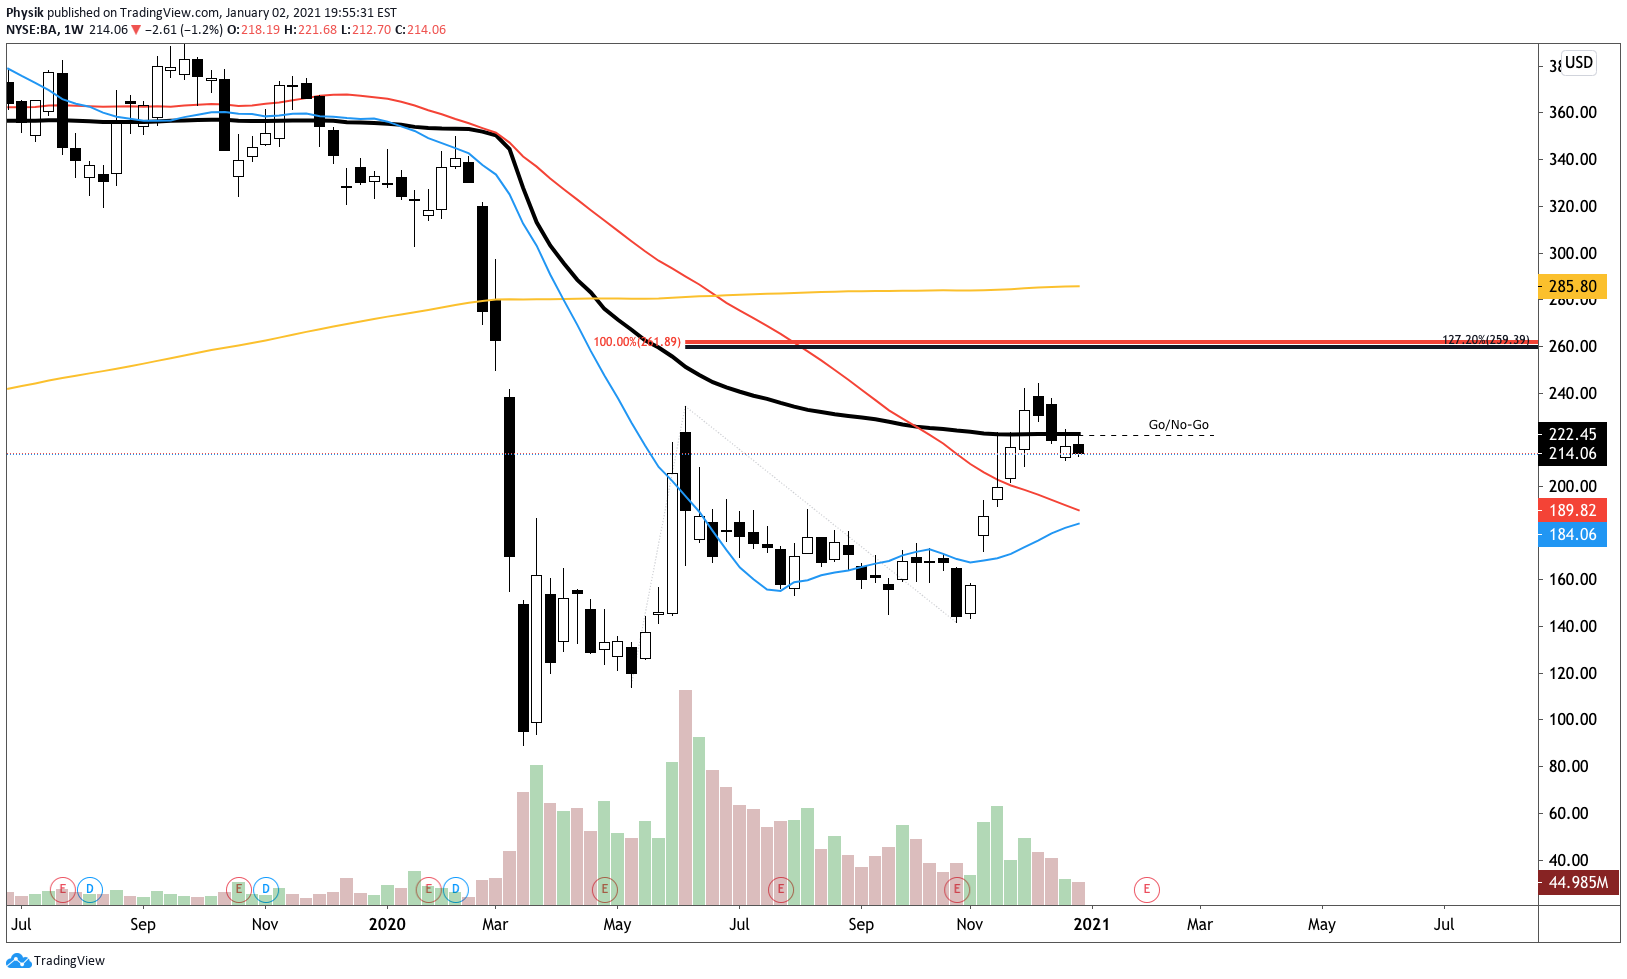
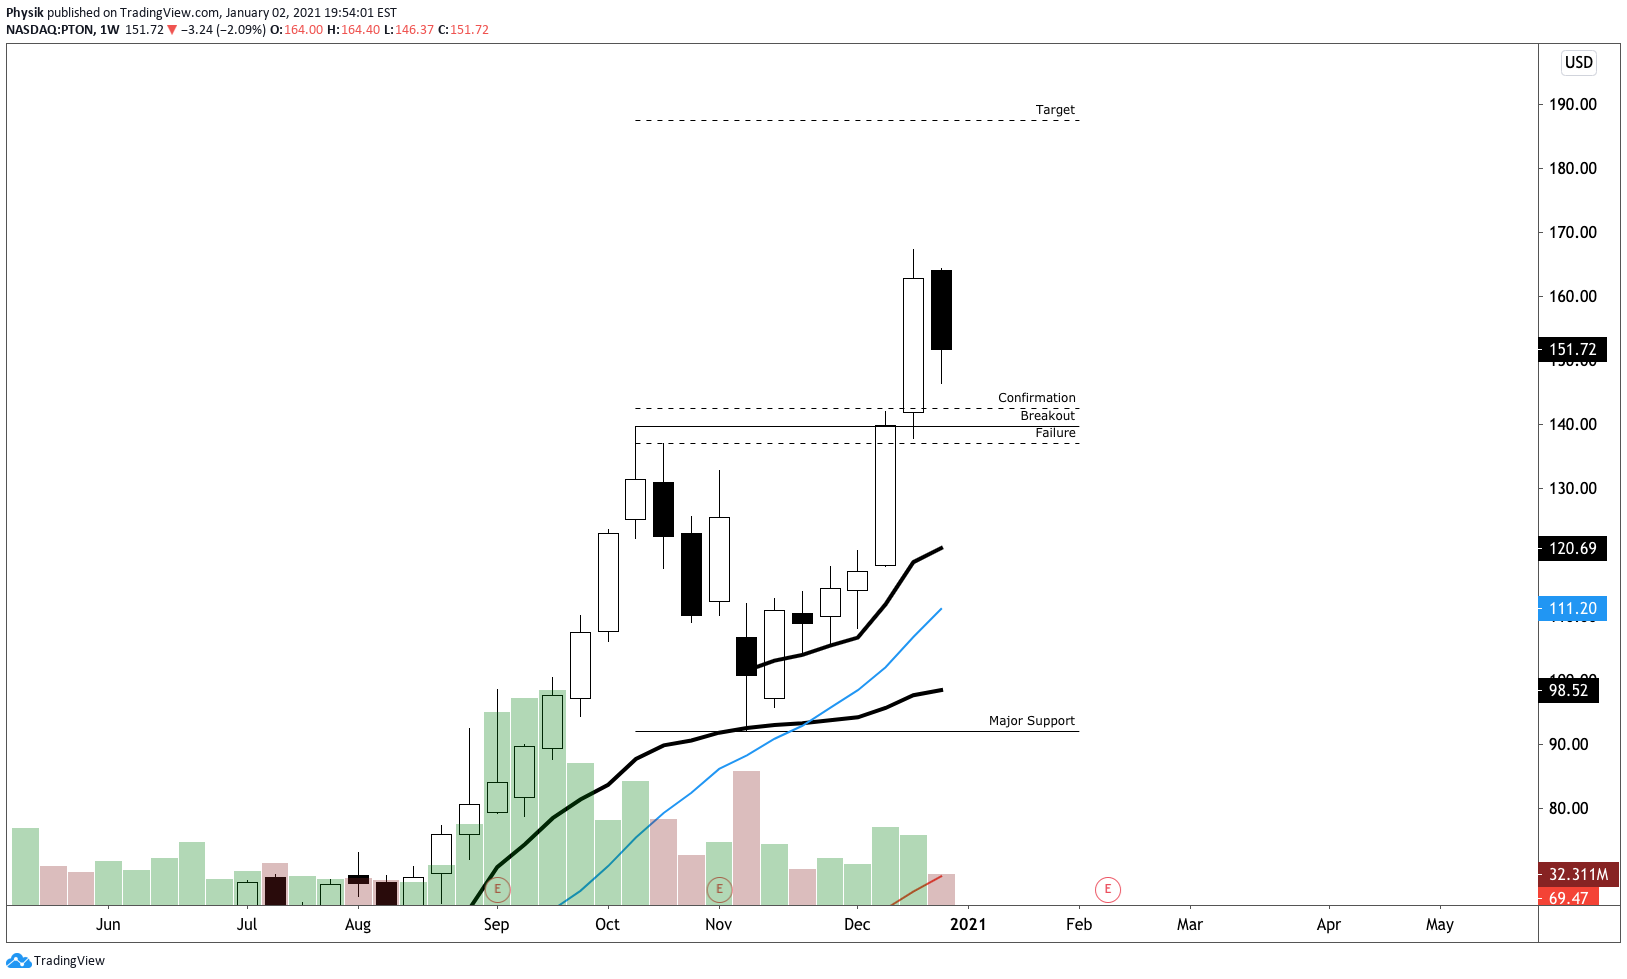
Bonus: Here is a look at some of the opportunities unfolding.
What Happened: U.S. index futures auctioned to new all-time highs before weakening into Friday’s derivative expiry.
What Does It Mean: After participants established a rally-high in the December 9 overnight session, the S&P 500 liquidated down to the balance-area boundary near $3,625.00.
After the December 14 gap open on COVID-19 coronavirus vaccine and stimulus progress, for the remainder of the week, indices negated prior selling, establishing a new all-time high. Friday’s trade managed to repair some structural deficiencies left in the aforementioned advance.
Pictured: Profile overlays on a 65-minute candlestick chart of the Micro E-mini S&P 500 Futures
What To Expect: Friday’s session found responsive buyers surface at the low-volume node (LVNode) near $3,680.00. Low-volume areas denote directional conviction and ought to resist future auction rotations. Auctioning through the LVNode would foreshadow further rotation and trade as low as the balance-area low.
Given that the higher-time frame breakout remains intact and selling appears non-committal, participants will come into Monday’s session knowing the following:
Inflation remains cool due to the profound influence of disruptive innovation.
U.S. Congress reaches deal on COVID-19 aid package, plans votes for Monday.
The decline in realized correlation due to factor and sector rotation, as well as the return of systematic option selling strategies will push the long-gamma narrative in which volatility is suppressed and the market pins or slowly rises in a range-bound fashion.
The S&P 500’s higher-time frame breakout remains intact (see chart below); JPMorgan Chase & Co. (NYSE: JPM) confirms equities will rally short-term with the S&P 500 auctioning as high as $4,000.
Despite high CAPE ratios, stock-market valuations aren’t that absurd.
Therefore, the following frameworks for next week’s trade apply.
In the best case, buyers maintain conviction and hold the index above the $3,680.00 LVNode. Auctioning below said reference denotes a change in conviction. Participants would then look for a response near the $3,667.75 HVNode. Failure to remain above the HVNode would portend rotation, further balancing.
In the worst case, participants initiate below the $3,625.00 balance-area low, jeopardizing the higher-time frame breakout.
Conclusion: As BlackRock Inc (NYSE: BLK) said, “a rising tide lifts all boats”; though financial markets have largely priced in positive news surrounding vaccines and stimulus, the rally remains intact, bolstered by a drive for yield — technical factors as a result of systemic and hedge fund strategies, among other things.
Pictured: Retest of the upside breakpoint on a daily candlestick chart of the cash S&P 500 Index
Levels Of Interest: $3,740.75 and $3773.75 price extensions, $3,724.25 all-time rally high, the micro-composite HVNode at $3,707.75, $3,691.00, and $3,667.75, as well as the $3,680 LVNode and poor structure near the $3,625.00 balance-area low.
Bonus: Here is a look at some of the opportunities unfolding.