The daily brief is a free glimpse into the prevailing fundamental and technical drivers of U.S. equity market products. Join the 980+ that read this report daily, below!

Fundamental
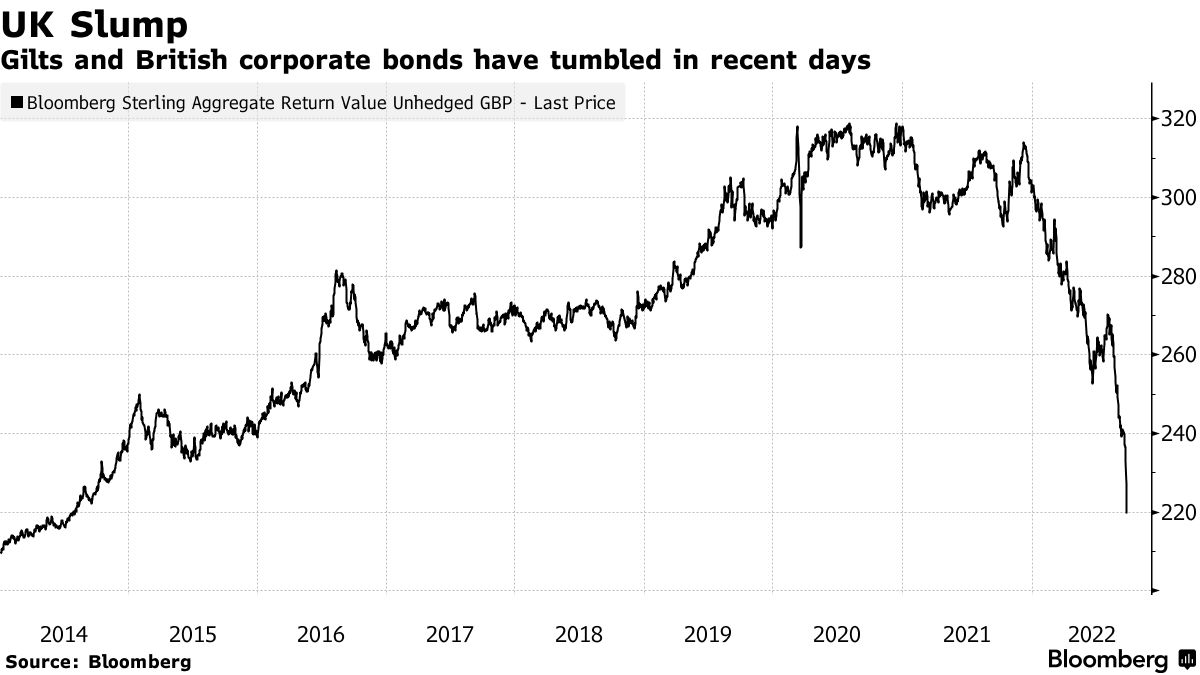
More clarity surfaces on the turmoil overseas. After announcements regarding new fiscal policy that would feature steep tax cuts, the prices of longer-dated British bonds fell, prior to the Bank of England (BoE) announcing the purchase of longer-dated bonds to restore stability.
Here’s why the BoE did what it did:
In short, market volatility prompted reflexive feedback responses.
British pensions are required to match assets to liabilities “to ensure that promises to pensioners could be honored,” Bloomberg explained. This prompted purchases of long-dated bonds in size. Essentially, pensions would “enter into swap contracts, using [long-dated bonds] as collateral.”
That’s because “swaps give[] the pension scheme far more capital to assign to those more interesting asset classes with high potential returns rather than having it tied up in boring gilts.”
“If the bet turned out wrong, [pensions would] have to pay something to the counterparty. And, if the collateral suddenly and unprecedentedly took a massive fall, the counterparty would face a margin call.”
In size, these “margin calls had turned into a cascade,” forcing pensions to sell into weakness.
Talk of fund insolvencies and the effects of that on the economy, executives running day-to-day operations, not the BoE’s Monetary Policy Committee (MPC), implemented quantitative easing (QE), essentially, buying bonds and pushing their yields lower to ease market volatility.
In stories that followed, a London-based banker discussed his worry that the situation came close to looking like “a Lehman moment.” Cardano Investment executive Kerrin Rosenberg also said “if there was no intervention [], yields could have gone up to 7-8% from 4.5% [] and, in that situation, around 90 per cent of UK pension funds would have run out of collateral.”
In light of the “madness,” the UK’s Simon Hoare said that actions must be taken at the Treasury and government levels.
Adding, though volatility eased everywhere (e.g., mortgage rates), including in the US markets, the damages are not contained, some explain.
UK investors will often “buy overseas assets and hedge away the currency risk,” Jim Leaviss of Bond Vigilantes explained. Amid all the volatility, “if you had bought a dollar bond and hedged it, the dollars that you have effectively sold ‘short’ against sterling as the hedge have rallied, and the counterparty to the FX hedge will call for a collateral payment.”
“Whilst most funds will hold some cash and extremely liquid government bonds against such moves, the size of the recent turmoil probably means that many investors will be having to liquidate credit and other less liquid assets in order to meet these collateral calls.”
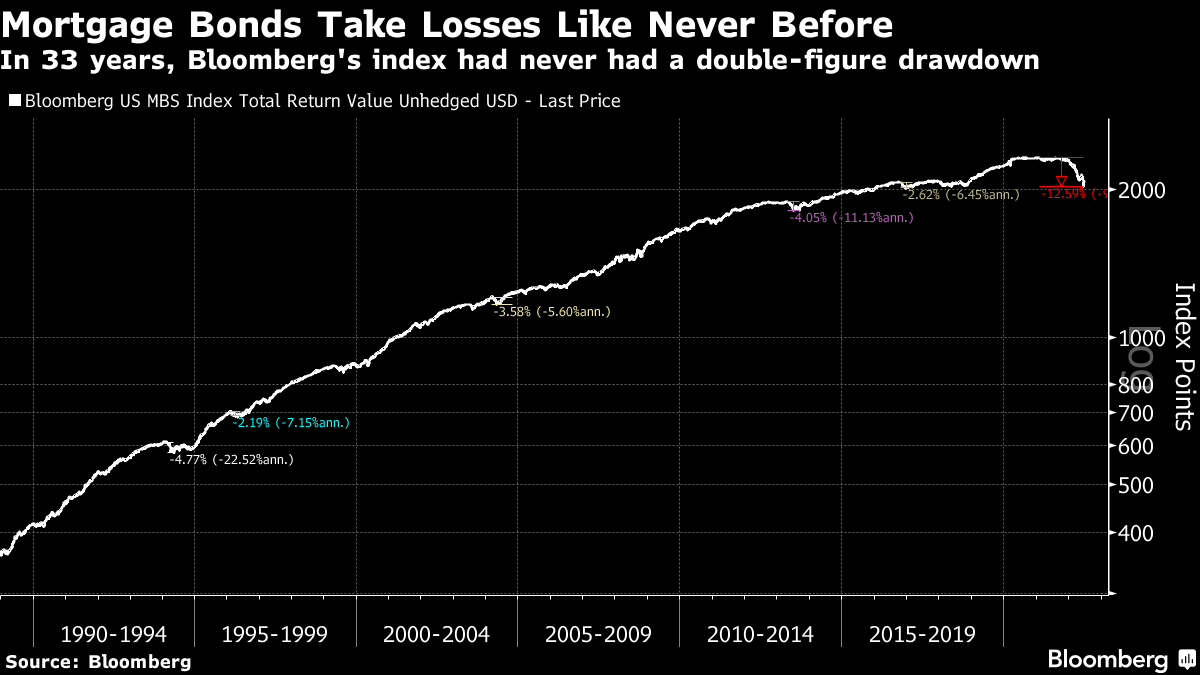
Therefore, the aforementioned technical factors have a bearing on the direction of bonds and yields “over coming months.”
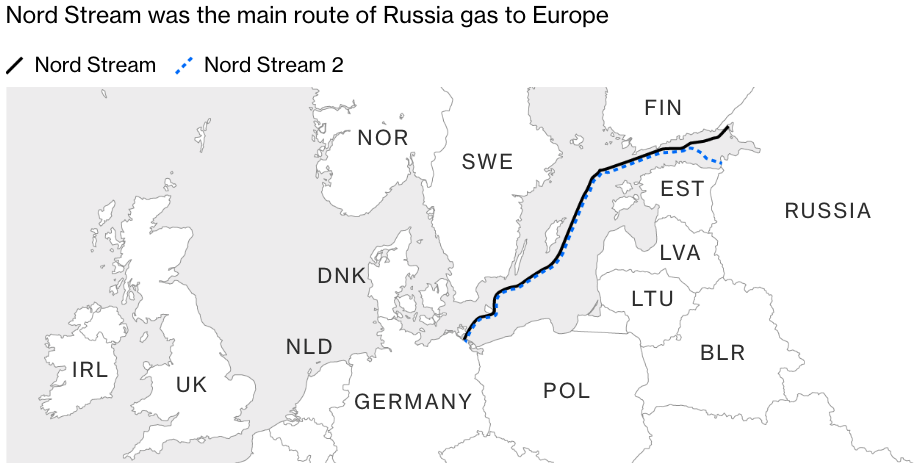
Elsewhere, in China, in alignment with a request for state banks to stock up for FX intervention, the “PBOC hit CNH in illiquid hours to have maximum impact,” as “the trouble the PBOC faces is similar to that of Japan – when domestic conditions call for easy policy (vs. US).”
Bob Elliot of Unlimited Funds adds “the moves are likely to be paired with more announcements of macroprudential strategies to slow depreciation. While they will make headlines, most have proven to be reactive and modest in their impact.”
Therefore, “[g]iven weak domestic conditions, the PBOC is very unlikely to prioritize FX over domestic easing – the diff[erence] to the US will only get worse.”
Positioning
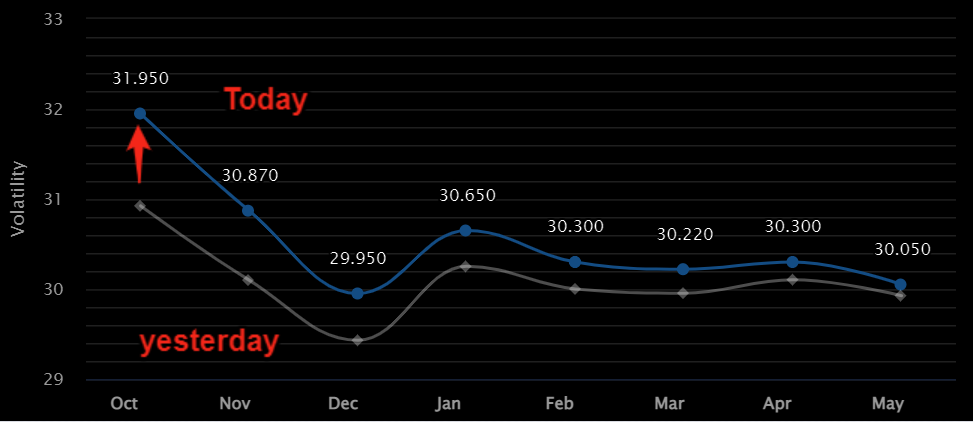
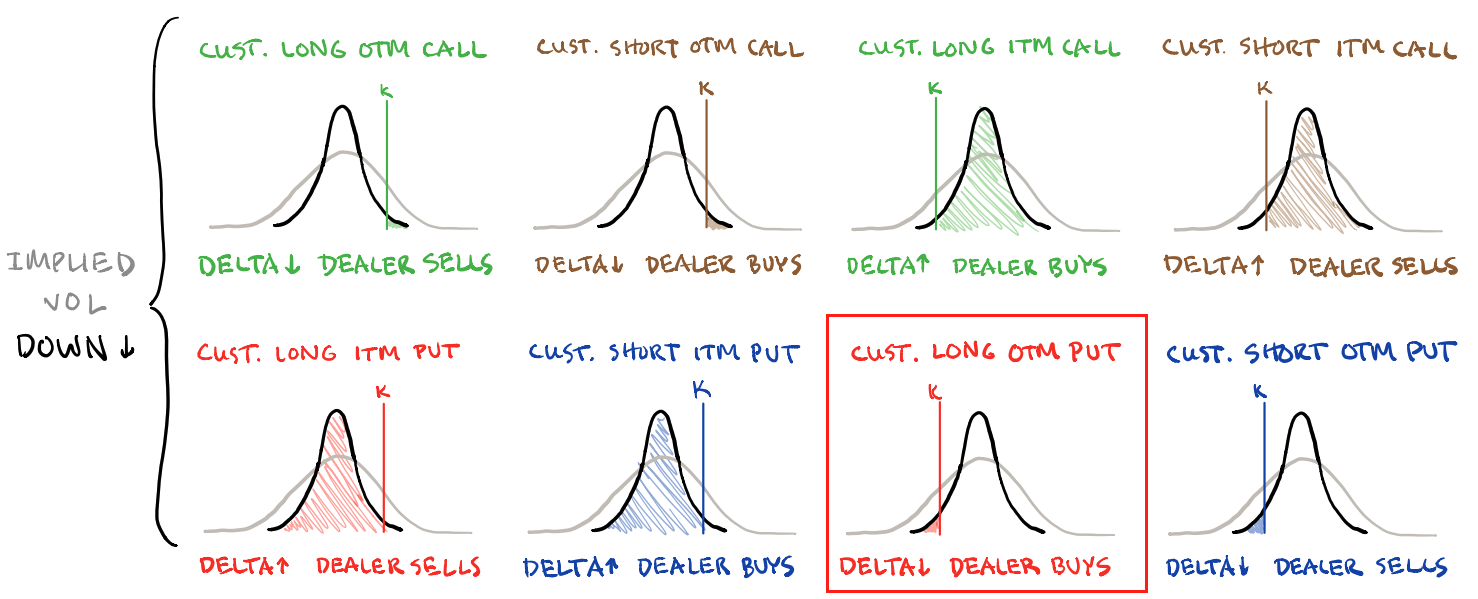
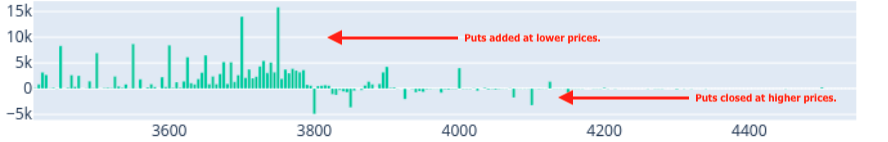
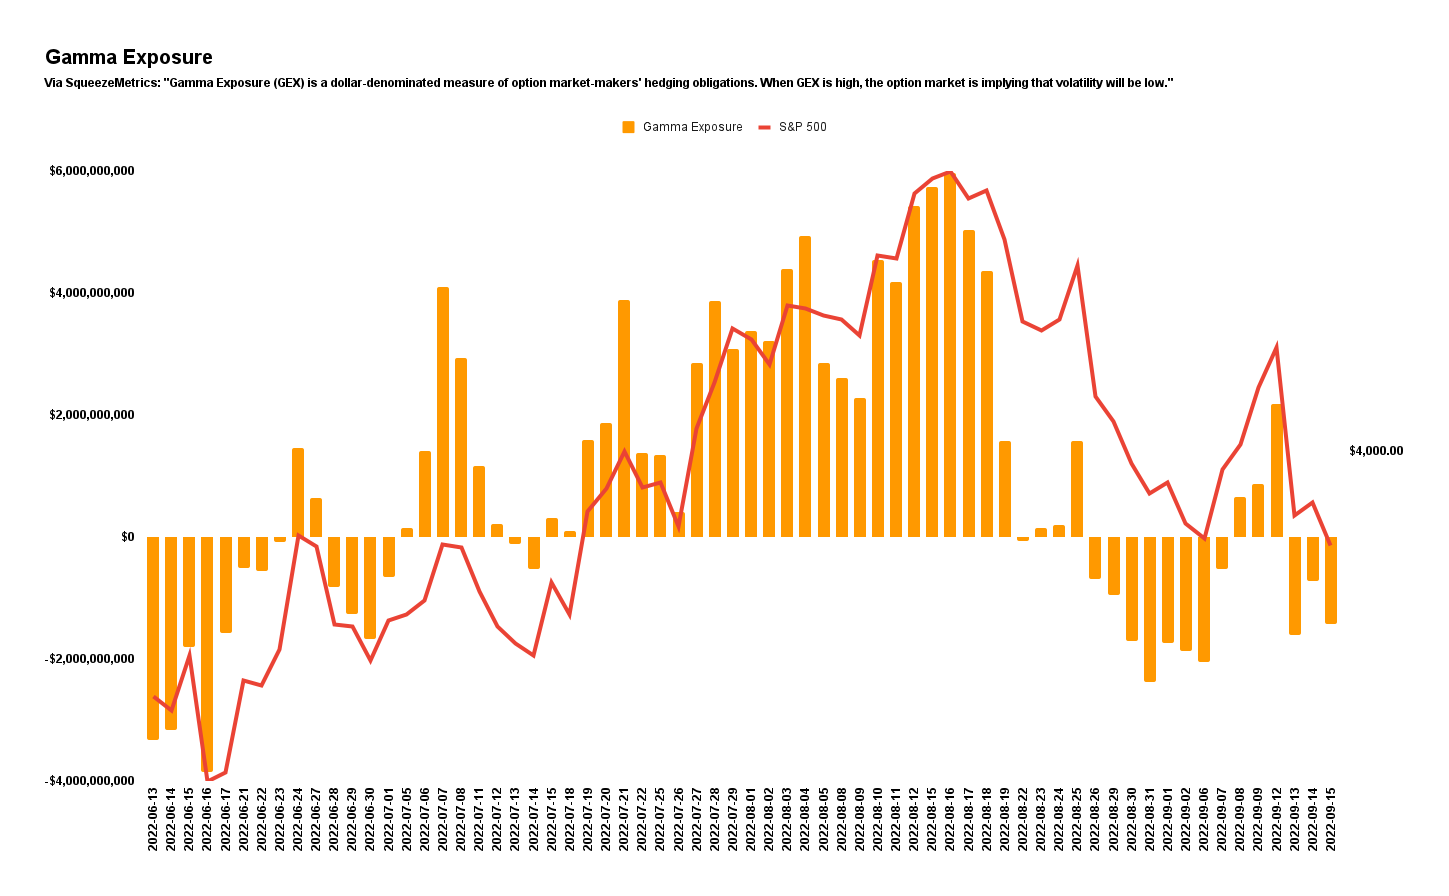
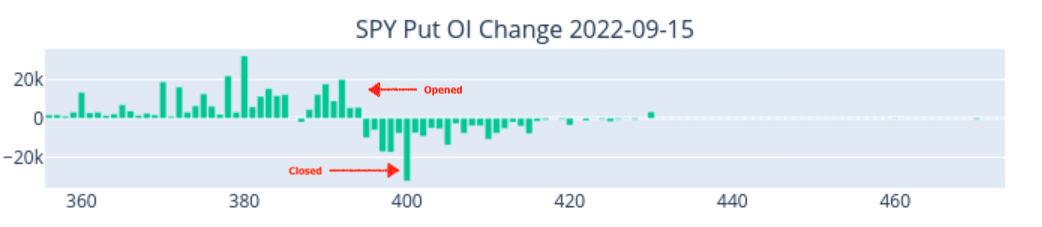
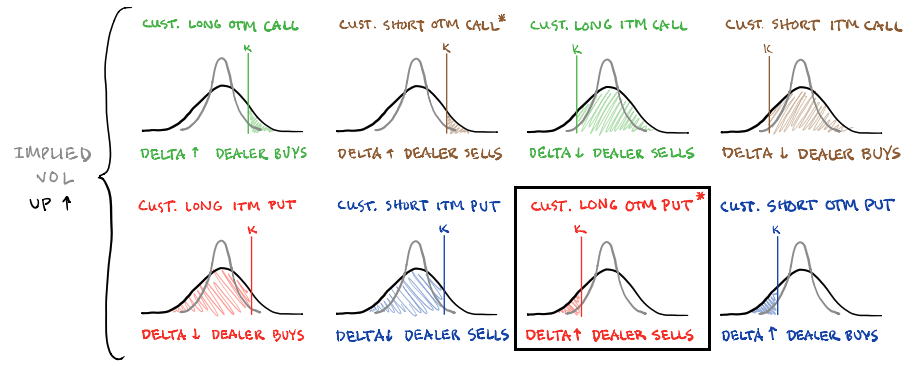
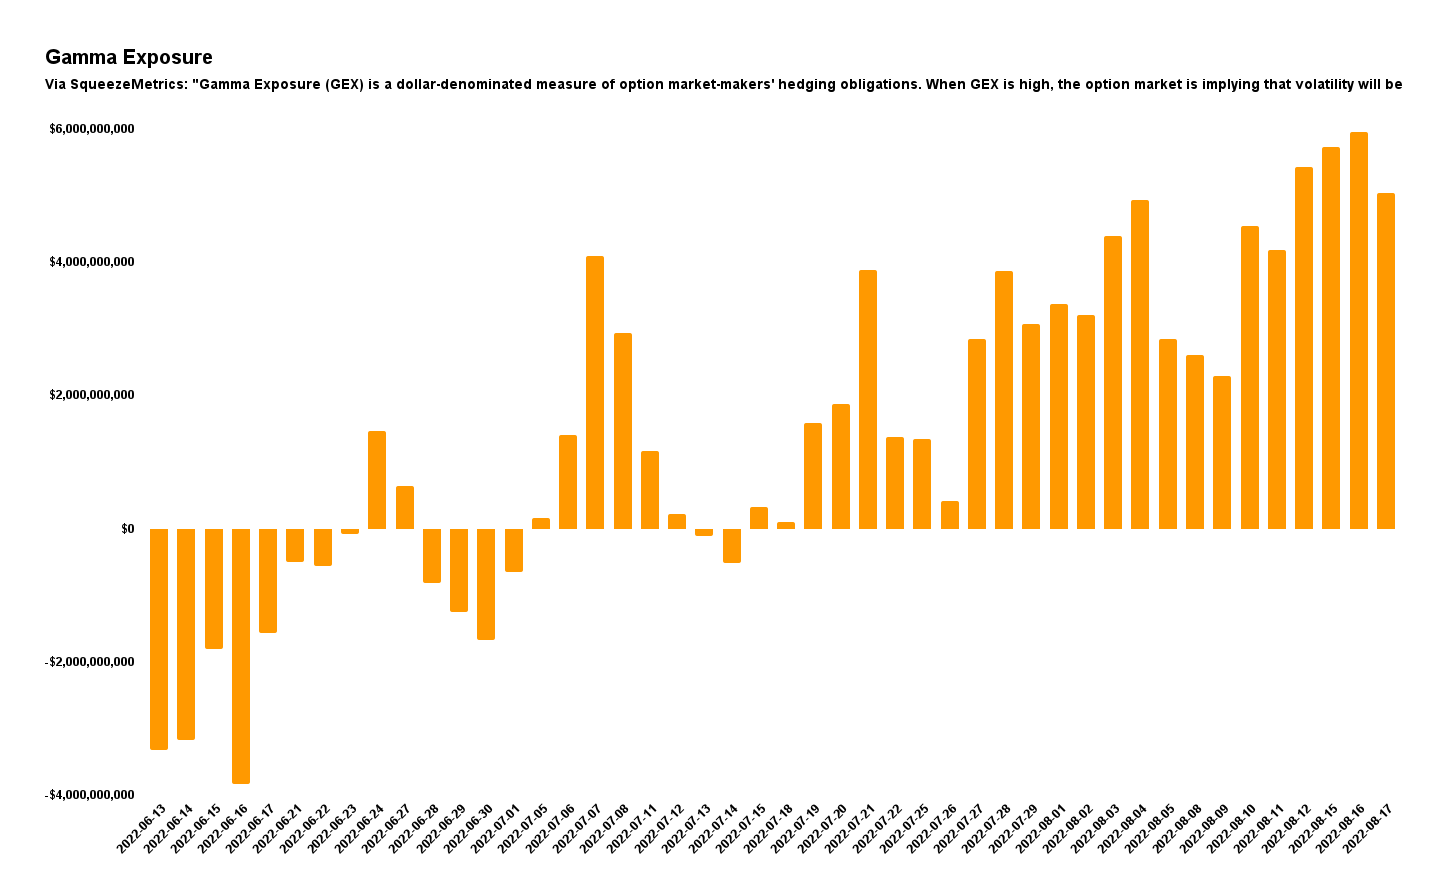
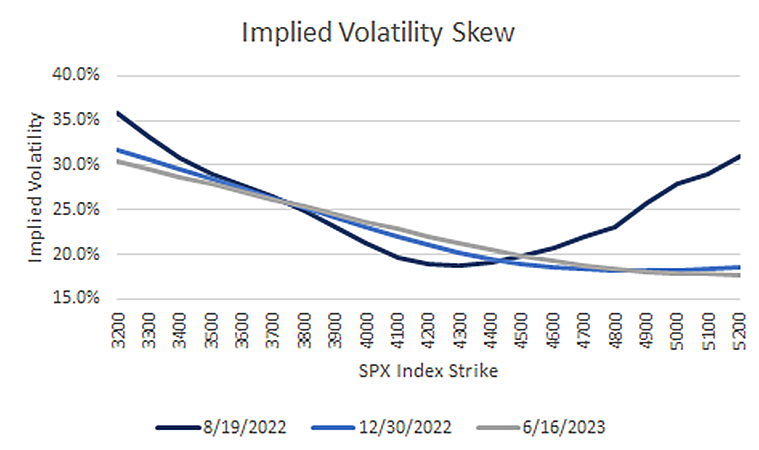
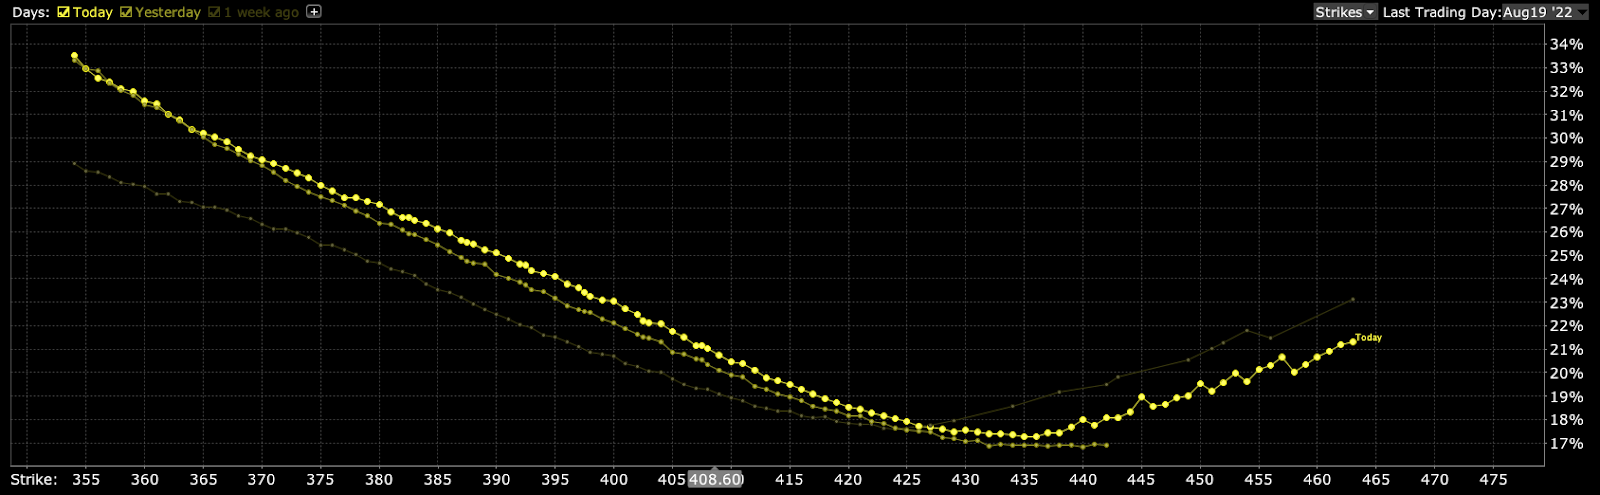
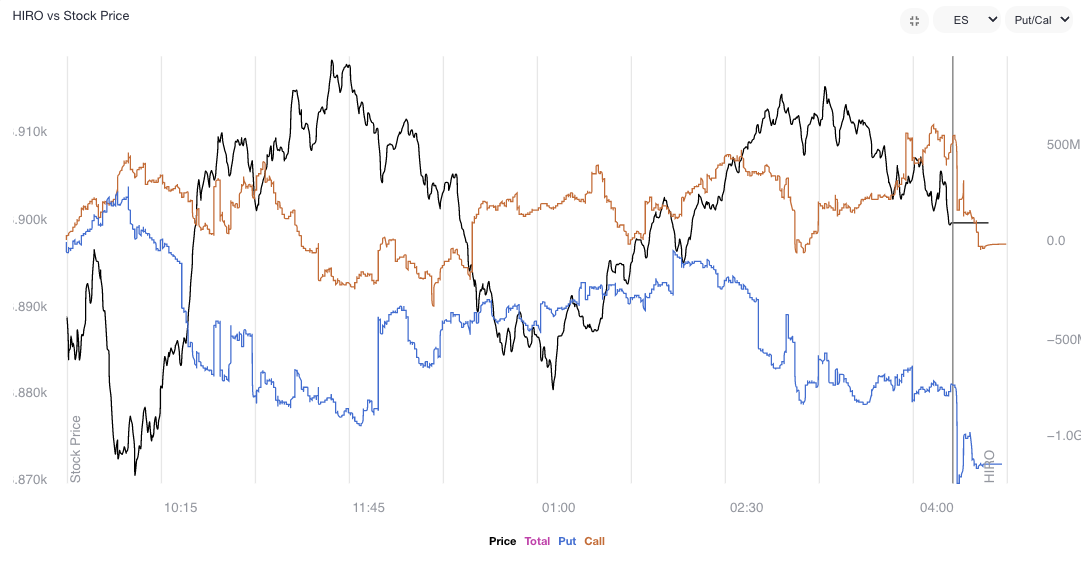
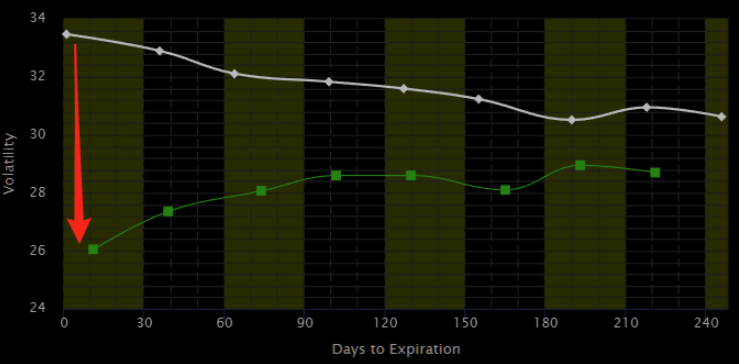
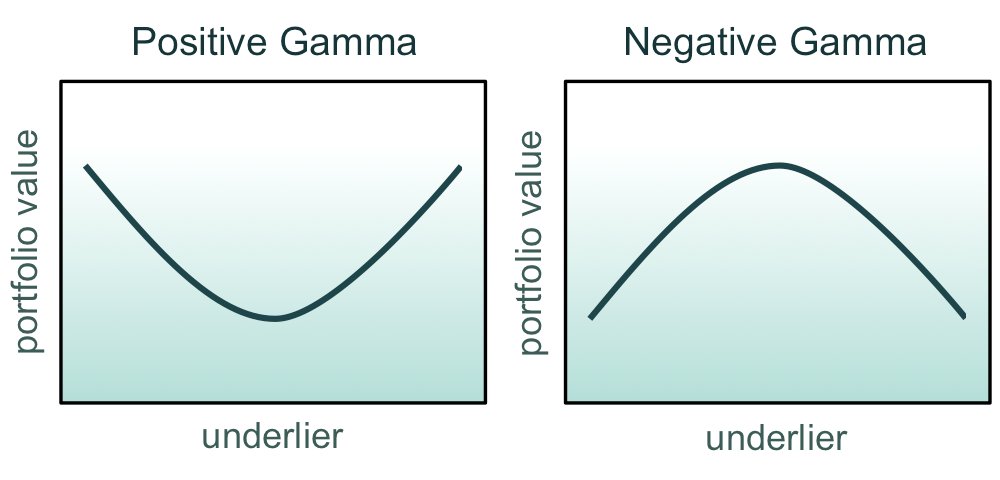
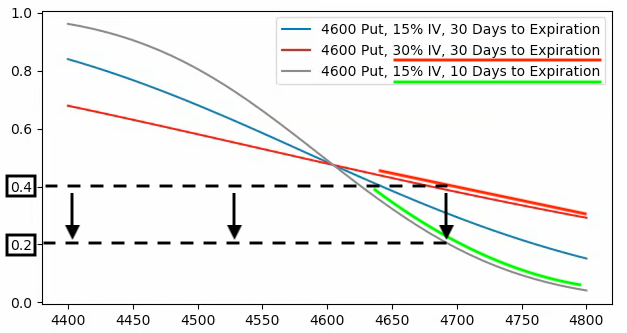
Measures of implied volatility (IVOL) recorded decreases, yesterday, as traders supplied to the market protection, largely, at the front-end where “options are far more sensitive to changes in IVOL and direction,” as SpotGamma put.
“As IVOL declines and the S&P rises, the probability of those options paying out falls. This is reflected by their exposure to direction (or Delta) dropping, also. To re-hedge decreased exposure to Delta, liquidity providers may provide the market with a boost.”
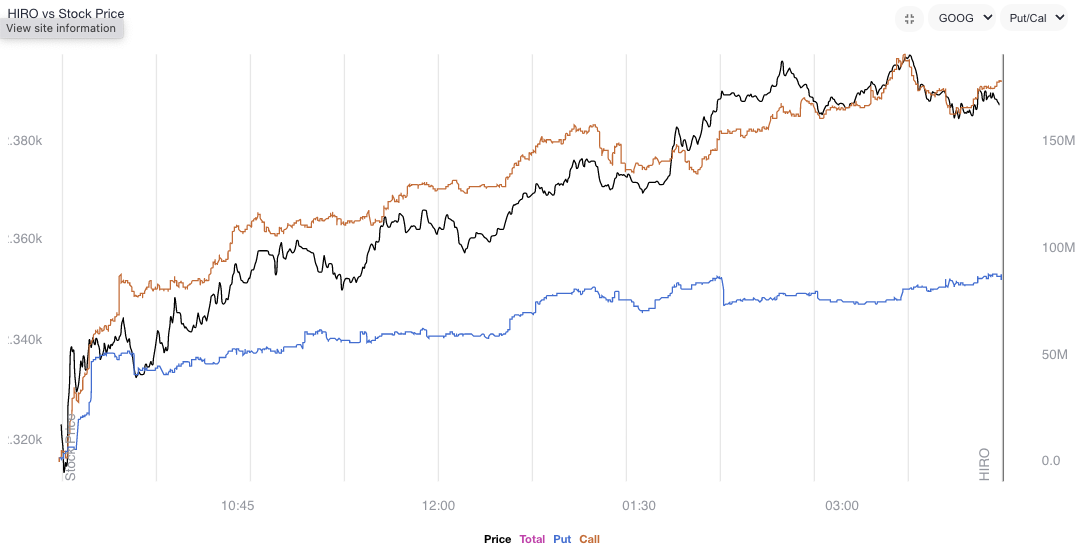
As stated yesterday, in the very near term, the risks are skewed to the upside.
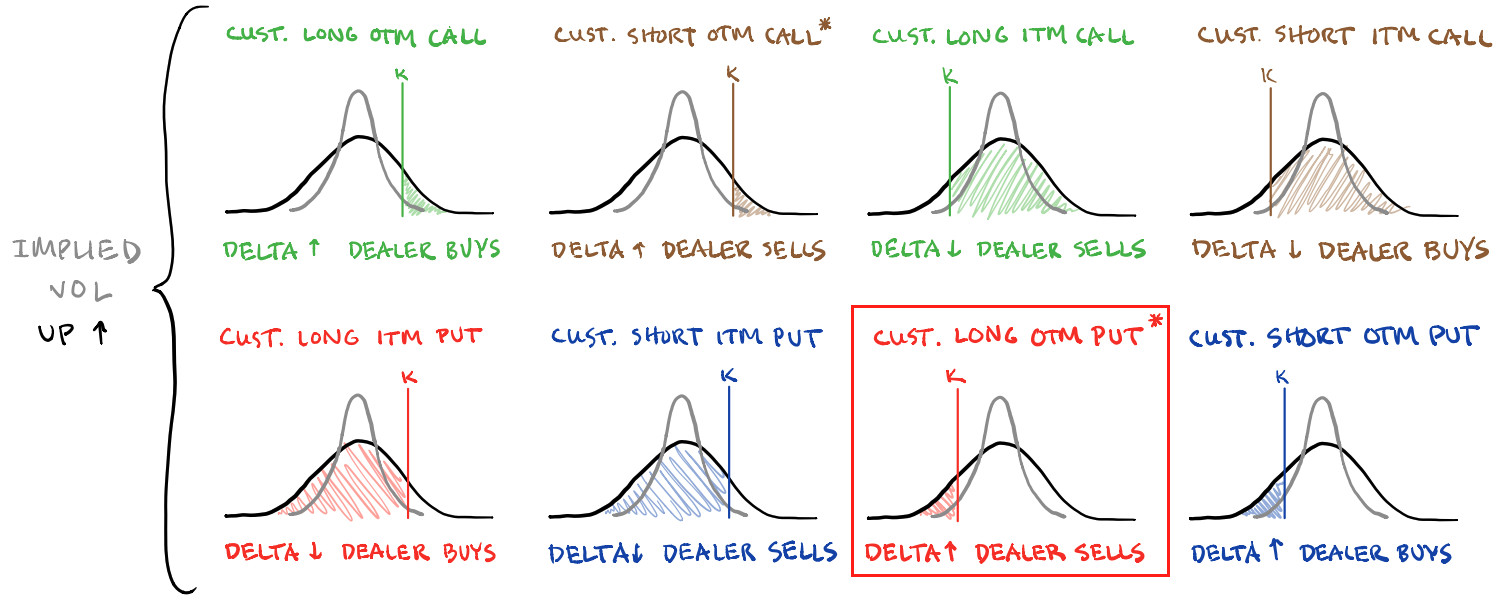
“For pumped-up options far from the money to retain their value, there essentially needs to be an adverse move (in price and volatility). Should nothing bad happen, the probability of these options paying out will fade, as will their exposure to direction (or Delta).”
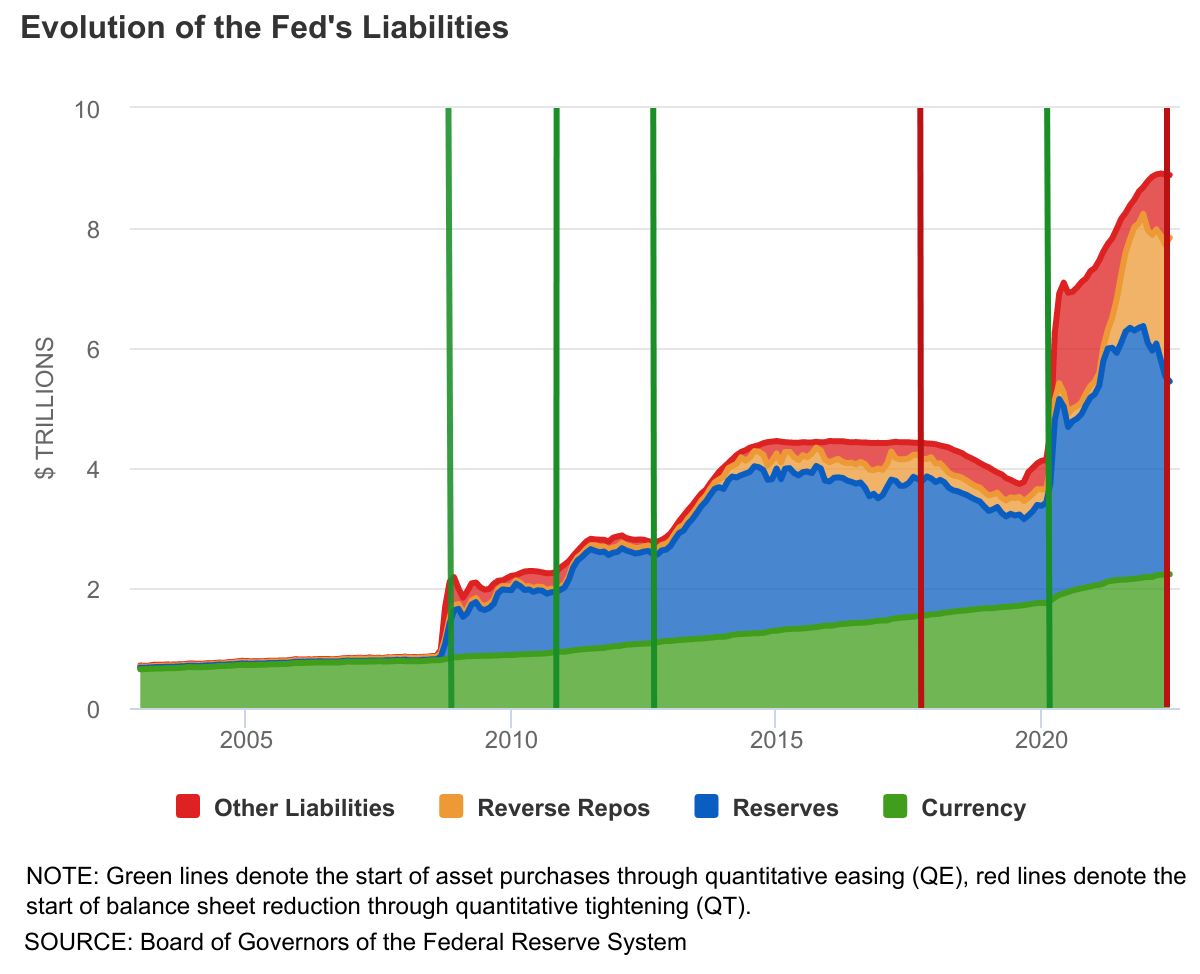
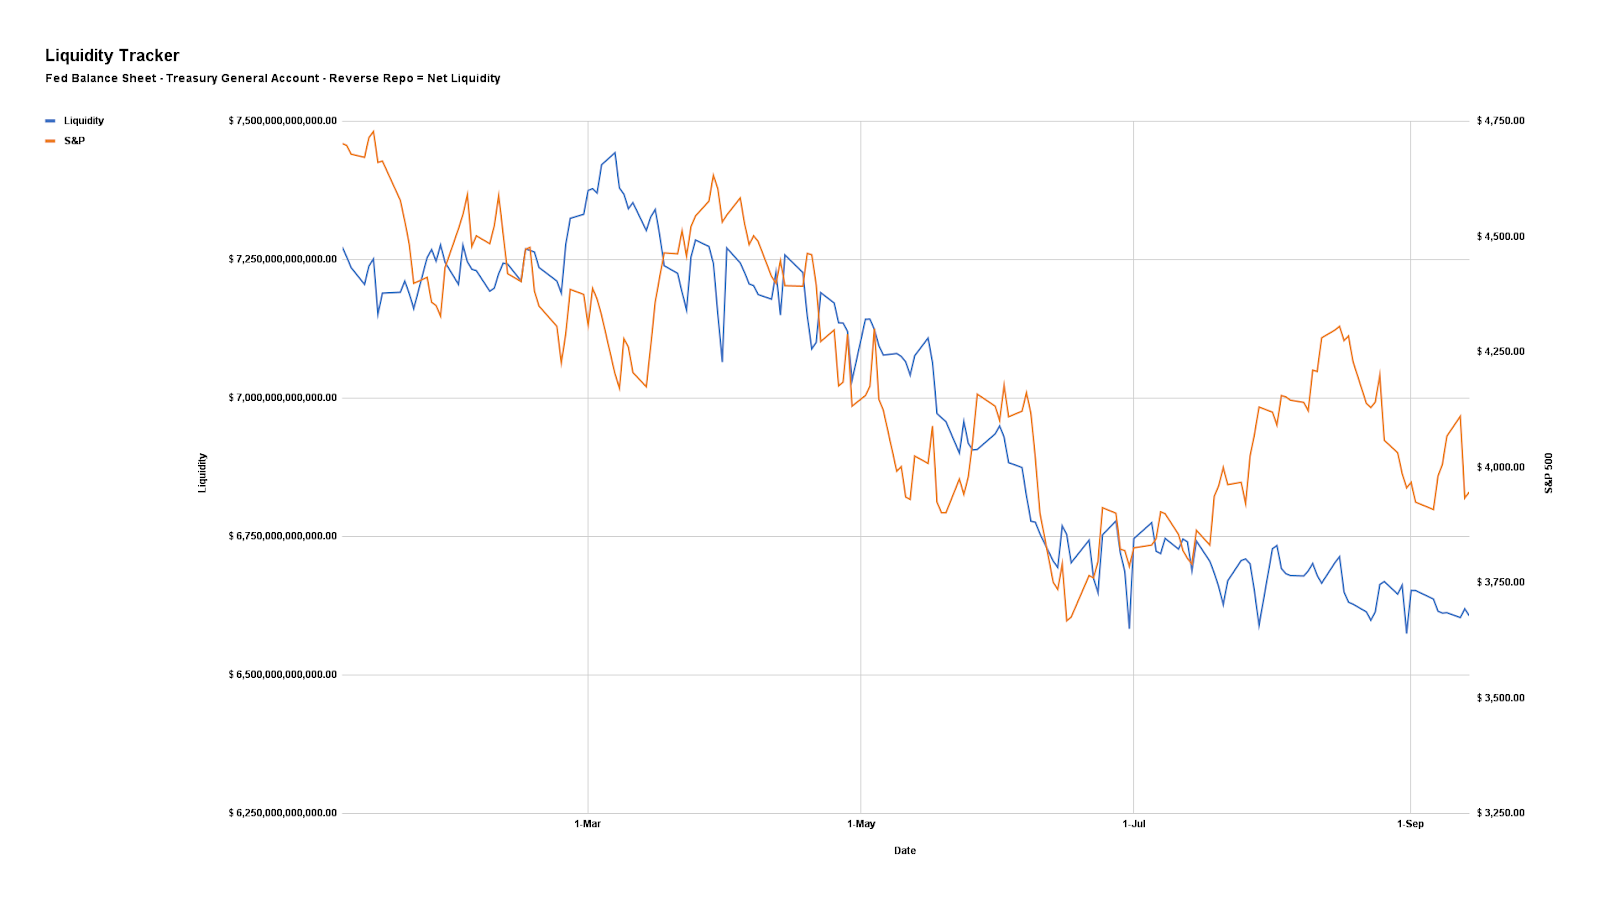
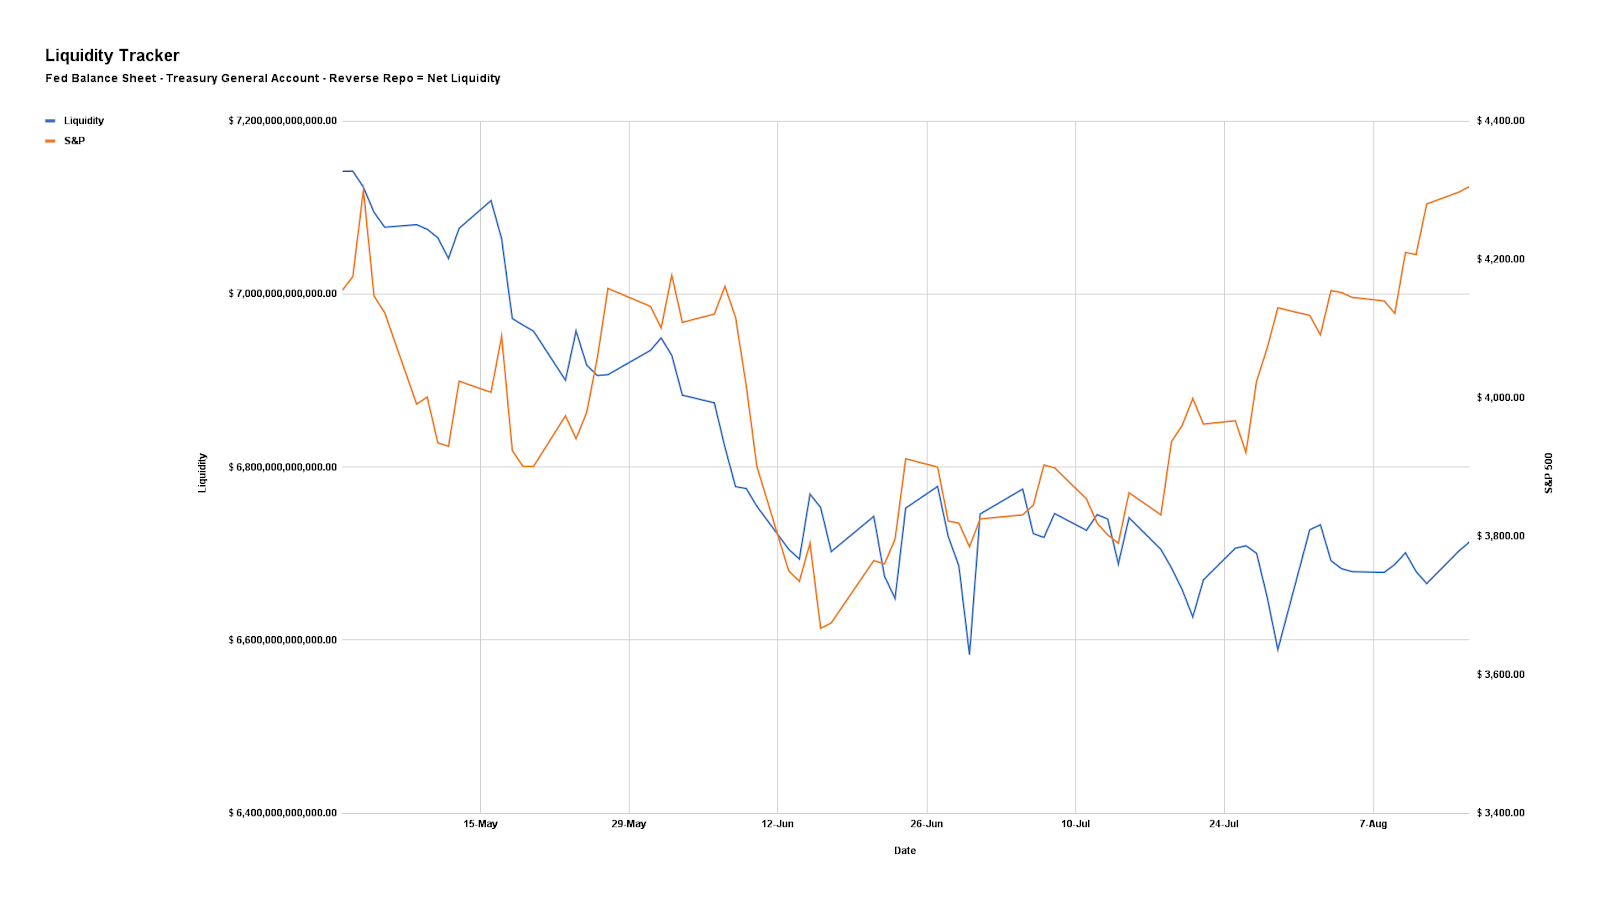
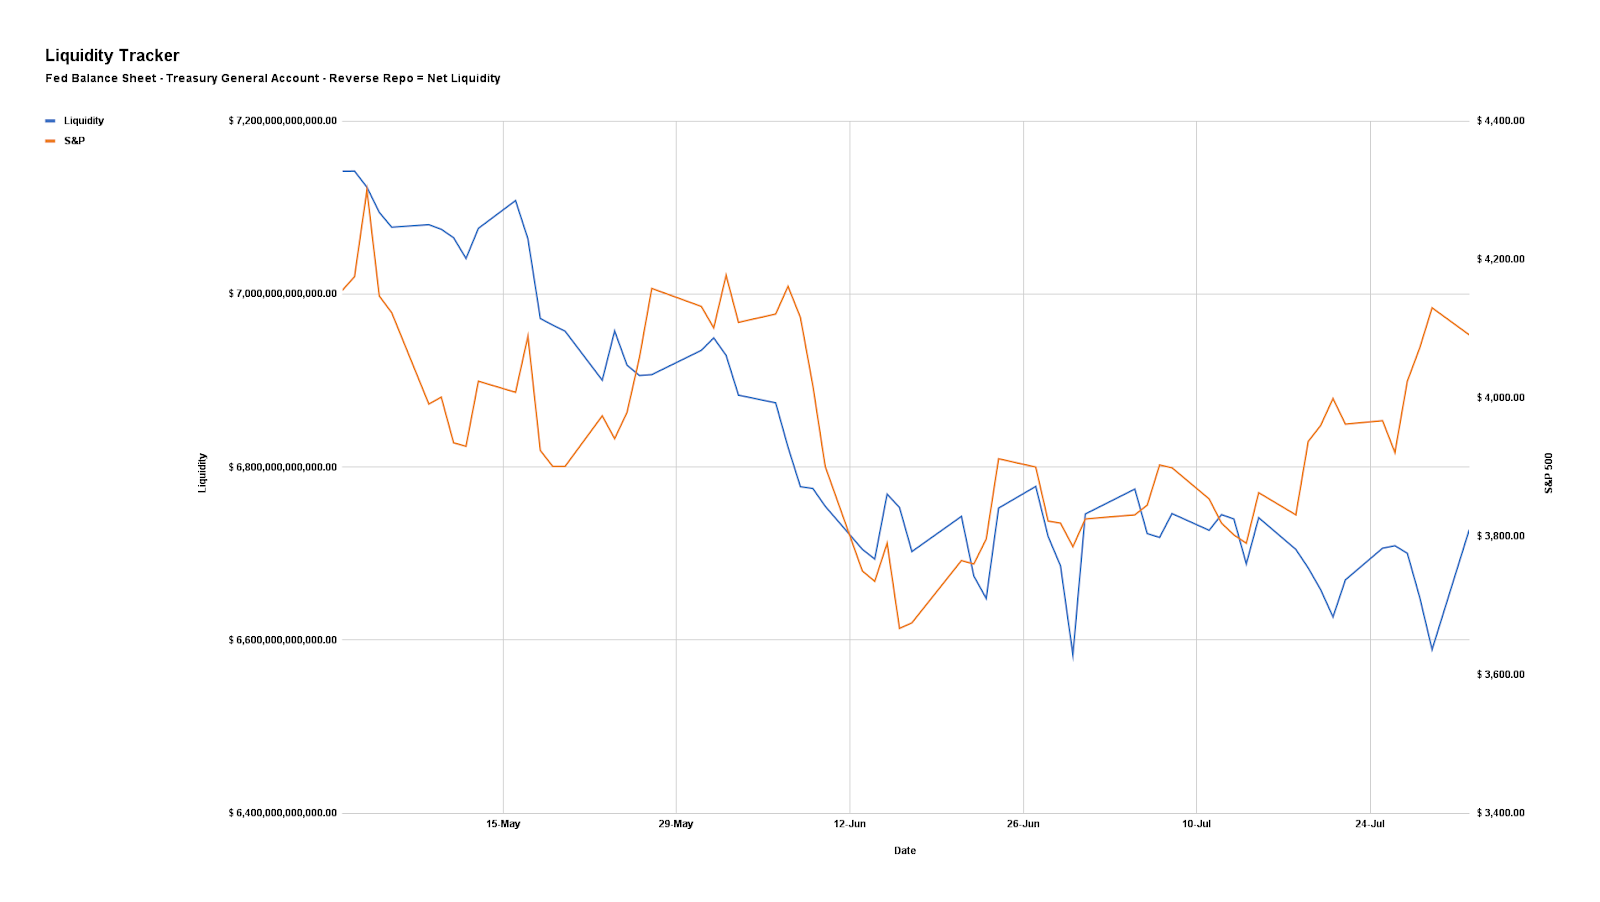
Over a longer-term, however, weakness may persist into October amid impacts of quantitative tightening (QT) which is manifesting itself as “$4.5 billion less in demand for assets per day,” as well as the blackout period for buybacks (which were consistently “supporting the market”) and options repositioning bolstering the weakness.
Technical
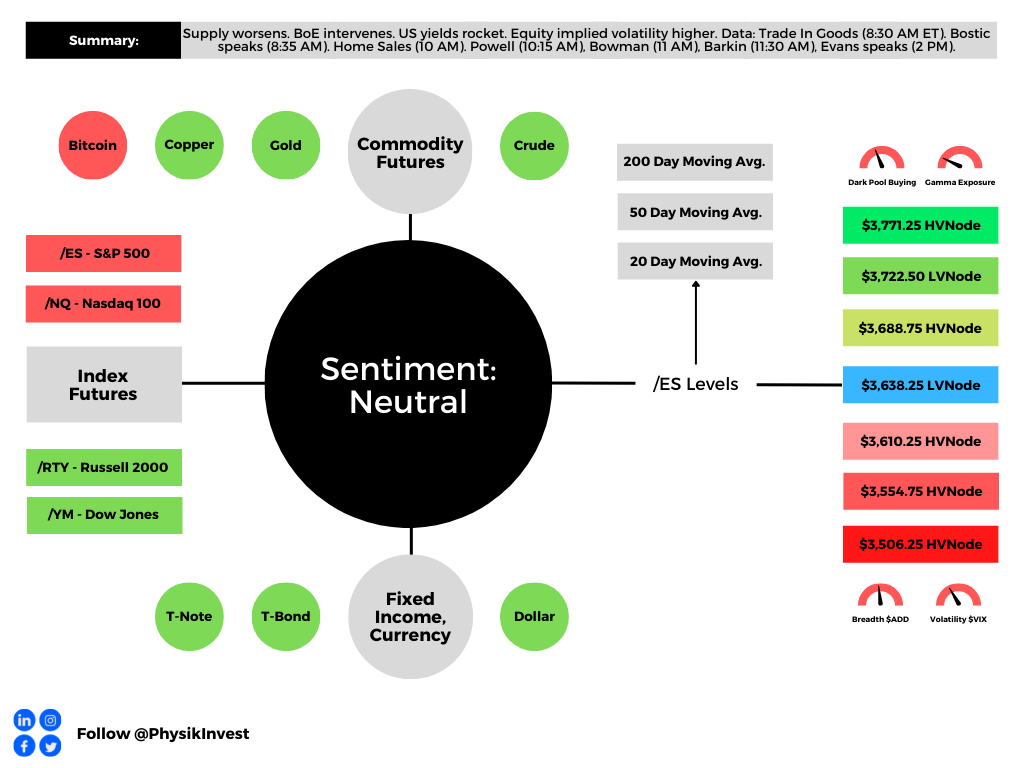
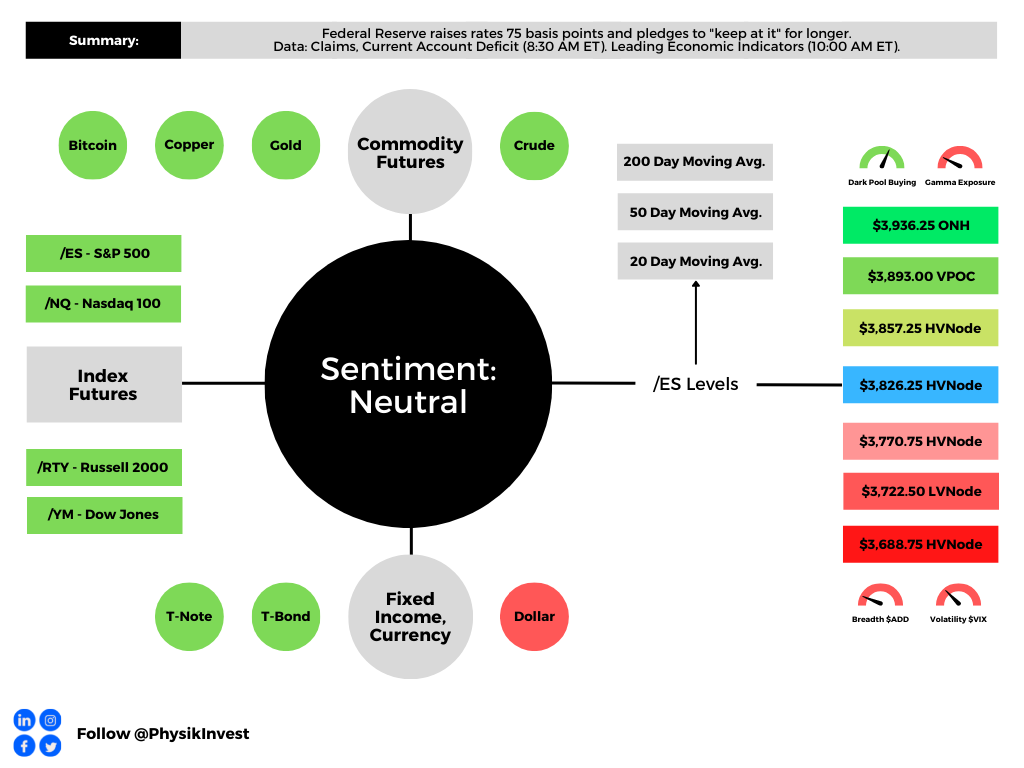
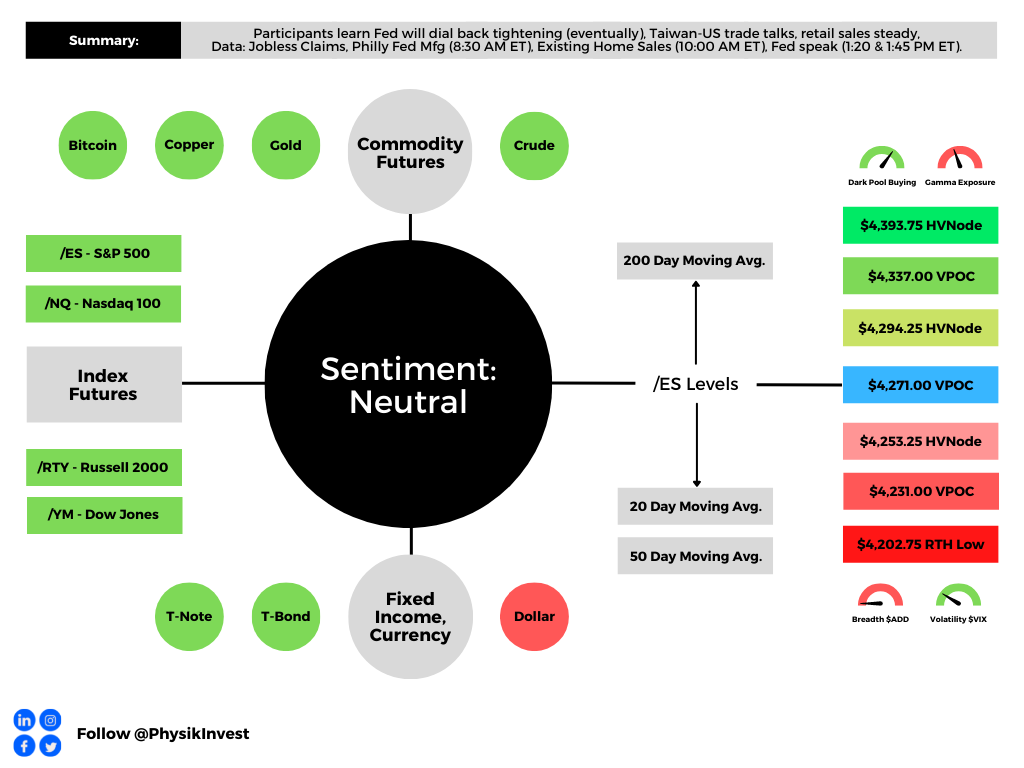
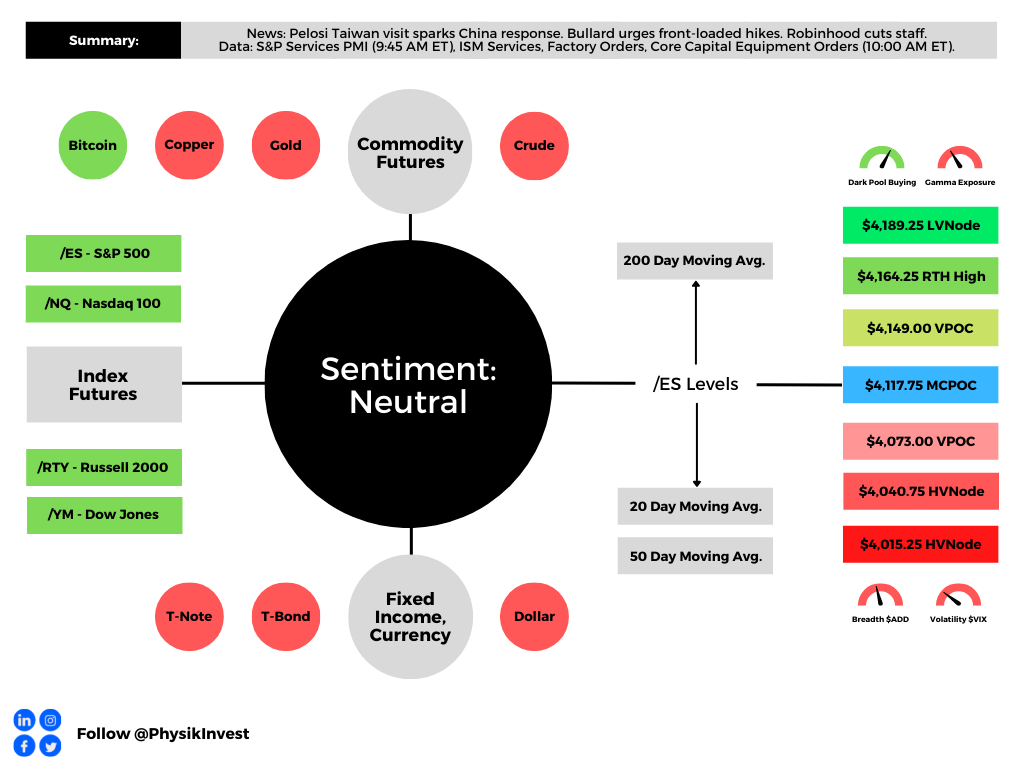
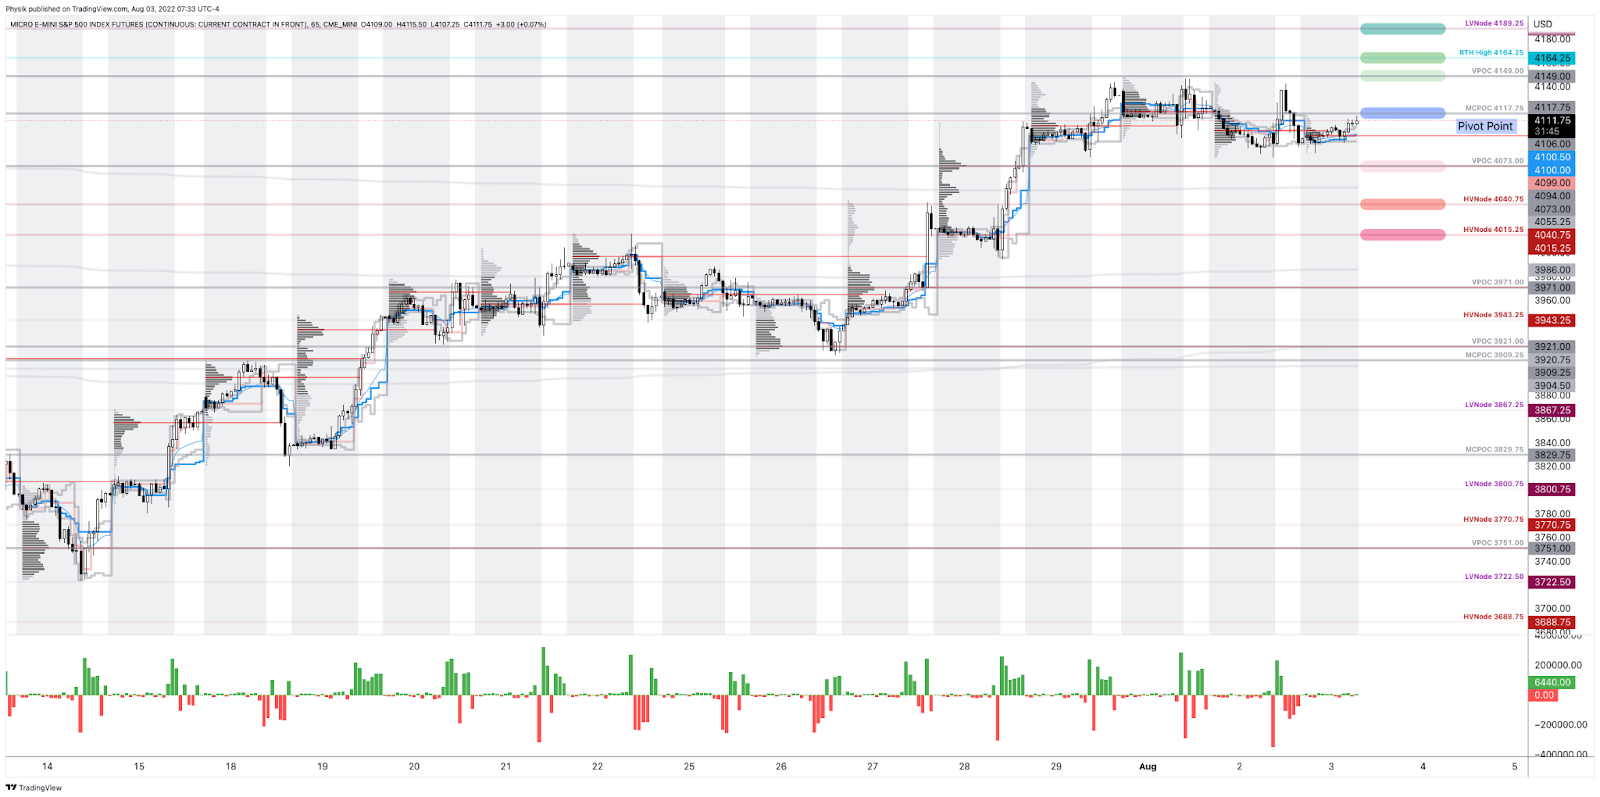
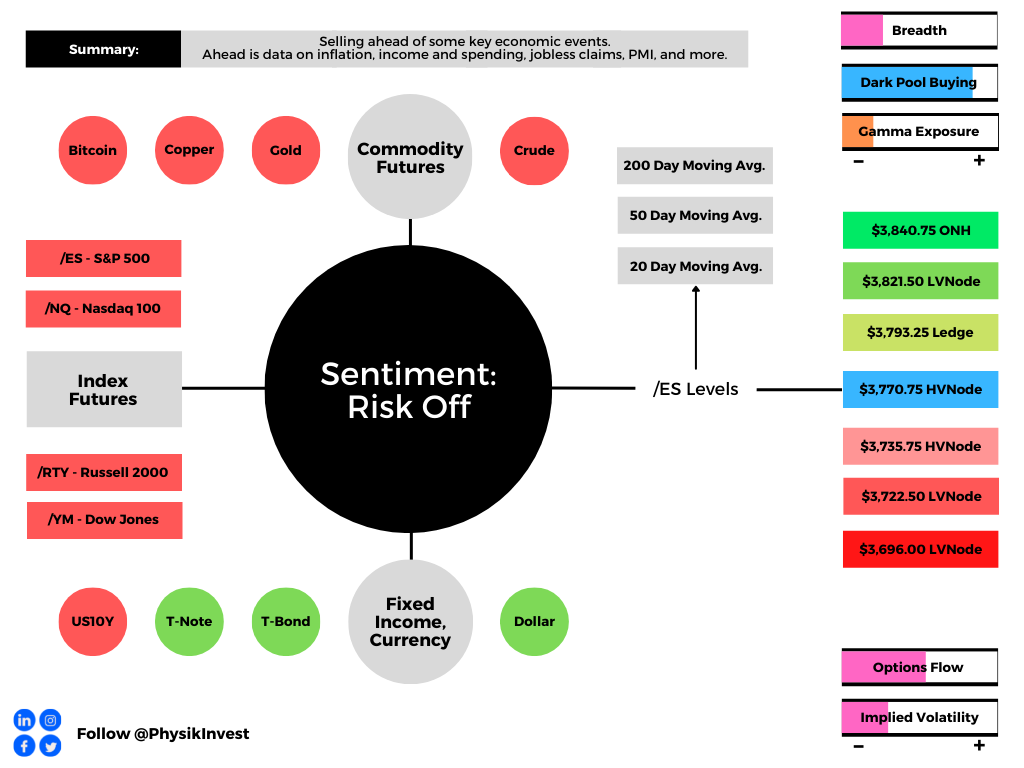
As of 8:30 AM ET, Thursday’s regular session (9:30 AM – 4:00 PM ET), in the S&P 500, is likely to open in the lower part of a negatively skewed overnight inventory, inside of prior-range and -value, suggesting a limited potential for immediate directional opportunity.
In the best case, the S&P 500 trades higher.
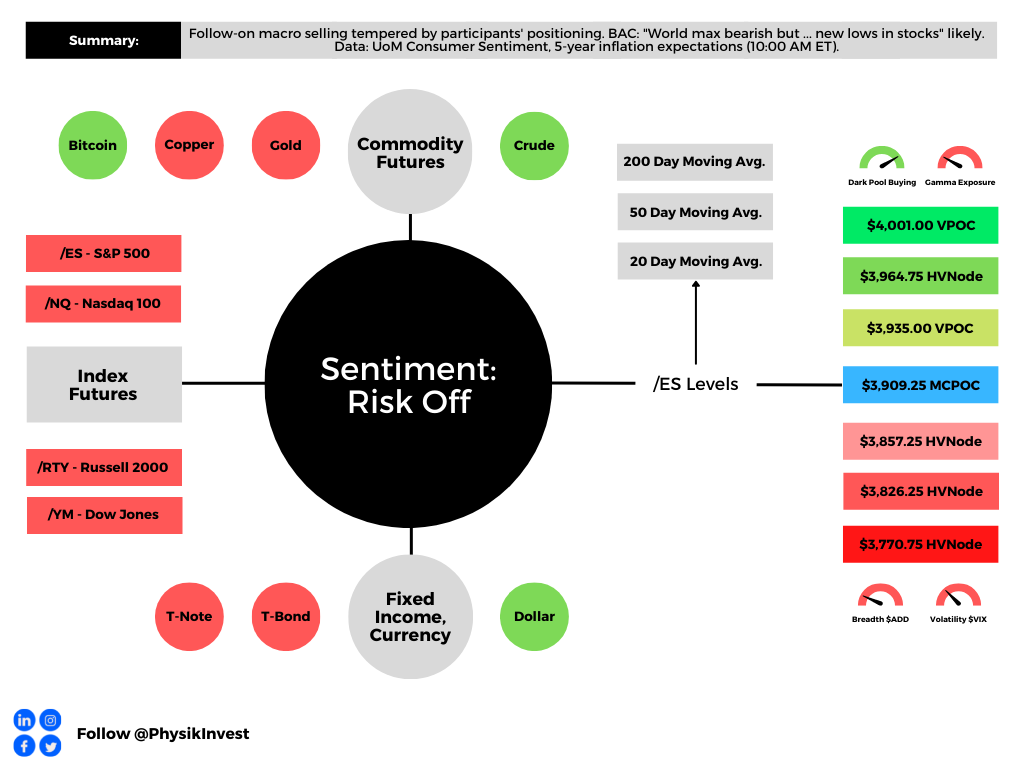
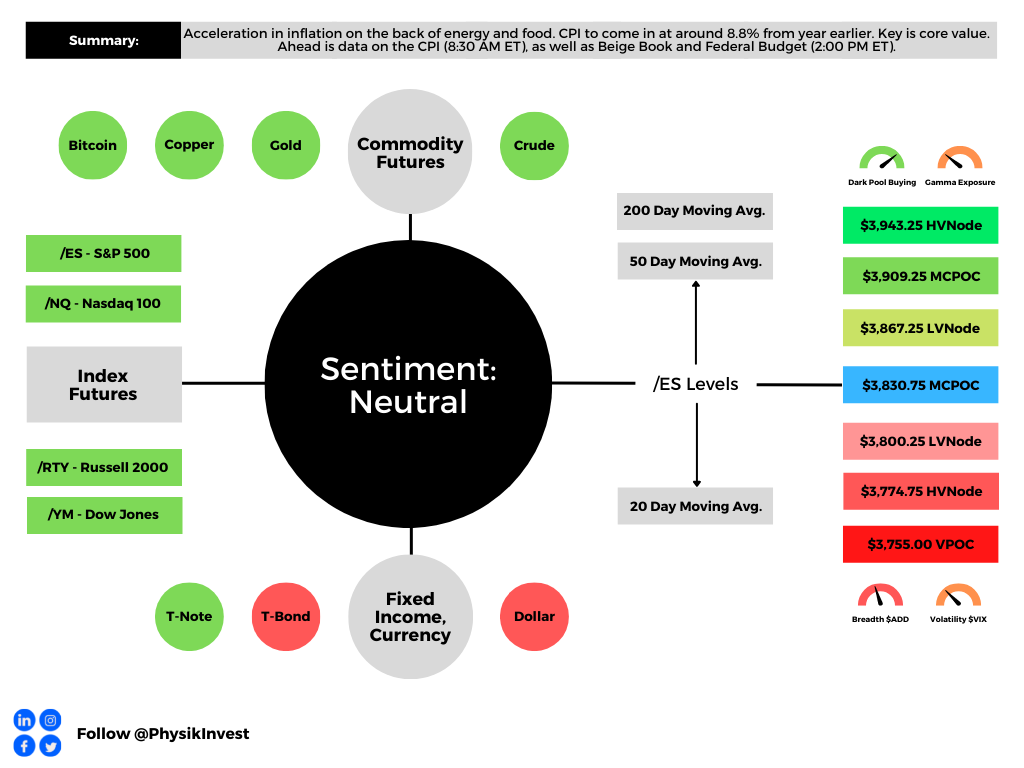
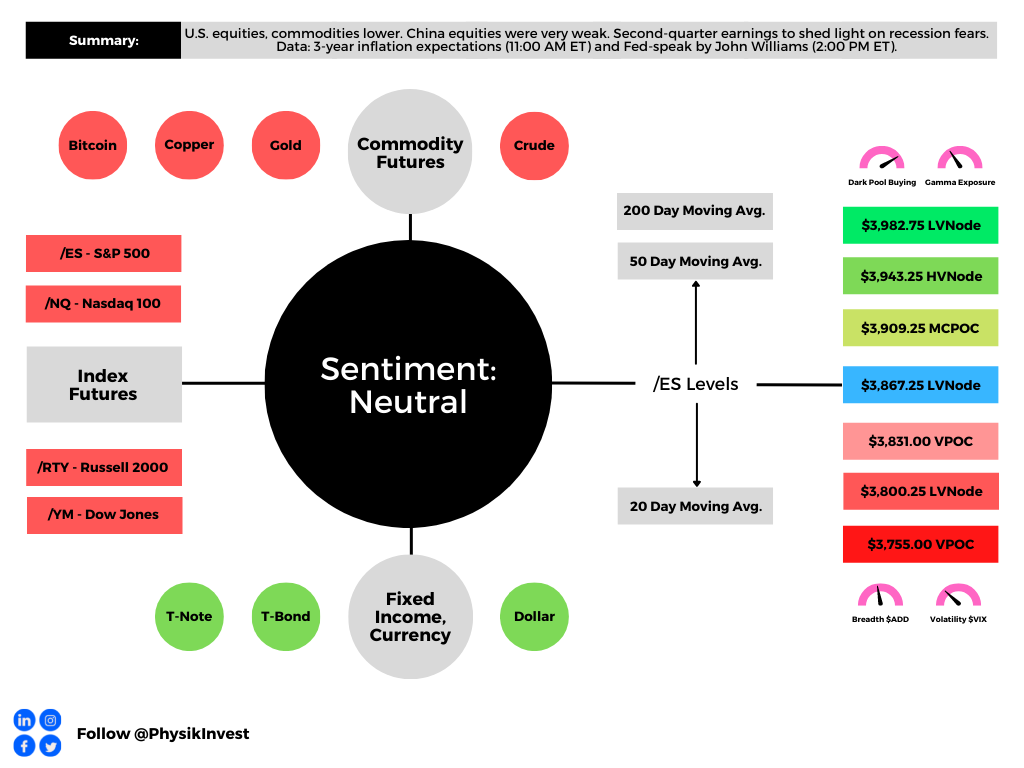
Any activity above the $3,722.50 LVNode puts into play the $3,771.25 HVNode. Initiative trade beyond the $3,771.25 could reach as high as the $3,826.25 and $3,862.25 HVNode, or higher.
In the worst case, the S&P 500 trades lower.
Any activity below the $3,722.50 LVNode puts into play the $3,688.75 HVNode. Initiative trade beyond the HVNode could reach as low as the $3,638.25 LVNode and $3,610.75 HVnode, or lower.
Click here to load today’s key levels into the web-based TradingView charting platform. Note that all levels are derived using the 65-minute timeframe. New links are produced, daily.

Definitions
Volume Areas: A structurally sound market will build on areas of high volume (HVNodes). Should the market trend for long periods of time, it will lack sound structure, identified as low volume areas (LVNodes). LVNodes denote directional conviction and ought to offer support on any test.
If participants were to auction and find acceptance into areas of prior low volume (LVNodes), then future discovery ought to be volatile and quick as participants look to HVNodes for favorable entry or exit.
About
After years of self-education, strategy development, mentorship, and trial-and-error, Renato Leonard Capelj began trading full-time and founded Physik Invest to detail his methods, research, and performance in the markets.
Capelj also develops insights around impactful options market dynamics at SpotGamma and is a Benzinga reporter.
Some of his works include conversations with ARK Invest’s Catherine Wood, investors Kevin O’Leary and John Chambers, FTX’s Sam Bankman-Fried, ex-Bridgewater Associate Andy Constan, Kai Volatility’s Cem Karsan, The Ambrus Group’s Kris Sidial, among many others.
Disclaimer
In no way should the materials herein be construed as advice. Derivatives carry a substantial risk of loss. All content is for informational purposes only.