Categories
Commentary

Daily Brief For February 14, 2023

Physik Invest’s Daily Brief is read by thousands of subscribers. You, too, can join this community to learn about the fundamental and technical drivers of markets.

Graphic updated 8:05 AM ET. Sentiment Risk-On if expected /ES open is above the prior day’s range. Click here for the latest levels. SqueezeMetrics Dark Pool Index (DIX) and Gamma (GEX) with the latter calculated based on where the prior day’s reading falls with respect to the MAX and MIN of all occurrences available. A higher DIX is bullish. At the same time, the lower the GEX, the more (expected) volatility. Click to learn the implications of volatility, direction, and moneyness. Breadth reflects a reading of the prior day’s NYSE Advance/Decline indicator. The CBOE VIX Volatility Index (INDEX: VVIX) reflects the attractiveness of owning volatility. UMBS price via MNDClick here for the calendar.

Fundamental

Companies are slowing price increases, 

The Transcript, quoting earnings calls, shared with subscribers. Notwithstanding, consumer spending still reads strong. Mastercard Inc (NYSE: MA) measured ~9% growth in spending last month, and this points to the presence of inflation in the system that needs to be worked out. 

Consequently, Federal Reserve (Fed) officials maintain that “more needs to be done”, and this is evident in traders’ guesses as to where rates peak (i.e., terminal rate), and when the eventual reduction in rates is set to occur (i.e., easing). 

The free CME Group Inc (NASDAQ: CME) FedWatch Tool shows rates peaking in the 5.00-5.25% range through November. Then, in December, traders price a move back to the 4.75-5.00% range where we are now.

Graphic: Retrieved from CME Group Inc’s (NASDAQ: CME) Fedwatch Tool.

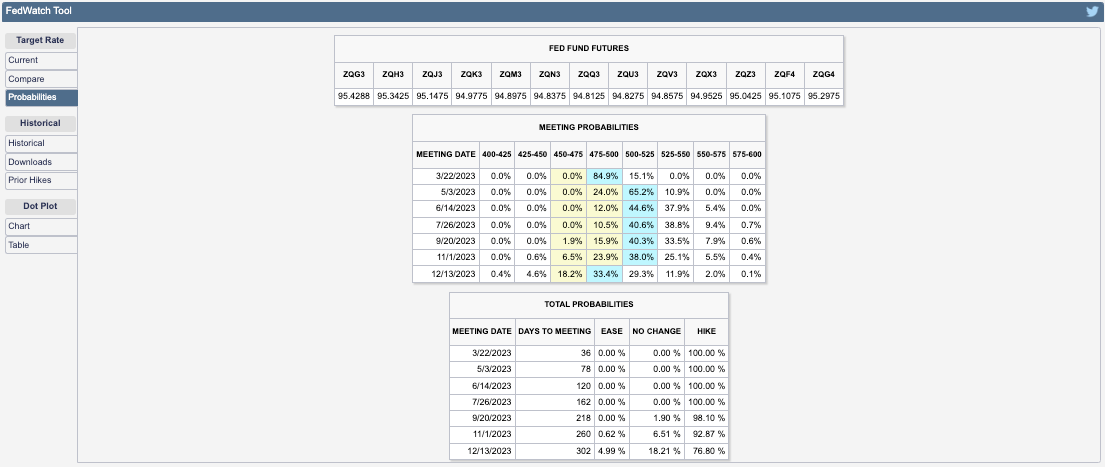
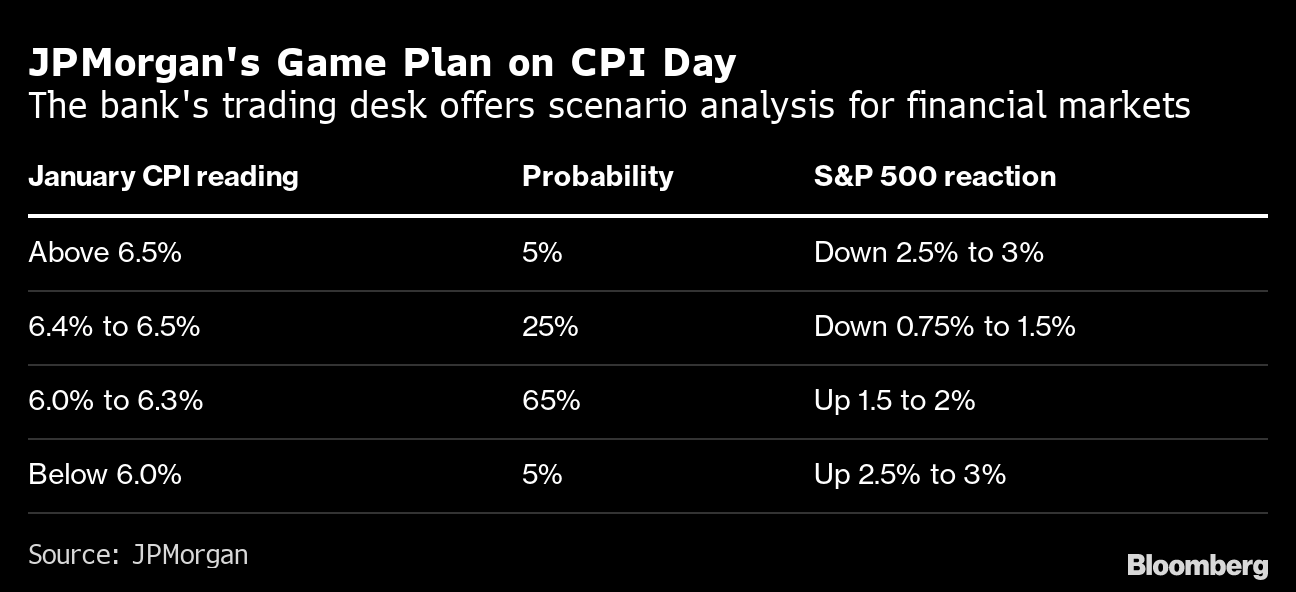
This is the pricing is in anticipation of rising consumer prices; the Consumer Price Index (CPI) due at 8:30 AM ET, is set to rise 0.5% in January, the most in a few months. Core CPI, which matters a lot to the Fed, is set to advance by about 0.4%.

JPMorgan Chase & Co (NYSE: JPM) thinks that “data close to estimates would be treated as confirming a continued cooling in inflation, which would imply a fall for bond yields and the dollar, while tech shares would lead an advance for US stocks.”

But, any equity gains are likely to fade, [JPM] warned, ‘once investors shift attention to a relatively slower pace of disinflation than the previous two months, where each CPI print saw a decrease of 60 basis points.’”

Graphic: Retrieved from Bloomberg.

So in-line CPI, coupled with a strong January jobs report, will “corroborate recent comments from Fed officials that further interest-rate hikes are likely forthcoming,” Bloomberg adds. In a post by Joseph Wang, a former Fed trader, “a higher interest rate environment implies a more potent [quantiative tightening or] QT.”

“The Fed’s aggressive hikes have yet to reach the bulk of bank deposits, which is the foundational financial asset for many households. These deeply negative real yields may be extending the portfolio rebalancing impact of QE. Some households have escaped financial repression by moving into Treasury bills or money market funds, but that is not the only refuge. The perceived return of risk assets likely remains high for many, as the memory of the 2021 boom is still fresh.” Further, a “sizable yield upgrade being forced onto the market may indicate a more impactful QT.”

QT, to put it simply, is the flow of capital out of capital markets. Higher rates for longer and more QT are not good for risk assets. Though money is flowing from other parts of the world, which, in part, has bolstered buying of assets over the past months, accelerating “QT shifts the composition of financial assets towards those that better reflect the Fed’s restrictive stance.”

Positioning

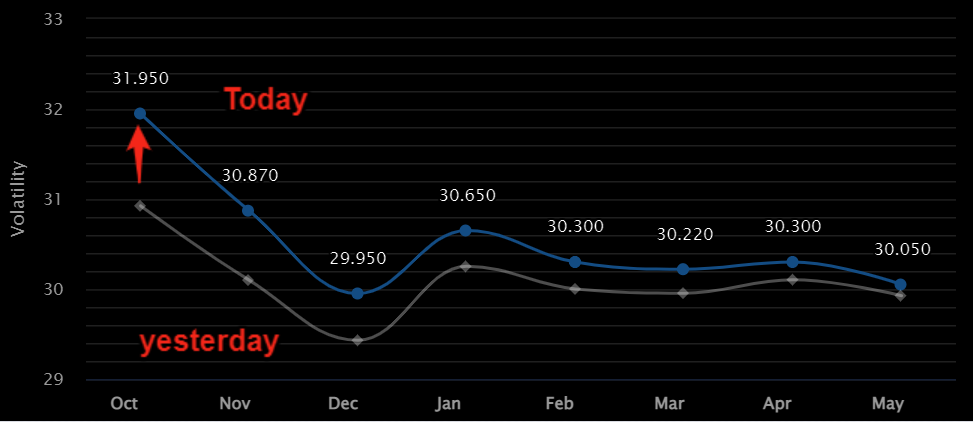
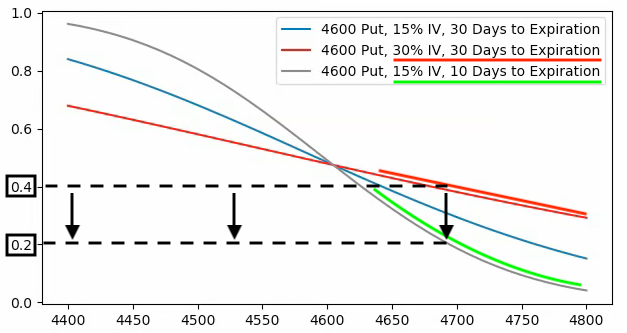
In the post-CPI expirations, implied volatility (IVOL), a demonstration of traders’ fears and demands for protection, is wound and is likely to serve as a catalyst for a fast move after CPI. Should fears be assuaged (i.e., barring the unexpected), wound volatility is likely to compress and this may result in a short-term market boost.

However, the sale and expiry of protection, after CPI and particularly the coming options expiration (OpEx), is likely to put the market in a precarious position.

According to SpotGamma, “current positioning, a result of re-grossing over the past weeks and months, has boosted dealer exposure to positive gamma.” This means counterparties (i.e., dealers) make money when the market moves and hedge in a manner that reduces volatility, “hence more rangebound trade as we have seen.”

Following OpEx, counterparty exposure to positive gamma will decline and “leave markets more at the whim of macro-type repositioning” which counterparties will do less to disrupt and more to bolster (i.e., add to movement).

Therefore, as SpotGamma summarizes, “[b]e prepared for potential relief immediately after CPI. However, across a longer time horizon, there is potential for weakness and that weakness may be exacerbated by dealer hedging.”

Technical

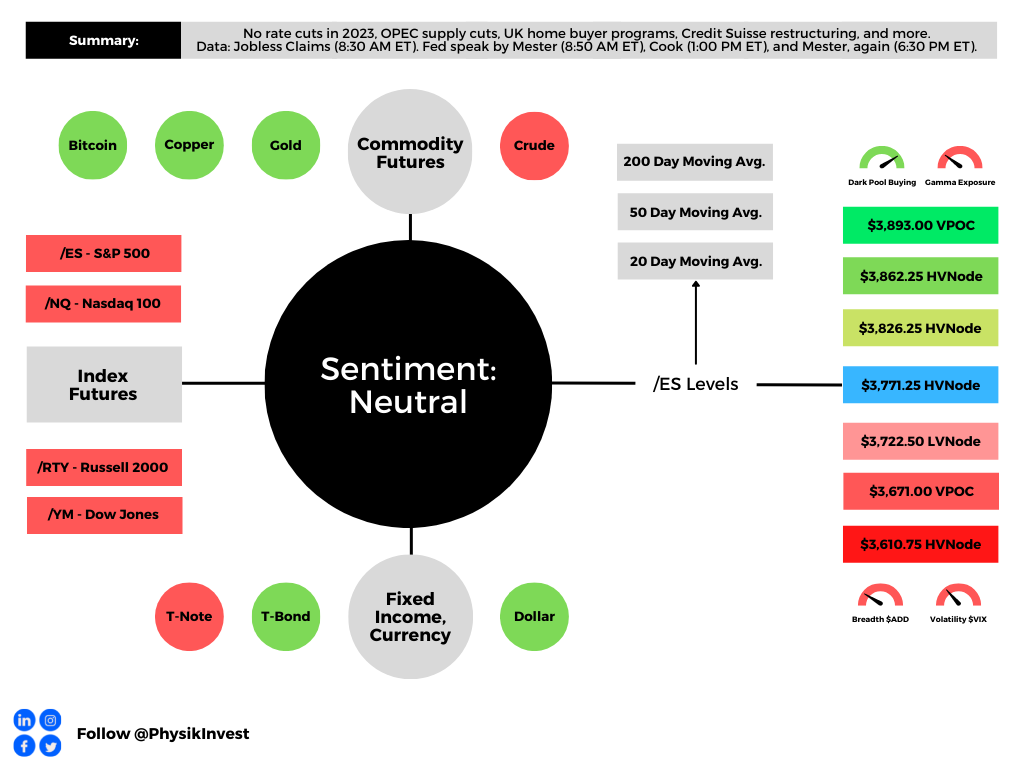
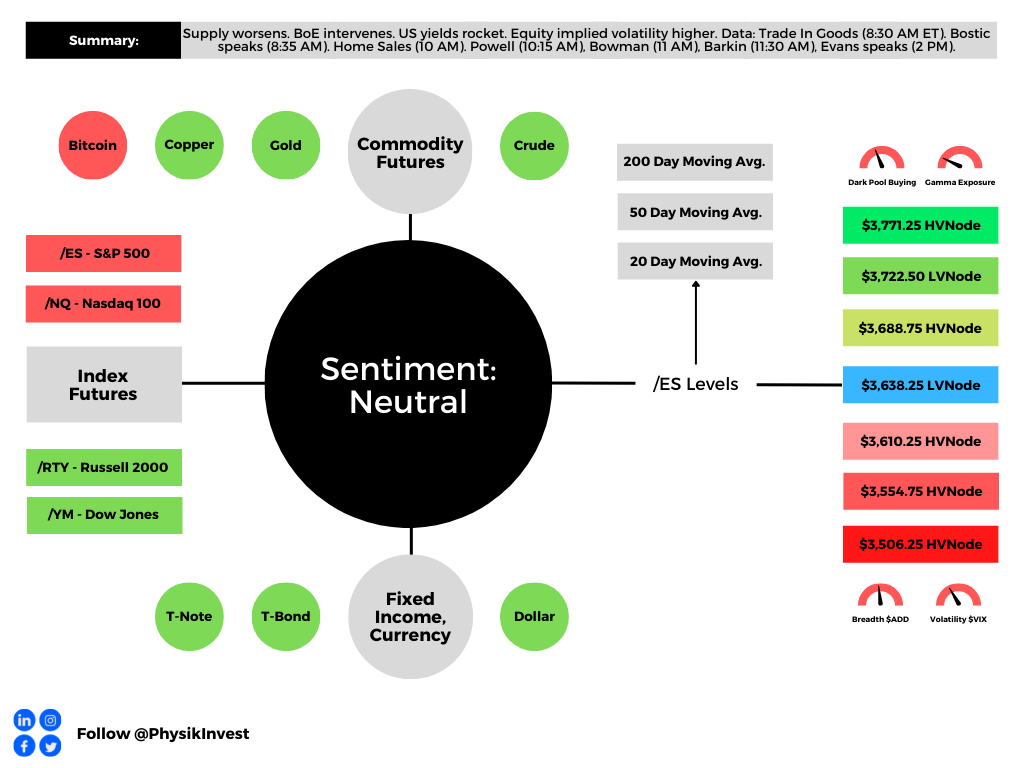
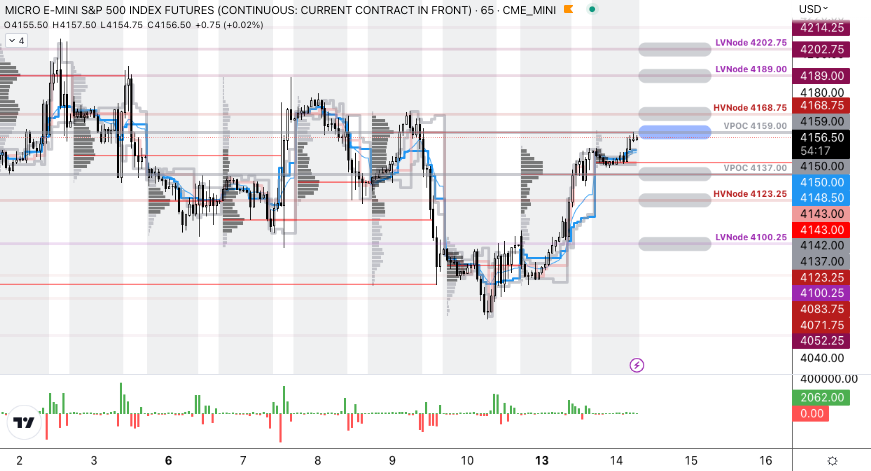
As of 7:15 AM ET, Tuesday’s regular session (9:30 AM – 4:00 PM ET), in the S&P 500, is likely to open in the upper part of a balanced overnight inventory, outside of the prior day’s range, suggesting a potential for immediate directional opportunity.

The S&P 500 pivot for today is $4,159.00. 

Key levels to the upside include $4,168.75, $4,189.00, and $4,202.75.

Key levels to the downside include $4,137.00, $4,123.25, and $4,100.25.

Disclaimer: Click here to load the updated key levels via the web-based TradingView platform. New links are produced daily. Quoted levels likely hold barring an exogenous development.

Graphic: 65-minute profile chart of the Micro E-mini S&P 500 Futures.

Definitions

Volume Areas: Markets will build on areas of high-volume (HVNodes). Should the market trend for a period of time, this will be identified by a low-volume area (LVNodes). The LVNodes denote directional conviction and ought to offer support on any test.

If participants auction and find acceptance in an area of a prior LVNode, then future discovery ought to be volatile and quick as participants look to the nearest HVNodes for more favorable entry or exit.

POCs: Areas where two-sided trade was most prevalent in a prior day session. Participants will respond to future tests of value as they offer favorable entry and exit.


About

The author, Renato Leonard Capelj, works in finance and journalism.

Capelj spends the bulk of his time at Physik Invest, an entity through which he invests and publishes free daily analyses to thousands of subscribers. The analyses offer him and his subscribers a way to stay on the right side of the market. Separately, Capelj is an options analyst at SpotGamma and an accredited journalist.

Capelj’s past works include conversations with investor Kevin O’Leary, ARK Invest’s Catherine Wood, FTX’s Sam Bankman-Fried, Lithuania’s Minister of Economy and Innovation Aušrinė Armonaitė, former Cisco chairman and CEO John Chambers, and persons at the Clinton Global Initiative.

Connect

Direct queries to renato@physikinvest.com or find Physik Invest on TwitterLinkedInFacebook, and Instagram.

Calendar

You may view this letter’s content calendar at this link.

Disclaimer

Do not construe this newsletter as advice. All content is for informational purposes.

Categories
Commentary

Daily Brief For October 6, 2022

The daily brief is a free glimpse into the prevailing fundamental and technical drivers of U.S. equity market products. Join the 1000+ that read this report daily, below!

Graphic updated 8:00 AM ET. Sentiment Neutral if expected /ES open is inside of the prior day’s range. /ES levels are derived from the profile graphic at the bottom of the following section. Levels may have changed since initially quoted; click here for the latest levels. SqueezeMetrics Dark Pool Index (DIX) and Gamma (GEX) calculations are based on where the prior day’s reading falls with respect to the MAX and MIN of all occurrences available. A higher DIX is bullish. At the same time, the lower the GEX, the more (expected) volatility. Learn the implications of volatility, direction, and moneyness. Breadth reflects a reading of the prior day’s NYSE Advance/Decline indicator. VIX reflects a current reading of the CBOE Volatility Index (INDEX: VIX) from 0-100.

Administrative

Good morning, team! Appreciate you opening up this email and reading through the newsletter. 

Over the span of two or so years, on Substack and Physik Invest’s website, issued daily was this letter you, alongside about 1,000 others, are subscribed to.

This newsletter went from about 400 subscribers in July to 1,000 in October, a 150% increase. Thank you to fx:macro, The Morning Hark, The Transcript, and twenty others who, in large part, made that increase happen.

From hereon, gun to the head, I (your letter writer) can’t tell where this newsletter is going. 

In short, this letter served as a tool for me to improve and keep me aware. It was years ago that markets were a dream I was in steadfast pursuit of; I sought mentorship, studied, saved money, and, ultimately, made it a successful full-time gig. 

This letter helped keep me committed to continuous improvement. Sure the money was great, but how do you keep that flow when times get tough? That is something this letter helped me achieve. I hope it’s done the same for you.

At the same time, to weather the storms (periods of inactivity or low earnings while trading like now), I continued my work at places like Benzinga and SpotGamma.

Probably shaved a few years off my life expectancy but the effect was a net positive, I believe. 

That said, in our own way, each and every one of us wants to level up, and that is what makes it difficult for me to promise where this newsletter may go. Speaking bluntly, I am faced with some good problems; e.g., should I raise money and build a fund? Work at an institution? Pivot to PE or, even, government work? Go back to school? Can’t tell you, yet.

What the next step will be I am not sure. Regardless, I intend to keep you fully in the loop. 

As I set out and travel over the next 30 days, I’ll be doing a lot of thinking and, though the frequency of issued letters may change, briefly, the result may be better letters potentially spanning areas far beyond the S&P and the factors that are driving it.

Definitely am open to feedback. Appreciate you for joining the community and staying on board! 

PS: Two things.

First, I’ll be in London and Lisbon over the next month. If you’re in either of the two cities, reach me on Telegram (@renatolcapelj) and/or Discord (Renato Capelj#8625). 

Maybe a coffee?

Second, I spent the past half-year helping Benzinga build an awesome fintech event coming to New York City this December 8, 2022. Organizations such as FIS, Fireblocks, Truist, Symbiont, State Street, Vanguard, Northern Trust, Partisia, and Apex Clearing are a few that will be there.

If you want to network with the best, let me know and I’ll try to get you a ticket!

Regards,

Renato

Fundamental

An eventful week. 

News, today, was focused on Federal Reserve (Fed) officials not planning to cut interest rates next year, the Organization of the Petroleum Exporting Countries (OPEC) agreeing to a supply cut, the UK mulling first-time home buyer program extensions, and Credit Suisse Group AG (NYSE: CS) seeking investment to help spin off its advisory and investment banking units.

Please check out the Physik Invest archives and upcoming letters for more on the impact.

Positioning

Bloomberg reported yesterday a big trade fired off mid-day propelling the S&P 500 higher into the close. The trade consisted of +20,000 OCT $4,500.00, +14,000 MAR $4,300.00 calls, and -48,000 JAN $4,500.00 calls. 

The trade leaves the participant(s) with positive Delta. The other side has exposure to negative Delta meaning they lose money if the S&P 500 is higher, all else equal. To hedge this negative Delta, counterparties buy futures (positive Delta) and that has a positive impact.

According to SpotGamma, though, there needs to be more impactful bullish call repositioning or a market rise that’s large enough to solicit volatility-dampening hedging from counterparties.

Until the last-mentioned happens, the market may continue to balance in a larger range.

Technical

As of 8:00 AM ET, Thursday’s regular session (9:30 AM – 4:00 PM ET), in the S&P 500, is likely to open in the lower part of a negatively skewed overnight inventory, inside of prior-range and -value, suggesting a limited potential for immediate directional opportunity.

In the best case, the S&P 500 trades higher.

Any activity above the $3,771.25 HVNode puts into play the $3,826.25 HVNode. Initiative trade beyond the last-mentioned could reach as high as the $3,862.25 HVNode and $3,893.00 VPOC, or higher.

In the worst case, the S&P 500 trades lower.

Any activity below the $3,771.25 HVNode puts into play the $3,722.50 LVNode. Initiative trade beyond the LVNode could reach as low as the $3,671.00 VPOC and $3,610.75 HVNode, or lower.

Click here to load today’s key levels into the web-based TradingView charting platform. Note that all levels are derived using the 65-minute timeframe. New links are produced, daily.
Graphic: 65-minute profile chart of the Micro E-mini S&P 500 Futures.

Definitions

Volume Areas: A structurally sound market will build on areas of high volume (HVNodes). Should the market trend for long periods of time, it will lack sound structure, identified as low volume areas (LVNodes). LVNodes denote directional conviction and ought to offer support on any test. 

If participants were to auction and find acceptance into areas of prior low volume (LVNodes), then future discovery ought to be volatile and quick as participants look to HVNodes for favorable entry or exit.

POCs: POCs are valuable as they denote areas where two-sided trade was most prevalent in a prior day session. Participants will respond to future tests of value as they offer favorable entry and exit.

About

After years of self-education, strategy development, mentorship, and trial-and-error, Renato Leonard Capelj began trading full-time and founded Physik Invest to detail his methods, research, and performance in the markets.

Capelj also develops insights around impactful options market dynamics at SpotGamma and is a Benzinga reporter.

Some of his works include conversations with ARK Invest’s Catherine Wood, investors Kevin O’Leary and John Chambers, FTX’s Sam Bankman-Fried, ex-Bridgewater Associate Andy Constan, Kai Volatility’s Cem Karsan, The Ambrus Group’s Kris Sidial, among many others.

Disclaimer

In no way should the materials herein be construed as advice. Derivatives carry a substantial risk of loss. All content is for informational purposes only.

Categories
Commentary

Daily Brief For September 28, 2022

The daily brief is a free glimpse into the prevailing fundamental and technical drivers of U.S. equity market products. Join the 970+ that read this report daily, below!

Graphic updated 8:20 AM ET. Sentiment Neutral if expected /ES open is inside of the prior day’s range. /ES levels are derived from the profile graphic at the bottom of the following section. Levels may have changed since initially quoted; click here for the latest levels. SqueezeMetrics Dark Pool Index (DIX) and Gamma (GEX) calculations are based on where the prior day’s reading falls with respect to the MAX and MIN of all occurrences available. A higher DIX is bullish. At the same time, the lower the GEX, the more (expected) volatility. Learn the implications of volatility, direction, and moneyness. Breadth reflects a reading of the prior day’s NYSE Advance/Decline indicator. VIX reflects a current reading of the CBOE Volatility Index (INDEX: VIX) from 0-100.

Administrative

Apologies, team, if the quality was lacking these past few days. Extremely busy on my end and I look forward to some detailed letters in the near future! – Renato

Fundamental

“Great powers are waging hot wars involving the flow of technologies, goods, and commodities.”

That’s according to Credit Suisse Group AG’s (NYSE: CS) Zoltan Pozsar who believes that the pillars forming the context for a low-inflation world are changing, and this is setting the stage for longer-lasting structural inflation.

In short, inflationary impulses are incoming from non-linear geopolitical and economic conflicts. 

Just yesterday, Europe was investigating attacks on pipelines from Russia; there were “major leaks into the Baltic Sea from two Russian gas pipelines at the cent[er] of an energy standoff.”

“The word sabotage springs to mind,” Javier Blas of Bloomberg, said. “In a single day, the conduits, which link Russia with Germany under the Baltic Sea, have suffered not one, not two, but three separate major leaks.”

Per reports by Refinitiv, seismologists nearby registered “powerful blasts” that “do not resemble signals from earthquakes.” Instead, the explosions likely correspond with hundreds of “kilos (kg) of dynamite.”

Graphic: Retrieved from Bloomberg. 

Given that Nordstream 1 and 2 are not operational, now, the “leaks are more likely a message: [if truly the culprit], Russia is opening a new front on its energy war against Europe.” 

Accordingly, gas prices were higher but “below this year’s peaks,” Refinitiv reported. Generally, across some benchmarks, prices read “more than 200%, higher than in early September 2021.”

Separately, the Bank of England (BoE) is delaying quantitative-tightening (QT) bond sales and opting to purchase longer-dated government bonds in an attempt to restore stability, which we discussed was at risk on Monday and Tuesday.

Graphic: Retrieved from Bloomberg. Credit Default Swaps (CDSs) are a tool for investors to offload credit risk to other market participants.

As a result, after a near-vertical drop (visible below) in Gilts and British corporate bonds (which impacted mortgage lending, for one), UK yields saw some of their biggest drops on record.

Graphic: Retrieved from Bloomberg. Updated September 26, 2022.

The actions over the past few days complicate the Monetary Policy Committee’s (MPC) objective to reach a return to 2% inflation in the medium term.

Graphic: Retrieved, initially, from Bank of America Corporation (NYSE: BAC). Via The Transcript. Interest rates “may be higher for longer” than expected.

At home, here, in the US, yields on the 10-year topped 4.00%. There is a heightened chance of a Federal Reserve (Fed) bump in rates that brings the target rate to 375-400 basis points, while the UK, in stemming its inflationary pressures, is expected to bump by double that amount.

The action to stem inflation is feeding through to demand. Apple Inc (NASDAQ: AAPL) said it would ease plans to boost iPhone production “after an anticipated surge in demand failed to materialize,” a Bloomberg report said

“The supply constraints pulling down on the market since last year have eased and the industry has shifted to a demand-constrained market,” said Nabila Popal, research director at IDC. 

“High inventory in channels and low demand with no signs of immediate recovery has OEMs panicking and cutting their orders drastically for 2022,” a fear we said ARK Invest’s Catherine Wood shared, not too long ago.

Positioning

The beginning of the week was characterized by a sideways-to-lower S&P 500 (INDEX: SPX) and implied volatility (IVOL) metrics, such as the Cboe Volatility Index (INDEX: VIX), rising.

Per IVOL the term structure, demand for options protections seems to be concentrated in options that are shorter-dated and far more sensitive to changes in direction and volatility.

That means for large shifts in price and/or volatility, hedging ratios (e.g., Delta) shift markedly, too. This prompts “hedging feedback mechanisms in both market directions,” per SpotGamma.

Graphic: Retrieved from VIX Central. Taken from The Market Ear. Updated 9/27/2022.

Moreover, the risks are skewed to the upside, SpotGamma added. 

“For pumped-up options far from the money to retain their value, there essentially needs to be an adverse move (in price and volatility). Should nothing bad happen, the probability of these options paying out will fade, as will their exposure to direction (or Delta). [In] re-hedg[ing] decreased exposure to Delta, liquidity providers [] may provide the market with a boost.”

Graphic: Retrieved from SpotGamma. SPX prices X-axis. Option delta Y-axis. When the factors of implied volatility (Vanna) and time change (Charm), hedging ratios change. The graphic is for illustrational purposes, only.

At the same time, there appears to be some “dealer disintermediation” amid “less incentive to make deep, tight markets” due to “capital constraints,” potentially, explained SqueezeMetrics, the creator of the DIX (Dark Pool Index).

This comes after months of high average readings in DIX (likely as market-makers assembled “basket[s] of S&P 500 stocks to create ETF shares, or to hedge away the exposure of a futures contract[s]”). Typically, high DIX readings are associated with stronger 1-month market returns, particularly when put flows are strong (i.e., lower Gamma exposure readings, like now).

Graphic: Retrieved from SqueezeMetrics.

Overall, the trend change is “suggestive of some second thoughts from the [buy-the-dip] crowd, and perhaps (likely!) some deleveraging from elsewhere,” SqueezeMetrics ended.

Technical

As of 8:20 AM ET, Wednesday’s regular session (9:30 AM – 4:00 PM ET), in the S&P 500, is likely to open in the upper part of a negatively skewed overnight inventory, inside of prior-range and -value, suggesting a limited potential for immediate directional opportunity.

In the best case, the S&P 500 trades higher.

Any activity above the $3,638.25 LVNode puts into play the $3,688.75 HVNode. Initiative trade beyond the HVNode could reach as high as the $3,722.50 LVNode and $3,771.25 HVnode, or higher.

In the worst case, the S&P 500 trades lower.

Any activity below the $3,638.25 LVNode puts into play the $3,610.75 HVNode. Initiative trade beyond the HVNode could reach as low as the $3,554.75 and $3,506.25 HVNode, or lower.

Click here to load today’s key levels into the web-based TradingView charting platform. Note that all levels are derived using the 65-minute timeframe. New links are produced, daily.
Graphic: 65-minute profile chart of the Micro E-mini S&P 500 Futures.

Definitions

Volume Areas: A structurally sound market will build on areas of high volume (HVNodes). Should the market trend for long periods of time, it will lack sound structure, identified as low volume areas (LVNodes). LVNodes denote directional conviction and ought to offer support on any test. 

If participants were to auction and find acceptance into areas of prior low volume (LVNodes), then future discovery ought to be volatile and quick as participants look to HVNodes for favorable entry or exit.

POCs: POCs are valuable as they denote areas where two-sided trade was most prevalent in a prior day session. Participants will respond to future tests of value as they offer favorable entry and exit.

About

After years of self-education, strategy development, mentorship, and trial-and-error, Renato Leonard Capelj began trading full-time and founded Physik Invest to detail his methods, research, and performance in the markets.

Capelj also develops insights around impactful options market dynamics at SpotGamma and is a Benzinga reporter.

Some of his works include conversations with ARK Invest’s Catherine Wood, investors Kevin O’Leary and John Chambers, FTX’s Sam Bankman-Fried, ex-Bridgewater Associate Andy Constan, Kai Volatility’s Cem Karsan, The Ambrus Group’s Kris Sidial, among many others.

Disclaimer

In no way should the materials herein be construed as advice. Derivatives carry a substantial risk of loss. All content is for informational purposes only.