Categories
Commentary

Daily Brief For September 16, 2022

The daily brief is a free glimpse into the prevailing fundamental and technical drivers of U.S. equity market products. Join the 900+ that read this report daily, below!

Graphic updated 6:50 AM ET. Sentiment Risk-Off if expected /ES open is below the prior day’s range. /ES levels are derived from the profile graphic at the bottom of the following section. Levels may have changed since initially quoted; click here for the latest levels. SqueezeMetrics Dark Pool Index (DIX) and Gamma (GEX) calculations are based on where the prior day’s reading falls with respect to the MAX and MIN of all occurrences available. A higher DIX is bullish. At the same time, the lower the GEX, the more (expected) volatility. Learn the implications of volatility, direction, and moneyness. Breadth reflects a reading of the prior day’s NYSE Advance/Decline indicator. VIX reflects a current reading of the CBOE Volatility Index (INDEX: VIX) from 0-100.

Administrative

A longer note so stick with me!

Updates are pending for the above dashboard. Exciting! Beyond this, the newsletter is getting a revamp in other parts. If you have any feedback on what should be changed, please comment!

Also, I am going to refer everyone to a conversation between Joseph Wang and Andy Constan, as well as some updates Cem Karsan of Kai Volatility made (HERE and HERE). That is, in part, a primer for what we will be talking more about, soon.

Fundamental

Talked about yesterday was the prospects of contractionary monetary policy reducing inflation and growth. BlackRock Inc (NYSE: BLK) strategists, even, put forth that a “deep recession” is needed to stem inflation. In short, “there is no way around this,” they claim.

Graphic: Retrieved from The Market Ear. FedEx Corporation (NYSE: FDX) sold 20% on warning about the global economy.

From thereon, we talked about how rates rising would “bring private sector credit growth down,” as well as “private sector spending and, hence, the economy.”

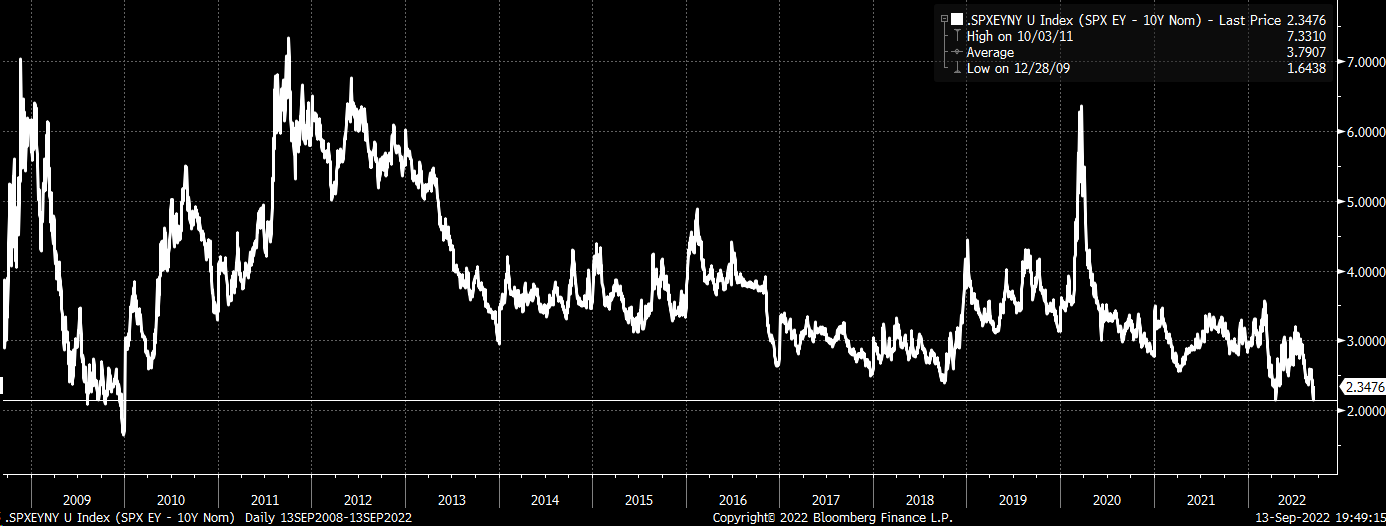
Based on where rates are at, the market may still be too expensive.

Graphic: Retrieved from Bloomberg via Michael J. Kramer. “What is amazing is how expensive this market is relative to rates. The spread between the S&P 500 Earnings yield and the 10-Yr nominal rate is at multi-year lows.”

On the other hand, some argue inflation peaks are in. ARK Invest’s Cathie Wood suggests “deflation [is] in the pipeline, heading for the PPI, CPI, PCE Deflator.” 

Tesla Inc’s (NASDAQ: TSLA) Elon Musk added that he thinks the Federal Reserve (Fed) may make a mistake noting “a major Fed rate hike risks deflation.” Musk suggested the Fed should drop 0.25%, basing his decision on non-lagging indicators, unlike the Fed.

That’s not in line with what CME Group Inc’s (NASDAQ: CME) FedWatch tool shows. Through this tool we see traders pricing an 80% chance of a 0.50-0.75% hike, all the while quantitative tightening (reducing Fed Treasuries and mortgage-backed securities holdings) accelerated on September 15. 

UST and MBS will roll off (which could turn into “outright sales”) at a pace of $95 billion per month, now, increasing competition for funding among commercial banks, and bolstering borrowing costs, as explained, below.

Graphic: Via Physik Invest. Data compiled by @jkonopas623. Fed Balance Sheet data, here. Treasury General Account Data, here. Reverse Repo data, here. NL = BS – TGA – RRP.

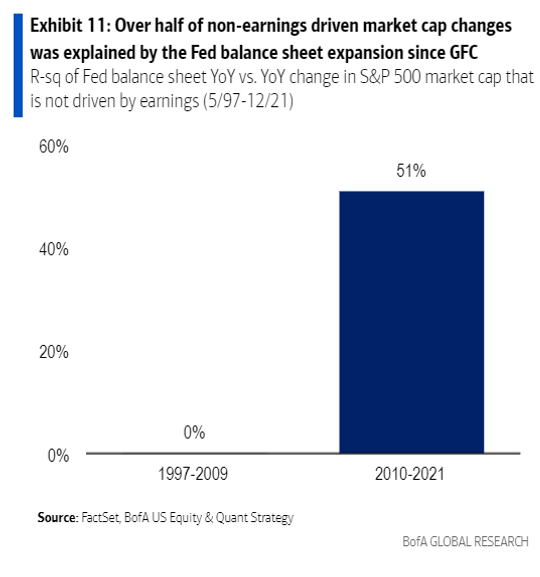
According to Bank of America Corporation (NYSE: BAC), since 2010, nearly 50% of the moves in market price-to-earnings multiples were explained by quantitative easing (QE), the inverse of QT, through which the Fed (or central banks, in general) creates credit used to buy securities in open markets, MarketWatch explains.

Graphic: Retrieved from the Federal Reserve Bank of Richmond. “The Fed Is Shrinking Its Balance Sheet. What Does That Mean?”

The “purchases of long-dated bonds are intended to drive down yields, which is seen enhancing appetite for risk assets as investors look elsewhere for higher returns. QE creates new reserves on bank balance sheets. The added cushion gives banks, which must hold reserves in line with regulations, more room to lend or to finance trading activity by hedge funds and other financial market participants, further enhancing market liquidity.”

Graphic: Retrieved from Bank of America Corporation (NYSE: BAC) via MarketWatch.

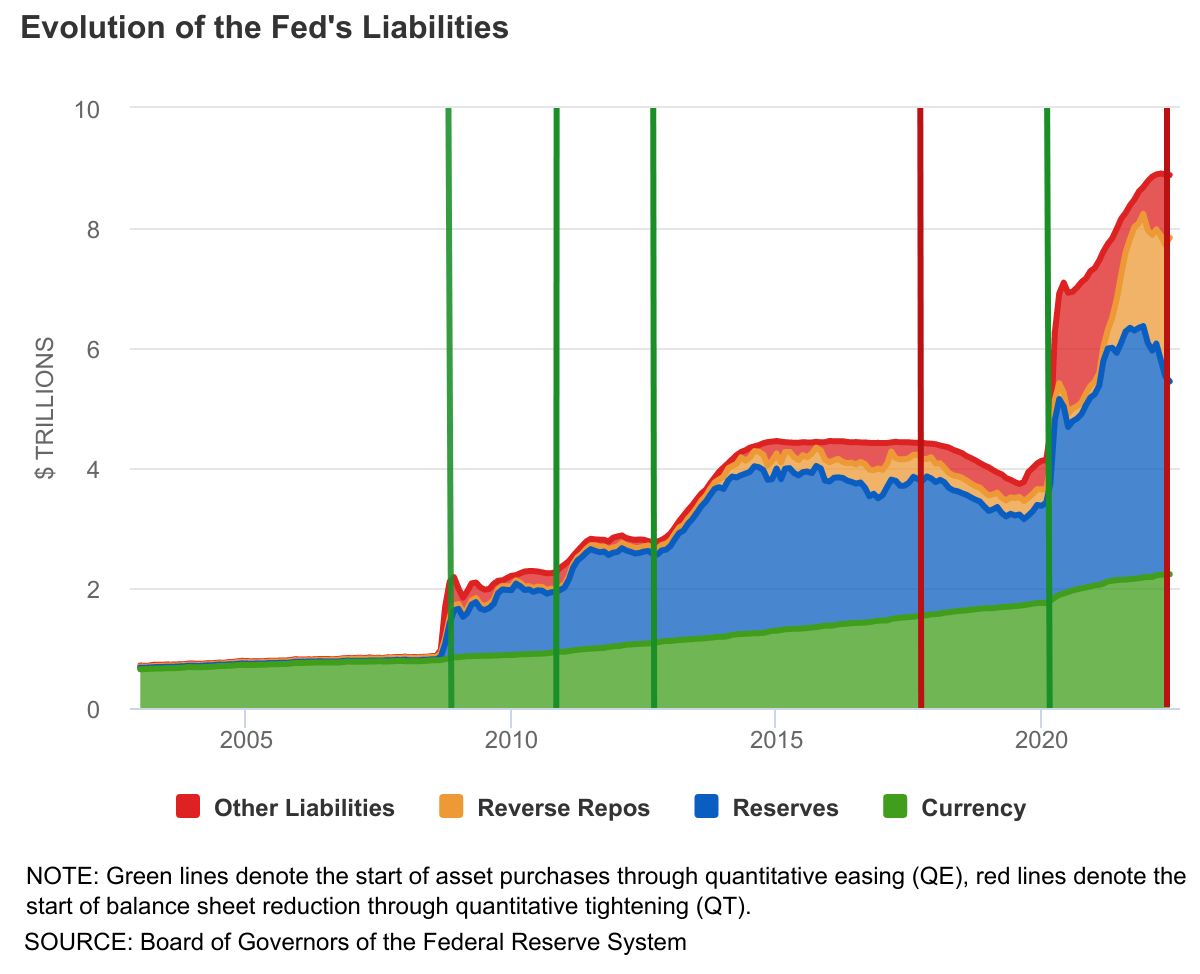
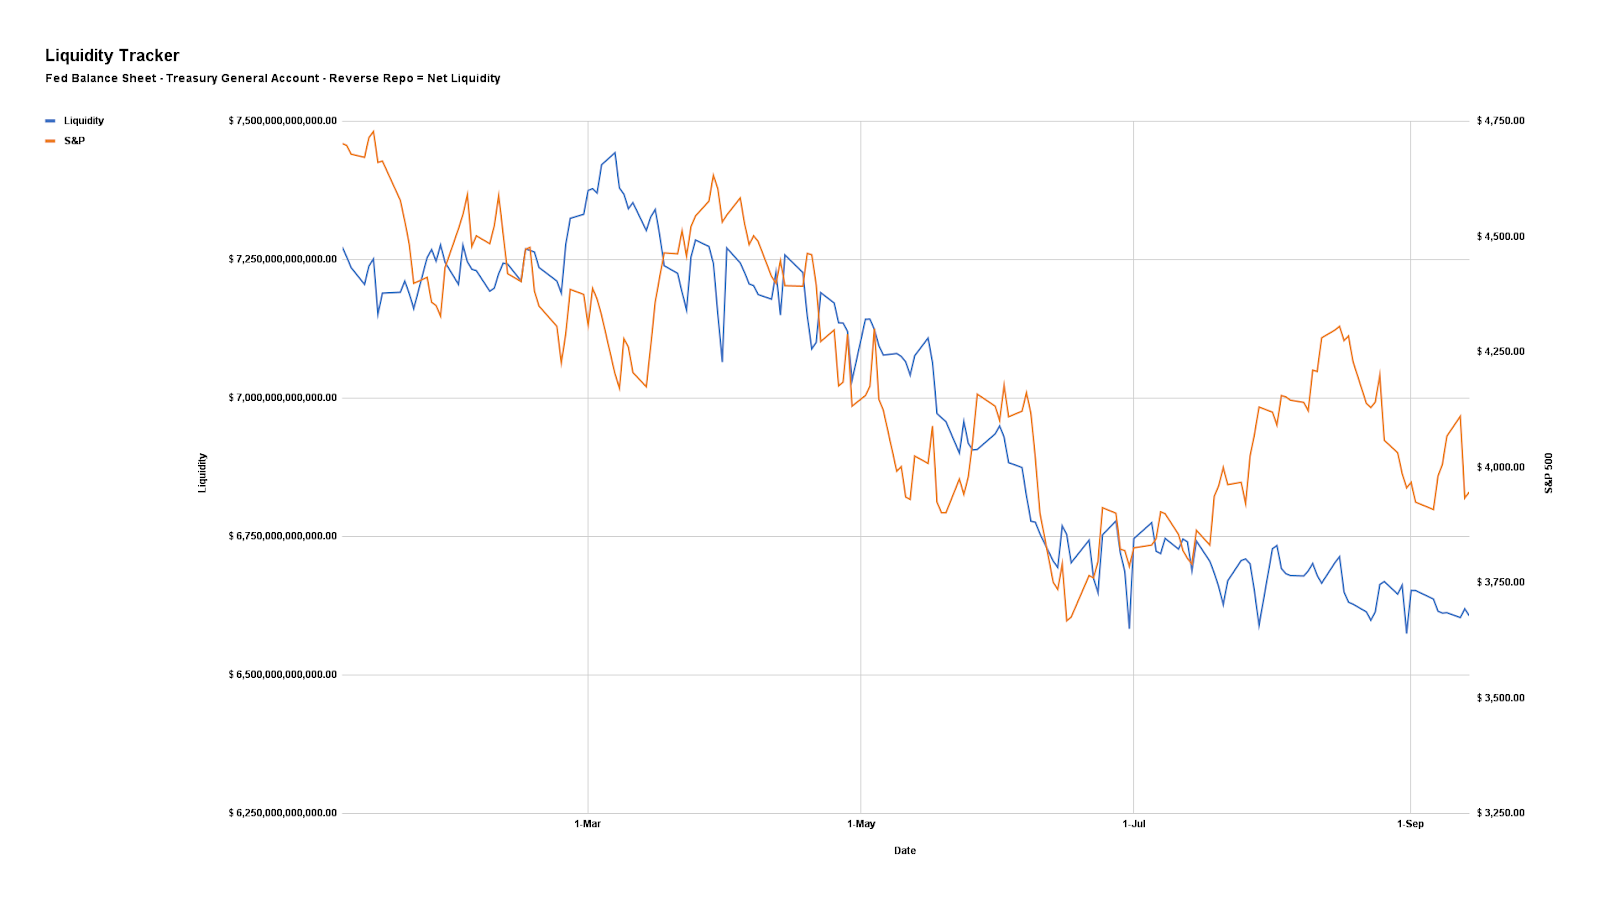
The liability side of the Fed’s balance sheet is what “matters to financial markets.” 

Thus far, “reductions in Fed liabilities have been concentrated in the Treasury General Account, or TGA, which effectively serves as the government’s checking account” to run the day-to-day business.

Given that we’re talking about balance sheets, here, Fed liabilities must match assets. Thus, a rise in the TGA must be accompanied by a decline in bank reserves (which are liabilities to the Fed). This, as a result, decreases the room banks have to “lend or to finance trading activity by hedge funds and other financial market participants, [which] further [cuts into] market liquidity.”

With the Treasury set to increase debt issuance, boosting TGA, it will effectively take “money out of the economy and put[] it into the government’s checking account.” The linked reduction in bank deposits and reserves bolsters “repurchase agreement rates and borrowing benchmarks linked to them, like the Secured Overnight Financing Rate,” per Bloomberg.

Graphic: Retrieved from the Federal Reserve Bank of New York. “The Secured Overnight Financing Rate (SOFR) is a broad measure of the cost of borrowing cash overnight collateralized by Treasury securities.”

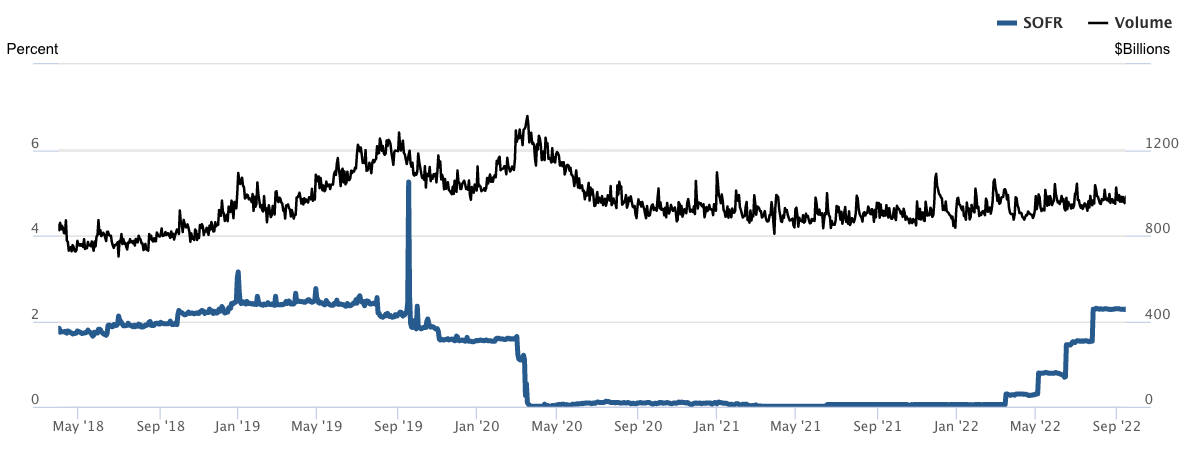
Adding, this may play into “an additional tightening of overall financial conditions, in addition to the increase in the main fed funds rate target that the central bank intends to continue boosting.”

This will “put more pressure on the private sector to absorb those Treasurys, which means less money to put into other assets” that may be riskier, like equities, said Aidan Garrib, the head of global macro strategy and research at Montreal-based PGM Global.

Positioning

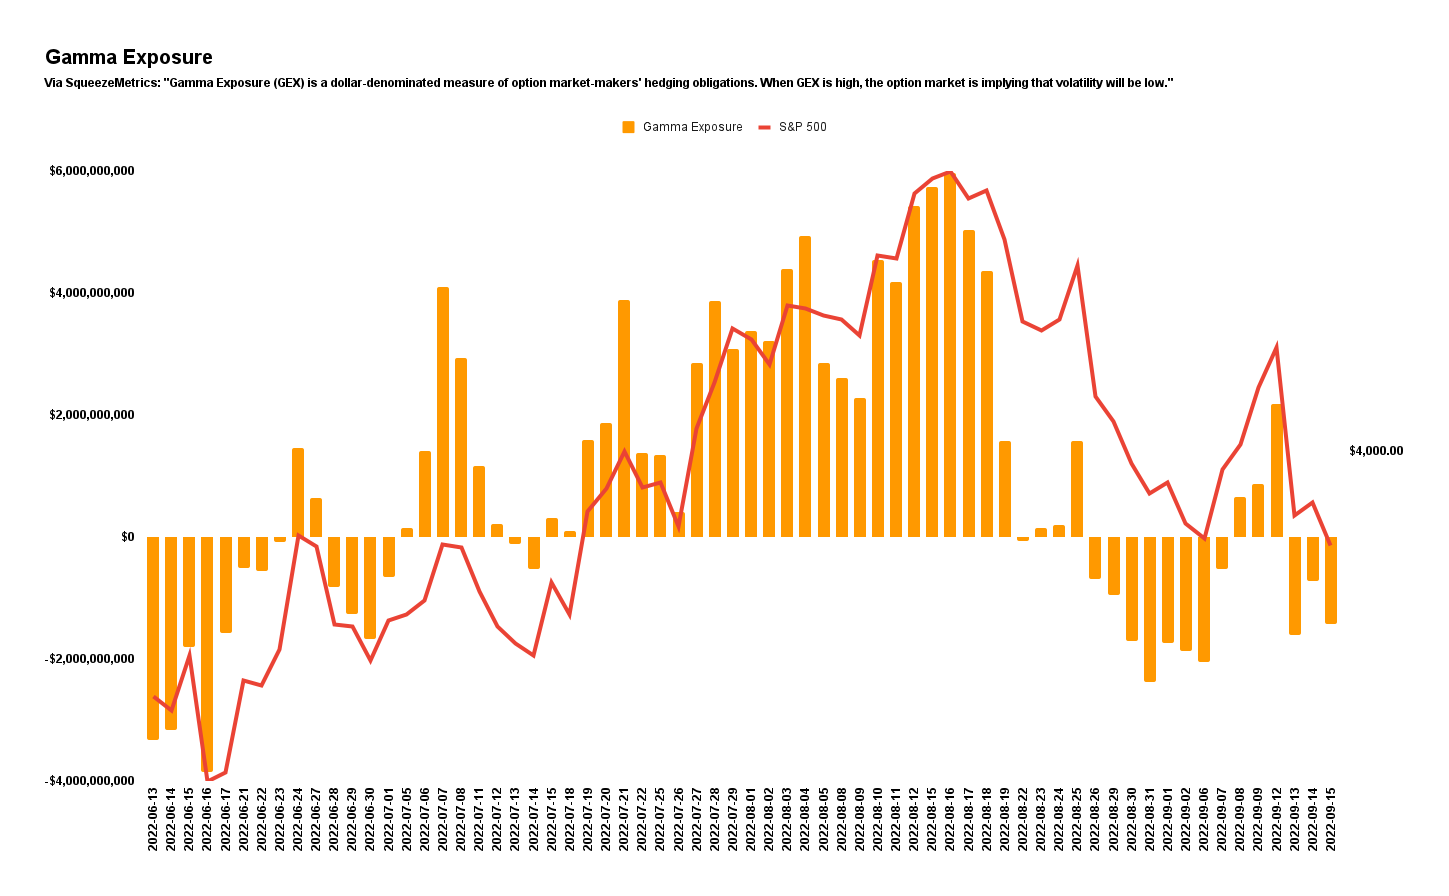
As of 6:50 AM ET, Friday’s expected volatility, via the Cboe Volatility Index (INDEX: VIX), sits at ~1.44%. Net gamma exposures decreasing may promote generally more expansive ranges.

Graphic: Via Physik Invest. Data retrieved from SqueezeMetrics.

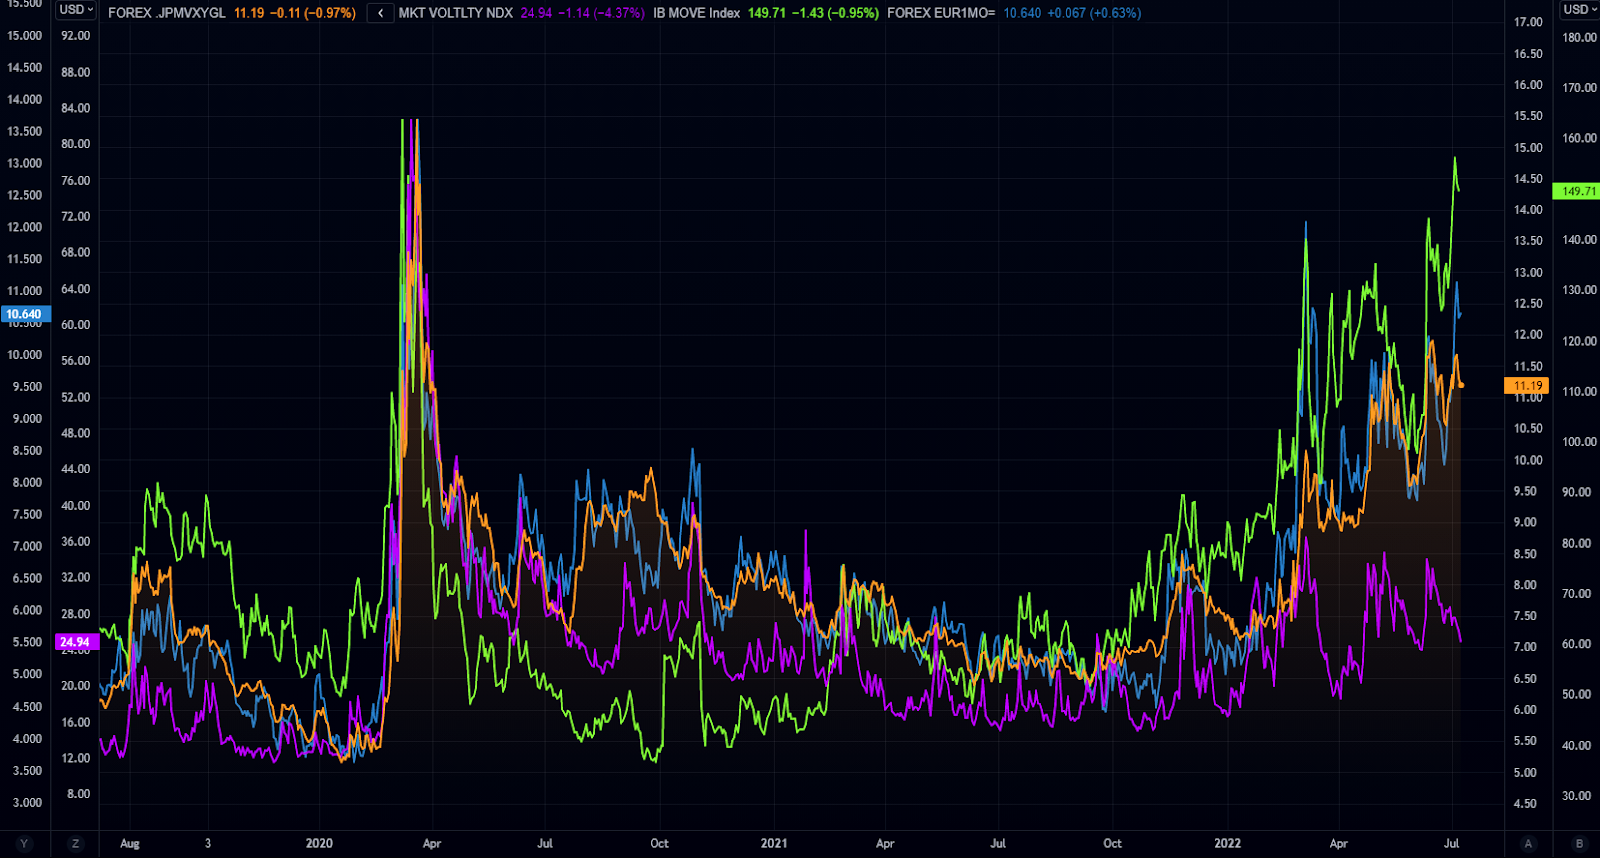
Given where realized (RVOL) and implied (IVOL) volatility measures are, as well as skew, it is beneficial to be a buyer of options structures.

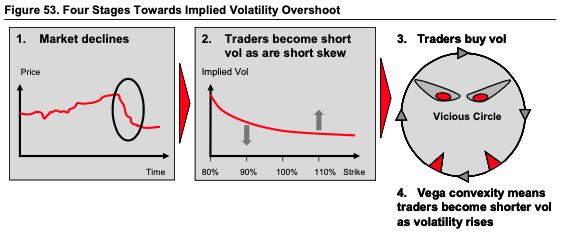
This is as there’s been a lot of speculation, particularly on the downside (put options), setting the stage for a more volatile and fragile market environment, says Kai Volatility’s Cem Karsan.

“On the index level, people are not well hedged,” a departure from what the case was heading into and through much of 2022. It’s the case that heading into 2022, traders were well hedged. Into and through the decline, traders’ monetization of existing hedges, as well as counterparty reactions, “compressed volatility” realized across US equities, as explained on July 15, 2022.

This made for some attractive trade opportunities seen here.

Graphic: Retrieved from The Market Ear. “VIX has decoupled from cross-asset volatilities.”

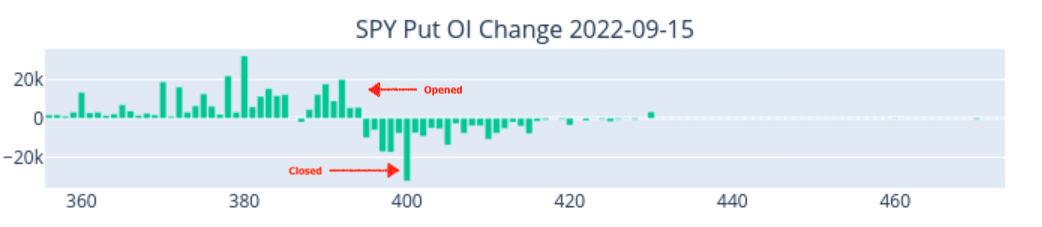
Now, given that the go-to trade is to sell stock and puts, short interest has grown, as have other risks, associated with this activity; essentially people are “los[ing] faith in convexity and risk premia’s ability to work,” as a result of “poor performance of vol,” and, the reaction to their “pain and financial loss,” is setting the stage for tail risks heading into the Q1 and Q2 2023.

The sale (purchase) of the front (back) expirations will bolster market pinning; as SpotGamma puts forth, “the positive impact of put closers and rolls, as well as decay,” is easing the market drop. However, this “positioning likely compounds drops and adds to volatility,” in the future.

To quote: “Though the removal of put-heavy exposures can boost markets higher, too add, the positive impacts are dulled via the demand for put exposures at much lower prices.”

Graphic: Retrieved from SpotGamma.

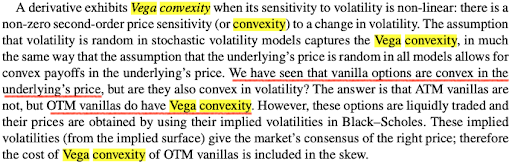
These particular options, which are at much lower prices, “are far more sensitive to changes in direction and IVOL,” as I explained in a SpotGamma note. These options can go “from having very little Delta (exposure to direction) to a lot more Delta on the move lower,” quickly.

Graphic: Via Mohamed Bouzoubaa et al’s Exotic Options and Hybrids.

“If we maintain that liquidity providers are short those puts, a positive Delta trade, then those liquidity providers [will sell] futures and stock, a negative Delta trade to stay hedged.”

Graphic: Via Banco Santander SA (NYSE: SAN) research.

Technical

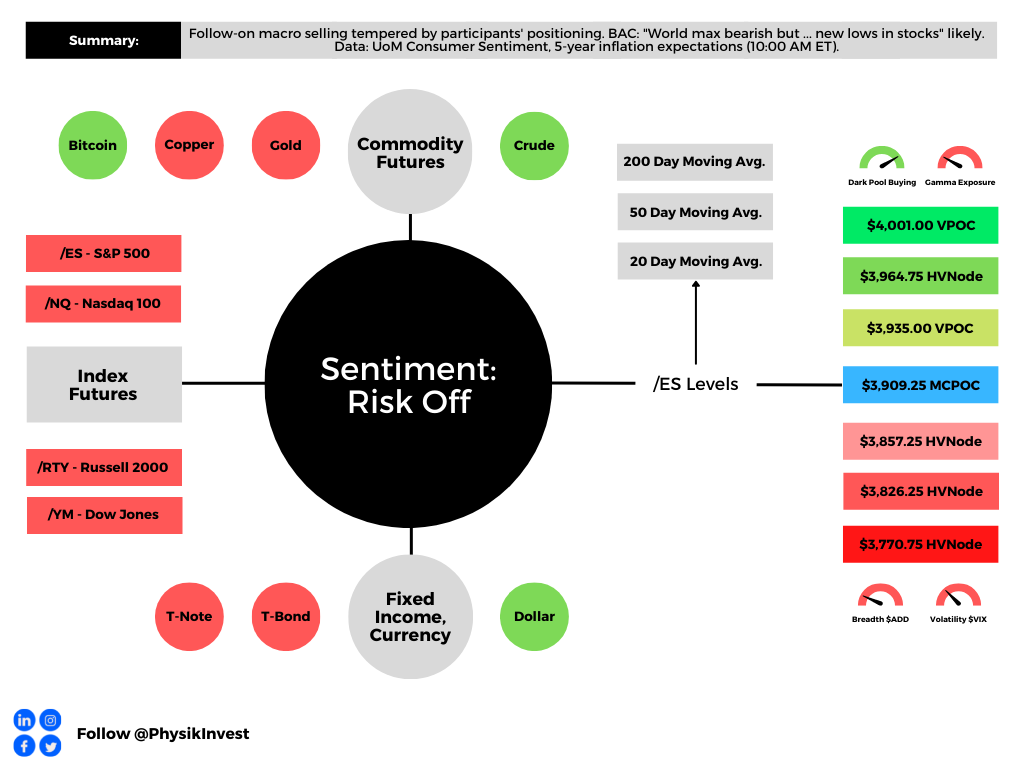
As of 6:50 AM ET, Friday’s regular session (9:30 AM – 4:00 PM ET), in the S&P 500, is likely to open in the lower part of a negatively skewed overnight inventory, outside of prior-range and -value, suggesting a potential for immediate directional opportunity.

In the best case, the S&P 500 trades higher.

Any activity above the $3,909.25 MCPOC puts into play the $3,935.00 VPOC. Initiative trade beyond the latter could reach as high as the $3,964.75 HVNode and $4,001.00 VPOC, or higher.

In the worst case, the S&P 500 trades lower.

Any activity below the $3,909.25 MCPOC puts into play the $3,857.25 HVNode. Initiative trade beyond the latter could reach as low as the $3,826.25 and $3,770.75 HVNodes, or lower.

Click here to load today’s key levels into the web-based TradingView charting platform. Note that all levels are derived using the 65-minute timeframe. New links are produced, daily.
Graphic: 65-minute profile chart of the Micro E-mini S&P 500 Futures.

Considerations: A feature of this 2022 down market was responsiveness near key-technical areas (that are discernable visually on a chart). This suggested to us that technically-driven traders with shorter time horizons were very active. 

Such traders often lack the wherewithal to defend retests and, additionally, the type of trade may be indicative of the other time frame participants waiting for more information to initiate trades.

That’s changing. The key levels, quoted above, are snapping far easier and are not as well respected. That means other time frame participants with wherewithal are initiating trades. 

Those are the participants you should not fade.

Definitions

Volume Areas: A structurally sound market will build on areas of high volume (HVNodes). Should the market trend for long periods of time, it will lack sound structure, identified as low volume areas (LVNodes). LVNodes denote directional conviction and ought to offer support on any test. 

If participants were to auction and find acceptance into areas of prior low volume (LVNodes), then future discovery ought to be volatile and quick as participants look to HVNodes for favorable entry or exit.

POCs: POCs are valuable as they denote areas where two-sided trade was most prevalent in a prior day session. Participants will respond to future tests of value as they offer favorable entry and exit.

MCPOCs: POCs are valuable as they denote areas where two-sided trade was most prevalent over numerous day sessions. Participants will respond to future tests of value as they offer favorable entry and exit.

Gamma: Gamma is the sensitivity of an option to changes in the underlying price. Dealers that take the other side of options trades hedge their exposure to risk by buying and selling the underlying. When dealers are short-gamma, they hedge by buying into strength and selling into weakness. When dealers are long-gamma, they hedge by selling into strength and buying into weakness. The former exacerbates volatility. The latter calms volatility.

About

After years of self-education, strategy development, mentorship, and trial-and-error, Renato Leonard Capelj began trading full-time and founded Physik Invest to detail his methods, research, and performance in the markets.

Capelj also develops insights around impactful options market dynamics at SpotGamma and is a Benzinga reporter.

Some of his works include conversations with ARK Invest’s Catherine Wood, investors Kevin O’Leary and John Chambers, FTX’s Sam Bankman-Fried, ex-Bridgewater Associate Andy Constan, Kai Volatility’s Cem Karsan, The Ambrus Group’s Kris Sidial, among many others.

Disclaimer

In no way should the materials herein be construed as advice. Derivatives carry a substantial risk of loss. All content is for informational purposes only.

Categories
Commentary

Market Commentary For The Week Ahead: ‘Hello, Goodbye’

Key Takeaways:

What Happened: Coming into the extended holiday weekend, on tapering volumes, U.S. index futures balanced for four regular trading sessions (9:30 AM – 4:00 PM ET), before breaking out.

Pictured: Profile overlays on a 15-minute candlestick chart of the Micro E-mini S&P 500 Futures

What To Expect: Thursday’s session found initiative buying surface above the $3,731.00 high-volume node (HVNode), the market’s most recent perception of value.

Given four-sessions worth of unchanged value, and the failure to fill the gap beneath a weak low (i.e., a visual level that attracts the business of short-term, technically-driven market participants) at $3,714.50, participants will come into Monday’s session knowing the following:

  1. Amid Thursday’s late-day buying, price diverged from value.
  2. The overnight rally high at $3,747.75 was recovered (i.e., based on historical trade, there were low odds that the overnight all-time high would end the upside discovery process).
  3. The multi-month upside breakout targeting S&P 500 prices as high as $4,000.00 remains intact.

In light of the above dynamics, the following frameworks apply for next week’s trade.

In the best case, the S&P 500 remains above its $3,731.00 HVNode. Expectations thereafter include continued balance, or a response followed by initiative buying to take out the price extension at $3,756.75.

In the worst case, the S&P 500 initiates below its $3,731.00 HVNode. Expectations thereafter include a test of the weak, minimal excess low at $3,714.50, and subsequent follow-through as low as the $3,691.00 break-point. 

Noting: Excess forms after an auction has traveled too far in a particular direction and portends a sustained reversal. Absence of excess, in the case of a low, suggests minimal conviction; participants will cover (i.e., back off the low) and weaken the market, before following through.

Two go, no-go levels exist; trade that finds increased involvement above $3,752.75 and below $3,714.50 would suggest a change in conviction. Anything in-between favors responsive trade.

Conclusion: From an uneven recovery, stimulus, elections, trade, and the like, it helps to boil it down to what actually matters: price and value. 

Though risks remain, markets are pricing in the odds of a continued rebound. All broad-market indices are in an uptrend. A break below $3,600.00 in the S&P 500 would denote a substantial change in tone.

Pictured: Retest of the upside breakpoint on a weekly candlestick chart of the cash S&P 500 Index

Levels Of Interest: $3,752.75 rally-high, $3,714.50 weak low, $3,731.00 HVNode, $3,756.75 price extension, $3,691.00 break-point.

Bonus: Here is a look at some of the opportunities unfolding.

Photo by Max Walter from Pexels.

Categories
Commentary

Market Commentary For The Week Ahead: ‘All In At The Top’

Key Takeaways:

  • Analysts extended 2021 S&P 500 targets.
  • Fear and greed are tugging at each other. 
  • Jefferies ups 2021 GDP forecast to 5.25%.
  • Net equity buying the largest in months.
  • Inflation is rising where you don’t want it.
  • Positioning suggests elevation of volatility.
  • The big picture breakouts remain intact.

What Happened: Coming into the extended holiday weekend, on tapering volumes, U.S. index futures balanced within prior range. 

This activity occurred in the context of a larger balance-area forming just beyond the $3,600.00 multi-month break-out point. Given the lack of range expansion, in addition to the aforementioned responsive, back-and-forth trade, participants are signaling a lack of conviction.

Though there is a lot of noise in the markets — an uneven recovery, stimulus, elections, trade, and the like — one key point remains: the multi-month upside breakout targeting S&P 500 prices as high as $4,000.00 remains intact. Add to this the recovery of Monday’s liquidation fueled by weak-handed, short-term buyers, and the fact that the all-time $3,724.25 rally-high was established in an overnight session, it is highly likely that the upside discovery process has yet to end.

Note: Historically, there is a low probability that overnight all-time highs end the upside discovery process. 

Pictured: Profile overlays on a 30-minute candlestick chart of the Micro E-mini S&P 500 Futures

What To Expect: Friday’s session found responsive selling surface near the $3,691.00 profile level. Given that participants had difficulty in sustaining higher prices, alongside shortened holiday trade, the following frameworks apply for next week’s trade.

In the best case, the S&P 500 remains above its $3,667.75 HVNode, and continues to balance. As stated earlier, given the tapering volume and holiday, the odds of directional resolve are quite low. 

Two go, no-go levels exist; trade that finds increased involvement above $3,691.00 and below $3,667.75 would suggest a change in conviction. Anything in-between favors responsive trade.

Conclusion: Bank of America Corp’s (NYSE: BAC) Michael Hartnett summarized it best: “[T]he year of the virus, the lockdown, a crash, a recession, an epic policy panic, the greatest stock market rally of all-time, a V-shape economic recovery, and ending with a vaccine for COVID-19.”

Though risks remain, markets are pricing in the odds of a continued rebound. Unless some exogenous event were to transpire, technically speaking, all broad-market indices are in an uptrend. A move below $3,600.00 in the S&P 500 would denote a change in tone, increasing the likelihood of a failed breakout that would target prices as low as $3,200.00.

Pictured: Retest of the upside breakpoint on a daily candlestick chart of the cash S&P 500 Index

Levels Of Interest: The $3,691.00 boundary and $3,667.75 HVNode.

Bonus: Here is a look at some of the opportunities unfolding.

Photo by Raka Miftah from Pexels.

Categories
Commentary

Market Commentary For 12/23/2020

What Happened: After a day of balance, and a brief overnight liquidation alongside news that President Donald Trump would not sign a coronavirus relief bill until the size of stimulus checks is increased, U.S. index futures rebounded, with the S&P 500 returning to the $3,691.00 ledge, a level that’s repeatedly attracted responsive sellers.

What Does It Mean: During Tuesday’s session, participants accepted the prior day’s recovery, evidenced by the two-sided trade at prices where the most activity occurred during the prior day, or point of control (POC).

Given that participants deem the high end of Monday’s range fair to do business in, participants will come into Wednesday’s session knowing that the $3,691.00 high-volume ledge is a key upside reference. The aforementioned ledge denotes a pause in discovery, likely attributable to the declining participation ahead of the holiday weekend.

That said, below the ledge, responsive buyers continue to resurface at the $3,667.75 high-volume node (HVNode) on long liquidations (i.e., those events that are caused by overly committed short-term participants that trim positions in panic because they lack the wherewithal or conviction to follow-through).

Pictured: Visual of /MES $3,691.00 ledge.

What To Expect: In light of the overnight recovery and trade near the $3,691.00 ledge, the following frameworks apply for today’s trade.

In the best case, buyers hold the the index above its $3,667.75 HVNode. Holding said reference would be indicative of continued balance after Monday’s recovery; in such case, participants would look for signs of follow-through above the $3,691.00 ledge. Once the ledge cracks (i.e., participants initiate and accept, spend more than 15-minutes above the level), it ought to (1) offer support and (2) draw in buyers to continue the upside discovery process up to, at least, the $3,700.00 and $3,707.75 HVNodes.

Anything higher targets the $3,724.25 overnight rally high.

Levels Of Interest: The $3,691.00 ledge, $3,667.75, $3,700.00 and $3,707.75 HVNodes, as well as the $3,724.25 overnight high.

Bonus: Big-picture breakout remains intact. See below for opportunities unfolding.

Pictured: Daily candlestick chart of the cash S&P 500 Index
Categories
Commentary

‘Rising Tide Lifts All Boats’: Market Commentary For The Week Ahead

Key Takeaways:

What Happened: U.S. index futures auctioned to new all-time highs before weakening into Friday’s derivative expiry.

What Does It Mean: After participants established a rally-high in the December 9 overnight session, the S&P 500 liquidated down to the balance-area boundary near $3,625.00.

After the December 14 gap open on COVID-19 coronavirus vaccine and stimulus progress, for the remainder of the week, indices negated prior selling, establishing a new all-time high. Friday’s trade managed to repair some structural deficiencies left in the aforementioned advance.

Pictured: Profile overlays on a 65-minute candlestick chart of the Micro E-mini S&P 500 Futures

What To Expect: Friday’s session found responsive buyers surface at the low-volume node (LVNode) near $3,680.00. Low-volume areas denote directional conviction and ought to resist future auction rotations. Auctioning through the LVNode would foreshadow further rotation and trade as low as the balance-area low.

Given that the higher-time frame breakout remains intact and selling appears non-committal, participants will come into Monday’s session knowing the following:

  1. Both sentiment and positioning are historically stretched, while the recovery remains uneven
  2. Inflation remains cool due to the profound influence of disruptive innovation.
  3. U.S. Congress reaches deal on COVID-19 aid package, plans votes for Monday. 
  4. The decline in realized correlation due to factor and sector rotation, as well as the return of systematic option selling strategies will push the long-gamma narrative in which volatility is suppressed and the market pins or slowly rises in a range-bound fashion.
  5. The S&P 500’s higher-time frame breakout remains intact (see chart below); JPMorgan Chase & Co. (NYSE: JPM) confirms equities will rally short-term with the S&P 500 auctioning as high as $4,000.
  6. Despite high CAPE ratios, stock-market valuations aren’t that absurd.

Therefore, the following frameworks for next week’s trade apply.

In the best case, buyers maintain conviction and hold the index above the $3,680.00 LVNode. Auctioning below said reference denotes a change in conviction. Participants would then look for a response near the $3,667.75 HVNode. Failure to remain above the HVNode would portend rotation, further balancing. 

In the worst case, participants initiate below the $3,625.00 balance-area low, jeopardizing the higher-time frame breakout.

Conclusion: As BlackRock Inc (NYSE: BLK) said, “a rising tide lifts all boats”; though financial markets have largely priced in positive news surrounding vaccines and stimulus, the rally remains intact, bolstered by a drive for yield — technical factors as a result of systemic and hedge fund strategies, among other things.

Pictured: Retest of the upside breakpoint on a daily candlestick chart of the cash S&P 500 Index

Levels Of Interest: $3,740.75 and $3773.75 price extensions, $3,724.25 all-time rally high, the micro-composite HVNode at $3,707.75, $3,691.00, and $3,667.75, as well as the $3,680 LVNode and poor structure near the $3,625.00 balance-area low.

Bonus: Here is a look at some of the opportunities unfolding.

Photo by Fede Roveda from Pexels.