This week’s letter is about 6,000 words and may be cut off. If so, try viewing it in a browser window!
Our recent focus reflexivity manifests in politics through reinforcing shared beliefs and narratives. When political group members share an ideology, their interactions often confirm and amplify their existing views, creating feedback loops. These loops can shape the group’s perception of political realities, such as the strength of their candidate, which in turn influences voter turnout and campaign contributions. This homogeneity also leads to a lack of exposure to opposing views, increasing the risk of misreading voter sentiment and making strategic errors in political campaigns.
This dynamic was evident in the 2016 U.S. presidential election. Many in liberal circles were convinced of Hillary Clinton’s victory, relying on polling data and a widespread belief in her inevitability. This perception reinforced within these groups created a reflexive cycle that contributed to complacency and lower turnout in critical swing states. Those in the Republican bubble who supported Donald Trump also experienced their form of reflexivity; early support and momentum generated enthusiasm that ultimately led to his victory. Both sides exhibited fallibility—Democrats overestimated Clinton’s support, while Republicans underestimated the opposition to Trump.
Vuk Vukovic, the CIO and co-founder of Oraclum Capital, is acutely aware of reflexivity and fallibility’s impact on politics and economics. Over the past decade, he has applied his academic research in political economics to accurately predict the outcomes of the past two U.S. elections and the Brexit referendum, as well as influence policy in his home country of Croatia. Following the pandemic, Vuković and his co-founders sought to monetize their predictive success, leading them to the financial markets. Today, they use the wisdom of crowds and their understanding of social networks to outperform markets with their hedge fund. Vuković graciously joined Physik Invest’s Market Intelligence podcast to discuss his career, research, starting and operating a hedge fund, trading psychology, and investment processes. The video can be accessed at this link and below. An edited transcript follows.
We spoke in April, and Oraclum Capital, your upstart hedge fund, sat at ~$8.6 million in assets under management. Has this number changed?
We’re going into September with $17 million under management, so it has been going well.
I want to go back in time before you studied economics. What were some of your big interests growing up, and how did they guide your pursuit of economics in school?
My interest in economics partly stemmed from my parents, who were both involved in that field. But even as a kid, I was fascinated by currencies and stock markets. Something about them attracted me—maybe it was the whole money aspect, but I think it was more profound than that. However, as I pursued my education, I diverted from finance and instead focused on political economics, which is more theoretical and combines public choice theory with macroeconomics. You can’t fully understand economics without understanding politics. Fast forward to today, I’ve returned to my first love, finance.
The idea of making money got me engaged in markets, but the details and the process kept me engaged. So, structuring trades, learning how markets work, and things like credit and positioning kept me involved. Does this resonate?
That’s the primary motivation, and you learn things that make it more or less attractive. In our case, it was more attractive.
So you went to the London School of Economics and the University of Oxford. Why those two?
Before that, I earned my Bachelor of Economics at the University of Zagreb in Croatia. During the summers of 2009 and 2010, I went to the United States—first to attend a summer school at Berkeley and then Harvard the following year.
I considered staying in Zagreb, but after those experiences, I realized I should go abroad. I chose the United Kingdom because it was closer and less expensive than the United States, especially at the master’s level. In Europe, you typically pursue a master’s before a PhD, allowing you to finance your education gradually.
The LSE is a prestigious institution with a political economy program aligned with my interests. If I wanted to go to the United States immediately, I would have had to choose an economics PhD and then branch out from there, which is not what I wanted.
Did you get a lot of value from those summer schools?
Absolutely. They showed me that I could compete in an environment where I wasn’t sure I would be able to.
I earned straight A’s at Berkeley and Harvard. I took an Intermediate Macroeconomics course and a Contemporary Theories of Political Economy course at Berkeley. At Harvard, I studied International Monetary Economics, taught by a former assistant to Milton Friedman. I also took a course on global financial crises there, which was particularly interesting to me because the Global Financial Crisis had just started in 2008. At that time, I was in my second or third year of university, and it shaped my research focus ever since. I found my niche by exploring the financial crisis from a political economy perspective, examining the political causes of the crisis, such as why banks were allowed to take on so much risk, and so on.
You wrote a couple of papers. How did you develop your theses, and how long did it take you to research and defend them?
Most of my political economics research explicitly focuses on corruption and lobbying. When I came to Oxford, my attention was primarily on the collusion between politics and economics—essentially, the relationship between the corporate and political worlds.
It all began with a paper on corruption in Croatia, where I examined the connection between firms and people in power and how this relationship affected reelection chances. I also attempted to measure corruption through public procurements awarded to specific firms. Unfortunately, my findings showed a significant impact of corruption on the reelection chances of Croatian mayors, cities, and municipalities.
The second paper I worked on centered around bank bailouts in the United States during the 2008 crisis, which has been a focal point of my research interests. I aimed to determine whether banks better connected to congresspeople received a more favorable bailout deal relative to their assets, and indeed, they did. With these two ideas and the supporting data, I developed a more unified theory on how corporate executives and politicians connect and how those connections impact economic outcomes. In my specific case, I was looking at income distribution and inequality.
This led to my third paper at Oxford. I analyzed a massive dataset of about a million corporate executives in the United States and the United Kingdom, linking them to politicians and observing that those better connected had much higher salaries. Specifically, the impact was about $150,000 more in annual salary in the United States. To clarify, these were corporate executives—CEOs, the C-suite, or board members—being compared within the same company, with the politically connected ones earning a premium of approximately $150,000. Political connections were measured by whether the executive had previously worked with someone at a senior government level or belonged to the same organization, such as a country club, charity, or other networking group. These affiliations might not necessarily make you friends, but they provide a way to connect with critical individuals when needed.
This academic work culminated in the book I published this year, Elite Networks: The Political Economy of Inequality. It is trending well at Amazon, Barnes & Noble, and other retailers.
I remember this a couple of years ago: Amazon’s Jeff Bezos and Jerome Powell appeared at the same party or dinner. Jerome Powell was grilled over what was potentially discussed, and your response reminded me of that.
I was looking into that precisely during the Global Financial Crisis when Timothy Franz Geithner and Henry M. Paulson, Jr. held regularly scheduled meetings with the CEOs of the top eight banks. This was documented in The New Yorker and The New York Times. I was reading those transcripts, and it was clear that these people were friends. There’s also an excellent paper on social connections in a crisis, highlighting the importance of being connected—especially when you need to reach the right person to secure a bailout for your bank in times of crisis.

Did your findings in Croatia ever have an impact on policy?
Surprisingly, yes, though not as much as I had hoped.
My main finding was that there are very suspicious levels of public procurement where companies with, for example, zero employees can bid and secure huge deals from local governments. I focused solely on the local level. One potential solution to combat this issue is to introduce complete budget transparency so that the public can see every single expenditure made by the government. This would include everything from large procurement deals down to receipts for lunches, dinners, and similar expenses. You could even see who’s dining with whom and the salaries of public sector employees.
We started implementing this project in a few cities in Croatia, including Bjelovar—about five or six cities. These cities adopted the project with a message of having nothing to hide and being open and completely transparent. Incidentally, all the mayors who implemented our project significantly outperformed their opponents in subsequent elections. So, while corruption may help you get reelected, being fully transparent helps even more.
We wanted to extend this project to a broader audience of mayors, but unfortunately, the interest wasn’t there. What did happen, however, was that we were able to make this a formal part of the budget law. But now, the problem is that the bureaucracy watered it down. The law explicitly requires every local government to have full transparency, but as they say, the devil is in the details. Bureaucrats added a second layer of interpretation, defining what it means to be fully transparent, and the law’s impact has been diluted. So, I’m done fighting those battles. That’s behind me, and I’m doing something completely different now.
How did you develop the methodology used to predict elections, and how did you monetize it?
I didn’t initially think about starting a hedge fund, but I knew there was some applicability in markets.
So, my two colleagues, Dejan Vinković, a physicist, and Mile Šikić, a computer scientist, and I were in the academic sector. They were professors, and I was a lecturer at my university. We wanted to find a new way to create better, more predictive surveys. We were looking at what Nate Silver was doing in the United States, and since the three of us were all political junkies, elections were the first thing we wanted to apply these methods to. So, we started with the British elections in 2015, and it worked well. Our correct prediction of the Brexit referendum and Trump’s 2016 election further propelled us; we initially wanted to write a paper on our new prediction method, but we opted to try to build a company and monetize it instead.
Now, what’s the logic behind that? There are two components.
The first is the wisdom of crowds. You ask people what they think will happen and what everyone around them thinks will happen. Let’s say it’s an election. So, who is going to win, Trump or Harris? That’s the first question. Second, what do you think other people around you think will happen? When you get to that second question, you put people in other people’s shoes, forcing them to switch between System 1 and 2 thinking, as Daniel Kahneman and Amos Tversky describe.
The second part involves the networking aspect, the crux of our approach. We aimed to figure out who was friends with whom. For example, if you’re in a liberal or conservative bubble, you have a low ability to predict what’s going to happen outside of your bubble. So, we focused on people in more heterogeneous groups, where some friends are left-leaning, some are right-leaning, and some are centrist. This diversity increases the probability of making accurate predictions. The methodology involves playing with probabilities assigned to different individuals, and these probabilities have weights, which is how we determine the accuracy. So, not every person’s opinion matters in the same way. That’s the general idea.
Where would these surveys be accessible?
The crucial part is social media. Previously, during the elections, we did everything on Facebook. But this was before Cambridge Analytica when Facebook was very open to giving us the data we needed. We didn’t take any personal information besides what we asked for in the survey, like gender and age; we only gathered network data from Facebook. If your friends joined the survey with you, we could connect you. Now, we’re doing everything on Twitter and LinkedIn. We’re sourcing from those networks because Facebook no longer allows it following the Cambridge Analytica scandal. This is not a problem because people are typically on the same platforms. Again, we don’t need to know who these people are. All we know is who they’re connected with.
Would you have achieved the same results if you could go back and use Twitter and LinkedIn?
The data on Facebook was more versatile, and there was more of it. You could do more with a bigger pool. It wasn’t just the data itself but also the critical relationships between the data. Much of this was based on network theory in physics, akin to network science in general. My two partners, and later I, became remarkably proficient in this area. So, all we needed was good data to fit the theory and see if these things worked, and they did. With the Twitter data, I don’t think it would have been as helpful as the Facebook data, but once you learn what you need, you can apply it to any other platform that has a network.
How did you come up with the name Oraclum?
It’s a Latin word for prediction.
So, before starting the hedge fund, did you have any investing experience, and how did you learn about markets? What books did you read?
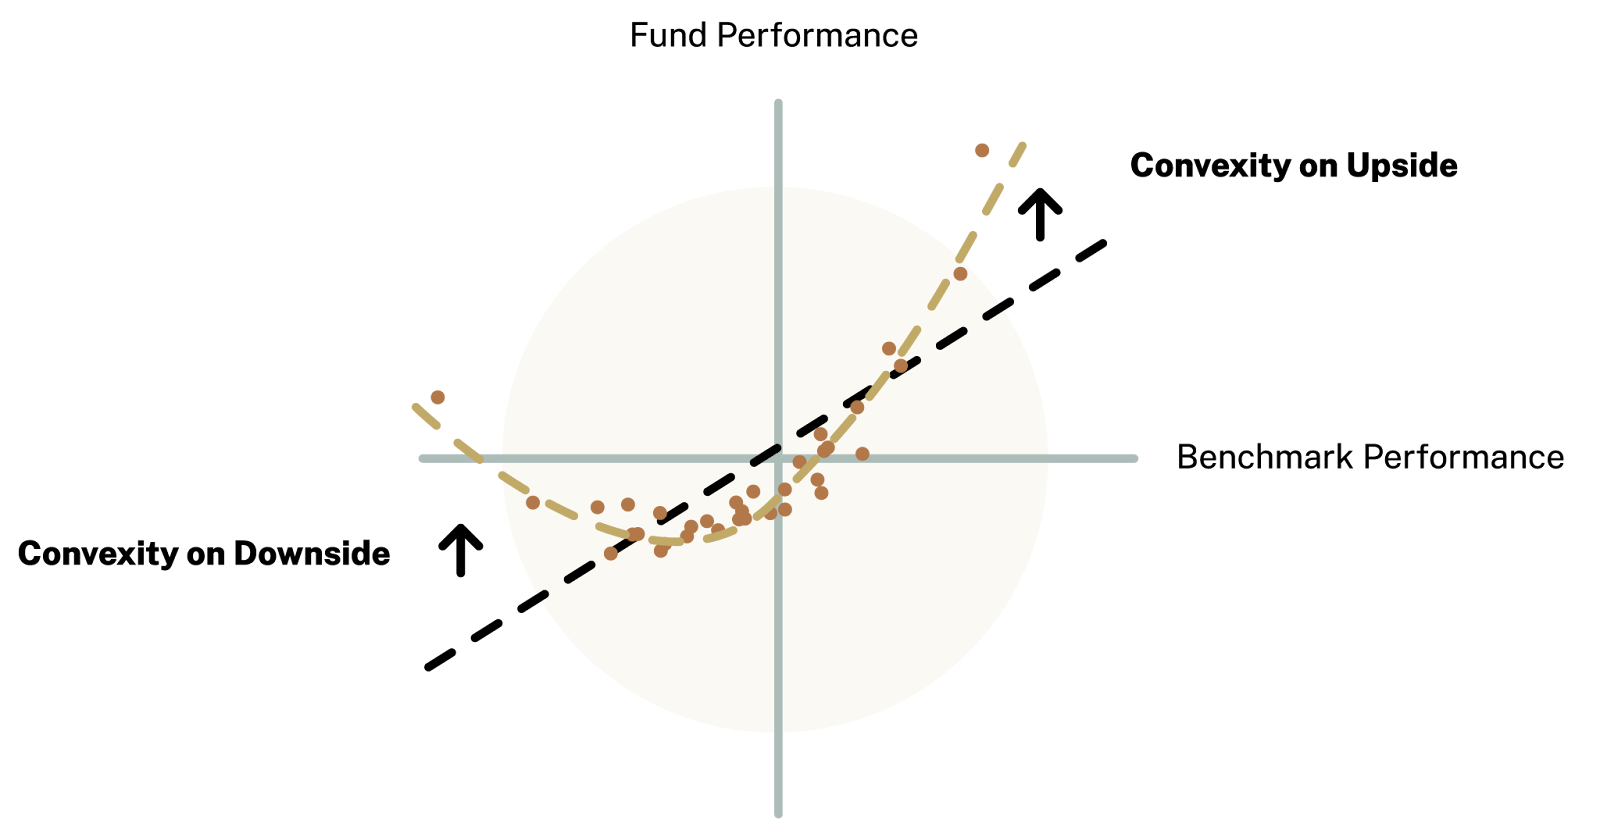
I’ve been investing on and off since 2011-2012. I began trading options in a retail capacity in 2018. Back then, trading options on Tesla was the name of the game, and I went through the whole trader experience. I love the Market Wizards book by Schwager because I went through the same processes as many of the people featured in it. You initially make a lot of money on something and think, “Oh my, this is easy, and I am so smart.” Then, you lose a lot of money on something else, and that’s when you start learning. So, I did have some experience with options. Since 2021, when I began testing Oraclum’s methodology, my options trading knowledge has improved significantly. We needed options because they provide convexity (i.e., non-linear payoffs), which is crucial when predicting with 60%-70% accuracy, which is what we achieved. So, while I did have some experience, it has grown exponentially over the past few years since I started the fund.
What did the fund structuring process look like, and what guided your decision to create a hedge fund versus an ETF, which would allow more people access?
The hedge fund versus the ETF is a matter of cost. Launching an ETF requires about $250,000 upfront, which is beyond our reach at the time. However, we aim to establish an ETF within the next few years to offer it to a broader audience. Many people who participate in our surveys are eager to invest, but with our current $100,000 cap, they can’t. The ETF would allow them to be investors, providing an even stronger incentive to participate and perform well in the surveys.
To answer your question further, we need to go back to 2016, around the time of Brexit and Trump’s election. That’s when we decided to start a company. We set up shop in the United Kingdom, specifically in Cambridge—no connection to Cambridge Analytica; we’re the good guys and don’t misuse data. Initially, we focused on market research projects on elections, market trends, and public sentiment. However, after correctly predicting the 2020 election outcome between Biden and Trump, we started attracting clients from the finance industry who were buying our election predictions. I thought, “Why not test this on the markets?”
We had some funds and could hire people to help us, so we began the project with the mindset of trying it out for a year or two. If it didn’t work, we could always return to market research. But the project quickly gained momentum. I invested about $20,000 of my own money, and over a year and a half, I grew it to $54,000. I did this transparently, posting screenshots of my trades in my newsletter. People could see my profits and losses weekly. I would even send survey participants the trades I planned to make, and this transparency resonated with them—some became investors.
Like many others, our biggest investor initially followed us on Twitter and subscribed to the newsletter. After nearly a year of testing, the final decision to start the hedge fund came around the summer of 2022. People following us said they wanted to invest more seriously, so we started the process. I remember discussing it with my wife and telling her, “You need the confidence of someone who knows nothing about something but does it anyway.” We launched the hedge fund in 2023 and learned as we went.
Before we started, I spoke with a lawyer and met with potential investors. I also surveyed newsletter subscribers to gauge interest and ask if they’d like to invest. We received around $10 million in commitments. Of course, there’s a difference between pledging money and investing it, so we only started with about $2 million when we launched the fund in February 2023.
Our hedge fund story differs from most. While others often launch with $100 million, $200 million, or even $1 billion, we’re bootstrapping our way up, starting small but with solid performance and growing trust from our investors. It’s an unconventional story, but we don’t need the typical team of analysts or a Bloomberg terminal. We have our method and trade in a very straightforward way.
What does it cost to run your type of operation?
In the first year, last year, the budget was about $100,000. It is more significant this year because I’m expanding the entire marketing scope. It’s projected to be around $400,000. However, with our profit, we’re comfortably funding the entire operation.
Was creating the fund structure cost-intensive as well?
Surprisingly, no. It was about $30,000 altogether and set up in Delaware. I found good lawyers and used all the money I earned investing myself to fund it.
What does your investment process look like from pre- to post-trade?
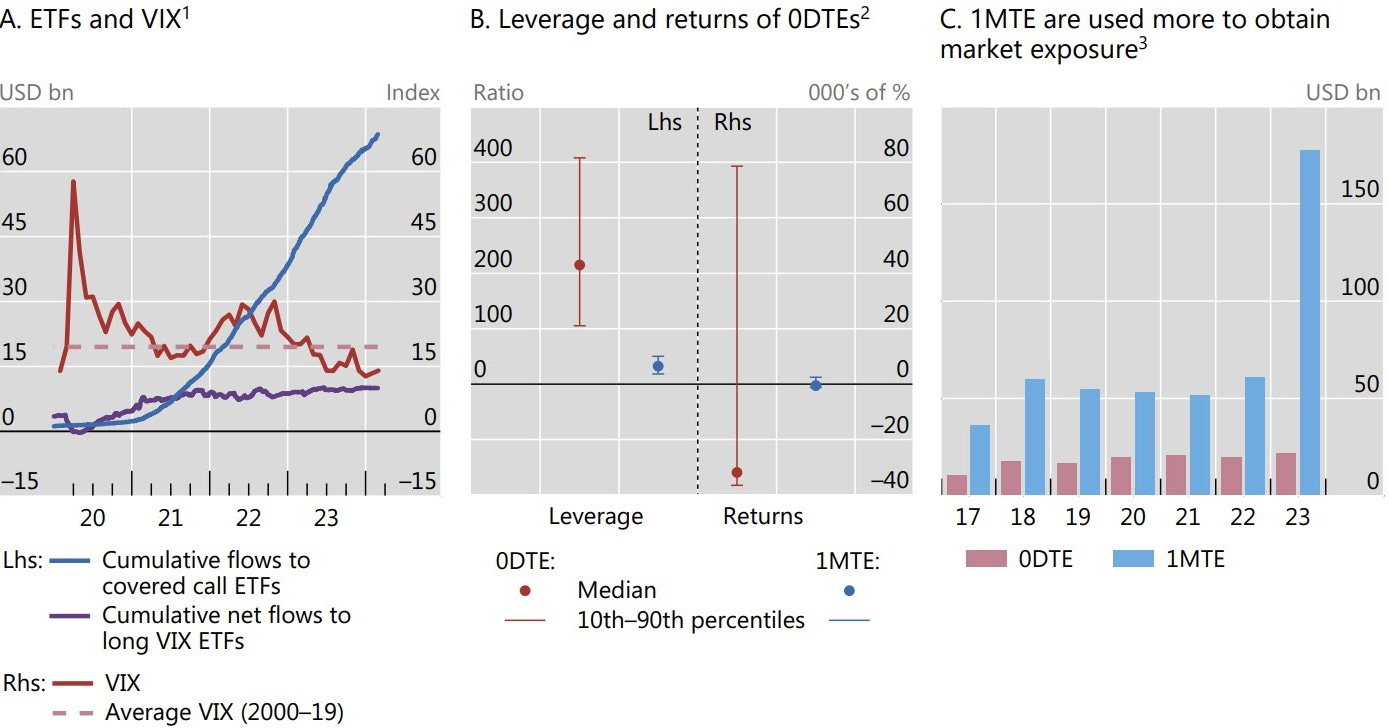
It is straightforward. We get a signal every Wednesday before the market opens. Once we get the signal, we want to determine its strength. Then, we typically open positions about an hour after the opening, at about 10:30 Eastern on Wednesdays. We will keep the position until the end of trading on Fridays. This is the optimal timing for our prediction if we were right. We only allocate about 2% of our portfolio to each trade. If we’re wrong, the options expire worthless, and we lose 2% of the premium. If we’re right, then we make multiples of that. That is in a nutshell. Now, there are things that we can do. For example, we have this trailing stop strategy; if we make 1.5%, we will increase stops and keep raising them gradually. We have been testing and have considered using 0 DTE options in the other direction to hedge our profits.
Are these options spreads that you are buying?
A vertical. We always buy spreads.
You would never try any complex or ratio-type structures, right?
No, we keep it simple. We used to, and the following is a great story about that.
The fund is performing well currently. However, right out of the gate in March of last year, we were down 15% on our first $2 million. At the start, we told our investors they would be out if we lost 20%, so it was a tricky situation.
What went wrong? Several things contributed.
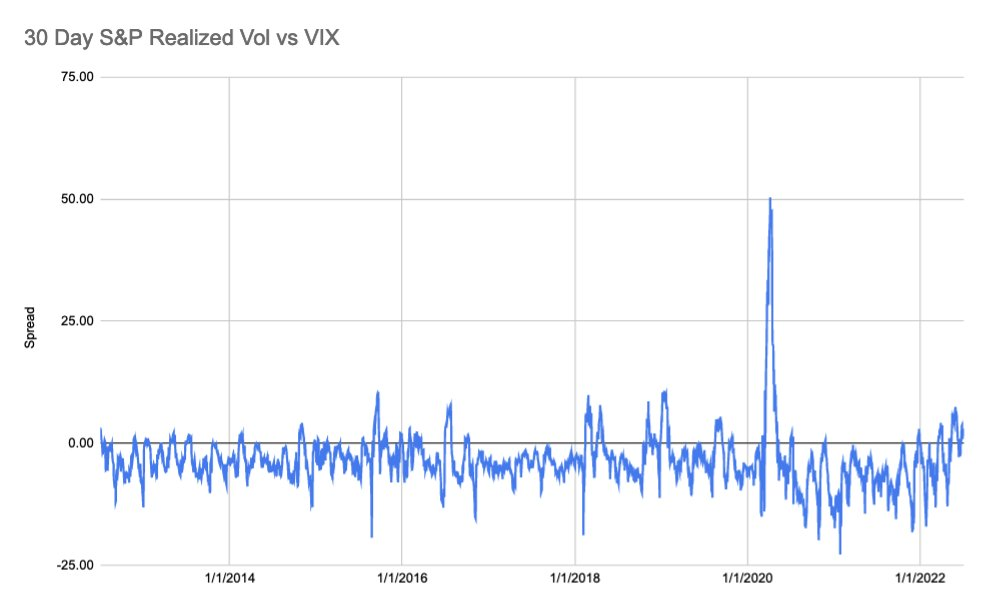
For background, I only risked 10% each week when trading alone. With about $20,000, this meant risking $2,000. A part of my strategy involved using iron condors, as our methodology works well in both direction and precision; our predictions are within 2% of the market’s actual ending about 80-85% of the time, which is quite significant. Thus, the iron condor structure worked well when trading on my own in 2021 and early 2022.
However, since the introduction of 0 DTE options, the price of the Friday options has changed dramatically, and the risk-reward ratio has shifted from 2:1 to 8:1; now, I would risk $800 to make the same $100. If I lost $800, I would need eight good weeks to compensate for one bad week. Consequently, iron condors are no longer viable. This structure, we know, significantly hurt us in the first quarter of 2023, which is why we abandoned it, along with others, focusing solely on directional options and spreads.

My first thought was how much of that was the volatility environment. So you dropped the condors, and then, did you change how you traded the verticals?
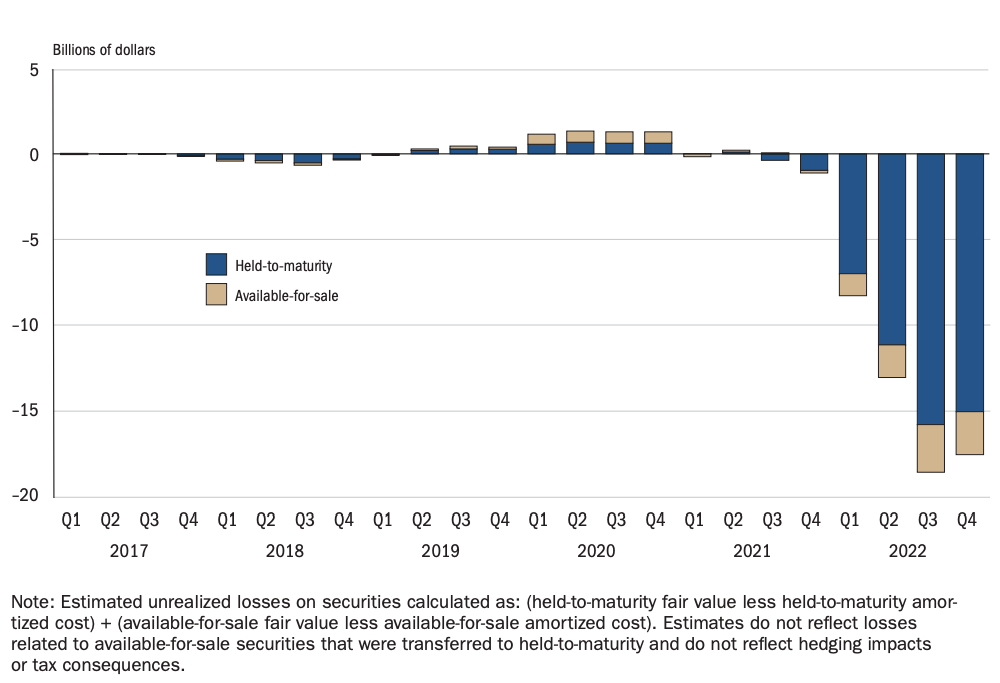
When we started the fund, we risked about 5%. When things quickly got out of hand, we lowered it; when we were down 15%, we reduced it to 1%, and it took us about five months to break even, gradually increasing our exposure. Now, we’ve found that 2% to 3%, depending on the strength of the signal, is our optimal point. So yes, it affected our position sizing. Regarding volatility in March of last year, the collapse of Silicon Valley Bank also impacted us.
Would you consider trades like the iron condor again if the volatility environment changed?
It works for us over 80% of the time, but the risk-reward ratio is no longer suitable. That’s why we don’t want to engage again. The current data shows flat or slightly above-flat results, so there’s no point in doing it.
Do changes in volatility and positioning affect how you trade the underlying market? So, at the beginning of August, we had a bunch of volatility. You probably weren’t in positions at the start of the week because it was a Monday, and you avoided that. But do those significant changes in volatility impact how you structure trades?
Not the structure.
Let’s go back to that week. On Monday, markets were down. We were mostly in bonds and cash. We ended the week up 1%, with the compression of volatility benefitting us; as volatility went down and markets went up, it was an easy trade for us in retrospect.
It would have been fantastic if we had held puts on that Monday. If we had held calls, we would have only lost the premiums. That’s why volatility doesn’t impact us negatively, no matter how big. This is because we’re not sellers of options. If we were sellers, that would be a different problem. However, since we buy options, the most we can lose is the premium. We know our risk—if we’re wrong in a week like that, we lose 2% and move on to the following week.
Also, I noticed a mismatch between bid and ask prices on that particular day. That is something to consider as well. But if I had put options and there was a huge mismatch, we would have worked them at the mid-price.
How are you executing these orders? Are these just market orders, or are you setting a limit?
Always limit orders.
Are you using one of the ETFs, or do you use cash-settled indexes like the SPX?
ETF. Not the cash.
Would going into something like the SPX be more cost-efficient if you grow large enough?
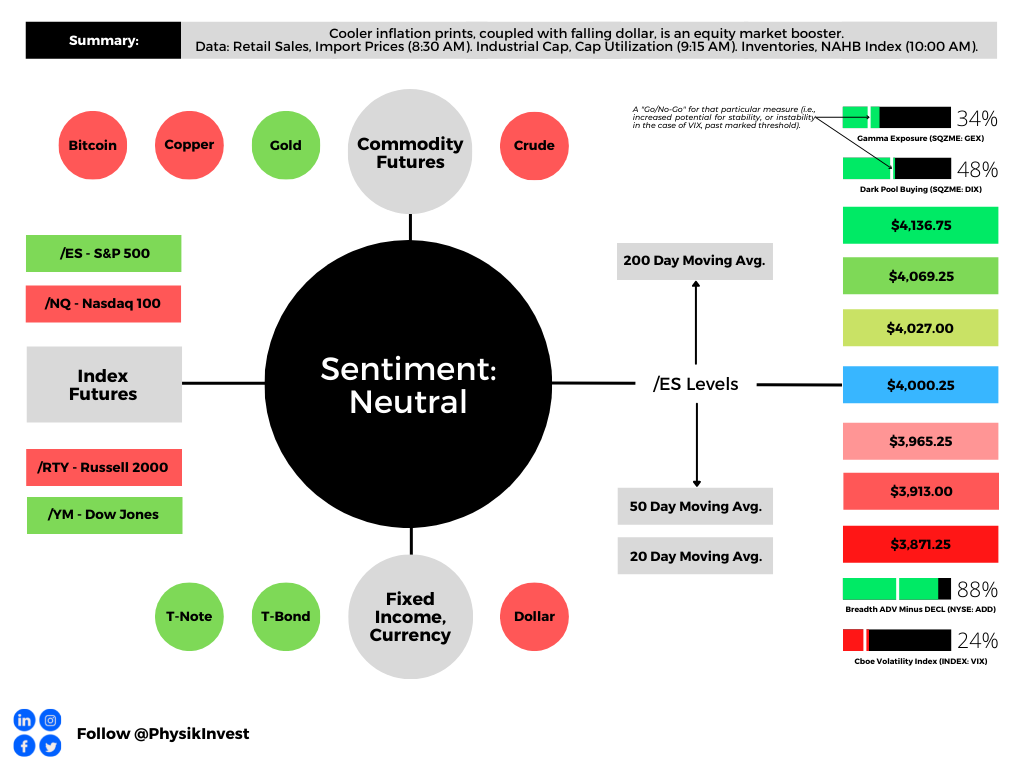
Yes, absolutely. Right now, one of our institutional investors is coming in, and they want us to employ the same strategy using options on futures like the E-mini S&P 500 (FUTURE: /ES). Looking at the data, the approach also works there.
Are you testing trades in real time or backtesting?
Backtest.
If you were to go live with either the /ES or SPX, would you do that with a smaller size initially, test it out, and see how it works on that scale?
Yes. Initially, use a smaller size and then push it up as we go along.
Right now, we’re small—a $17 million fund—so I trade a couple hundred thousand dollars worth of premium every week, which is not a lot. Once bigger, we can look to the SPX and /ES, where the liquidity pools keep increasing.
As we grow in size, it’s straightforward for us to scale.
You said you risked 2%. Is the other 98% still in Treasury Bills?
90% in T-Bills, and 8% is a cash buffer.
Because you’re always out of these spreads at the end of the week, I assume you’re pretty liquid and can quickly meet redemptions.
Yes, that’s not a problem for us.
If interest rates fell or you had a significant lull, would that change how you invest that capital?
It probably would. Right now, we’re taking advantage of the carry. There’s a straightforward carry trade—you leave cash in bonds for a year and get ~4%. It will probably be a different instrument if we return to the pre-COVID interest rate environment or even post-COVID 2021. However, I would still want to keep most of it in bonds because of the safety. Think of it like Taleb’s “Barbell Strategy.” You have 90% in something very safe and 10% in something very volatile—in our case, 2%.
You’re not using box spreads, right? You’re actually in T-Bills, right?
We have T-Bills but will switch to box spreads because of the tax implications.

How do you monitor the strength of the signals, and do you scale back if that signal weakens?
This is an ongoing process, and there are several things we’re looking at. Regarding the signal strength, we have KPIs. We’re monitoring whether the signal is improving or worsening over the past 4 or 5 weeks. If it falls below our crucial indicator, we say, “Okay, let’s see what the problem is, what’s happening, and how we can fix it?” Signal weakening can be due to several reasons, such as a drop in our survey response rates during slower periods of the year. If we can detect issues, we can prevent them from escalating. We allow ourselves a maximum of one lousy month.
Can you explain your fee structure?
We have a 1.5% management fee and a 25% performance fee subject to an 8% hurdle, accounted for quarterly. We must clear 2% each quarter before applying the 25% performance fee. There’s also a high-water mark in place. Performance fees can only be charged if the fund consistently makes money. So, if the fund makes money in one quarter but loses money in the next, it can only charge a performance fee once it has recovered the losses in the subsequent quarter and exceeded the previous high-water mark; the performance fee can only be applied to any additional profits after surpassing the previous peak value.
Despite being systematic, you’re still executing these by hand, inputting orders, setting limits, and so on, right? How do you manage any biases and emotions and just execute?
I have a psychology coach guiding me through this process, which is necessary. I’ve experienced losses before starting the fund, but managing other people’s money is different—it comes with much higher responsibility. Plus, you must report to these people regularly and inform them about any losses. This was particularly challenging for us in March of 2023 when we had just started the fund and were down 15%. We thought, “What do we do now, and how do we face these people again?” I did a lot of exercises to help myself cope with the situation, and I realized that the solution lies in sticking to the process. The less I meddle, the better our investment returns are; we achieve better outcomes by completely removing our biases and following the process, one of our key performance indicators. Ultimately, I aim to expand the team, hire traders, and stop trading myself. Although I could automate the entire process, it doesn’t always work as intended; sometimes, the machine won’t perform exactly as you want. That’s why I believe human traders still have value. We’re not high-frequency traders, so we don’t need machines to execute nanosecond trades. Instead, we rely on humans following a system to execute the orders.
Do you ever have a signal and you’re putting on a trade but think, “This isn’t going to work,” but you still go through with it because you are following a system?
Yes, but I’ve taught myself not to deviate. Sure, maybe this week I’m going to help it, but the next week I’m probably going to destroy it. Again, it is the whole psychological mindset thing. I still get the urge, but you’re pushing yourself to make this emotionless. It is a process, so it’s going to take a while.
So, the hedge fund feels like your second act to me. Do you have a third in mind, and may that involve you working in the government, especially given the research you’ve done?
I’m so removed from governments that it’s liberating.
The three of us at Oraclum—Vinković, Šikić, and myself—are political junkies. Since starting the fund, I’ve asked myself why I even cared. At this point, it’s tough for me to think about a third act, especially now that we’re in the middle of building this.
It depends on how much money I earn—maybe philanthropy or something else. We’ll see.
Have you done any work for the next set of U.S. elections? If so, can you share any results?
This is the big argument that my two co-founders and I have. One of them is against us doing this because of the focus of the fund, our investors, and everything else. And that makes sense. We won’t do it, even though I see it as a great marketing tool.
If you were to predict the next set of elections, what would you do differently?
I streamline much more toward the key swing states.
Pennsylvania was the key state in the last two U.S. elections, 2020 and 2016. As soon as we saw in our survey that Trump was winning Pennsylvania in 2016, that was it; Trump was taking the election. The same happened in 2020. At no point did Biden ever lose Pennsylvania in our surveys. So that was the turning point for us. Ohio and Florida were going for Trump. Before this election, whoever won Ohio and Florida would become the U.S. president. Not this time because you had Pennsylvania and Michigan going in the other direction. So, if I were doing it this year, I would focus on a handful of swing states. You can follow the surveys for the rest, focusing on Pennsylvania and Michigan. Ohio and Florida will most likely go to Trump. But then, I would also look at Arizona, North Carolina, Georgia, Pennsylvania, Michigan, and Wisconsin.
I recently watched a podcast featuring Citadel’s Ken Griffin. In it, he emphasized the importance of studying your winners rather than getting too hung up on the losers. Does your experience validate this thinking?
That’s a good point. I get more excited about the winners and learn that the losers don’t matter—move on.
There’s this great quote by Roger Federer: “In tennis, perfection is impossible. In the 1526 matches I played, I won almost 80% of them. But I only won 54% of the points in those matches.” For him, it’s not about the points. When they’re gone, they’re gone. You move on to the next one. It’s the same thing here. For every week we lose 2%, we move on. But when we get a big win, we’re delighted. It’s a psychological thing as well. You can get much more if you don’t cut the profits too soon and keep a trailing loss. That’s why we have weeks where we’ve made 5% or 6% in a week, which is good. So there is something to it.
We study the winners because it can all come down to 5 or 6 weeks a year when we make the bulk of the return on the fund. Everything else cancels out; the small winners and losers cancel each other out.

Do you have any mentors or people you look up to?
I love that Market Wizards book by Schwager. Every interview in it is very revealing and comforting. When I was younger, I idolized George Soros. What we do has nothing to do with how Soros trades; he’s a big ideas guy, and I could never compete. It’s the same thing with people like Ray Dalio. It’s a different way of competing.
I want to emulate someone like Paul Tudor Jones.
Do you have a favorite book recommendation?
Nassim Nicholas Taleb opened my eyes to options trading. After I read his third book, Antifragile: Things That Gain from Disorder, I thought, “Options are interesting; let’s see how this works.” I also think psychology books are great. So, Trading in the Zone: Master the Market with Confidence, Discipline, and a Winning Attitude and Schwager’s Market Wizards are fantastic because traders often make the same stupid mistakes; everyone goes through the same process.
Disclaimer
By viewing our content, you agree to be bound by the terms and conditions outlined in this disclaimer. Consume our content only if you agree to the terms and conditions below.
Physik Invest is not registered with the US Securities and Exchange Commission or any other securities regulatory authority. Our content is for informational purposes only and should not be considered investment advice or a recommendation to buy or sell any security or other investment. The information provided is not tailored to your financial situation or investment objectives.
We do not guarantee any information’s accuracy, completeness, or timeliness. Please do not rely solely on our content to make investment decisions or undertake any investment strategy. Trading is risky, and investors can lose all or more than their initial investment. Hypothetical performance results have limitations and may not reflect actual trading results. Other factors related to the markets and specific trading programs can adversely affect actual trading results. We recommend seeking independent financial advice from a licensed professional before making investment decisions.
We don’t make any claims, representations, or warranties about the accuracy, completeness, timeliness, or reliability of any information we provide. We are not liable for any loss or damage caused by reliance on any information we provide. We are not liable for direct, indirect, incidental, consequential, or damages from the information provided. We do not have a professional relationship with you and are not your financial advisor. We do not provide personalized investment advice.
Our content is provided without warranties, is the property of our company, and is protected by copyright and other intellectual property laws. You may not be able to reproduce, distribute, or use any content provided through our services without our prior written consent. Please email renato@physikinvest for consent.
We reserve the right to modify these terms and conditions at any time. Following any such modification, your continued consumption of our content means you accept the modified terms. This disclaimer is governed by the laws of the jurisdiction in which our company is located.